Dune Management Strategy for Alva Beach, Wunjunga and Beachmount Reserve - Burdekin Shire Council
←
→
Page content transcription
If your browser does not render page correctly, please read the page content below
Dune Management Strategy
for Alva Beach, Wunjunga
and Beachmount Reserve

Draft for Public Comment

03 Sept 2020
JBP Project Manager
Daniel Rodger
Jeremy Benn Pacific
Suite T46, 477 Boundary Street
Spring Hill QLD 4000
Australia

Revision History
 Revision Ref / Date Issued Amendments Issued to
 Draft Dune Appraisal LG, DM
 v1.0 / 21 Apr 2020
 Draft Management Options LG, DM, OP
 V 1.1 / 26 June 2020
 Draft For Public Comment LG, DM, OP
 V 1.2 / 03 Sept 2020

Contract
This report describes work commissioned through Vendor Panel on 09 March 2020, under contract
QBSC/20/003. Burdekin Shire Council’s representative for the contract Linda Goven. Clare Yang
and Daniel Rodger of JBPacific carried out this work.

Prepared by ................................................ Daniel Rodger BSc MEng CEng CMarEng MIEAust

Prepared by ................................................ Clare Yang MEng
 Coastal and Civil Engineer

Purpose
This document has been prepared as a Draft Report for Burdekin Shire Council. JBP accepts no
responsibility or liability for any use that is made of this document other than by the Client for the
purposes for which it was originally commissioned and prepared.
JBP has no liability regarding the use of this report except to Burdekin Shire Council.

 2020s0406 - BSC - Burdekin Dune Management Strategy_Management Options 1.2.docx i
Acknowledgements
JBP would like to acknowledge the previous work undertaken within the Draft Beachmount Coastal
Land Management Plan by NQ Dry Tropics, and the Coastal Hazard Adaptation Strategy by
Alluvium Consulting, which has provided a scientific and planning base for this project.

Copyright
© JBA Pacific Scientists and Engineers Pty Ltd 2020
Trading as Jeremy Benn Pacific and JBP Scientists and Engineers
ABN: 56 610 411 508
ACN: 610 411 508

 2020s0406 - BSC - Burdekin Dune Management Strategy_Management Options 1.2.docx ii
Contents
1 Introduction........................................................................................................ 1
2 Background to coastal values and processes ..................................................... 2
2.1 Values for traditional owners, residents and visitors ........................................................ 2
2.2 Alva .............................................................................................................................. 2
2.3 Wunjunga...................................................................................................................... 5
2.4 Other available reports and data for the Burdekin coastline ............................................. 11
3 Appraisal of dune system ................................................................................... 14
3.1 Drivers of coastal processes and erosion........................................................................ 14
3.2 Appraisal of the dune system ......................................................................................... 15
3.3 Location of infrastructure within the erosion zone ............................................................ 17
3.4 Dune crest in relation to storm tide levels........................................................................ 18
3.5 Dune disturbance, barren dunes or blowouts .................................................................. 18
3.6 Track density ................................................................................................................. 19
3.7 Assessment and prioritisation......................................................................................... 21
4 Dune management actions ................................................................................ 24
4.1 Management actions ..................................................................................................... 24
4.2 M1 - Enhanced partnerships .......................................................................................... 25
4.3 M2 - Revegetation of erosion zones ............................................................................... 26
4.4 M3 - Dune protection measures ..................................................................................... 30
4.5 M4 - Beach accessways ................................................................................................ 33
4.6 M5 - Beach traffic zone .................................................................................................. 33
5 Dune Management Strategy - Alva Beach .......................................................... 34
5.1 Summary of revegetation and protection zones .............................................................. 34
6 Dune Management Strategy - Beachmount Reserve .......................................... 37
6.1 Summary of revegetation and protection zones .............................................................. 37
Appendices .................................................................................................................... 40
A Appendix A - Beach appraisal ............................................................................ 40
B Appendix B - Fence technical drawings .............................................................. 48

 2020s0406 - BSC - Burdekin Dune Management Strategy_Management Options 1.2.docx iii
List of Figures
Figure 1-1: Alva, Wunjunga and the Beachmount Reserve. ......................................... 1
Figure 2-1: Alva map and local features ........................................................................ 3
Figure 2-2: Alva Beach lookout looking towards spit over dunes (left) and inner lagoon
 (right) ............................................................................................................ 3
Figure 2-3: Alva northern access track (between the two beach access points)............. 4
Figure 2-4: Alva Beach looking south (left) and north (right) .......................................... 4
Figure 2-5: Wunjunga map and local features ............................................................... 5
Figure 2-6: Beachfront houses at Wunjunga ................................................................. 5
Figure 2-7: The coastline looking south from Wunjunga ................................................ 6
Figure 2-8: The coastline of the Beachmount reserve near the Funny Dunny camping
 ground looking south (left) and north (right) .................................................... 6
Figure 2-9: Reduction in dune heights adjacent to informal camp sites (image from the
 Beachmount Coastal Land Management Plan) .............................................. 7
Figure 2-10: The evolution of Charlies Creek (source: Beachmount CMP) .................... 7
Figure 2-11: Analysis of historic images from the Beachmount CMP ............................. 8
Figure 2-12: Ebb shoals and channel formations between 1959, 1969 and present day 9
Figure 2-13: 4WD vehicles parked along Alva Beach .................................................... 10
Figure 2-14: Map from BSC beach vehicles guide......................................................... 11
Figure 2-15: Shoreline Analysis completed within the Burdekin CHAS .......................... 13
Figure 3-1: Drivers of coastal risk ................................................................................. 14
Figure 3-2: Conceptual diagram of different sediment transport mechanisms ................ 14
Figure 3-3: Conceptual diagram of blowout evolution (top) and example of blowout at Alva
 Beach (bottom). ............................................................................................. 15
Figure 3-4: Coastal segments ....................................................................................... 16
Figure 3-5: Infrastructure measured behind the dune .................................................... 17
Figure 3-6: Schematic of JEPA short-term erosion modelling using Vellinga (1982). ...... 17
Figure 3-7: Example dune disturbance mapping ............................................................ 19
Figure 3-8: Dune disturbances along Alva Beach........................................................... 19
Figure 3-9: Example track measurements...................................................................... 20
Figure 3-10: Alva hazard review .................................................................................... 22
Figure 3-11: Wunjunga and Beachmount Reserve hazard review ................................. 23
Figure 4-1: Lower Burdekin Land Care Association nursery and working bees ............... 25
Figure 4-2: Dune profile and preferred species (Beachmount CMP) ............................... 27
Figure 4-3: Sand fences in use at Wooli, NSW............................................................... 28
Figure 4-4: Sand fences in use at Kurnell, positioned within a blowout ........................... 28
Figure 4-5: Sequence for progressive installation of dune-forming fences (DLWC 2001) 29
Figure 5-1: Phase 1 revegetation works at Alva Zone 8-9 .............................................. 34
Figure 5-2: Overview of Alva Dune Management Strategy ............................................. 36
Figure 6-1: Phase 1 revegetation works at Beachmount Zone 19 and Zone 20-22 ......... 37
Figure 6-2: Overview of Beachmouth Dune Management Strategy ................................ 39

 2020s0406 - BSC - Burdekin Dune Management Strategy_Management Options 1.2.docx iv
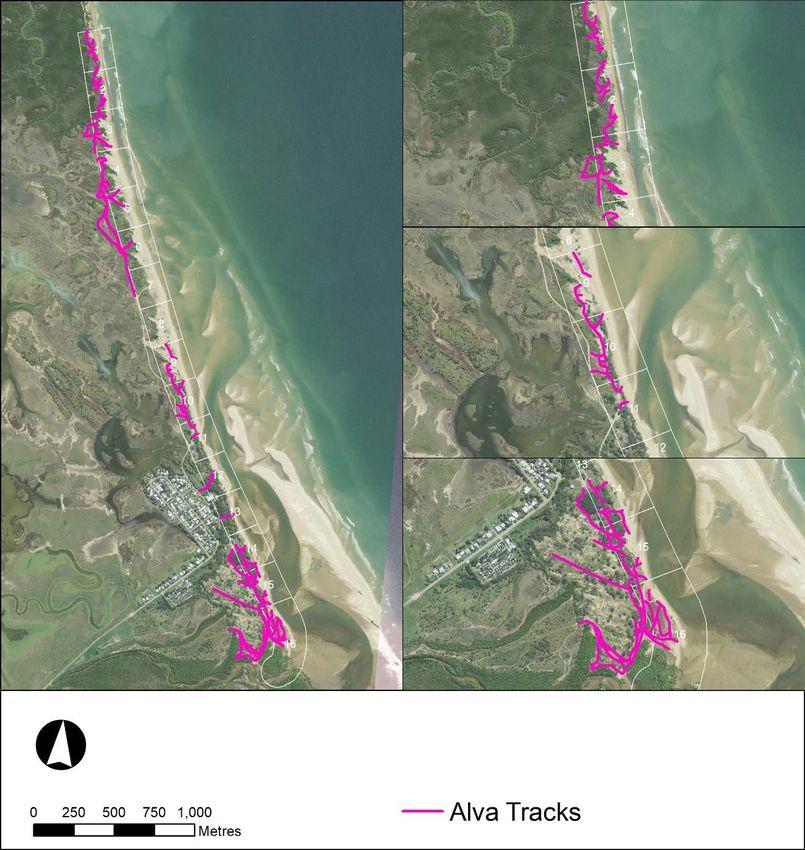
Figure 6-3: Alva Beach 10% AEP short term erosion map.............................................. 40
Figure 6-4: Alva crest level in relation to storm tide ........................................................ 41
Figure 6-5: Alva mapped dune disturbance .................................................................... 42
Figure 6-6: Alva mapped tracks through dunes .............................................................. 43
Figure 6-7: Wunjunga and Beachmount Reserve 10% AEP short term erosion map ..... 44
Figure 6-8: Wunjunga and Beachmount Reserve crest level in relation to storm tide ..... 45
Figure 6-9: Wunjunga and Beachmount Reserve mapped dune disturbance ................. 46
Figure 6-10: Wunjunga and Beachmount Reserve mapped tracks through dunes ......... 47

List of Tables
Table 2-1: Tide levels from QLD Tide Tables ................................................................ 11
Table 2-2: Tide and storm tide levels for Alva Beach and Wunjunga ............................. 12
Table 2-3: Extreme wave conditions for Alva Beach and Wunjunga .............................. 12
Table 3-1: Scoring metric for infrastructure and erosion ................................................ 18
Table 3-2: Scoring metric for dune crest lowering ......................................................... 18
Table 3-3: Scoring metric for barren dunes or blowouts ................................................ 19
Table 3-4: Scoring metric for track density .................................................................... 20
Table 3-5: Scoring metric for each coastal segment ...................................................... 21
Table 4-1: Types of fencing .......................................................................................... 30

Abbreviations
4WD............................... Four Wheel Drive
AEP ............................... Average Exceedance Probability
AHD ............................... Australian Height Datum
BRC ............................... Burdekin Shire Council
CHAS............................. Coastal Hazard Adaptation Strategy
DSAS ............................. Digital Shoreline Analysis System
JBP ................................ Jeremy Benn Pacific (JBPacific)
JEPA.............................. JBP Erosion Prone Area tool
LAT ................................ Lowest Astronomical Tide
LGA ............................... Local Government Area
LGAQ............................. Local Government Association of Queensland
MHWN ........................... Mean High Water Neap
MHWS ........................... Mean High Water Spring
MLWN............................ Mean Low Water Neap
MLWS ............................ Mean Low Water Spring
MSL ............................... Mean Sea Level
NQDT ............................ NQ Dry Tropics
TC.................................. Tropical Cyclone

 2020s0406 - BSC - Burdekin Dune Management Strategy_Management Options 1.2.docx v
1 Introduction
 This report has been prepared by JBPacific (JBP) on behalf of Burdekin Shire Council (BSC) to
 develop a Dune Management Strategy for Alva beach, Wunjunga and the Beachmount Reserve.
 These locations are shown in Figure 1-1.
 The Burdekin coastline is dynamic, fed by the extensive sand supplies within the Burdekin River.
 The coastline has diverse community values and high expectations regarding recreational use of
 the beach, which present a range of challenges in coastal management. Collectively the Alva and
 Beachmount Reserve cover 10km of coastline, and are examples of un-urbanised, largely natural
 dune systems. They provide an ecological habitat for flora and fauna, an open-coast recreational
 area, and a buffer to coastal erosion and storm tide inundation. However, they are under increasing
 pressure due to complex coastal processes, ongoing human interaction, and a changing climate.
 These processes are causing localised erosion issues and are limiting natural dune recovery, which
 have the potential to threaten the ecological and community values of the coastline.
 This Dune Management Strategy builds on the recent Coastal Hazard Adaptation Strategy (CHAS)
 developed for Burdekin Shire Council, which aims to support the long-term management of the
 coastline. The Dune Management Strategy provides additional local context, new high-detail
 modelling, and builds on the range of dune protection works undertaken in the past. It aims to
 increase stakeholder coordination through the development of a strategic plan for ongoing dune
 management and increase community stewardship through organisations such as the NQ Dry
 Tropics (NQDT), the Lower Burdekin Landcare groups, and the residents themselves.
 This report contains the following sections:
 • Section 2: Background to the Burdekin coastline and townships
 • Section 3: Appraisal of the existing dune system
 • Section 4: Dune protection measures
 • Section 5: Dune Management Strategy

 Figure 1-1: Alva, Wunjunga and the Beachmount Reserve.

 2020s0406 - BSC - Burdekin Dune Management Strategy_Management Options 1.2.docx 1
2 Background to coastal values and processes
 The Burdekin coastal system is renowned for its natural beauty and coastal processes. It is an area
 highly valued by traditional owners, residents, and visitors alike, and has been the subject of several
 relevant studies. This chapter reviews available information on the following:
 • The values for traditional owners, residents and visitors
 • The township of Alva Beach
 • The township of Wunjunga and the Beachmount Reserve
 • Available scientific reports and data for the Burdekin coastline.

2.1 Values for traditional owners, residents and visitors
 The Burdekin coast has been the traditional home of the Bindal and Juru peoples for thousands of
 years. Traditional owners have a deep connection with country and continue to have a shared living
 culture with their environment. The Gudjuda Reference Group Aboriginal Corporation represents
 the cultural heritage of the traditional owners of the land. In addition, indigenous land and sea
 rangers are employed through Gudjuda who has undertook a range of coastal management
 activities including pest and weed management, biodiversity surveys, turtle monitoring and
 protection, seagrass monitoring and maintenance of cultural heritage sites.
 Today the Burdekin residents also include families from some of the earliest pioneers of the
 sugarcane industry. The importance of water to the community is experienced through events such
 as the Burdekin Water Festival; held annually since 1957 annually to celebrate Burdekin’s lifestyle,
 economy and culture in relation to water. The coastline has been the focus of a large-scale Coastal
 Hazard Adaptation Strategy (CHAS) which conducted an online “Experience and values” survey to
 gather a community perspectives on the values of the region. Almost 150 responses were received,
 which provided the following information1:
 • Most residents visit the coast on a monthly to occasional basis. Alva Beach is the most
 popular beach to visit, followed by locations including Wunjunga and Groper Creek.
 • Recreational use of the coastline is an important feature of respondents, with 40% rating it
 as their most valued aspect of the coast. Having direct access to beaches is highly valued
 for supporting the 'beach lifestyle'.
 • Burdekin’s natural ecosystems, wildlife and conservation and the unique landscape were
 recognised as being significant by 85% of respondents.
 • The environment is considered the most important value within ~25% of surveys, with
 natural ecosystems, wildlife and conservation ranked highest (15%), and the regions unique
 landscape features and natural beauty ranked highest by 10% of respondents.
 • A large proportion (over 70%) of the community believe that the Burdekin coastline will be
 impacted by coastal erosion or coastal flooding in the future. Approximately 25% of
 residents had been impacted by coastal erosion or coastal flooding on several occasions,
 while another 24% had experienced an event once or twice.
 The Burdekin coastline provides important recreational opportunities that draw visitors to the region,
 with beach infrastructure and access points believed to be an important feature to meet the values
 of the local community and its visitors. Visitors have been travelling to the region since the early
 1950s, using the beaches for recreation purposes such as fishing, beach driving and camping.
 These visitors currently contribute approximately $44 million annually to the local economy.
 Commercial and tourism operators hold assets that may be impacted by coastal hazards, hence,
 will benefit from an ongoing dune management.

2.2 Alva
 Alva is the main coastal township of the Burdekin coastline. Whilst one of the most visited beaches,
 the local township only has a population of under 300 people, however includes the Alva Beach
 Tourist Park and the Surf Life Saving Club. The township has been constructed along a sandy
 frontal ridge system, and currently has a degree of protection from a large sandy spit that has
 continued to build and extend to the north. Plantation Creek runs north between the beach and the

1 Alluvium (2020) Burdekin Shire Council Coastal Hazard Adaptation Strategy Phase 3 Summary Report

 2020s0406 - BSC - Burdekin Dune Management Strategy_Management Options 1.2.docx 2
sandy spit and creates a lagoon, which limits beach width at high tides. To the north the coastline
continues around 20 km to Cape Bowling Green, which is highly used by 4WDs driving along the
beach.

Figure 2-1: Alva map and local features

 Photograph taken 04 June 2018 02:38 Photograph taken 04 June 2018 02:49
 Photograph location: -19.456284, 147.483383 Photograph location: -19.4536, 147.482483

Figure 2-2: Alva Beach lookout looking towards spit over dunes (left) and inner lagoon (right)
Alva Beach allows recreational vehicle use. There are two formal beach access points to the beach,
the first located immediately north of the town at the end of Causeway Street. A northern access
track then continues 1km between the dunes and the Alva wetlands to a second beach access.
The northern access track is shown in Figure 2-3, with the northern beach access point shown in
Figure 2-4. A number of vehicle tracks and erosion blowouts can be observed along the dune
system and the rear wetland, which is impacting vegetation establishment and dune recovery.

 2020s0406 - BSC - Burdekin Dune Management Strategy_Management Options 1.2.docx 3
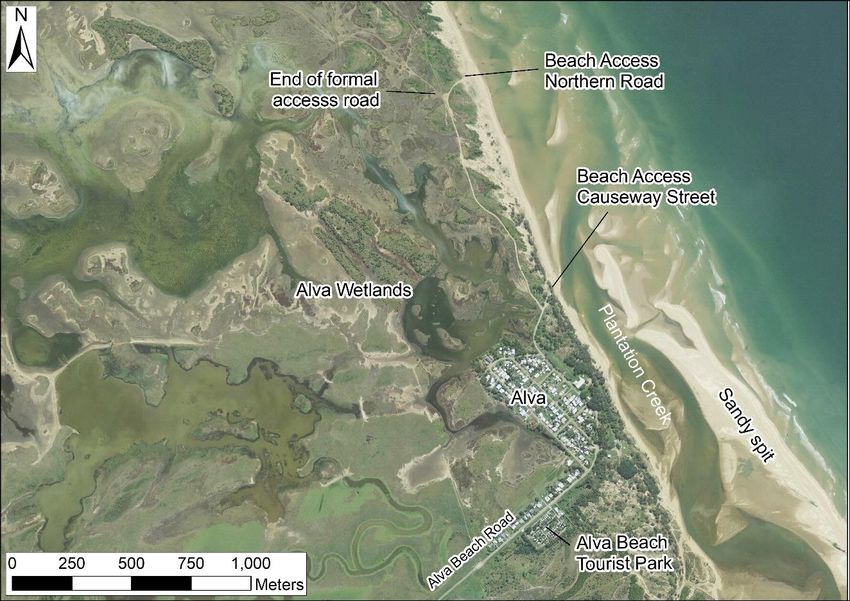
Figure 2-3: Alva northern access track (between the two beach access points)

 JBP Photograph taken 04 June 2018 JBP Photograph taken 04 June 2018 03:10
 Photograph location: -19.442211 , 147.477371) Photograph location: -19.442177 , 147.477402

 Figure 2-4: Alva Beach looking south (left) and north (right)

2.2.1 Coastal processes along Alva Beach
 The foreshore of Alva beach is constantly changing due to the northerly longshore drift and sediment
 supplied by the Burdekin River estuary. Over time a sandy spit has continued to build and extend
 north adjacent to Plantation Creek, current extending 2-3km before the creek breaks out into the
 ocean. The beach foreshore has been growing seawards in recent decades, with a historical rock
 seawall built to protect against coastal erosion now buried under the backshore dunes.
 Although Alva is vulnerable to coastal hazards, the sandy spit offers a large amount of protection to
 the township against erosion. The coastline to the north is considered more vulnerable, being
 exposed to storm tides and waves, and subsequently has a greater potential dune breaching during
 a significant event. An assessment of long-term shoreline change has been undertaken within the
 CHAS, which shows the coastline at Alva to be is relatively stable, but locations north of the spit
 have experienced up to -50m of landward movement over the last 50 years (see Section 2.4.2).

 2020s0406 - BSC - Burdekin Dune Management Strategy_Management Options 1.2.docx 4
2.3 Wunjunga
 The Wunjunga settlement is situated towards the southern end of the Burdekin Shire coastline, on
 the southern slopes of Big Hill / Beach Mountain. The properties are a combination of permanent,
 holiday and weekend homes, with several beach huts holding an annual permit to occupy status.
 Access to the township is through Beachmount Road. Constructed in 1951, this road spans 10km
 through low-lying saltmarsh to the coastline, and then continues north to Wunjunga, running
 between 30m to 350m behind the dune system.

 Figure 2-5: Wunjunga map and local features

 JBP Photograph taken 05 June 2018 03:29 Photograph taken 05 June 2018 03:31
 Photograph location: -19.731138, 147.592773 Photograph location: -19.731846, 147.593414

 Figure 2-6: Beachfront houses at Wunjunga

 2020s0406 - BSC - Burdekin Dune Management Strategy_Management Options 1.2.docx 5
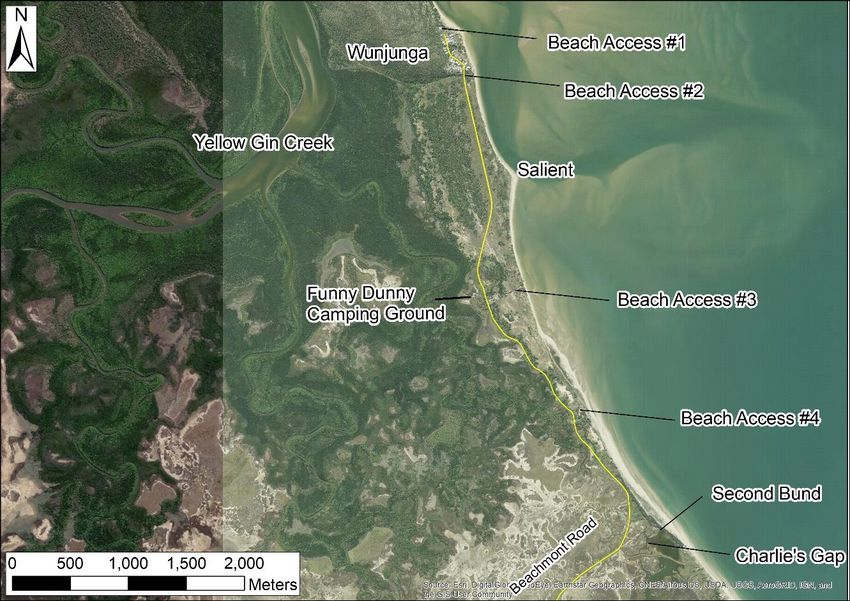
The Wunjunga township is located adjacent to lands referred to as the Beachmount reserve. The
 reserve begins near the mouth of Yellow Gin and Groper creeks to the north and extends south
 approximately 7km. The reserve includes a large grazing leasehold block to the west of the
 foreshore, a quarry reserve covering 5.5ha located in the middle of the recreation reserve, and
 partially houses a small camping area called Funny Dunny Park. Along the reserve several areas
 are used as informal camping sites, which has led to damage to the dunes and crest lowering (see
 Figure 2-9). Beachmount Road extends through the Beachmount Reserve and provides four formal
 beach access points.

 Figure 2-7: The coastline looking south from Wunjunga2

 JBP Photograph taken 05 June 2018 03:54 JBP Photograph taken 05 June 2018 03:54
 Photograph location: -19.7514, 147.598587 Photograph location: -19.751366, 147.598602

 Figure 2-8: The coastline of the Beachmount reserve near the Funny Dunny camping ground
 looking south (left) and north (right)

2 You tube (2020) " Home Hill Beach (Wunjunga, Queensland, Australia) Drone Video", accessed on 09 April 2020 from:
https://www.youtube.com/watch?v=hS6VQdlCMuU

 2020s0406 - BSC - Burdekin Dune Management Strategy_Management Options 1.2.docx 6
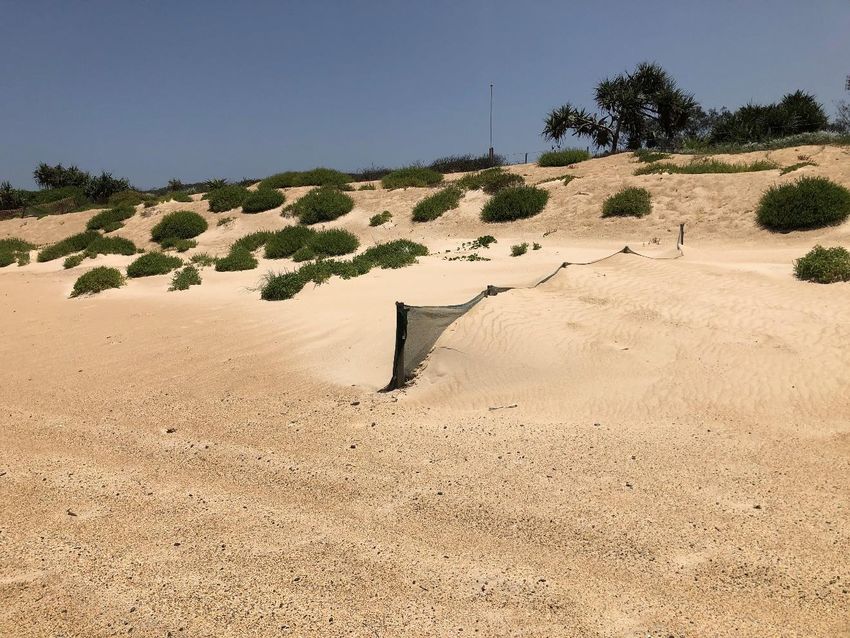
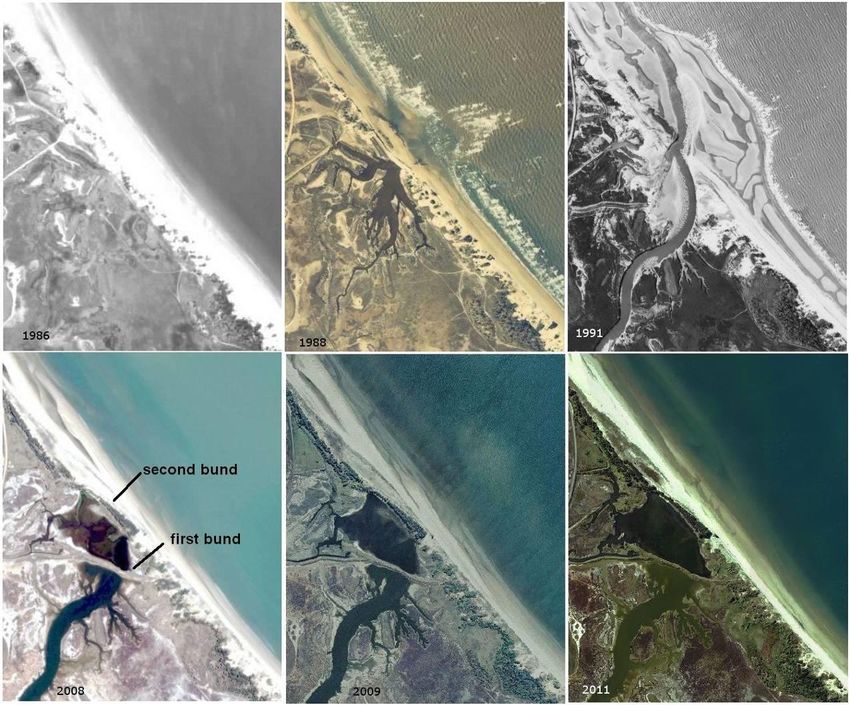
Figure 2-9: Reduction in dune heights adjacent to informal camp sites (image from the Beachmount
 Coastal Land Management Plan)

2.3.1 Coastal processes along the Beachmount reserve
 Two significant coastal processes have been observed along Beachmount Reserve, relating to the
 blowout of Charlie's Creek and the growth of a coastal salient.
 Towards the south of Beachmount Reserve, Charlies Creek is an area of significant coastal change.
 Prior to 1986 the area consisted of a very narrow dune and sparse vegetation, with a small creek
 draining into the ocean. These dunes were breached, vegetation lost, and the creek scoured during
 Tropical Cyclone (TC) Charlie, which made landfall to the north of Upstart Bay on 1 March 1988.
 Over time the channel widened to allow tidal flow behind the sand dunes, forming a coastal lagoon.
 The potential for this to extend further and erode Beachmount Road was a growing concern in the
 1990's, and as a result tidal works were undertaken to construct a bund across the creek and
 reconstruct the eroded dune. Works included the used of debris placed along the dune area which
 has been trapping sand, facilitating vegetation colonisation, and has led to ongoing dune growth.
 The location is currently referred as Charlie's Gap.

 Figure 2-10: The evolution of Charlies Creek (source: Beachmount CMP)

 2020s0406 - BSC - Burdekin Dune Management Strategy_Management Options 1.2.docx 7
Analysis of aerial images was undertaken within the Burdekin CHAS (see Section 2.4.2) and the
Beachmount Coastal Land Management Plan (see Section 2.4.3). Within these studies, aerial
images ranging from 1945 to present were obtained, geo-referenced and analysed. The photos
show that above sea level, there has been a change from an initial long, relatively straight coastline,
to one that includes a coastal feature known as a salient. This emerged in the mid 1980's and forms
a bulge or ‘point’ along the coastline.

Figure 2-11: Analysis of historic images from the Beachmount CMP

The following mechanisms are proposed for the emergence of this salient, which is shown based
on three historic aerial images between 1959, 1969 and present day (see Figure 2-12).
 • 1959: Images in 1959 show the lower delta of Yellow Gin Creek, which discharges through
 a primary channel in a south-easterly direction which opens into a fan shape. A relatively
 straight secondary channel runs south-southeast along the coastline which creates the first
 salient shape as a subtidal morphologic feature. At this location, the southward migrating
 channel meets northward longshore sediment transport, and allows sand to accumulate.
 Location “1” shows another small secondary channel discharging east from Yellow Gin
 Creek before being diverted north by the extensive ebb-tide shoals. These extensive shoals
 are a feature of the flood-dominated Burdekin River tributaries. Flood events allow the rapid
 deposition of sediment throughout the estuary mouth, which is then reshaped over tens of
 years as mobile sandbars.
 • 1969: The 1969 image shows the main Yellow Gin Creek channel continues to discharge
 in a south-easterly direction. The secondary channel discharging south-southeast along
 the ‘subtidal’ salient is no longer present, and the underwater salient has become disturbed.
 The secondary channel discharging easterly has now been diverted to flow in a southerly
 direction by a pronounced sand shoal system. This flow is now being directed at Location
 “2” and is likely to be the reason for the destabilisation of the subtidal salient.

 2020s0406 - BSC - Burdekin Dune Management Strategy_Management Options 1.2.docx 8
• Present day: Over the course of 50-years the secondary channel becomes the dominant
 flowpath for Yellow Gin Creek. It continues its sweeping shape, which erodes the coastline
 at Location “2” before the channel is re-directed into a seaward direction. This sweeping
 “S” shape causes several morphologic changes.
 o The northern edge of the subtidal salient is eroded, which will have mobilised sand
 as a deep channel is scoured from the bed.
 o This mobilised sediment is deposited along the residual subsurface-salient. It
 becomes stabilised in a more southern location, and its elevation increases to
 become subaerial.
 o Once the salient becomes emergent is was stabilised by vegetation, allowing it to
 grow further seawards to become a dominant feature of the coastline
 • Future evolution: Predicting future coastal geomorphology is challenging. Whilst erosion
 rates at Location “2” (between the salient and Wunjunga) are not expected to match the
 significant historic shoreline change, further evolution of the ebb-tide channel is expected
 to occur. If the estuary follows a typical flood-dominated evolution, there is the potential for
 a new channel to break through the sweeping S shape, likely at Location “3” or “4”, which
 may result in accretion of the beach at "Location 2". However, the timeframe for this
 process is unknown and will depend on local conditions. Until that time the observed
 erosion/recession at Location “2” is expected to continue to some degree, causing a
 continued southerly migration of the salient.

Figure 2-12: Ebb shoals and channel formations between 1959, 1969 and present day

 2020s0406 - BSC - Burdekin Dune Management Strategy_Management Options 1.2.docx 9
2.3.2 Recreational beach access
 Alva beach and the Wunjunga coastline are areas allowing recreational vehicle access along the
 beach. Alva Beach has a history of vehicles accessing areas above the high tide mark, illegally
 driving over the dunes and rear salt flats. Amongst these vehicles are Quad Bike riders, who have
 been observed damaging, removing, or lifting fences to get bike access to the wetlands and dunes. 3
 Along Beachmount h Reserve, the dunes to the south of Charlie's gap are known to be heavily used
 by 4WD's, in addition to illegal camping.
 There are no readily accessible, published QLD guidelines on the requirements for beach driving.
 However, under Queensland government legislation, driving on the beach should remain seaward
 of the high-water mark, which is the limit of state land. Above the highwater mark the land is owned
 by whoever holds the title of the land and is subject to their right of trespass.

 Figure 2-13: 4WD vehicles parked along Alva Beach4
 Almost all dunes are sensitive to human disturbance and have almost zero tolerance to vehicles.
 Some general information is provided on the Queensland Government Parks and Forests webpage
 relating to driving on sand5.

 Most beaches in Queensland are backed by vegetated sand dunes. These dunes are
 very effective coastal protection features. They absorb the erosive energy of waves
 generated by cyclones and storms and are reservoirs of sand to nourish the beach during
 periods of wave erosion. Vegetation on the dunes traps and holds sand blown from the
 beach aiding dune build-up and stopping sand from being blown inland and lost from the
 active beach and dune system.
 Dunes with their covering of grasses and other plants are so fragile that even footsteps
 can damage or kill the plants and weaken the dunes. Driving vehicles on dunes has a
 worse effect and greatly increases the chance of dune destruction. Vehicle tires destroy
 dune vegetation exposing the sand to wind erosion which lowers the dunes and reduces
 their effectiveness as coastal protection features. Beach erosion increases because of
 the lower volume of sand in the dune directly behind the beach.

3 North Queensland Register (2015) "Quad riders warned off Alva", Accessed on 09 April 2020 from:
https://www.northqueenslandregister.com.au/story/3365604/quad-riders-warned-off-alva/
4 Source Youtube (2020) "ALVA BEACH, The Great Escapes". Accessed on 02 April 2020 from:
https://www.youtube.com/watch?v=jOWdaVuhiHQ
5 Queensland Government (2020) "Four-wheel driving; Driving on sand", Parks and Forests, Department of Environment and Science.
Accessed on 09 April 2020 from:
https://parks.des.qld.gov.au/experiences/fourwheeldriving/driving_at_the_coast.html

 2020s0406 - BSC - Burdekin Dune Management Strategy_Management Options 1.2.docx 10
The BSC has previously developed a hardcopy brochure
 describing requirements for vehicles when driving on beaches.
 It was developed in partnership with the Coastal Vehicle
 Management Steering Committee, an initiative of NQDT, and
 funded by the Australian Governments Caring for our Country
 Program. Initiatives like this brochure are important to provide
 information directly to vehicle users. Key information has
 previously included:
 • Legal requirements when driving on the coast. This
 includes requirements to only use vehicle access
 points, to not drive on privately owned land, and only
 drive on Council land where designated.
 • A vehicle beach access map, showing three access
 points at Alva, and four along Beachmount Reserve
 (see right)
 • Tips to protect native animals and their habitats. This
 listed requirements to keep off sand pans, fragile sand
 dunes, and to drive between the high and low water
 marks to prevent erosion, damage to the dune
 vegetation and to minimise disturbance to the local
 ecology.
 • Safety tips, describing safe distances, coastal
 hazards, 4WD driving etc.
 • Requests to report unlawful driving, with a contact list
 to report:
 i. Unauthorised vehicles driving above the
 high tide
 ii. Damage to Council property
 iii. Damage to marine plants
 iv. Disturbances to native animals.
 Figure 2-14: Map from BSC beach vehicles guide6

2.4 Other available reports and data for the Burdekin coastline

2.4.1 Tide conditions
 Tidal planes are published in the 2019 Queensland Tide Tables7 at Cape Ferguson, located to the
 north of the LGA. These are presented in Table 2-1.
 Table 2-1: Tide levels from QLD Tide Tables
 Tidal Planes at Cape Ferguson

 Tide level 2019 (mLAT) 2019 (mAHD)

 Highest Astronomical Tide (HAT) 3.8 2.2

 Mean High Water Spring (MHWS) 2.9 1.2

 Mean High Water Neap (MHWN) 2.1 0.4

 Mean Sea Level (MSL) 1.8 0.1

 Datum - Metres Australian Height Datum (mAHD) 1.7 0.0

 Mean Low Water Neap (MLWN) 1.5 -0.2

 Mean Low Water Spring (MLWS) 0.7 -1.0

 Lowest Astronomical Tide (LAT) 0.0 -1.7

6 BSC (date unknown) "Vehicles on our beaches", brochure. Developed by Burdekin Shire Council circa 2010.
7 Maritime Safety Queensland 2019, Queensland Tide Tables. Published at:
https://www.msq.qld.gov.au/-/media/MSQInternet/MSQFiles/Home/Tides/Online-tide-tables/2019/2019queenslandtidetables.pdf?

 2020s0406 - BSC - Burdekin Dune Management Strategy_Management Options 1.2.docx 11
2.4.2 Coastal Hazard Adaptation Strategy
 This BSC Coastal Hazard Adaptation Strategy (CHAS) has been developed with the support of the
 Queensland Government and Local Government Association of Queensland (LGAQ), as part of the
 state-wide QCoast2100 program. The CHAS has eight key phases, encompassing a series of
 studies that seek to:
 • Identify coastal hazard areas (areas prone to coastal erosion and storm tide inundation)
 • Understand vulnerabilities and risks to a range of assets (built and natural assets)
 • Engage with the community to understand preferred approaches to adaptation
 • Determine the costs, priorities and timeframes for implementation of actions.
 A range of extreme wave and storm tide information is available within the Phase 3 Hazard
 Assessment, which produced new coastal inundation mapping throughout the LGA under a range
 of likelihood and planning horizons. Highest Astronomic Tide and storm tide levels are shown in
 Table 2-1 for both communities.
 Table 2-2: Tide and storm tide levels for Alva Beach and Wunjunga
 Alva Beach Wunjunga
 (m AHD) (m AHD)
 Present day HAT 2.1 2.1
 Present day storm tide, 10% AEP 2.2 - 3.4 2.2 - 3.4
 (excluding/including wave runup)
 Present day storm tide, 1% AEP 2.3 - 4.1 2.3 - 4.2
 (excluding/including wave runup)
 Present day storm tide, 0.2% AEP 2.6 - 5.0 2.6 - 5.0
 (excluding/including wave runup)

 The study undertook extreme wave modelling, with conditions shown in Table 2-2. This was used
 within a relatively high-level coastal erosion modelling with both Alva Beach and Wunjunga
 represented by a single cross section only. These models have now been enhanced within this
 DMS to provide additional detail along the coastline.

 Table 2-3: Extreme wave conditions for Alva Beach and Wunjunga
 Alva Beach Wunjunga
 Hs (m), T (s) Hs (m), T (s)
 Present day, 10% AEP wave conditions 2.05m, 7.37s 2.07m, 7.37s
 Present day, 1% AEP wave conditions 2.85m, 9.46s 2.30m, 10.71s
 Present day 0.2% AEP wave conditions 3.00m, 12.14s 2.88m, 12.14s
 Present day, 10% AEP general erosion width 20.2m 16.5m
 Present day, 1% AEP general erosion width 26.6m 19.5m
 Present day 0.2% AEP general erosion width 32.9m 29.3m

 As part of the CHAS, the rate of long-term recession was estimated using the Digital Shoreline
 Analysis System (DSAS) since the 1950's. This historical change is shown in Figure 2-15 for Alva
 and Wunjunga. Both coastlines are highly variable, each showing recession rates of up to -50m (a
 landward movement) and accretion rates of up to +50m (a seaward movement).

 2020s0406 - BSC - Burdekin Dune Management Strategy_Management Options 1.2.docx 12
Figure 2-15: Shoreline Analysis completed within the Burdekin CHAS8

2.4.3 Beachmount Coastal Land Management Plan (NQDT)
 This Plan was prepared by the NQDT to define the values of the Beachmount Reserve, identify the
 impacts to the defined values, and consider management strategies to mitigate the impacts.
 A range of data has been produced within the Plan, with the following elements reused within this
 Dune Management Strategy:
 • The location of four beach assess points
 • The location of two informal camp areas which are disrupting the dunes
 • The location of existing fencing on the Wunjunga foreshore
 • The boundaries of the eight weed management areas
 • The ideal plant species for Burdekin region and planting specifications
 • Locations of photo monitoring points used by the NQDT.

8 Alluvium (2020) Burdekin Shire Council Coastal Hazard Adaptation Strategy Phase 3 Report

 2020s0406 - BSC - Burdekin Dune Management Strategy_Management Options 1.2.docx 13
3 Appraisal of dune system
3.1 Drivers of coastal processes and erosion
 The range of studies described in Section 2 describe an area affected by ongoing coastal processes
 and morphologic change. Before considering the management of the dunes in great detail, it is
 important to first consider the underlying coastal processes affecting the site.
 Coastal and estuarine environments experience a range of hydrodynamic, sediment transport and
 morphologic processes that are linked through dependant and independent variables. This includes
 the underlying astronomical tide, local storms, the local wave climate, stormwater inflows, the
 sediment type (e.g. cohesive silts vs non-cohesive sands), sediment properties, and any regional
 sediment sources and sinks.

 Figure 3-1: Drivers of coastal risk
 Due to the complexity of these factors, there are several ways sediment can be mobilised, eroded,
 transported and deposited. As shown in Figure 3-2, sediment movement can itself be divided into
 several processes, including:
 • Longshore sediment transport, which is the transport of sediment parallel to the coastline
 due to the arrival of waves at an oblique angle. This can be separated into two mechanisms:
 sand moving in the swash zone (along the beach face) and further seaward in the surf zone.
 • Cross shore sediment transport, which is the on- and offshore movement of sediment
 between the nearshore zone and the dune system.
 • Suspended and bedload sediment transport, which is typically the through transport of
 sediment under tidally driven currents, that can flow along a shoreline and within estuaries,
 or flows.

 Figure 3-2: Conceptual diagram of different sediment transport mechanisms

 2020s0406 - BSC - Burdekin Dune Management Strategy_Management Options 1.2.docx 14
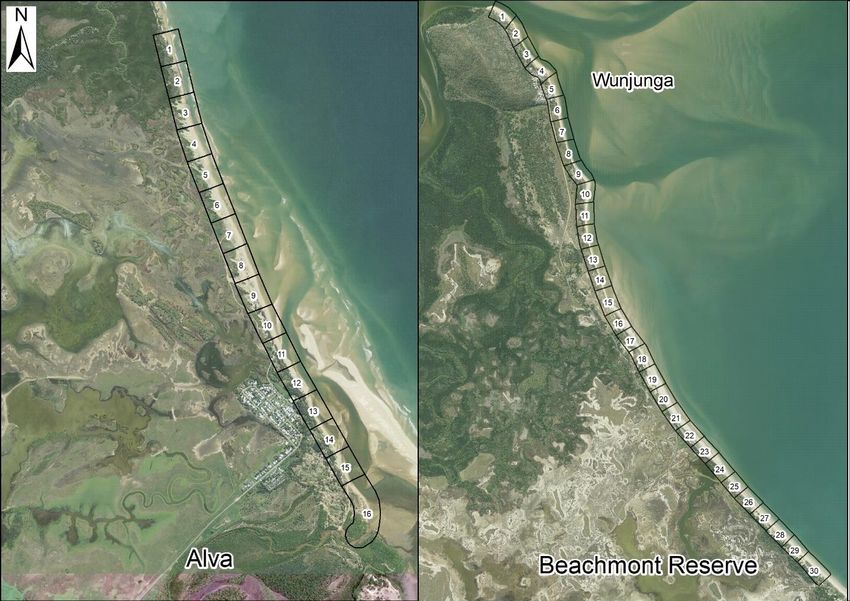
Coastal blowouts are an additional process throughout the Burdekin region. A blowout depression
 within the sand dunes are typically defined by their shape, typically saucer-, cup- or trough-shaped.
 They develop when vegetation cover is lost, and the sand is shifted and deposited in the leeward
 edge. A blowout may be initiated in a variety of ways, most commonly wind erosion in areas of low
 vegetation cover, storm erosion of the beach face, and human activities.
 In a dynamic environment, any exposed dune will quickly revegetate before they evolve into a
 substantial blowout. However once a blowout is established, which may be caused by ongoing
 disturbance by beach users and the tunnelling effect of wind blowing across the dunes with
 increased speed, a feedback mechanism is triggered for the blowout to continue eroding. The
 evolution of a blowout is shown in Figure 3-3 (top) which can be compared to the large blowouts
 along Alva Beach which extend up to 150m inland.

 Figure 3-3: Conceptual diagram of blowout evolution (top)9 and example of blowout at Alva
 Beach (bottom)10.

3.2 Appraisal of the dune system
 The coastal dune system along Alva beach, Wunjunga and the Beachmount Reserve has an
 important role in mitigating against erosion, stabilising the surface against wind erosion, and
 provides habitat for wildlife. To support its ongoing management, each coastline has been split into
 250m segments, as shown in Figure 3-4. This resulted in 15 assessment zones along Alva Beach
 and 30 zones along the Beachmount Reserve. Each coastal segment has been appraised in terms

9 Hesp, P. (2011). "Dune Coasts". Treatise on Estuarine and Coastal Science. 3. 193-221. 10.1016/B978-0-12-374711-2.00310-7.
10 You Tube (2020) "Alva Wetlands | Drone Footage [4K]", Accessed on 09 April 2020 from:
https://www.youtube.com/watch?v=n6I9pGpZL7M

 2020s0406 - BSC - Burdekin Dune Management Strategy_Management Options 1.2.docx 15
of its threats, which have been used to develop ongoing management actions (described in Section
4). Four threats to dune stability have been assessed and quantified. These include:
 • The location of any infrastructure in relation to the storm erosion zone.
 • The elevation of the dune crest in relation to storm tide and wave runup levels.
 • Any barren dunes, disturbances or blowouts.
 • The presence of informal tracks cutting across the dunes, either from frequent pedestrian
 or vehicle use.
The approach used to quantify each hazard is described in the sections below.

Figure 3-4: Coastal segments

 2020s0406 - BSC - Burdekin Dune Management Strategy_Management Options 1.2.docx 16
3.3 Location of infrastructure within the erosion zone
 This assessment measured the distance of infrastructure behind the dune crest, created new beach
 erosion estimates, and identified the degree of infrastructure potentially at risk.
 Infrastructure distance behind the crest
 Spatial analysis was used to map the distance of the closest infrastructure behind each coastal
 section. This was based on aerial imagery flown in 2013, supplied by BSC11.

 Figure 3-5: Infrastructure measured behind the dune

 Potential erosion distance
 The potential erosion for each 250m segments has been assessed for a 10% Annual Exceedance
 Probability (AEP) storm (equivalent 1 in 10-year event). The assessment has assumed
 unprotected, unvegetated dunes, which represent a 'worst-case' for coastal management. This has
 supplemented the coastal modelling undertaken in the CHAS, by incorporating high detail along
 both the Alva Beach and Beachmount coastline.

 Figure 3-6: Schematic of JEPA short-term erosion modelling using Vellinga (1982).
 Calculation of the storm-based erosion and dune slumping was undertaken using the JBP Erosion
 Prone Area (JBPA) tool. This predicts the beach erosion at each coastal zone under extreme wave,
 period and storm tide conditions. The tool estimates the beach equilibrium profile during a storm
 based on the work of Vellinga (1982) 12, where the beach shape is described as:
 0.5
 7.6 7.6
 ) = 0.47 [( )1.28 (
 ( )0.56 + 18] − 2.00
 0 0 0.0268
 Where, 0 = significant ‘deep water’ wave height and w = fall velocity of sand. The input
 parameters for each calculation include initial beach profile, storm tide level, nearshore wave

11 BSC, supplied for the Coastal Hazard Adaptation Strategy within file: "Burdekin_Shire_50cm_2013_Z55_mosaic"
12 P. Vellinga (1982). “Beach and dune erosion during storm surges” Delft Hydraulics Laboratory

 2020s0406 - BSC - Burdekin Dune Management Strategy_Management Options 1.2.docx 17
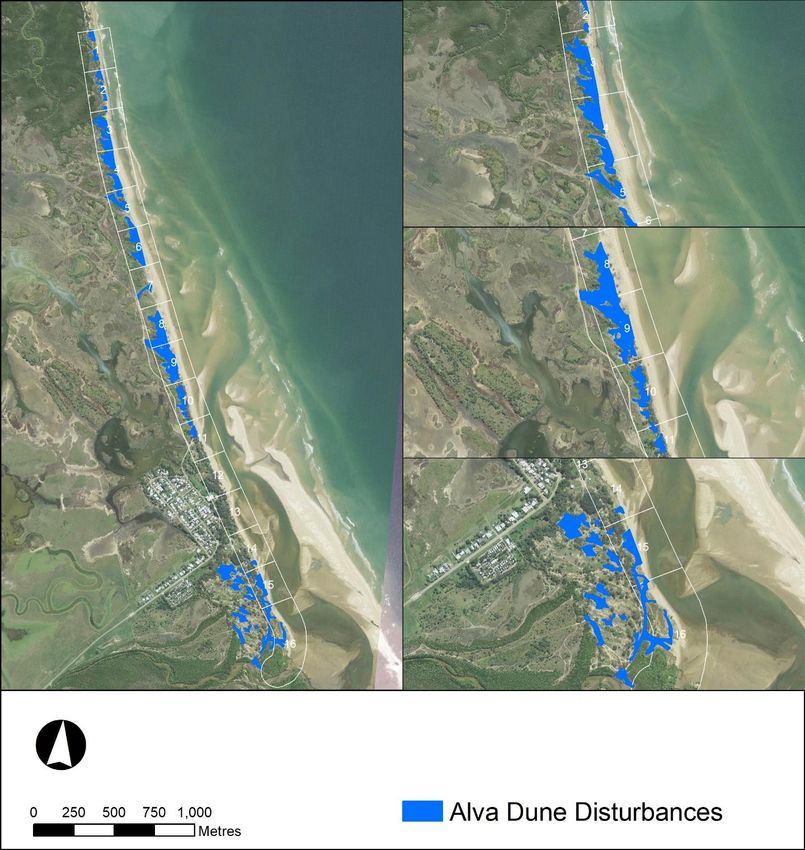
conditions, grain-size diameter, an upward slope stability threshold of 1:3, and a lower slope of
 1:12.5.
 Under storm conditions, the erosion distance is simulated that would occur to balances the storm
 equilibrium profile and the pre-storm profile. This assumes sand is eroded from the dune and is
 deposited into the nearshore coastal zone. The erosion width is then measured landward of the
 Highest Astronomical Tide (HAT) level, all the way to the intersection with the dune escarpment.

 Location of infrastructure within the erosion zone
 The location of infrastructure in relation to the estimates 10% AEP erosion zone was used to
 categorise each section as Low, Medium or High hazard. This has followed the scoring metric
 shown in Table 3-1.
 Table 3-1: Scoring metric for infrastructure and erosion
 Metric: Beyond 200m from 10% Between 200m to 20m from Within 20m (or within) the
 AEP erosion zone the 10% AEP erosion zone mapped erosion zone.
 Score Low hazard Medium High hazard

3.4 Dune crest in relation to storm tide levels
 Primary coastal dunes are high, generally with a profile that is relatively consistent along the
 shoreline. Analysis of each coastline indicates this primary dune crest is approximately 2 to 5mAHD
 at Alva beach and 3 to 4m AHD along the Beachmount Reserve.
 During a coastal storm, these dunes are subject to additional processes due to storm tides and
 waves runup. If the storm and wave levels are higher than the dune crest they may lead to overwash
 and breaching. Overwash is the initial process of waves running up and over the dune crest or
 through localised depressions or blowouts, which will begin to erode the dune and move sediment
 landward. With enough wave energy this loss of sediment can lead to breaching of the dune,
 lowering the crest elevation of the beach profile, and substantial erosion.
 The minimum elevation along the frontal dune was measured within each coastal zone to identify
 any low points, and was compared to the present-day 10% AEP storm tide level (2.2m AHD) and
 the storm tide plus wave runup level (3.4m AHD). Dune crests with an elevation lower than the
 storm tide level (excluding waves) were identified as a high hazard, and below the run-up level as
 a medium hazard. This scoring metric is shown in Table 3-2.

 Table 3-2: Scoring metric for dune crest lowering
 Metric: Dune crest higher than Dune crest between storm Dune crest lower than 10%
 10% AEP storm tide + tide and the wave setup AEP storm tide level
 wave setup level level
 Score Low hazard Medium High hazard

3.5 Dune disturbance, barren dunes or blowouts
 Disturbed dunes, barren dunes or blowouts have been mapped to identify any areas that may be
 losing sediment from the coastline. Blowouts can be natural features, commonly occurring in the
 foredune or within older vegetated dune systems, but are usually the result of human use along
 Alva and Wunjunga. Any blowout (natural or human made) can develop deeper in time, and cause
 the gradual collapse of adjacent dunes.
 The presence of any barren sand dunes or blowouts within the dunes has been mapped from aerial
 imagery, as shown in Figure 3-7. Often these were located along or near vehicle tracks, but also
 include areas that may have been disturbed from campsites. A relative scoring system was used
 to identify the largest areas, as shown in Table 3-4.

 2020s0406 - BSC - Burdekin Dune Management Strategy_Management Options 1.2.docx 18
Figure 3-7: Example dune disturbance mapping

 Table 3-3: Scoring metric for barren dunes or blowouts
 Metric: No disturbance Up to 2000m2 mapped Over 2000m2 mapped
 disturbance or blowouts disturbance or blowouts
 Score Low hazard Medium High hazard

 Figure 3-8: Dune disturbances along Alva Beach13

3.6 Track density
 Vegetated primary dunes can be damaged by vehicles and frequent pedestrian use. The presence
 of tracks cutting across the dunes has been mapped to identify high-use areas that can be targeted
 for revegetation, fencing and educational signage. These were summed for each beach section,
 and a relative scoring system used to identify the most heavily trafficked areas, as shown in Table
 3-4.

13 You Tube (2020) "Alva Wetlands | Drone Footage [4K]", Accessed on 09 April 2020 from:
https://www.youtube.com/watch?v=n6I9pGpZL7M

 2020s0406 - BSC - Burdekin Dune Management Strategy_Management Options 1.2.docx 19
Figure 3-9: Example track measurements

Table 3-4: Scoring metric for track density
 Metric: No observable tracks in Up to 2km of mapped tracks Over 2km of mapped tracks in
 coastal segment in coastal segment coastal segment
 Score Low hazard Medium High hazard

 2020s0406 - BSC - Burdekin Dune Management Strategy_Management Options 1.2.docx 20
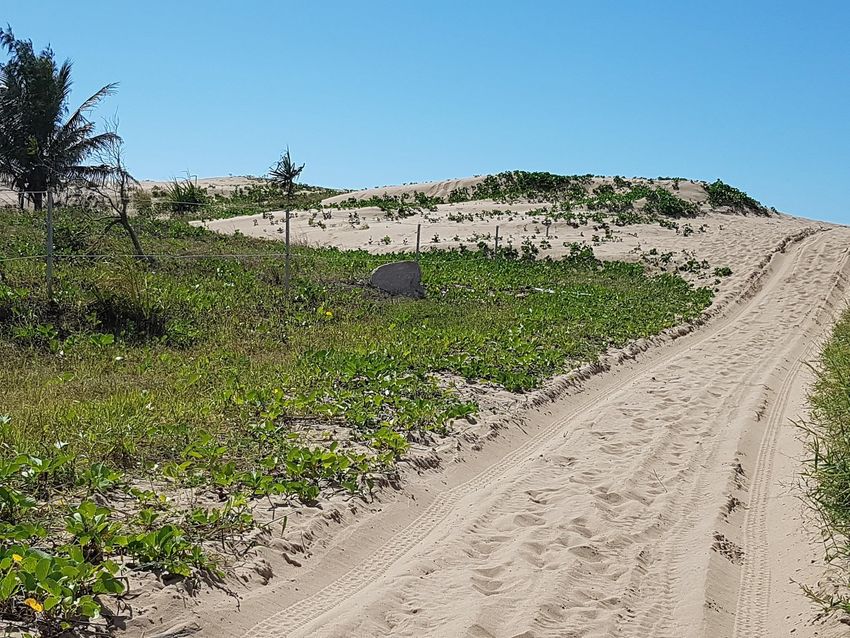
3.7 Assessment and prioritisation

3.7.1 Alva Beach
 The beach appraisal of Wunjunga and Beachmount Reserveis shown in Appendix A.
 The new erosion modelling, at-risk infrastructure assessment, the dune crest level, mapped dune
 disturbance, and identified tracks have been quantified using the Low, Medium, High scoring matrix
 shown in Table 3-5.
 Table 3-5: Scoring metric for each coastal segment
 Metric: Low hazard Medium High hazard

 Beyond 200m from
 Between 200m to 20m from Within the mapped erosion
 Erosion to infrastructure 10% AEP erosion
 the 10% AEP erosion zone zone, or within 20m.
 zone

 Dune crest higher
 Dune crest between storm
 than 10% AEP Dune crest lower than 10%
 Dune crest level tide and the wave setup
 storm tide + wave AEP storm tide level
 level
 setup level

 Up to 2000m2 mapped Over 2000m2 mapped
 Dune disturbance No disturbance
 disturbance or blowouts disturbance or blowouts

 No observable
 Dune tracks Up to 2km of mapped tracks Over 2km of mapped tracks
 tracks

 The results are shown in Figure 3-10, which indicates the following:
 • Infrastructure erosion. The main erosion risk is to the northern access track, which runs
 directly behind the dunes (Segment 8-10) which are now experiencing trough blowouts.
 • Crest levels along the northern coastline (Segment 1-5) are the lowest, and have the
 greatest risk of wave runup, overwash and breaching.
 • A series of trough blowouts are present between Segments 3-10. These are deep sided,
 elongated disturbances running from the dune toe to crest (east-west), which extend up to
 150m inland.
 The entire coastline is frequently used by vehicles. Several locations at the northern beach access,
 the Causeway Street beach access and the Alva Beach Tourist Park, are identified as where
 vehicles pass through and can be managed by signage.

 2020s0406 - BSC - Burdekin Dune Management Strategy_Management Options 1.2.docx 21
Figure 3-10: Alva hazard review

 2020s0406 - BSC - Burdekin Dune Management Strategy_Management Options 1.2.docx 22
3.7.2 Wunjunga and Beachmount Reserve
 The beach appraisal of Wunjunga and Beachmount Reserveis shown in Appendix A. The new
 erosion modelling, along with the assessment of at-risk infrastructure, the dune crest level, dune
 disturbance, and tracks, have been quantified using the scoring matrix shown in Table 3-5. The
 results are shown in Figure 3-11, which provides the following trends:
 • Infrastructure erosion. Infrastructure is threatened by erosion at Wunjunga, Beachmount
 Road (Segment 20-22), and the second bund at Charlies Gap.
 • Crest levels along southern Beachmount Road (Segment 20-23) are generally narrow and
 have localised areas of crest lowering that may form a weak point along the dune to wave
 overwash. Similarly, the berm at Charlie's Gap is considered relatively low and has the risk
 of being breaching during a storm.
 • Dune disturbances are mapped throughout Wunjunga, due to frequent traffic. Elsewhere,
 barren dunes are present along Segments 16-29 that may be due to natural processes, and
 along the southern coastline (Segment 26 to 30) due to frequent use by vehicles.
 • Access to the coastline is through four formal tracks which is open for recreational 4WD
 use. Two other informal beach access tracks were identified at Wunjunga (Section 4-5)
 and north of the Funny Dunny camping ground (Section 13). However, there are a large
 number of informal tracks running along the dunes along the southern beach (Segment 26-
 30) that are leading to dune erosion.

 Figure 3-11: Wunjunga and Beachmount Reserve hazard review

 2020s0406 - BSC - Burdekin Dune Management Strategy_Management Options 1.2.docx 23
4 Dune management actions
 The aim of this Dune Management Strategy is to create a coastline that is more resilient to coastal
 erosion, to be sustainable into the future, and provide benefits to multiple stakeholders.
 A set of targeted management objectives has been formulated based on the values of the coastline,
 and the hazards identified in the previous Sections. Specific management objectives have been
 formulated following six key principles discussed with the project steering committee:
 • Have a focus on nature-based or 'soft' actions rather than 'hard' infrastructure (seawalls
 etc).
 • Improve public information, education, and awareness of coastal hazards to build
 community stewardship
 • Plan for new signage at high use areas that can promote dune management and provide
 details for volunteers to contribute.
 • Any new fencing needs to consider vandalism and use different materials at high-use areas.
 • Prioritise erosion 'hotspots' for targeted revegetation, which may be used to measure
 progress.
 • Work with local organisations such as the NQDT, the Lower Burdekin Landcare groups,
 and the residents themselves.

4.1 Management actions
 A range of ‘Management Details’ have been developed, which can be used to address the hazards
 identified in the Dune Appraisal within Section 3. These include:
 • M1 - Enhanced partnerships, focusing on a greater collaboration with partner organisations
 • M2 - Revegetation of erosion zones, which will use native plant species, fencing and
 signage to stabilise key areas.
 • M3 - Dune protection measures such as fencing, signage and education, that can be used
 to support new revegetation.
 • M4 - Beach accessways, these would support walk-in beach access and allow rear-parking
 and foot traffic access to the beach.
 • M5 - Beach traffic review, which considers changes to existing 'traffic’ and ‘no traffic’ areas
 to address existing and future recreational needs

 2020s0406 - BSC - Burdekin Dune Management Strategy_Management Options 1.2.docx 24
4.2 M1 - Enhanced partnerships
 This action aims to work with the capabilities of partner organisations. This would encourage and
 support local volunteers to carry out on-ground restoration works, such as weed removal,
 revegetation and general foreshore cleanups (i.e. working bees), which would also foster greater
 appreciation of the natural environment by participants.
 Several external groups will be able to contribute to the Strategy, including:
 • NQDT
 • Gudjuda Aboriginal Corporation
 • Lower Burdekin Landcare Group
 • Queensland Parks and Wildlife
 • Great Barrier Reef Marine Park Authority.
 Further opportunities should be sought with the range of other organisations working in the region.
 Collectively, these organisations have a large amount of capabilities, responsibility and internal
 skills that undertake a range of tasks to support the plan. These include:
 • All organisations can apply for funding for the implementation of the plan.
 • All organisations have websites that can support in promotion of dune management actions.
 • The Gudjuda Aboriginal Corporation are active throughout the Beachmount area.
 • The Lower Burdekin Landcare Group has a nursery that has a wide range of Australian
 native plants that would be suitable for dune revegetation.
 • The NQDT and Lower Burdekin Landcare Group have a paid and volunteer-based labour
 force that can undertake on-ground works and revegetation.

 Figure 4-1: Lower Burdekin Land Care Association nursery and working bees

 2020s0406 - BSC - Burdekin Dune Management Strategy_Management Options 1.2.docx 25
You can also read