Target Zero Highway Safety Plan
←
→
Page content transcription
If your browser does not render page correctly, please read the page content below
Target Zero

South Carolina’s Strategic
  Highway Safety Plan

[Date]

Dear Mr. Lee:

        The State of South Carolina is submitting this Strategic Highway Safety Plan (SHSP)
in accordance with the requirements of 23 USC § 148(d), Highway Safety Improvement
Program, Updates to Strategic Highway Safety Plans. The updated Plan, entitled Target Zero,
is indicative of the state’s commitment to eliminating traffic fatalities and severe injuries
over time. The Target Zero update was accomplished through consultation with our
Governor’s Highway Safety Representative, regional and metropolitan planning
organizations, representatives of the major modes of transportation, the South Carolina
Highway Patrol and local law enforcement agencies, the highway-rail grade crossing safety
representative, representatives conducting motor carrier safety programs under Section
31102, 31106, or 31309 of Title 49, motor vehicle administration agencies, state
representative of non-motorized users, county transportation officials, and other Federal,
State, tribal, and local safety stakeholders. The updated SHSP continues to address key
emphasis areas and contains additional recommendations for appropriate strategies and
countermeasures based on data-driven and evidence-based practices toward the goal of
eliminating fatalities and severe injuries on South Carolina roads.

        A Steering Committee was formed for the purpose of updating the state’s Strategic
Highway Safety Plan. Members of the committee include representatives from the SC
Department of Transportation, the SC Department of Public Safety, the Federal Highway
Administration, and the National Highway Traffic Safety Administration. The Committee
used a data-driven approach to identify emphasis areas for the updated SHSP and held
monthly meetings to discuss each emphasis area, reviewing the data analysis results and
proposing strategies to eliminate the number of fatalities and severe injuries for that
particular emphasis area. Strategies were explored from the point of view of the 4Es:
Engineering, Enforcement, Education, and Emergency Medical Services. Performance
measures and goals were established as well as the process for evaluating progress toward
meeting those goals. The Committee will coordinate with stakeholders to complete this
effort. The updated plan covers a four-year period from 2014 to 2017 and will be evaluated
on an annual basis.
       The Steering Committee respectfully submits this document for your approval. We
look forward to working with state leadership and local planning authorities to implement
the 2014-2017 SHSP aimed at eliminating fatalities and severe injuries on the state’s
roadways.
                                         Sincerely,

Leroy Smith                                                     Janet Oakley
Governor’s Representative for Highway Safety                    Transportation Secretary
Director, SCDPS                                                 SCDOT
Table of Contents
Introduction and Background                                         3
      2007 Strategic Highway Safety Plan
      Evaluation

Target Zero                                                         9
      2014 Strategic Highway Safety Plan
      Update Approach
      Coordination with Other Highway Safety Plans
      Statewide Fatality Goal
      Statewide Severe Injury Goal

Emphasis Area: Roadway Departure                                    21

Emphasis Area: Unrestrained Motor Vehicle Occupants                 27

Emphasis Area: Age Related
               Young Drivers                                        33
               Older Drivers                                        38

Emphasis Area: Speed Related                                        42

Emphasis Area: Vulnerable Roadway Users
               Motorcyclists                                        47
               Pedestrians                                          52
               Mopeds                                               57
               Bicyclists                                           63

Emphasis Area: Intersection and Other High-Risk Roadway Locations
               Intersections                                        67
               Work Zone                                            71
               Railroad Crossings                                   76

Emphasis Area: Impaired Driving                                     79

Emphasis Area: Commercial Motor Vehicles/Heavy Trucks               85

Emphasis Area: Safety Data Collection, Access, and Analysis         89
Executive Summary
        South Carolina’s Strategic Highway Safety Plan, or SHSP, is a statewide,
comprehensive safety plan that provides a coordinated framework toward eliminating
deaths and severe injuries on South Carolina’s public roads. This coordination requires
combining and sharing resources and focusing efforts on areas with the greatest potential
for improvement. The SHSP strategically establishes statewide priorities and identifies
critical emphasis areas which were identified through detailed analysis of statewide crash
data. The development of the SHSP was also performed in consultation with federal, state,
local, and private-sector safety stakeholders. The strategies developed involve the 4 Es of
safety (i.e., Engineering, Enforcement, Education, and Emergency Medical Services).
        In 2011, the Director of the SC Department of Public Safety (SCDPS), who also serves
as the Governor’s Representative for Highway Safety in South Carolina, announced the
Agency’s goal of zero traffic-related deaths for the State. This goal, also strongly supported
by the South Carolina Department of Transportation (SCDOT) and the South Carolina
Department of Motor Vehicles, became the starting point for the State’s update of the SHSP,
entitled Target Zero.
        The Emphasis Areas presented in this updated SHSP were identified using a data-
driven process consisting of extensive analysis of fatal and severe injury collision data from
2008 to 2012. This analysis revealed the following areas to be addressed in the updated
SHSP: Roadway Departure, Unrestrained Motor Vehicle Occupants, Speed-Related,
Vulnerable Roadway Users (Motorcyclists, Pedestrians, Moped Operators, and Bicyclists),
Intersection and Other High Risk Roadway Locations (Work Zones and Railroad Crossings),
Impaired Driving, Age-Related (Young Drivers: 19-24 years of age and Older Drivers: 65 or
more years of age), Commercial Motor Vehicles/Heavy Trucks, and Safety Data Collection,
Access, and Analysis.
        As mentioned previously, this update is the product of a multi-Agency Steering
Committee comprised of members from the Education, Enforcement, and Engineering
sectors. While agreeing to utilize a data-driven approach to identify the nine Emphasis
Areas, priority categories may have differed among the Agencies, due to their respective
overall missions. For the SCDPS, the focus is centered around enforcement and education
While SCDOT is focused on engineering solutions to eliminate the number of roadway
fatalities and severe injuries.      In order to achieve the goal of zero traffic fatalities,
reductions in the number of fatal and severe injury collisions must be achieved in each of
these priority Emphasis Areas.

                                                                                            2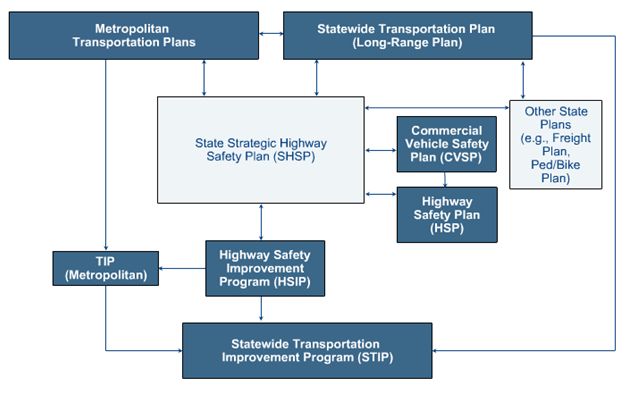
Introduction and Background
2007 Strategic Highway Safety Plan

In 2007, the Strategic Highway Safety Plan (SHSP) entitled The Roadmap to Safety was
developed in compliance with federal law under the Safe, Accountable, Flexible, and
Efficient Transportation Equity Act – A Legacy for Users (SAFETEA-LU). South Carolina’s
2007 SHSP was developed cooperatively among the South Carolina Department of
Transportation (SCDOT), the South Carolina Department of Public Safety (SCDPS) and the
Federal Highway Administration (FHWA) along with other safety stakeholders. The
Roadmap was designed to focus resources and align partnerships toward a common goal:
reducing fatalities and injuries 1.

The 2007 SHSP identified 5 major emphasis areas:

                        1. Serious Crash Types
                        2. High-Risk Drivers
                        3. Special Vehicles
                        4. Vulnerable Roadway Users
                        5. Management Information & Exchange

For this most recent update, the SHSP Steering Committee utilized a data driven process to
identify the emphasis areas based on thorough analysis of fatal and severe injury collision
data.

Evaluation

Through collaborative efforts among partner Agencies, the State has seen significant
progress since the 2007 SHSP was implemented. The state of South Carolina has seen
significant positive reductions in a variety of traffic safety categories since 2008. The state
has seen an overall reduction of 6.3% in the number of fatalities, from 921 in 2008 to 863
in 2012 (see Table 1). However, the most recent three years of this time frame, 2010-2012,
displayed an increase in the total number of fatalities (+19 in 2011; and +35 in 2012).
Despite an initial increase in the number of unrestrained occupant fatalities from 2006 to

1The 2007 SHSP addressed fatalities and all injuries, whereas the 2014 revision will focus on fatalities and
severe injuries.

                                                                                                               3
2007, corresponding with an increase in the number of overall fatalities, the number of
unrestrained occupant fatalities has steadily declined until 2012 (-31 in 2009; -68 in 2010;
and -55 in 2011). Unfortunately the number of unrestrained motor vehicle occupants
increased to 328 in 2012. The overall reduction resulted in 20.4% fewer such deaths in
2012 than in 2006. Safety belt usage rates increased from 79.5% in 2008 to 90.5% in 2012.

Table 1. SC Fatalities and Restraint Use, 2008-2012.
                                        Unrestrained MV
                                           Occupant         Seatbelt Usage
                     Year  Fatalities      Fatalities            Rate
                      2008       921                  412             79.5%
                      2009       894                  381             81.5%
                      2010       809                  313             85.4%
                      2011       828                  258             86.0%
                      2012       863                  328             90.5%

The 2007 SHSP identified Data Management Information and Exchange as an Emphasis
Area and strategies were outlined to improve the collection of safety data. One such
strategy was to continue the development and deployment of an electronic collision
reporting system. This system, known as the South Carolina Collision and Ticket Tracking
System (SCCATTS), has grown exponentially in its development and implementation since
2007. Starting in 2010, the electronic collision report form component of SCCATTS was
deployed to the South Carolina Highway Patrol (with 100% compliance by January 2012)
and has since been adopted by 54 local law enforcement agencies. Current estimates
indicate approximately 70% of collision report forms are being sent to SCDPS
electronically. One of the many benefits of SCCATTS has been the decrease in the number of
days for processing of a collision report and consequentially, the more timely availability of
the crash data in the state collision file, from 35 or more days in 2010 to 5 days in 2012.

Additionally, the use of mapping software integrated within the electronic reporting
hardware has allowed for more accurate reporting of collision locations. Proper
identification of where a collision occurred is of the utmost importance to SCDOT for
planning purposes.

The State of South Carolina has been committed to reducing the occurrence of alcohol-
impaired driving and the resulting traffic crashes, injuries, and fatalities. Though the state
has experienced significant reduction in alcohol-impaired driving traffic fatalities in recent

                                                                                            4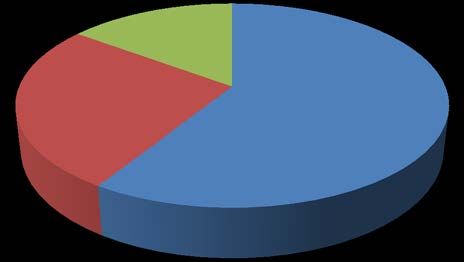
years, the most recent FARS data provided by the National Highway Traffic Safety
Administration (NHTSA) indicates that 348 people died on South Carolina roadways in
2012 as a result of alcohol-impaired driving collisions (see Figure 1 below). The number of
alcohol-impaired driving fatalities declined steadily through 2011, a reduction of 91 deaths
from 2008, but then increased in 2012 (+39), for a net decline of 52 deaths.

Alcohol-Impaired Driving Fatalities
2008-2012
            450
                  400
            400                374
                                                353                                  348
            350
                                                                 309
            300
                                                                               y = -16.9x + 407.5
            250

            200

            150

            100

            50

             0
                  2008         2009             2010             2011                2012
                                Alcohol Impaired Driving Fatalities
       Source: NHTSA            Linear (Alcohol Impaired Driving Fatalities)
Figure 1.

                                                                                                    5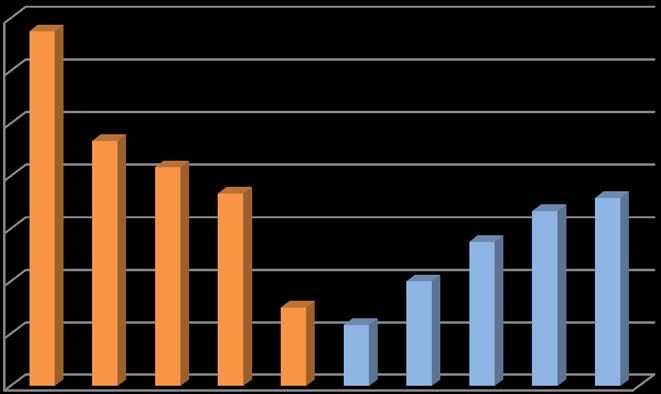
Speed-related deaths declined from 2008 to 2011 (-13 in 2009; -49 in 2010; and -10 in
2011). Despite an increase of 38 fatalities in this category from 2011 to 2012, the state
experienced almost 10% fewer such deaths in 2012 than in 2008.

Speed-Related Fatalities
2008-2012
     400
               350
                                 337
     350
                                                                                        316
                                                 288
     300                                                              278
                                                                            y = -12.7x + 351.9
     250

     200

     150

     100

      50

       0
               2008              2009            2010                2011               2012

                      Speed Related Fatalities          Linear (Speed Related Fatalities)

Figure 2.                                                                            Source: NHTSA

Highway safety engineering improvements targeted at high-crash intersections and
roadway corridors produced positive results after the implementation of the 2007 SHSP.
SCDOT implemented a number of low-cost intersection improvements in the state, such as
signing, pavement markings, LED signals, and retro-reflective back plates on.
Countermeasures such as realignments, turn lanes, and roundabouts were also used at
high-crash intersections. Safety measures added to many high-crash roadway corridors
throughout the state were designed to prevent or reduce the severity of roadway departure
collisions. These measures included median cables, rumble strips, shoulder
widening/paving, safety edge, high-friction pavement, and open-graded friction course
treatment. Post-project data analysis performed by SCDOT demonstrated a significant
reduction in the number of crashes at locations in which engineering solutions were
applied. These improvements are further demonstrated in Figures 3 and 4.

                                                                                                     6
Intersection-Related Fatal and Severe Injury Collisions
2008-2012
                    1184
            1200
                            1057    1083   1080
                                                  1048

            1000                                          945
                                                                 861    878
                                                                               836     838
             800

             600

             400

             200

               0
                   2003    2004    2005    2006   2007   2008   2009   2010   2011    2012

Figure 3.

Roadway Departure Fatal and Severe Injury Collisions
2008-2012

            2000           1822                   1806
            1800   1684                    1715
                                   1663
                                                         1541   1497
            1600                                                                       1440
                                                                       1391    1395
            1400
            1200
            1000
            800
            600
            400
            200
              0
                   2003    2004    2005    2006   2007   2008   2009   2010   2011    2012

Figure 4.

                                                                                              7
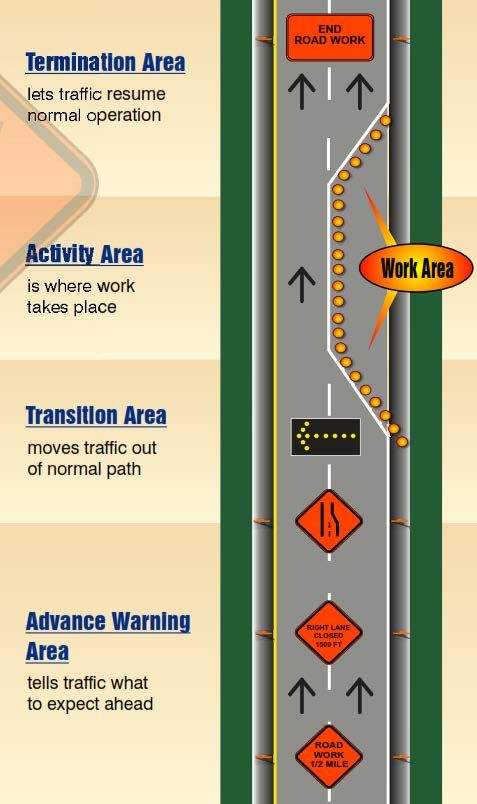
Due to the number of work zone-related crashes that occurred on SC roadways, most with
a contributing factor of driving too fast for conditions, SCDOT formed a partnership with
the SCDPS to create the Safety Improvement Team (SIT) in 2006, which has continued. The
partnership called for 24 troopers from the Highway Patrol to work full-time on work zone
enforcement. From 2003 to 2007, work zone fatal and severe injury crashes declined from
81 in 2003 to 18 in 2007 (Figure 5). Work zone fatal and severe injury crashes decreased
again in 2008 (-4) before increasing to 43 in 2012. Despite this most recent increase, the
number of work zone crashes has been cut almost in half since 2003.

Work Zone Related Collisions
2008-2012

        81
  84

  72

  60          56
                    50
  48                     44                                 43
                                                      40
                                                 33
  36
                                           24
  24                           18
                                     14
  12

   0
       2003 2004 2005 2006 2007 2008 2009 2010 2011 2012

Figure 5.

Though the state has experienced the positive gains outlined above, there is still much
work to be done to improve highway safety in the state and to continue to drive down
traffic collisions, injuries, and deaths on the state’s roadways.

                                                                                        8
Target Zero: South Carolina’s Strategic Highway Safety Plan
The strong commitment of the Secretary of South Carolina’s Department of Transportation
and the South Carolina Governor’s Highway Safety Representative, who serves as the
Director of the SC Department of Public Safety (DPS), has resulted in the state’s adoption of
Target Zero as the State’s main goal in addressing traffic-related deaths. Thus, the State is
gearing its highway safety efforts toward eliminating traffic fatalities rather than merely
reducing them. The SCDPS’s website underwent many updates following the State’s
adoption of the Target Zero initiative to highlight the Agency’s mission and provide
information for the public to view. The website can be viewed online.
During the last decade, many states have adopted a variety of enforcement, engineering,
and educational strategies with a view toward eliminating traffic fatalities on their
respective roadways. This is a radical departure from the traditional goal-setting
approaches adopted by states in efforts to simply reduce traffic fatalities. Though obviously
not achievable overnight, the goal of zero traffic fatalities is a noble goal for which our state
strives and one we can all live with.
Moving Ahead for Progress in the 21st Century
The current federal transportation act, Moving Ahead for Progress in the 21st Century
(MAP-21), established a new requirement for all states to update their respective Strategic
Highway Safety Plans (SHSP) in order to continue to qualify for receipt of Highway Safety
Improvement Program (HSIP) funds. Fortunately, South Carolina was already in the
process of planning for an update prior to the passage of MAP-21, including hiring an SHSP
Manager and relocating the management of the SHSP to the Office of Highway Safety and
Justice Programs (OHSJP), a division of the SCDPS.
High-Risk Rural Roads
MAP-21 redefined and created a Special Rule for High-Risk Rural Roads (HRRR). Prior to
MAP-21, the Safe, Accountable, Flexible, Efficient, Transportation Equity Ace: A Legacy for
Users (SAFETEA-LU) provided a $90 million annual set-aside from the Highway Safety
Improvement Program (HSIP) for HRRR. MAP-21 legislation does not set aside funds for a
high-risk rural roads program. However, the Special Rule requires states that experience an
increase in fatality rates on rural roads to obligate a specified amount of HSIP funding on
HRRRs.
9Annually, the HRRR rates will be calculated by the Federal Highway Administration. If the
Special Rule applies, states are required to obligate funds on those specific roads. Under
South Carolina’s High-Risk Rural Road Program, high-risk roads are defined as those
roadways that are functionally classified as rural major collectors, rural minor collectors, or
rural local roads with a fatality and incapacitating injury crash rate statistically above the
statewide average for those functional classes of roadways.
Special Rule on Older Drivers and Pedestrians
When determining if the Special Rule applies in a state, the state should consider older
drivers and pedestrians collectively. If the rate of traffic fatalities and serious injuries for
drivers and pedestrians 65 years of age or older in the state increases during the most
recent 2-year period, then the Older Drivers Special Rule would apply.
The SHSP Update Approach
The Federal government recommends that states update their SHSPs every five years, and
South Carolina has joined a number of other states in updating its plan and including a
major data analysis review. This review is performed to identify areas in which there are
opportunities to make improvements for continuing progress in enhancing safety,
eliminating fatalities, and reducing severe injuries in the state. The process used to update
South Carolina’s plan included several important steps:
• Create a position within the Office of Highway Safety and Justice Programs (OHSJP)
for a dedicated Strategic Highway Safety Plan Manager;
• Establish a Steering Committee to provide the overall leadership for the plan and its
implementation;
• Perform data analysis and identify emphasis areas with the greatest potential for
improvement;
• Examine literature on countermeasure effectiveness;
• Add new countermeasures and strategies and remove others where appropriate;
• Ensure compliance with Federal SHSP guidelines (e.g., MAP-21);Present draft plan
to Agency leadership;
• Present a draft SHSP to stakeholders and incorporate their input;
• Develop and present the final updated plan to the Steering Committee;
• Develop and present an annual Implementation Plan for approval by Steering
Committee and Agency leaders; and
• Develop a process to evaluate the SHSP.
10To keep South Carolina moving forward with improving highway safety, the SHSP update
process involved the following activities:
• Form an organizational structure for the SHSP and collaborate with partner
agencies to gain their input into and support for the SHSP;
• Hold planning meetings with the SHSP Steering Committee; and
• Reach consensus on the vision, mission, goals, emphasis areas, and strategies.
The Plan’s Steering Committee used a data-driven approach to identify emphasis areas for
the updated SHSP. As seen in Figure 6 and Table 2 on the next page, data analysis revealed
priority traffic safety areas accounting for 90% of the total fatal and severe injury collisions
from 2008 to 2012. While crash causation factors are often interrelated, the critical areas to
target are evident. For example, roadway-departure crashes, which represent the leading
crash type, may include inappropriate speed, unrestrained occupants, and a distracted
driver. However, there are specific countermeasures that can be implemented with the goal
of reducing the number of vehicles leaving the roadway.
The second-leading crash type involved unrestrained motor vehicle occupants,
representing almost 41% of the total fatal and severe injury crashes during this time
period. Age- and Speed-Related Collisions, Vulnerable Roadway Users (Motorcyclists,
Pedestrians, Bicyclists, and Moped Operators), Intersection-Related Collisions, Driving
Under the Influence of Alcohol and/or Drugs, and Commercial Motor Vehicles and Other
Heavy Trucks composed the remaining fatal and severe injury crash types from 2008 to
2012.
11SHSP Emphasis Areas Based on Fatal and Severe Injury Crashes, 2008-2012
42.6% 41.3%
45.0%
40.0% 36.1%
35.0% 34.9%
30.0% 27.6%
25.0% 25.9% 25.8%
20.0%
15.0%
10.0%
5.0%
0.0%
4.2%
Figure 6.
Table 2. SHSP Data Analysis, 2008-2012
12The major focus areas for SC remain similar to those identified in the 2007 SHSP with only
slight changes in terminology. Based on an extensive review of the collision data, the SHSP
Steering Committee selected the following emphasis areas:
• Roadway Departure;
• Unrestrained Motor Vehicle Occupants;
• Age-Related;
• Speed-Related;
• Vulnerable Roadway Users;
• Intersection and Other High-Risk Roadway Locations;
• Impaired Driving;
• Commercial Motor Vehicles/Heavy Trucks.
Data analysis revealed a large percentage of driver impairment in fatal and severe injury
collisions in the State. Therefore, in a departure from the 2007 SHSP, the updated SHSP
examined impaired driving as its own emphasis area.
Because of the great importance safety planners and engineers in the State place on data
analysis and data-driven approaches to eliminating fatalities and reducing severe injuries,
the Committee added a final emphasis area:
• Safety Data Collection, Access, and Analysis.
The Steering Committee also discussed including a distracted or inattentive driver as an
emphasis area, but the lack of supporting data precluded inclusion. However, the
strategies used to address these issues are addressed in other emphasis areas.
13Figure 7 below displays the number of fatalities and severe injuries sustained by persons
involved in motor vehicle collisions in South Carolina from 2008 to 2012. Despite a
significant reduction in fatalities from 2008 to 2012 (6.3%), the most recent two years
(2011 and 2012) show a 2.3% and 4.2% increase from the previous year, respectively.
Severe injuries decreased in 2011, compared to 2010, by 5.8% before increasing slightly in
2012 by 4%.
SC Fatalities and Severe Injuries
2008-2012
Fatalities Severe Injuries
940 3550
920 3500
900 3450
880
3400
860
3350
840
3300
820
3250
800
780 3200
760 3150
740 3100
2008 2009 2010 2011 2012
Severe Injuries 3513 3448 3462 3260 3390
Fatalities 921 894 809 828 863
Source: State Collision Master File
Figure 7.
14Coordination with Other Highway Safety Plans
Integration of the SHSP with other transportation planning and programming activities is a
key step in the effectiveness of any SHSP implementation plan. Leveraging resources and
aligning statewide priorities and goals can provide a blueprint for action that key agencies
and stakeholders can use to implement strategies for reducing fatalities and serious
injuries in the State.
In an effort to coordinate the SHSP with the state’s Highway Safety Plan (HSP), key staff
from the State’s Highway Safety Office have been actively involved in many of the SHSP
planning meetings. Similar data analysis performed by the SHSP Manager for the purpose
of identifying the Emphasis Areas for the updated SHSP were also utilized in the setting of
performance measures and targets for the FFY14 HSP. The State views the coordination of
the SHSP with the HSP and other highway safety plans as an effort to build a unified,
statewide approach to improving highway safety.
Relationship between State Safety Plans
Figure 8.
15The performance measures that are common to South Carolina’s SHSP, HSP, and the state’s
Highway Safety Improvement Program (HSIP) are the number of fatalities and severe
injuries as well as the fatality rate (number of traffic fatalities per 100 million vehicle miles
traveled). The SHSP and HSIP also incorporate the serious injury rate, while the HSP does
not. The Federal Highway Administration (FHWA) and the South Carolina Department of
Transportation (SCDOT) are responsible for the development of the HSIP. The SCDPS,
SCDOT, FHWA, and other local, state, and federal agencies and safety advocates
collaborated on the creation of the Strategic Highway Safety Plan (SHSP). The state’s
Highway Safety Plan, though developed by the OHSJP, reflects multiple partnerships among
a variety of federal, state, and local agencies. The number of traffic fatalities, severe
injuries, and the traffic fatality and severe- injury rate performance measures are mutually
identified in each plan (SHSP, HSIP, and HSP) with evidence-based targets within emphasis
areas that were developed through extensive data analysis.
SC’s Commercial Vehicle Safety Plan (CVSP) outlines the State’s commercial motor vehicle
safety objectives, strategies, activities, and performance measures. The CVSP aims to
reduce the number and severity of crashes and hazardous materials incidents involving
commercial motor vehicles (CMV). Through consistent, uniform, and effective CMV safety
programs, the CVSP addresses some of the behavioral safety elements in the SHSP, such as
aggressive and distracted driving.
SCDOT Transportation Plans
The SC Department of Transportation is responsible for many plans, including
metropolitan and statewide transportation plans and short- and long-range plans that are
consistent with the SHSP’s goal of reducing crashes. In addition, the metropolitan and
statewide transportation plans include sections on safety, inclusive of projects and/or
strategies from the SHSP.
Improving the safety of the transportation system is one of the planning factors that federal
legislation explicitly requires to be considered in the transportation planning process.
Short- and long-range plans have a safety element as part of the plan, and when projects
and strategies are evaluated for possible inclusion in the metropolitan transportation plan
and the TIP, safety is a factor in the projects’ rankings, in accordance with State law.
The statewide transportation planning process is a forum to facilitate transportation
decision-making. States are required to conduct continuing, comprehensive, and
collaborative intermodal statewide transportation planning that facilitates the efficient
16movement of people and goods in all areas of the state, including metropolitan areas. The
South Carolina Statewide Comprehensive Multimodal Transportation Plan provides a
comprehensive analysis of transportation needs through the year 2040. In addition, the
plan includes specific modal elements, such as the Interstate Plan, Strategic Corridors
Network Plan, Freight Plan, Rail Plan, Public Transit Plan, and the Human Services
Coordination Plans.
The South Carolina Statewide Transportation Improvement Program (STIP) is the state’s
six-year transportation improvement program for all projects or program areas receiving
federal funding, including bridge replacements, safety, roadway resurfacing, interstate
maintenance and upgrades, primary and secondary road system upgrades, federal lands
projects, transportation alternatives, congestion mitigation and air quality, and public
transportation. The STIP covers all federally funded improvements for which funding has
been approved and that are expected to be undertaken during the upcoming six-year
period.
Metropolitan transportation planning is the process of examining travel and transportation
issues and needs in metropolitan areas. In metropolitan areas with populations over
50,000, the responsibility for transportation planning lies with designated Metropolitan
Planning Organizations (MPO). An MPO is a transportation policy-making organization
made up of representatives from local government and transportation authorities. The
role of the MPO includes establishing a local forum for transportation decision making;
evaluating transportation alternatives; developing and updating a long-range
transportation plan; developing a Transportation Improvement Program (TIP); and getting
the public involved.
17Performance Period
While Strategic Highway Safety Plans are designed to be multi-year planning documents,
certain performance period goals were established in this update for the total number of
fatalities, total number of severe injuries, the fatality rate, and the severe injury rate, as
well as similar goals for each emphasis area. Each update of the state’s SHSP will provide
interim goals in order to measure progress towards the long-term goal of zero traffic
fatalities and a significant reduction in the number of severe injuries.
Figure 9 below depicts the five-year rolling average for the number of traffic fatalities since
2001. The performance period for the 2014-2017 SHSP establishes a goal of 623 traffic
fatalities by the end of 2017. The figure below also includes a trend line based on the five-
year rolling average of traffic fatalities since 2001. Our Target Zero (TZ) goal line is based
on a zero fatality projection by 2030. In order to reach zero traffic fatalities by the year
2030, the number of fatalities in South Carolina must be reduced by an average of 51
annually. The performance gap, shaded in light blue, demonstrates the data range for
between the expected decline (based in historical trend analysis) and the decline necessary
to achieve zero fatalities by 2030.
Targets set in other State safety plans, such as the HSIP and the HSP, will most likely fall
between the linear trendline and the Target Zero trendline (see Figure 9), based on
available resources, funds, and legislation, etc.
1200
1000
1046
1044
1041
1036
1006
949
906
800
863
815
767
719
600 671
623 y = -26.967x + 1107.7
575
527
400 479
432
384
336
200 288
240
192
144
0 96 48
01-05
02-06
03-07
04-08
05-09
06-10
07-11
08-12
09-13
10-14
11-15
12-16
13-17
14-18
15-19
16-20
17-21
18-22
19-23
20-24
21-25
22-26
23-27
24-28
25-29
26-30
Fatalities TZ Goal (From 5YR Rolling Avg) Performance Range Linear (Last 12 Years, 5YR Rolling Avg)
Figure 9.
18The performance period goal for the number of severe injuries is shown below in Figure
10.
5000
4500
4000
4297
4211
4155
4012
3860
3500
3724
y = -131.11x + 4491.6
3557
3397
3000
3208
3020
2500 2831
2642
2000 2454
1500
1000
500
0
01-05
02-06
03-07
04-08
05-09
06-10
07-11
08-12
09-13
10-14
11-15
12-16
13-17
Severe Injuries TZ Goal (From 5YR Rolling Avg) Performance Range Linear (Last 12 Years, 5YR Rolling Avg)
Figure 10.
Figure 11 depicts the trend analysis for the fatality rate (number of fatalities per 100
million vehicle miles traveled).
2.50
2.19
2.00
2.15
2.13
2.09
y = -0.0633x + 2.2948
2.03
1.91
1.83
1.76
1.50 1.66
1.56
1.46
1.37
1.27
1.00
0.50
0.00
01-05
02-06
03-07
04-08
05-09
06-10
07-11
08-12
09-13
10-14
11-15
12-16
13-17
Fatalities TZ Goal (From 5YR Rolling Avg) Performance Range Linear (Last 12 Years, 5YR Rolling Avg)
Figure 11.
19Figure 12 depicts the trend analysis for the severe injury rate (number of severe injuries
per 100 million vehicle miles traveled).
10.00
9.00 9.03
8.68
8.00
8.45
8.10
7.78
7.00
7.50
7.20
y = -0.2993x + 9.3072
6.95
6.00 6.56
6.18
5.00 5.79
5.41
5.02
4.00
3.00
2.00
1.00
0.00
01-05
02-06
03-07
04-08
05-09
06-10
07-11
08-12
09-13
10-14
11-15
12-16
13-17
Severe Injuries TZ Goal (From 5YR Rolling Avg) Performance Range Linear (Last 12 Years, 5YR Rolling Avg)
Figure 12.
20Emphasis Area: Roadway Departure
Overview
Roadway departure collisions involve vehicles leaving the travel lane and encroaching into
the opposite lanes or onto the shoulder and roadside environment. The result of this
maneuver is that the vehicle hits an oncoming vehicle or fixed object(s) such as trees, poles,
bridge walls, piers, or columns, embankments, or guardrails. Some of the top contributing
factors for roadway departure fatal- or severe- injury collisions include driver distraction
or inattention, excessive speed, driving under the influence, and driving on the wrong side
or the wrong way on a road.
Maintaining a proper clear zone is the first priority for engineering improvements. Clear
zones allow enough area for drivers to recover when departing from the travel lane.
Additional improvements, such as installing edge line and centerline rumble strips,
improving shoulders, and removing or shielding hazards may prevent roadway departure
collisions or lessen their severity.
Our Challenge
Roadway departure collisions accounted for approximately 43% of all fatal and severe
injury collisions in South Carolina from 2008-2012, resulting in more than 2,100 fatalities
and 6,400 severely injured persons (Figure 13). Nearly one in two roadway deaths and one
in three severe injuries occurred in a roadway departure collision. While the number of
severe injuries sustained in these types of collisions decreased 9.9% from 2008 to 2012,
the number of fatalities declined at a slower rate, a 7.5% reduction.
Roadway Departure Fatalities and Severe Injuries
2008-2012 Fatalities Severe Injuries
480 1,400
460 1,350
440
1,300
420
1,250
400
1,200
380
360 1,150
340 1,100
2008 2009 2010 2011 2012
Severe Injuries 1384 1311 1287 1208 1247
Fatalities 456 460 393 402 422
Figure 13.
21As seen in Figure 14 below, more than half of the roadway departure collisions occurred on
rural roads (59%), compared to 26% that occurred on urban roads.
Roadway Departure Fatalities and Severe Injuries
By Federal Route Classification, 2008-2012
15%
Rural Total
26%
59%
Urban Total
Unclassified
Figure 14.
When a vehicle is involved in a roadway departure, a sequence of events occurred prior to
that vehicle leaving the roadway. Figure 15 below represents the top events, or actions,
made by a vehicle after it departed the roadway. A collision with a fixed object far exceeds
any other event, at 63% of the total fatal and severe injury collisions.
Roadway Departure Fatal and Severe Injury Collisions
By Top Events, 2008-2012
2% Fixed Object *
2% 1%
14%
Vehicle v. Vehicle
Overturn
Spill (2 wheel veh)
18% 63%
Other
Cross Median/Center Lane
Figure 15. *see Figure 16 for breakout.
Fixed objects include items such as trees, ditches, fences, bridge rails, guardrails, and curbs.
From 2008 to 2012, hitting trees accounted for nearly 40% of all fatal and severe injury
collisions that involved hitting fixed objects (Figure 16).
22Roadway Departure Fatal and Severe Injury Collisions
Hitting a Fixed Object, 2008-2012
2% 1% 0% 0% 0% Tree
1% 0%
2% 2% Ditch
2% Collision w/ Other Fixed Obj
3%
Embankment
Culvert
4% Mail Box
38%
Guardrail Face
4%
Fence
Curb
8% Highway Traffic Sign Post
Median Barrier
Guardrail End
8% Bridge Rail
Bridge Pier or Abutment
22% Bridge Parapet End
Light/Luminare Support
Bridge Overhead Structure
Figure 16.
23Our Goal
Roadway Departure Fatalities, 2001-2017
700
600
567
558
552
547
500
517
y = -20.588x + 605.92
480
459
400
427
403
379
300 356
332
308
200
100
0
01-05
02-06
03-07
04-08
05-09
06-10
07-11
08-12
09-13
10-14
11-15
12-16
13-17
Fatalities TZ Goal (From 5YR Rolling Avg) Performance Range Linear (Last 12 Years, 5YR Rolling Avg)
Figure 17. In order to meet the Target Zero benchmark of 308 roadway departure fatalities
by 2017, fatalities must be reduced by an average of 24 per year.
Roadway Departure Severe Injuries, 2001-2017
1600
1400
y = -6.3238x + 1359.6
1351
1343
1343
1341
1337
1333
1313
1200
1287
1216
1144
1000 1073
1001
800 930
600
400
200
0
01-05
02-06
03-07
04-08
05-09
06-10
07-11
08-12
09-13
10-14
11-15
12-16
13-17
Severe Injuries TZ Goal (From 5YR Rolling Avg) Performance Range Linear (Last 12 Years, 5YR Rolling Avg)
Figure 18. In order to reach the Target Zero benchmark of 930 roadway departure severe
injuries by 2017, severe injuries must be reduced by an average of 72 per year.
24Roadway Departure Collision Objectives & Strategies
Implementation
Objectives (What) Strategies (How) Area(s)
1. Minimize the adverse 1.1 Provide proper clear zone. Engineering
consequences of leaving 1.2 Improve median cross-slope and/or Engineering
the roadway by improving install barriers where left side roadway
the roadside. departure crashes occur.
2. Reduce the likelihood of 2.1 Deploy centerline and edge line Engineering
vehicles leaving the travel rumble strips.
lane(s) at high-crash/risk 2.2 Maintain shoulders to reduce debris Engineering
locations by improving the and edge drop-offs; use safety edge
roadway. (i.e., pavement edge taper); identify
opportunities to upgrade or improve
shoulders to provide additional
recovery area for vehicles that leave
the roadway.
2.3 Expand the use of and maintain Engineering
existing roadway delineation and
visibility features, which include
geometric alignment pavement
markings, raised markers, signs, and
other devices.
3. Reduce the number of 3.1 Perform targeted enforcement with an Enforcement
crashes involving impaired emphasis on speed and DUI on roads
and/or speeding drivers. with a high percentage of roadway
departure crashes.
3.2 Utilize Law Enforcement Networks to Enforcement
conduct briefings with local law
enforcement agencies with high-risk
rural roads in their jurisdictions.
4. Educate roadway users to 4.1 Educate roadway users on proper Education
understand the recovery once a vehicle leaves the
contributing factors in roadway; utilize media, community
roadway departure resource officers, websites, etc., to
crashes. increase awareness of the dynamics of
roadway departure crashes to the
public.
25Roadway Departure Collision Objectives & Strategies
Implementation
Objectives (What) Strategies (How) Area(s)
4. Educate roadway users to 4.2 Work collaboratively with partner Education
understand the agencies and others to integrate new
contributing factors in content into the driver education
roadway departure curriculum and the driver manual.
crashes. 4.3 Raise awareness about the dynamics Education
of texting and other distractions while
driving by sharing effective messages
with all safety partners.
5. Improve incident response. 5.1 Improve emergency response times to Emergency
rural crash locations. Response
5.2 Work with state and local fire, EMS, Education,
law enforcement, and incident Engineering,
response personnel to identify Emergency
opportunities for reducing secondary Response
crashes through coordinated incident
response.
26Emphasis Area: Unrestrained Motor Vehicle Occupants
Overview
The combination of air bags and lap and shoulder safety belts offers the most effective
safety protection available for passenger vehicle occupants. Research has found that
lap/shoulder seat belts, when used, reduce the risk of moderate-to-critical injury by 50
percent. This percentage is even higher for occupants of light trucks with a 60% reduction
in the risk of fatal injury and 65% in moderate-to-critical injury. 2
While nationwide seat belt use was at a record high of 86% in 2012, 52 percent of fatally
injured motor vehicle occupants nationwide whose restraint use was known were
unrestrained at the time of the crash. NHTSA estimates that seat belts saved 11,949 lives
for occupants age 5 and older in 2011; however, if all passenger vehicle occupants age 5
and older had worn seat belts, an additional 3,384 lives could have been saved. 3
The State of South Carolina has seen a steady increase in statewide safety belt use rates
since the passage and enactment of a primary safety belt law, from 69.7% in 2005 to 90.5%
in 2012. South Carolina’s observed seat belt usage rate was lower than the national rate for
2008 and 2009, but edged slightly higher in 2010 and 2011, and by 2012 was 4.5
percentage points higher than the national average rate. As seen in Figure 19 below,
observed seat belt use rates in South Carolina ranged from 79.5% (2008) to 90.5% in 2012.
South Carolina survey results, certified by NHTSA, indicated an increase in the observed
seatbelt use rate in 2013 to a historic high of 91.7%. The national rate during the 2008-
2011 time period ranged from a low of 83% in 2008 to a high of 86% in 2012.
Observed Seat Belt Use
2008-2012
92.0%
90.0%
88.0%
86.0%
84.0%
82.0%
80.0%
78.0%
76.0%
74.0%
2008 2009 2010 2011 2012
SC 79.5% 81.5% 85.4% 86.0% 90.5%
National 83.0% 84.0% 85.0% 84.0% 86.0%
2 NHTSA Traffic Safety Facts, 2011 Data, Occupant Protection, DOT HS 811 729, June 2013, p. 4.
3 NHTSA Traffic Safety Facts, 2011 Data, Occupant Protection, DOT HS 811 729, June 2013, p. 1.
Figure 19.
27Our Challenge
Unrestrained motor vehicle occupants killed on South Carolina roads from 2008 to2012
totaled 1,723, just over 50% of the total number of occupant fatalities. There were 3,469
unbelted vehicle occupants severely injured during the same time period (see Figure 20).
Unrestrained Motor Vehicle Occupant Fatalities and Severe Injuries
2008-2012
Fatalities Severe Injuries
450 900
400 800
350 700
300 600
250 500
200 400
150 300
100 200
50 100
0 0
2008 2009 2010 2011 2012
Severe Injuries 824 716 690 591 648
Fatalities 422 386 315 272 328
Figure 20.
Unrestrained Motor Vehicle Occupant Fatalities and Severe Injuries
By Age and Gender, 2008-2012
940
1000
900
712
800
Number of Occupants
700
525
600
503
463
500
400
290
273
244
235
219
300
175
114
200
104
101
100
64
45
100
38
0
0-14 15-19 20-24 25-34 35-44 45-54 55-64 65-74 75+
Male Female
Figure 21.
28Rear seat occupants were unrestrained in more than half of the fatal and severe injury
collisions from 2008 to 2012, while drivers were unrestrained 32.9% of the time, only
slightly higher than front seat passengers at 32.4%.
Unrestrained Motor Vehicle Occupant Fatalities and Severe Injuries
By Seating Location, 2008-2012
Figure 22.
Pickup truck drivers involved in fatal and severe injury crashes were found to be least
likely of all drivers to wear a lap/shoulder belt. Truck tractor drivers involved in fatal and
severe injury collisions were unrestrained in 23% of the collisions, significantly lower than
the state average of 55.5% (see Figure 23).
As seen in Table 3 below, a greater percentage of motor vehicle occupants who died in
traffic collisions were unrestrained compared to those severely injured. On average, 55.5%
of persons fatally injured in traffic collisions who had access to restraints were unbelted.
Far fewer occupants who suffered severe injuries were unbelted, at 26.6%.
Table 3. Unrestrained Motor Vehicle Occupants
Year Fatalities Severe Injuries
2008 62.3% 30.4%
2009 56.5% 26.2%
2010 52.8% 25.8%
2011 47.7% 24.1%
2012 56.9% 26.4%
Average 55.5% 26.6%
29Unrestrained Motor Vehicle Occupant Fatalities and Severe Injuries
By Unit Type, 2008-2012
Percentage of Unrestrained MV Occupants by Unit Type
(Fatally or Severely Injuried)
Truck Tractor
Other Truck (box/panel
truck)
Car
Van
SUV
Pickup
0.0% 10.0% 20.0% 30.0% 40.0% 50.0%
Note: Percent unrestrained in each unit, therefore percentages will total more than 100%.
Figure 23.
30Our Goal
Unrestrained Motor Vehicle Occupant Fatalities, 2001-2017
700
600
500
547
537
531
514
469
400
419
y = -30.81x + 605.99
378
300
345
325
306
287
200 268
249
100
0
01-05
02-06
03-07
04-08
05-09
06-10
07-11
08-12
09-13
10-14
11-15
12-16
13-17
Fatalities TZ Goal (From 5YR Rolling Avg) Performance Range Linear (Last 12 Years, 5YR Rolling Avg)
Figure 24. In order to reach the Target Zero benchmark of 249 unrestrained occupant
fatalities by 2017, unrestrained occupant fatalities must be reduced by an average of 19 per
year.
Unrestrained Motor Vehicle Occupant Severe Injuries, 2001-2017
1400
1200
1286
1217
1151
1000
1062
962
800
845
765
694
600
655
617
578
540
400 501
y = -88.429x + 1395.6
200
0
01-05
02-06
03-07
04-08
05-09
06-10
07-11
08-12
09-13
10-14
11-15
12-16
13-17
Severe Injuries TZ Goal (From 5YR Rolling Avg) Peformance Range Linear (Last 12 Years, 5YR Rolling Avg)
Figure 25. In order to reach the Target Zero benchmark of 501 unrestrained occupant severe
injuries by 2017, severe injuries must be reduced by an average of 39 per year.
31Unrestrained Motor Vehicle Occupant Objectives & Strategies
Implementation
Objectives (What) Strategies (How) Area(s)
1. Educate the public on the 1.1 Use variable message boards and signs Engineering,
importance of using safety during stepped-up occupant Education
belts. protection enforcement campaigns
(e.g., Buckle Up, South Carolina).
1.2 Identify high-risk population groups or Education
vehicle types to develop an
educational campaign about the risks
of not wearing safety belts.
2. Conduct high-visibility 2.1 Continue and enhance high-visibility Enforcement,
safety belt enforcement campaigns. Education
campaigns to maximize 2.2 Encourage law enforcement to Enforcement
restraint use. conduct occupant protection
enforcement activities at identified
high-crash locations and times,
including nighttime safety belt
enforcement.
2.3 Continue to support national, regional, Enforcement,
and state occupant protection Emergency
enforcement and public information Response
and education campaigns (e.g., Buckle
Up, South Carolina, Child Passenger
Safety Week, etc.).
3. Improve child occupant 3.1 Continue to provide community Education
protection through locations for instruction in proper child
education, outreach, and restraint use, including both public
enforcement. safety agencies and health care
providers.
3.2 Increase the number of child Education
passenger safety fitting stations and
certified technicians. Publicize child
restraint inspection events statewide.
32Emphasis Area: Age-Related
Young (15-24) Drivers
Overview
Motor vehicle crashes are the leading cause of death for young people ages 15-24 in South
Carolina. Drivers in this age group have the highest crash rate and the highest rates of
speeding, impaired driving, and distracted driving of any driver age group in the state.
Although making up only 14.9% of licensed South Carolina drivers, young drivers were
involved in 22.9% of fatal and severe injury crashes from 2008 to2012.
From 2008 to 2012, 21% of all traffic fatalities involved a young driver aged 15-24. In that
same time frame, young drivers were involved in 23% of all severe injury collisions.
Percentage of Drivers Involved in Fatal/Severe Injury Crashes Compared to Percentage of
Licensed Drivers
By Age Group, 2008-2012
16.0%
% of Total Drivers in
14.0% Fatal Crashes
12.0% % of Total Drivers in
Severe Injury Crashes
10.0% % of Total Licensed
Drivers
8.0%
6.0%
4.0%
2.0%
0.0%
Figure 26.
33Table 4. Drivers Involved in Fatal and Severe Injury Collisions
By Age Group and License, 2008-2012
% of Total % of
# Drivers % of Total # Drivers in Drivers in Total
Age in Fatal Drivers in Severe Injury Severe Injury Licensed Licensed
Group Crashes Fatal Crashes Crashes Crashes Drivers Drivers
15-19 482 8.4% 1,948 9.4% 1,085,043 6.5%
20-24 726 12.6% 2,900 14.0% 1,409,076 8.4%
25-29 624 10.9% 2,370 11.5% 1,429,461 8.5%
Our Challenge
Drivers aged 15-24 were involved in 27% of fatal speed-related collisions, compared to
17.5% of 30-39 year olds. Drivers aged 15-24 accounted for 23.5% of all drivers in driving
under the influence of alcohol and/or drugs (DUI) fatal collisions. Additional analysis of
drivers involved in fatal DUI-related crashes revealed an alarming statistic: 7.6% of drivers
in these crashes were aged 15-19, ages at which it is illegal for them to possess or consume
alcohol.
Drivers in the 15-19 and 20-24 age groups were also involved in a higher percentage of
fatal and severe injury collisions in which a contributing factor to the crash was driver
distraction or inattention. Drivers in the 15-19 age group experienced the highest
percentage of involvement in distracted driver-related fatal crashes, with 10.2% of the
total, while drivers in the 20-24 age group experience the highest involvement in distracted
driver-related-severe injury crashes, with 13.7% of the total. Drivers in both age groups
experienced more involvement in both fatal and severe injury distracted driver-related
crashes than any other age group.
Table 5. Distracted/Inattentive Drivers Involved in Fatal and Severe Injury Collisions
By Age Group, 2008-2012
Number of Drivers in Number of Drivers
Age Group Severe Injury Crashes Percentage in Fatal Crashes Percentage
Unknown* 38 1.5% 8 2.2%Table 5 Continued. Distracted/Inattentive Drivers Involved in Fatal and Severe Injury
Collisions
By Age Group, 2008-2012
Number of Drivers in Number of Drivers
Age Group Severe Injury Crashes Percentage in Fatal Crashes Percentage
50-54 196 8.0% 27 7.4%
55-59 169 6.9% 21 5.8%
60-64 136 5.5% 19 5.2%
65-69 76 3.1% 17 4.7%
70-74 59 2.4% 11 3.0%
75-79 35 1.4% 5 1.4%
80-84 28 1.1% 4 1.1%
85-110 18 0.7% 0 0.0%
Total 2460 100.0% 363 100.0%
*Includes Drivers involved in hit and run collisions.
35Our Goal
Young Driver Fatalities, 2001-2017
400
350
334
331
300 328
324
306
y = -13.236x + 361.69
286
250
265
242
200 228
215
201
188
150 174
100
50
0
01-05
02-06
03-07
04-08
05-09
06-10
07-11
08-12
09-13
10-14
11-15
12-16
13-17
Fatalities TZ Goal (From 5YR Rolling Avg) Performance Range Linear (Last 12 Years, 5YR Rolling Avg)
Figure 27. In order to reach the Target Zero benchmark of 174 young driver involved
fatalities by 2017, fatalities must be reduced by an average of 14 per year.
Young Driver Severe Injuries, 2001-2017
1600
1400
1357
1312
1200
1288
1227
1156
1106
1000
1037
y = -55.964x + 1433.4
970
800 916
862
808
754
600 700
400
200
0
01-05
02-06
03-07
04-08
05-09
06-10
07-11
08-12
09-13
10-14
11-15
12-16
13-17
Severe Injuries TZ Goal (From 5YR Rolling Avg) Performance Range Linear (Last 12 Years, 5YR Rolling Avg)
Figure 28. In order to reach the Target Zero benchmark of 700 young driver involved severe
injuries by 2017, severe injuries must be reduced by an average of 54 per year.
36Young Driver-Involved Collision Objectives & Strategies
Implementation
Objectives (What) Strategies (How) Area(s)
1. Increase awareness of 1.1 Develop educational campaign to Education
young driver risk help parents understand driving risk
behaviors. behaviors of young drivers.
1.2 Implement social hosting campaign. Education
1.3 Publicize results of underage Education
enforcement operations as a
deterrent.
1.4 Enforce zero-tolerance policies for Enforcement
underage driving and drug use.
1.5 Continue the educational campaign Education
designed for high school students and
their parents.
1.6 Continue to support young driver Education
safety initiatives such as the Alive @
25 program.
2. Foster compliance with 2.1 Equip officers with information that Enforcement
the State's Graduated will allow them to enforce the state's
Drivers Licensing (GDL) GDL laws in the context of regular
Laws. and stepped-up enforcement
checkpoints.
3. Reduce crashes along 3.1 Review driving routes to schools to Engineering
routes used by young identify high crash corridors.
drivers to get to school. 3.2 Develop and implement a program to Engineering
reduce roadway departure and
intersection crashes along identified
corridors.
37Older Driver Involved
Overview
Although age itself does not determine driving capabilities, older drivers can experience
declines in their sensory, cognitive, or physical functioning, which could negatively impact
their driving and may increase their risk of involvement in traffic collisions. In South
Carolina, from 2008 to 2012, older drivers (defined as 65 or more years of age) were
involved in 13.9% of all traffic fatalities.
Older Driver-Involved Fatalities and Severe Injuries
2008-2012
600
500 452 465
434
400 381 388
300
200 136
123 123 109 127
100
0
2008 2009 2010 2011 2012
Severe Injuries 381 388 452 434 465
Fatalities 123 123 109 127 136
Figure 29.
Percentage of Drivers Involved in Fatal/Severe Injury Crashes Compared to Percentage of
Licensed Drivers
By Age Group, 2008-2012
16.0%
% of Total Drivers in
14.0% Fatal Crashes
12.0% % of Total Drivers in
Severe Injury Crashes
10.0% % of Total Licensed
Drivers
8.0%
6.0%
4.0%
2.0%
0.0%
Figure 30.
38Our Challenge
Drivers aged 65 and older were involved in 10.5% of fatal collisions and 8.3% of severe
injury collisions. While the involvement of older drivers in these collisions is less than their
representation in the general driving population, older drivers are more likely to suffer
severe injury or death when involved in a traffic collision.
Table 6. Drivers Involved in Fatal and Severe Injury Collisions
By Age Group and Licensed Drivers, 2008-2012
Number Number
of of Drivers Percentage of Number Percentage
Drivers Percentage of in Severe Total Drivers in of of Total
in Fatal Total Drivers in Injury Severe Injury Licensed Licensed
Age Group Crashes Fatal Crashes Crashes Crashes Drivers Drivers
65-69 203 3.5% 678 3.3% 1,047,373 6.2%
70-74 156 2.7% 418 2.0% 727,575 4.3%
75-79 116 2.0% 282 1.4% 505,187 3.0%
80-84 73 1.3% 198 1.0% 327,173 1.9%
85-110 59 1.0% 116 0.6% 217,530 1.3%
Total 607 10.5% 1,692 8.3% 2,824,838 16.7%
Drivers aged 65 or older are more likely than their younger counterparts to be involved in
fatal or severe injury collisions that occur at intersections, 40.2% versus 26.4%. Table 7
below depicts the differences in junction type associated with fatal and severe injury
collisions in the two age groups.
Table 7. Fatal and Severe Injury Collisions
By Junction Type and Age Group, 2008-2012
Junction Type 65
Non-Junction 48.3% 64.5%
Intersection 40.2% 26.4%
Driveway 8.6% 6.4%
Other 2.8% 2.7%
39Our Goal
Older Driver Fatalities, 2001-2017
140
y = -1.6524x + 132.64
132
120
129
128
127
125
122
120
119
113
100 107
100
93
80 87
60
40
20
0
01-05
02-06
03-07
04-08
05-09
06-10
07-11
08-12
09-13
10-14
11-15
12-16
13-17
Fatalities TZ Goal (From 5YR Rolling Avg) Performance Range Linear (Last 12 Years, 5YR Rolling Avg)
Figure 31. In order to reach the Target Zero benchmark of 87 older driver involved fatalities
by 2017, fatalities must be reduced by an average of 7 per year.
Older Driver Severe Injuries, 2001-2017
400
350
364
352
y = -4.2143x + 361.36
350
340
338
333
333
329
300 319
300
250 281
263
244
200
150
100
50
0
01-05
02-06
03-07
04-08
05-09
06-10
07-11
08-12
09-13
10-14
11-15
12-16
13-17
Severe Injuries TZ Goal (From 5YR Rolling Avg) Performance Range Linear (Last 12 Years, 5YR Rolling Avg)
Figure 32. In order to reach the Target Zero benchmark of 244 older driver involved severe
injuries by 2017, severe injuries must be reduced by an average of 19 per year.
40Older Driver-Involved Collision Objectives & Strategies
Implementation
Objectives (What) Strategies (How) Area(s)
1. Identify older drivers at an 1.1 Research additional procedures for Public Policy
elevated risk. screening drivers' abilities and skills.
1.2 Provide training to law enforcement Enforcement,
and medical professionals for Public Policy,
recognizing physical and cognitive Education
deficiencies affecting safe driving in
older drivers, including submitting
reevaluation referrals to the DMV.
1.3 Research Model Driver Screening and Public Policy,
Evaluation Program Guidelines for Education
Motor Vehicle Administrators for
screening and evaluating older drivers'
physical and cognitive abilities and
skills.
2. Plan for an aging 2.1 Establish a broad-based coalition to Education
population. plan for addressing older adults'
transportation needs.
3. Improve the roadway and 3.1 Consider increasing size and letter Engineering
driving environment to height on roadway signs.
better accommodate older 3.2 Provide more protected left-turn signal Engineering
drivers' special needs.
phases at high-volume intersections,
where supported by collision data.
3.3 Consider lighting and other engineering Engineering
countermeasures at intersections,
horizontal curves, and railroad grade
crossings where supported by collision
data.
4 Improve the driving 4.1 Provide education and training Education
competency of older adults opportunities to the general older
in the general driving driver population.
population.
41You can also read