HAWAII 2018 HIGHWAY SAFETY PLAN - HAWAII DEPARTMENT OF TRANSPORTATION MOTOR VEHICLE SAFETY OFFICE HIGHWAY SAFETY SECTION - NHTSA
←
→
Page content transcription
If your browser does not render page correctly, please read the page content below
HAWAII 2018
   HIGHWAY SAFETY
        PLAN

HAWAII DEPARTMENT OF TRANSPORTATION
   MOTOR VEHICLE SAFETY OFFICE
       HIGHWAY SAFETY SECTION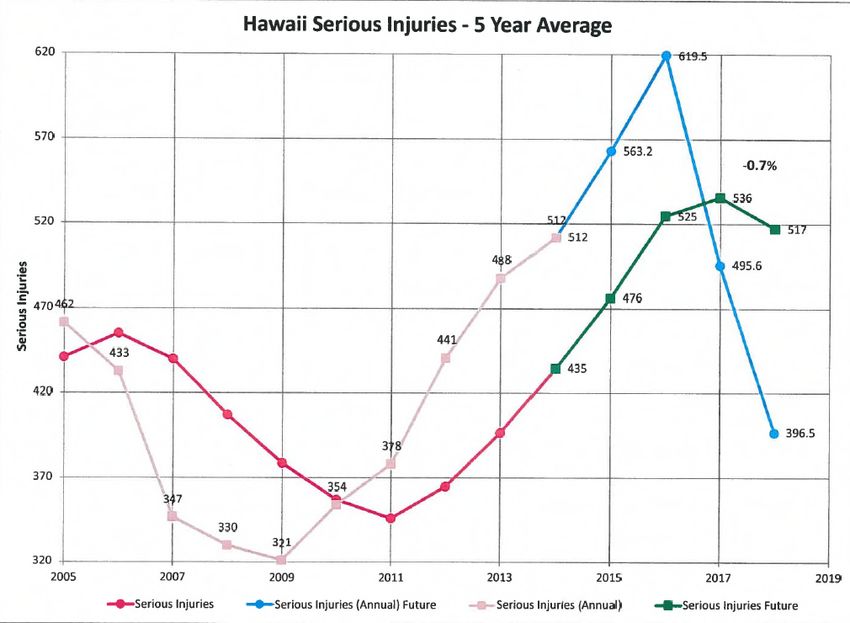
HAWAII
           HIGHWAY SAFETY PLAN
             FEDERAL FISCAL YEAR 2018
                 (October 1, 2017 through September 30, 2018)

                       PREPARED FOR
      U.S. DEPARTMENT OF TRANSPORTATION
NATIONAL HIGHWAY TRAFFIC SAFETY ADMINISTRATION
                       &
     THE FEDERAL HIGHWAY ADMINISTRATION

                         PREPARED BY
                             STATE OF HAWAII
                              David Ige, Governor

                  DEPARTMENT OF TRANSPORTATION
      Ford N. Fuchigami, Director/Governor’s Highway Safety Representative

                      HIGHWAY SAFETY SECTION
                     Lee Nagano, Highway Safety Manager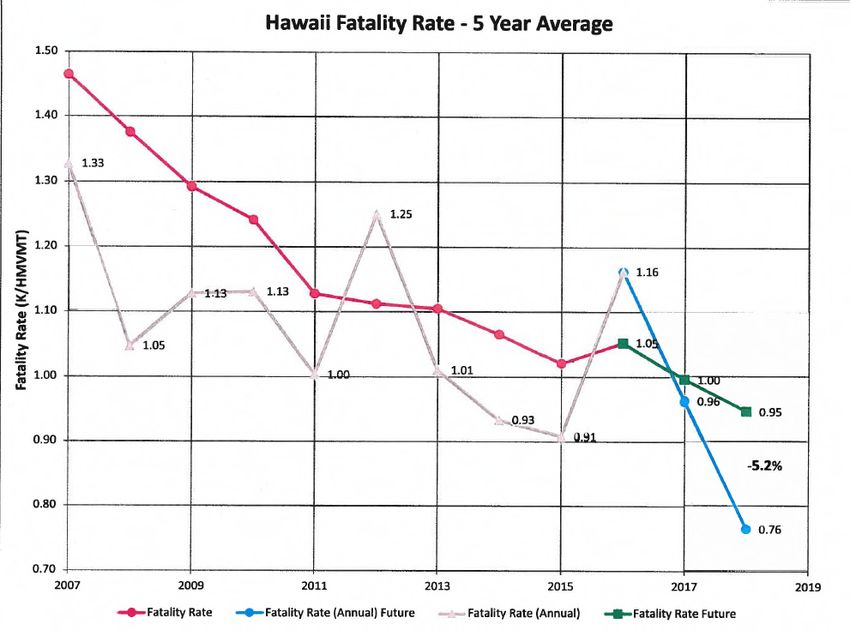
TABLE OF CONTENTS

Background ..............................................................................................    1

21-Year Statistics .....................................................................................     7

Part 1 Executive Summary (Performance Plan)

           Process Description......................................................................          3
           Core Outcome Measures..............................................................                9
           Performance Report .....................................................................          10

Part 2 Program Areas

           Planning and Administration .......................................................               23
           Police Traffic Services.................................................................          25
           Speed Control...............................................................................      29
           Impaired Driving..........................................................................        33
           Traffic Records ............................................................................      42
           Emergency Medical Services.......................................................                 47
           Occupant Protection.....................................................................          49
           Motorcycle Safety........................................................................         56
           Graduated Driver Licensing.........................................................               59
           Pedestrian and Bicycle Safety......................................................               61
           Distracted Driving........................................................................        66

Part 3 Equipment Request & Program Cost Summary

           Equipment Request ......................................................................          70
           HSP-01.........................................................................................   72
BACKGROUND
The Governors of all states are mandated by federal law 23 U.S.C. 402 to establish and
implement a statewide highway safety program. Hawaii Revised Statutes (HRS)
delegates this authority to the Director of Transportation as the Governor’s Highway
Safety Representative. The HRS also establishes a State Highway Safety Council to
advise the Director of Transportation on highway safety issues.
To assist states in carrying out the highway safety program, Congress provides annual grants for
highway safety programs designed to reduce traffic crashes and resulting deaths, injuries, and
property damage. A state may use these grant funds only for highway safety purposes; at least
40 percent of these funds are to be used to address local traffic safety problems.
SAFETEA-LU Behavioral Highway Safety Programs
Sections 2001 and 2002 of SAFETEA-LU reauthorize the State and Community Highway Safety
formula grant program (Section 402 of Chapter 4 of Title 23) to support state highway safety
programs. In addition, there are incentive grants to states that meet certain requirements,
including Sections 405, 408, 410, 2010 and 2011. The grants support planning to identify and
quantify highway safety problems, provide start up “seed” money for new programs, and give
new direction to existing safety programs. The funds are intended to catalyze innovative
programs and partnerships at the state and local level.
Section 402
State and Community Highway Safety Grant Program
Section 405
Restricted to seat belt projects
Section 408
Restricted to traffic data projects
Section 410
Restricted to alcohol projects
Section 2010
Restricted to motorcycle projects
Section 2011
Restricted to child safety seat projects
MAP-21 Behavioral Highway Safety Programs
Moving Ahead for Progress in the 21st Century (MAP-21) is the surface transportation bill that
authorizes the federal surface transportation programs – including highway safety programs – for
Federal Fiscal Years (FFY) 2013, 2014, 2015 and 2016. It provides guidelines and criteria for
grant distribution. The federal fiscal year runs from October 1 through September 30.
1
The following is a list of federal highway safety programs authorized under MAP-21:
Section 402
State and Community Highway Safety Grant Program
Section 405
National Priority Safety Program
Includes sub-sections for:
o Impaired Driving
o Occupant Protection
o Traffic Records
o Motorcyclist Safety
o Distracted Driving
o Graduated Driver Licensing
Section 154
Open Container Transfer Provision
Section 164
Repeat Offender Transfer Provision
FAST Act Behavioral Highway Safety Programs
Fixing America’s Surface Transportation (FAST) Act is the surface transportation bill that
authorizes the federal surface transportation programs – including highway safety programs. It
provides guidelines and criteria for grant distribution.
HDOT is currently operating under the FAST Act. The following is a list of federal highway
safety programs authorized under the FAST Act:
Section 402
State and Community Highway Safety Grant Program
Section 405
National Priority Safety Program
Includes sub-sections for:
o Impaired Driving
o Occupant Protection
o Traffic Records
o Motorcyclist Safety
o Distracted Driving
o Graduated Driver Licensing
Section 154
Open Container Transfer Provision
Section 164
Repeat Offender Transfer Provision
Hawaii expects to receive an estimated $3.5 million (FAST Act) in highway safety grants in
Federal Fiscal Year 2018, October 1, 2017 to September 30, 2018. Additionally, Hawaii expects
to carry forward approximately $1 million in SAFETEA-LU funds and $2 million in MAP-21
funds.
2
HAWAII’S HIGHWAY SAFETY PLANNING PROCESS
Beginning with the 2010 Highway Safety Plan (HSP), NHTSA and the Governors Highway
Safety Association (GHSA) have agreed upon a minimum set of performance measures to be
used by states and federal agencies in the development and implementation of behavioral
highway safety plans and programs. An expert panel from NHTSA; State Highway Safety
Offices; academic and research organizations; and other key groups assisted in developing the
measures. The initial minimum set contains 14 measures: 10 core outcome measures, one core
behavior measure, and three activity measures. States are required to set goals for and report
progress on each of the 11 core outcomes and behavior measures annually, beginning with their
2010 Highway Safety Plans and Annual Reports. NHTSA will use the core measures as an
integral part of its reporting to the Congress, the public and others. Hawaii’s core measures and
performance goals are presented throughout this HSP.

Planning Process

Using a data-driven problem identification process, we have determined that impaired driving,
speeding, occupant protection, pedestrian safety and motorcycle safety continue to be our top
priority areas in FFY 2018. Consequently, projects that address those areas have been given
precedence. We believe that the projects we have chosen best align with our goals for each of
our performance measures and will reduce the number of fatalities and injuries caused by motor
vehicle crashes in Hawaii.

Additionally, the HDOT followed its evidence-based traffic safety enforcement plan to
determine where enforcement was needed the most. That plan, which is based on analysis of
crash and citation data provided by the four county police departments helps us focus
enforcement and efforts in high-risk areas. It also outlined strategies and initiatives to prevent
crashes, fatalities and injuries in locations most at risk, with emphasis on priority program areas.

HDOT will monitor the effectiveness of the enforcement activity and make adjustments as
warranted by data and update countermeasure strategies as applicable.

PROCESS DESCRIPTION
During calendar year 2015, the number of traffic fatalities decreased from 95 in calendar year
2014 to 93, a 2.1 percent decrease. Alcohol, speed, motorcyclists and pedestrians continued to
be major factors in the high fatality rate.

In FFY 2018, Hawaii will continue to focus on reducing its fatal crashes in six high priority areas
that have been identified as the greatest areas of concern. The state will concentrate its
education, enforcement and engineering efforts in these areas, utilizing a variety of
countermeasures to address the problems.

                                                 3
HIGHEST PRIORITY
The Highway Safety Office has studied both Hawaii’s fatality and enforcement data to identify
the statewide problem areas in highway safety. Data that was reviewed came from the Fatality
Analysis Reporting System (FARS); state motor vehicle crash report data; enforcement data
from the county police departments; motor vehicle registration and driver license information;
and population data.
The areas below have been identified as the most critical problem areas in highway safety in
Hawaii, and grants to selected projects in these areas were given priority:
Programs to reduce the number of driving while intoxicated violations
Programs to enforce traffic laws in the areas of speed, occupant protection and
alcohol/drugs
Programs to reduce motorcycle crashes
Programs to reduce pedestrian injuries and fatalities for persons of all ages
Programs to increase the use of seat belts, especially between 9 p.m. – 3 a.m.
Programs to modernize Hawaii’s traffic records systems
LOWER PRIORITY
If federal monies are available after the highest priority projects have been funded, projects in the
following areas will be considered:
Reduce distracted driving
Programs to increase use of child safety seats (including booster)
Programs to reduce bicycle crashes
Equipment requests by first responders
All of the safety projects funded in Federal Fiscal Year 2018 are targeted to these key programs.
Once the priorities were set, the Highway Safety Office issued a Request for Proposals (RFP) in
February 2017, inviting interested agencies and traffic safety groups to propose countermeasures.
To simplify the process, the RFP included data in each priority area and requested solutions on
how to help reduce injuries and fatalities. Applicants were requested to identify specific
problems within their communities using data, develop their solutions and provide us with a
quantifiable evaluation to show effectiveness of their programs. Copies of the RFP were
mailed/emailed to all previous subgrantees and those who requested copies. Additionally, the
RFP was posted on the State’s procurement website.
A total of 53 proposals were received by the Highway Safety Office. Proposals that did not
support strategies within Hawaii’s Strategic Highway Safety Plan (SHSP) were not considered
for funding. The remaining proposals were compiled and submitted to the County Traffic Safety
Councils on each island for their review and ranking, based on the needs of that island.
The County Traffic Safety Councils in each of the four counties are established under Section
286-6, Hawaii Revised Statutes. Each council consists of not more than 15 other persons
4residing in the county who shall be appointed by the mayor based on their interest in highway
safety and their knowledge of local conditions. In addition, the following or their designated
representatives are also members of the County Traffic Safety Council:
Mayor
Chief of Police
Prosecuting Attorney
Corporation Counsel or County Attorney
Traffic Engineer
Chairperson of the Traffic Commission or Safety Program Coordinator
Once the County Traffic Safety Councils’ information was received, the SHSP Core Committee
met and reviewed the proposals and provided recommendations to the Highway Safety Office,
who made the final decision on which projects should be funded. The SHSP Core Committee
includes representatives from the following agencies:
Department of Health
PATH (Peoples Advocacy for Trails Hawaii)
Wilcox Memorial
HDOT’s Traffic Safety Section
HDOT’s Statewide Transportation Planning Office
Maui Police Department
Child Passenger Safety Advocate (Maui)
Child Passenger Safety Advocate (Hawaii County)
Federal Highways Administration
Department of Transportation Services (City and County of Honolulu)
Hawaii County Fire Department
Health Outcomes (Hawaii County)
Federal Motor Carrier Safety Administration
The Governor’s Highway Safety Representative also reviewed the proposals and approved the
recommendations made by the Highway Safety Office.
After Hawaii’s Highway Safety Plan has been officially approved by NHTSA Region 9, the
Highway Safety Office will release approved grant agreements so that grant activities may begin
on October 1, 2017. A mandatory orientation meeting is scheduled for all new subgrantees to
review the grant process, including how to submit requests for reimbursements, project
monitoring and reporting requirements.
5PART 1
EXECUTIVE SUMMARY
(PERFORMANCE PLAN)
621-YEAR STATISTICS
Hawaii Summary of Traffic Demographics and Fatalities, 1995-2015
Vehicle
Miles Alcohol
Licensed Registered TraveledTraffic Fatality Involved Alcohol
Year Population Drivers Vehicles (Million) Fatalities Rate Fatalities Involved
1995 1,196,854 732,508 901,291 7,944.1 130 1.6 64 49.2%
1996 1,203,755 733,486 907,770 8,005.9 148 1.8 62 41.9%
1997 1,211,640 738,865 906,964 8,003.0 131 1.6 57 43.5%
1998 1,215,233 746,329 915,753 8,090.2 120 1.5 61 50.8%
1999 1,210,300 752,693 929,474 8,215.2 98 1.2 42
2000 1,213,519 769,383 964,738 8,525.7 132 1.5 50 37.9%
2001 1,225,948 787,820 986.555 8,754.3 140 1.6 53 37.9%
2002 1,239,613 814,668 1,013,594 8,937.3 119 1.3 45 37.8%
2003 1,251,154 834,188 1,057,625 9,325.0 133 1.4 71 53.4%
2004 1,273,569 843,876 1,100,646 9,734.6 142 1.6 60 42.3%
2005 1,292,729 856,163 1,149,403 10,129.1 140 1.4 67 47.9%
2006 1,309,731 867,003 1,159,256 10,196.3 161 1.6 79 49.1%
2007 1,315,675 882,466 1,167,240 10,259.9 138 1.3 69 50.0%
2008 1,332,213 895,941 1,160,643 10,189.1 107 1.0 42* 39.3%
2009 1,346,717 905,704 1,149,928 10,095.2 109 1.1 52* 47.7%
2010 1,363,950 911,417 1,151,681 10,111.0 113 1.1 43* 38%
2011 1,378,251 915,033 1,210,370 10,653.9 100 .99 45* 45%
2012 1,392,766 910,265 1,310,286 11,517.7 125 1.2 47* 38%
2013 1,408,987 904,500 1,371,341 12,078.2 102 1.0 34* 33%
2014 1,419,561 902,590 1,312,445 11,569.4 95 .93 30* 32%
2015 1,431,603 918,768 1,261,343 10,301.0 93 .91 33* 35%
*BAC .08+
72003 to 2016 Hawaii Traffic Fatality (by type)
161
142 140 138
133
125
120
109 113
107
100 102
94 95 93
85 83
76
69
64
58 54 57 54
42 43 46
36 36 38 37
31 31 32
31 30 33 29 32
28 26 27
26 26 25 28
25 27
26 24
23
19 21 21 23
16
6 7 4 4 4 3 3 4 3
2 2 2 2 0
2003 2004 2005 2006 2007 2008 2009 2010 2011 2012 2013 2014 2015 2016
Motor Vehicle Occupants Pedestrians M/C Mopeds/Scooters
Bicyclists Total Fatalities
The data from 2003-2015 are from FARS. Please note that the 2016 data above is preliminary
state data.
A brief summary of 2015 fatal data showed:
Pedestrians:
Of the 93 traffic fatalities, 27 were pedestrians.
A total of 9, or 33.3 percent, of the pedestrians killed had either alcohol, drugs or a
combination of both in their system. (Drugs were either marijuana or meth).
Of the 27 pedestrian fatalities, 16 or 59.2 percent, were 50 years or older.
Alcohol/Drugs
At least 36, or 38.3 percent, of the fatalities died in alcohol-related traffic crashes.
At least 15, or 16 percent, had only drugs in their system (no alcohol).
At least 51, or 54.8 percent of the fatalities were alcohol and or drug related.
Motorcycle
Motorcyclist fatalities increased from 25 to 26, or 3.8 percent.
Of the 26 motorcycle fatalities, 23 were males.
8CORE OUTCOME MEASURES 2011 2012 2013 2014 2015
C-1* Traffic Fatalities (FARS) Annual 100 125 102 95 93
5-Year Moving Average 113 111 110 107 103
With the guidance and support of the HDOT Administration, our goal is to not exceed a
5-year average of 98 fatalities by 2018.
C-2* Serious Injuries in Traffic Crashes (State Crash File) Annual 378 441 488 512 N/A
5-Year Moving Average 346 365 408 435 N/A
With the guidance and support of the HDOT Administration, our goal is to not exceed the
5-year average of 517 serious injuries by 2018.
C-3* Fatalities/VMT (FARS/FHWA) Annual 0.99 1.24 1.01 0.93 0.91
5-Year Moving Average 1.12 1.10 1.09 1.06 1.02
With the guidance and support of the HDOT Administration, our goal is to not exceed the
5-year average Fatalities /VMT of 0.95 by 2018.
C-4 Unrestrained Passenger Vehicle Occupant Fatalities, All Seat Positions (FARS) Annual 14 31 23 18 15
5-Year Moving Average 24 25 24 22 20
Reduce unrestrained passenger vehicle occupant fatalities, all seat positions by 5 percent
from 20 (2011-2015 average) to 19 by 2018.
C-5 Alcohol-Impaired Driving Fatalities (BAC=.08+) (FARS) Annual 45 47 34 30 33
5-Year Moving Average 45 46 44 40 38
Reduce alcohol-impaired driving fatalities by 3 percent from 38 (2011-2015 average) to 37
by 2018.
C-6 Speeding-Related Fatalities (FARS) Annual 45 69 45 36 40
5-Year Moving Average 54 55 54 49 47
Reduce speeding-related fatalities by 2 percent from 47 (2011-2015 average) to 46 by
2018.
C-7 Motorcyclist Fatalities (FARS) Annual 32 40 29 25 26
5-Year Moving Average 29 32 32 30 30
Reduce motorcyclist fatalities by 3 percent from 30 (2011-2015 average) to 29 by 2018.
C-8 Unhelmeted Motorcyclist Fatalities (FARS) Annual 25 28 19 12 16
5-Year Moving Average 22 23 23 21 20
Reduce unhelmeted motorcyclist fatalities by 5 percent from 20 (2011-2015 average) to
19 by 2018.
C-9 Drivers Age 20 or Younger Involved in Fatal Crashes (FARS) Annual 12 10 9 8 12
5-Year Moving Average 16 14 12 11 10
Reduce fatal crashes involving drivers age 20 and younger by 10 percent from 10 (2011
2015 average) to 9 by 2018.
C-10 Pedestrian Fatalities (FARS) Annual 23 26 23 24 25
5-Year Moving Average 22 322 23 24 24
Reduce pedestrian fatalities by 4 percent from 24 (2011-2015 average) to 23 by 2018.
9C-11 Bicyclist Fatalities (FARS) Annual 2 2 2 4 2
5-Year Moving Average 3 2 2 3 2
Reduce bicyclist fatalities by 50 percent from 2 percent (2011-2015 average) to 1 by 2018.
CORE BEHAVIOR MEASURE 2012 2013 2014 2015 2016
B-1 Observed Seat Belt Use for Passenger Vehicles, Front Seat Annual 93% 94% 94% 93% 94.5%
Outboard Occupants (State Survey)
Increase observed seat belt use for passenger vehicles, front seat outboard occupants by
2 percentage points from 93 percent in 2015 to 95 percent in 2018.
*Safety Target Goals
#Projected number of fatalities
Performance Report
The chart below provides a report of Hawaii’s progress and outcomes on the 11 core
performance measures and the one core behavior measure using FFY 2015 statistics (the most
recent year in which complete and finalized FARS data is available). Hawaii’s FFY 2015
Highway Safety Annual Report can be found on the Hawaii Department of Transportation’s
website at http://hidot.hawaii.gov/highways/safe-communities-annual-report and includes more
detailed information on grant funding distribution, the results of our annual attitudinal survey and
program area highlights.
Overall, Hawaii’s fatality numbers decreased for all core performance measures except C-10
(pedestrian fatalities) and C-11 (bicyclist fatalities), which experienced a 15 percent increase and
35 percent increase, respectively. Hawaii recognizes it is not immune from the national trend of
recent increases in fatal and injury crashes. In order to counteract and reverse this disturbing
trend, the FFY 2018 HSP focuses on proven strategies, evidence-based countermeasures, as well
as new education and enforcement approaches that will provide the greatest impact on saving
lives and reducing serious injuries on Hawaii’s roadways.
102015
Core Performance Measures 5-year Moving Target Improvement Actual Actual Attainment
Average Total Goal Total
C-1 Traffic Fatalities (FARS) 111 100 Reduce by 10.0% 93 Decreased by 16.0%
C-2 Serious Injuries in Traffic 373 354 Decrease by 5.0% N/A N/A
Crashes (State Crash File)
C-3 Fatalities/VMT 1.10 1.0 Reduce by 10.0% 0.91 Decreased by 0.19%
(FARS/FHWA)
C-4 Unrestrained Passenger 25 23 Reduce by 10.0% 15 Decreased by 40.0%
Vehicle Occupant Fatalities,
All Seat Positions (FARS)
C-5 Alcohol-Impaired Driving 46 41 Reduce by 10.0% 33 Decreased by 28.0%
Fatalities (BAC=.08+)
(FARS)
C-6 Speeding-Related Fatalities 55 50 Reduce by 10.0% 40 Decreased by 27.0%
(FARS)
C-7 Motorcyclist Fatalities 32 29 Reduce by 10.0% 26 Decreased by 20.0%
(FARS)
C-8 Unhelmeted Motorcyclist 23 21 Reduce by 10.0% 16 Decreased by 30.0%
Fatalities (FARS)
C-9 Drivers Age 20 or Younger 14 13 Reduce by 10.0% 12 Decreased by 15.0%
Involved in Fatal Crashes
(FARS)
C-10 Pedestrian Fatalities (FARS) 22 20 Reduce by 10.0% 25 Inceased by 15.0%
C-11 Bicyclist Fatalities (FARS) 2 2 Reduce by 10.0% 4 Increased by 35.0%
Core Behavior Measure
B-1 Observed Seat Belt Use 96.39% 97% Increase by 0.5% 94.5% Decreased by 1.9%
for Passenger Vehicles,
Front Seat
Outboard Occupants
(State Survey)
11SAFETY TARGET SETTING
The Hawaii Department of Transportation (HDOT) and its Highway Safety Office have set safety
targets in accordance with 23 CRF Part 490 for the Highway Safety Improvement Program (HSIP)
and 23 CFR Part 1300 for the Highway Safety Plan (HSP). The common performance measures
(23CRF 490.209 (a)(1)) were determined after reviewing multiple sources of data. The safety
targets are being utilized in Hawaii’s FFY 2018 HSIP and HSP.
The performance measures were sent to the Hawaii FHWA Division Office in June 2017.
Safety Target Setting Methodology
In April 2017, representatives from the HDOT, Oahu Metropolitan Planning Organization
(OMPO) and Hawaii State Department of Health (DOH) participated in the Federal Highway
Administration’s (FHWA) Safety Target Setting Coordination and Training Workshop. Through
the workshop, we identified potential data sources and options to set our safety targets.
HDOT, in partnership with OMPO and DOH, established safety targets using a data-driven
methodology and data that was most appropriate for our state. HDOT did consult multiple data
sources before deciding on the following key factors: traffic fatality data (Fatality Analysis
Reporting System and HDOT’s Traffic Accident Reporting System), vehicle miles traveled and the
economy. These key factors were used to establish trend lines and possible factors that may affect
the trend line and annual safety performance targets.
Additionally, representatives from Hawaii’s Strategic Highway Safety Plan (SHSP) core
committee participated in the target setting discussions to ensure that the safety targets aligned
with the SHSP goals.
Saving Lives
HDOT will continue to use a data-driven problem identification process to prioritize our resources.
HDOT and our traffic safety partners remain dedicated to implementing the strategies in our SHSP
to ensure that all roadway users arrive alive.
1213
14
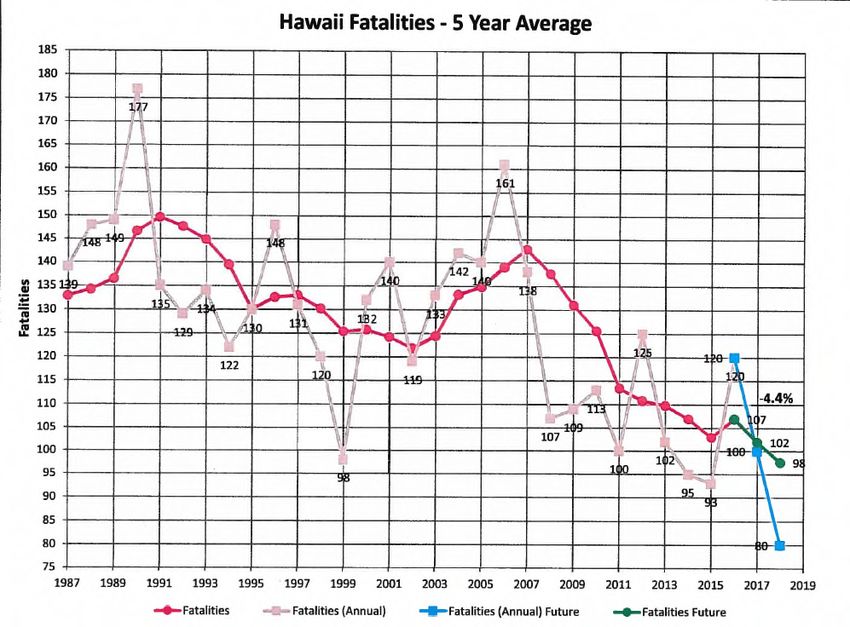
C-1: Traffic Fatalities, 2011-2015
                                       2011      2012       2013   2014     2015
Actual numbers:
Traffic Fatalities                      100       125       102      95       93

Utilizing 5-year moving average:
Traffic Fatalities                      113       111       110     107      103

During 2015, there were 93 motor vehicle fatalities, a 2.1 percent decrease from 2014, the lowest
in 40 years. We will continue to work hard to further reduce Hawaii’s motor vehicle fatalities by
focusing our efforts on impaired driving, speeding, motorcycle and pedestrian safety. With the
guidance and support of the HDOT Administration, our goal is to not exceed a 5-year average of
98 fatalities by 2018. We are heartened that the hard work of the Hawaii Department of
Transportation’s (HDOT) staff and all of our traffic safety partners continues to make a
difference. Given our relatively low annual number of fatalities, it is statistically possible for
anomalies to occur.

C-2: Serious Injuries in Traffic Crashes, 2010-2014*
                                       2010      2011       2012   2013     2014
Actual numbers:
Serious Injuries                        354       378        441    488       512

Utilizing 5-year moving average:
Serious Injuries                        351       346        365    396       435

* A serious injury is defined as: Any injury, other than a fatal injury, which prevents the injured
person from walking, driving or normally continuing the activities the person was capable of
performing before the injury occurred. This is often defined as “needing help from the scene.”

Please note that this is the most current data available.

With the guidance and support of the HDOT Administration, our goal is to not exceed the 5-year
average of 517 serious injuries by 2018. Given our relatively low annual number of serious
injuries, it is statistically possible for anomalies to occur.

                                                 15
C-3: Fatalities/VMT, 2011-2015
2011 2012 2013 2014 2015
Fatality Rates:
Total Fatalities 0.99 1.24 1.01 0.93 0.91
Rural 1.75 2.33 2.23 1.75 0.73
Urban 0.76 0.90 0.75 0.77 0.95
Utilizing 5-year moving average:
Total Fatalities 1.12 1.10 1.09 1.06 1.02
Rural 2.02 1.97 1.93 1.96 1.76
Urban 0.83 0.82 0.85 0.82 0.83
In calendar year 2015, there were 93 motor vehicle fatalities, the lowest in 40 years. The HDOT
will continue to work with our partners to further reduce the number of motor vehicle fatalities.
With the guidance and support of the HDOT Administration, our goal is to not exceed the 5-year
average Fatalities /VMT of 0.95 by 2018.Given our relatively low annual number of fatalities, it
is statistically possible for anomalies to occur.
C-4: Unrestrained Passenger Vehicle Occupant Fatalities, All Seat Positions
2011-2015 (Utilizing 5-year moving average)
2011 2012 2013 2014 2015
Actual numbers:
Number of Unrestrained Passengers 14 31 23 18 15
Vehicle Occupant Fatalities,
All Seat Position
Utilizing 5-year moving average:
Number of Unrestrained Passengers 24 25 24 22 20
Vehicle Occupant Fatalities,
All Seat Positions
During 2015, there were 15 unrestrained motor vehicle occupant fatalities, a 17 percent decrease
from 2014. The HDOT will continue our education, media and enforcement efforts to increase
compliance with Hawaii’s seat belt law. Hawaii’s goal is to reduce unrestrained passenger
vehicle occupant fatalities, all seat positions by 5 percent from 20 (2011-2015 average) to 19 by
2018. Given our relatively low annual number of fatalities, it is statistically possible for
anomalies to occur.
16C-5: Alcohol-Impaired Driving Fatalities, 2011-2015
2011 2012 2013 2014 2015
Actual numbers:
Alcohol-Impaired Fatalities 45 47 34 30 33
Utilizing 5-year moving average:
Alcohol-Impaired Fatalities 45 46 44 40 38
Despite a decrease in the number of traffic fatalities, from 95 in 2014 to 93 in 2015, impaired
driving continues to present a significant problem in Hawaii. The HDOT will continue to work
with our traffic safety partners to conduct statewide educational efforts and high visibility
enforcement. Based on our five-year trendline analysis of Hawaii’s alcohol-impaired fatalities,
our goal is to reduce alcohol-impaired driving fatalities by 3 percent from 38 (2011-2015
average) to 37 by 2018. Given our relatively low annual number of fatalities, it is statistically
possible for anomalies to occur.
C-6: Speeding-Related Fatalities, 2011-2015
2011 2012 2013 2014 2015
Actual numbers:
Number of Speeding-Related 43 69 45 36 40
Fatal Crashes
Number of Speeding-Related 45 69 45 36 40
Fatalities
Speeding Citations* 58,176 69,980 62,604 58,274 64,480
*FFY information provided by local police departments
Utilizing 5-year moving average:
Number of Speeding-Related 54 49 49 45 43
Fatal Crashes
Number of Speeding-Related 54 55 54 49 47
Fatalities (C-6)
Speeding continues to plague Hawaii’s roadways and was a contributing factor in 43 percent of
our traffic-related fatalities in 2015 (40 out of 93 fatalities). During FFY 2018, we will continue
to focus efforts on strict and consistent enforcement of Hawaii’s speeding laws. Based on our
five-year trendline analysis of Hawaii’s speed-related fatalities, our goal is to reduce speeding-
related fatalities by 2 percent from 47 (2011-2015 average) to 46 by 2018. Given our relatively
low annual number of fatalities, it is statistically possible for anomalies to occur.
17C-7: Motorcyclist Fatalities, 2011-2015
2011 2012 2013 2014 2015
Actual numbers:
Number of Motorcyclist Fatalities 32 40 29 25 26
Utilizing 5-year moving average:
Number of Motorcyclist Fatalities 29 32 32 30 30
During calendar year 2015, there were 26 motorcyclist and moped fatalities, a slight increase
from 25 in 2014. As such, motorcycle safety will remain a priority in FFY 2018. Grant funds
will be used for a motorcycle awareness campaign and toward the statewide motorcycle training
program. Based on our five-year trendline analysis of motorcyclist fatalities in Hawaii, our goal
is to reduce motorcyclist fatalities by 3 percent from 30 (2011-2015 average) to 29 by 2018.
Given our relatively low annual number of fatalities, it is statistically possible for anomalies to
occur.
C-8: Unhelmeted Motorcyclist Fatalities, 2011- 2015
2011 2012 2013 2014 2015
Actual numbers:
Number of Unhelmeted 25 28 19 12 16
Motorcyclist Fatalities
Utilizing 5-year moving average:
Number of Unhelmeted 22 23 23 21 20
Motorcyclist Fatalities
Motorcycle Registrations 33,022 38,223 41,180 37,771 32,831
Helmet Use Observation Study
Motorcycle Helmet Use Rate 47.66% 52.61% 52.38% 52.94% 58.89%
Moped Helmet Use Rate 20.28% 25.37% 25.34% 38.97% 16.43%
In addition to reducing motorcycle fatalities, we will continue to emphasize the need to wear
helmets through our motorcyclist rider classes and our media messages. Based on our trendline
analysis of Hawaii’s unhelmeted motorcyclist fatalities, our goal is to reduce unhelmeted
motorcyclist fatalities by 5 percent from 20 (2011-2015 average) to 19 by 2018. Given our
relatively low annual number of fatalities, it is statistically possible for anomalies to occur.
18C-9: Drivers Age 20 or Younger Involved in Fatal Crashes, 2011-2015
2011 2012 2013 2014 2015
Actual numbers:
Number of Drivers 20 or Younger 12 10 9 8 12
Involved in Fatal Crashes
Utilizing 5-year moving average:
Number of Drivers 20 or Younger 16 14 12 11 10
Involved in Fatal Crashes
We believe that our graduated driver’s license law is making a positive impact on the number of
young drivers involved in fatal crashes. The HDOT and our partners will continue to educate
teenagers and novice drivers in hopes of instilling good driving skills. Based on our five-year
trendline analysis of the number of drivers 20 years or younger involved in fatal crashes, our
goal is to reduce fatal crashes involving drivers age 20 and younger by 10 percent from 10
(2011-2015 average) to 9 by 2018. Given our relatively low annual number of fatalities, it is
statistically possible for anomalies to occur.
C-10: Pedestrian Fatalities, 2011-2015
2011 2012 2013 2014 2015
Actual numbers:
Number of Pedestrian Fatalities 23 26 23 24 25
Utilizing 5-year moving average:
Number of Pedestrian Fatalities 22 22 23 24 24
Pedestrian safety remains a top priority as 25 of our 93 (27 percent) motor vehicle fatalities in
2015 were pedestrians. Of the pedestrian fatalities, 16 were 50 years or older and 9 tested
positive for alcohol, drugs or both in their systems. We will continue to work with our traffic
safety partners to conduct statewide educational efforts and high visibility enforcement. Based
on our five-year trendline analysis of Hawaii’s pedestrian fatalities, our goal is to reduce
pedestrian fatalities by 4 percent from 24 (2011-2015 average) to 23 by 2018. Given our
relatively low annual number of fatalities, it is statistically possible for anomalies to occur.
19C-11: Bicyclist Fatalities, 2011-2015
2011 2012 2013 2014 2015
Actual numbers:
Number of Bicyclist Fatalities 2 2 2 4 2
Utilizing 5-year moving average:
Number of Bicyclist Fatalities 3 2 2 3 2
Bicycle Helmet Use Rate 33.02% 37.92% 46.33% 57.45% 58.88%
During calendar year 2015, 2 of our 93 (2 percent) motor vehicle fatalities were bicyclists. As
the number of bicyclists continues to grow, we will work to protect these vulnerable roadway
users through education and enforcement. Based on our five-year trendline analysis of Hawaii’s
bicyclist fatalities, our goal is to reduce bicyclist fatalities by 50 percent from 2 (2011-2015
average) to 1 by 2018. Given our relatively low annual number of fatalities, it is statistically
possible for anomalies to occur.
B-1: Observed Seat Belt Use for Passenger Vehicles, Front Seat Outboard
Occupants in Hawaii, 2012-2016
2012 2013 2014 2015 2016
Actual numbers:
Seat Belt Use Rate 93% 94% 94% 93% 94.5%
(Observational Survey)
The HDOT and our partners are proud to have been able to maintain a seat belt usage rate higher
than 90 percent for more than a decade. Though our seat belt usage rate remains strong, we will
continue to participate in the annual Click It or Ticket campaign. We will also continue our
combination of earned and paid media, education and enforcement year round. Hawaii’s goal is
to increase observed seat belt use for passenger vehicles, front seat outboard occupants by 2
percentage points from 94.5 percent in 2016 to 96.5 percent in 2018.
20Federal Fiscal Year 2018 Highway Safety Plan Summary
Project Title Total To Local
Program Administration $200,000.00 $0.00
Police Traffic Services $627,604.00 $453,234.00
Impaired Driving $3,052,342.61 $1,827,658.91
Traffic Records $1,792,670.00 $501,340.00
Emergency Medical Services $103,000.00 $98,000.00
Occupant Protection $1,140,109.00 $805,109.00
Speed Control $1,113,529.10 $1,053,529.10
Motorcycle Countermeasures $105,407.00 $47,407.00
Graduated Driver’s License $35,000.00 $0.00
Pedestrian/Bicycle Safety $549,419.80 $239,419.80
Distracted Driving $590,736.00 $410,736.00
NHTSA TOTAL $9,334,817.51 $5,436,433.81
Share to Local (percentage) ≈ 58%
Federal Fiscal Year 2018 Section 402 Funds/Share to Local Summary
Program Areas 402 Funds Share To Local
Program Administration $200,000.00 $0.00
Police Traffic Services $627,604.00 $453,234.00
Impaired Driving $103,000.00 $8,000.00
Traffic Records $0.00 $0.00
Emergency Medical Services $103,000.00 $98,000.00
Occupant Protection $392,884.00 $277,884.00
Speed Control $1,113,529.10 $1,053,529.10
Motorcycle Countermeasures $0.00 $0.00
Graduated Driver’s License $0.00 $0.00
Pedestrian/Bicycle Safety $90,000.00 $40,000.00
Distracted Driving $430,736.00 $410,736.00
402 TOTAL $3,060.753.10 $2,341,383.10
Share to Local (percentage) ≈ 76%
21PART II
PROGRAM AREAS
All projects will be funded on the condition that the State of Hawaii Department of
Transportation receives federal appropriations for Federal Fiscal Year 2018.
22PLANNING & ADMINISTRATION
Program Overview
The Planning & Administration (P&A) program area includes those activities and costs
necessary for the overall management and operations of the Highway Safety Office. These
activities include:
Identifying the state’s most significant traffic safety problems;
Prioritizing problems and developing methods for the distribution of funds;
Developing the annual Highway Safety Plan (HSP);
Selecting individual projects to be funded;
Evaluating accomplishments;
Increasing public awareness and community support;
Participating on various traffic safety committees and task forces;
Organizing traffic safety groups;
Coordinating statewide public information and education programs; and
Generally promoting and coordinating traffic safety in Hawaii.
Goals & Performance Measures
The goal is to provide management and support services for the activities necessary to operate
the traffic safety program in the State of Hawaii. The performance goals include:
Develop a coordinated HSP/Performance Plan by July 1, 2017.
Maintain and update, as needed, an evidence-based traffic safety enforcement plan that
outlines strategies and initiatives to prevent traffic violations; crashes; and crash fatalities
and injuries in program areas and locations most at risk for such incidents.
Law enforcement are strongly encouraged to use evidence-based strategies
identified in Countermeasures-That-Work or other best available research such as
high-visibility enforcement, saturation patrols and special operations.
Adjustments may be made to this enforcement plan based upon continuous
evaluation and monitoring of traffic-related data.
Communication and educational elements will be implemented to support
enforcement efforts.
Develop, coordinate, monitor and administratively evaluate traffic safety projects
identified in the plan.
Conduct an active public awareness and community support program during Federal
Fiscal Year (FFY) 2018.
Support highway safety legislation.
Develop the Annual Report for FFY 2018 by December 31, 2018.
Utilize all available means for improving and promoting the Hawaii traffic safety
program.
23Program Administration
FAST Act Section 402
Project Title: Program Administration
1
Project Number: PA18-00 (01-S-01)
Project Goal: To implement the Hawaii Department of Transportation’s traffic safety
program.
Project Description: The funds will be used to administer the highway safety program
for the State of Hawaii. Funds will also be used for travel to meetings and conferences
such as the NHTSA Region 9 Partners Meeting and the Lifesavers Conference.
Project Cost: $135,000.00
$40,000.00 – FAST Act Section 402 FFY 2017 funds
$95,000.00 – FAST Act Section 402 FFY 2018 funds
Project Title: Hawaii Department of Transportation – Fiscal Coordinator
2
Project Number: PA18-00 (02-S-01)
Project Goal: To ensure that all reimbursements are correct and processed in a timely
manner.
Project Description: The funds will be used to continue funding a fiscal coordinator
position to manage the Highway Safety Office’s daily administrative tasks, process grant
agreements and review grant reimbursement requests.
Project Cost: $65,000.00
$40,000.00 – FAST Act Section 402 FFY 2017 funds
$25,000.00 – FAST Act Section 402 FFY 2018 funds
Program Administration Total: $200,000.00
Funding source: FAST Act Section 402 FFY 2017 - $80,000.00
Funding source: FAST Act Section 402 FFY 2018 - $120,000.00
Hawaii Program Administration Summary Sheet
FAST Act Section 402 FFY 2017/2018 Funds
Federal Fiscal Year 2018
PROGRAM ADMINISTRATION FISCAL Allocation
SUMMARY
PA18-00 (01-S-01) HDOT – Program Administration $135,000.00
PA18-00 (02-S-01) HDOT – Fiscal Coordinator $65,000.00
Program Admin Total: $200,000.00
FAST Act Section 402 FFY 2017 Funds $80,000.00
FAST Act Section 402 FFY 2018 Funds $120,000.00
24POLICE TRAFFIC SERVICES
Reducing the amount of time it takes to investigate a crash scene while improving investigation
techniques continues to be a priority for Hawaii’s four county police departments. With
continual and advanced training, the police departments strive to reduce the amount of time the
roads are closed without compromising the integrity of their investigations.
Additionally, continual training is reasonable and necessary due to promotions, transfers and new
hires.
The goal for our Police Traffic Services program is to conduct a minimum of two statewide,
advanced investigation/reconstruction classes.
Police Traffic Services
MAP-21 Section 402; FAST Act Section 402
1 Project Title: Honolulu Police Department Traffic Services
Project Number: PT18-01 (01-O-01)
Project Goal: To improve the accuracy and timeliness of collecting crash scene data by
conducting statewide training for law enforcement officers in highway safety-related
disciplines.
Project Description: The Honolulu Police Department (HPD) will use grant funds to host
three Institute of Police Technology and Management (IPTM) courses on Oahu. Funds will
also be used to send officers to the CDR Summit, ARC-CSI Conference and a motorcycle
enforcement training program. The neighbor island police departments will be participating
in the IPTM courses. Grant funds may be used for related training and equipment purchases
if approved by the Highway Safety Office.
Project Cost: $134,970.00 (FAST Act Section 402 FFY 2018 funds)
2 Project Title: Hawaii County Police Department Traffic Services
Project Number: PT18-01 (02-H-01)
Project Goal: To improve the accuracy and timeliness in collecting crash scene data by
training seven law enforcement officers in highway safety-related disciplines by September
30, 2018.
Project Description: The project will enable the Hawaii County Police Department (HCPD)
to send seven Traffic Enforcement Unit officers to participate in three IPTM courses on
Oahu. HCPD will also use grant funds to purchase two digital SLR cameras for use during
traffic fatality investigations. Grant funds may also be used for related training, travel and
equipment purchases if approved by the Highway Safety Office.
Project Cost: $109,840.00 (FAST Act Section 402 FFY 2018 funds)
253 Project Title: Maui Police Department Traffic Services
Project number: PT18-01 (03-M-01)
Program Goal: To improve the accuracy and timeliness in collecting crash scene data by
training a minimum of two law enforcement officers in highway safety-related disciplines.
Project Description: The project will enable the Maui Police Department (MPD) to send
Traffic officers to participate in the IPTM courses being offered on Oahu. MPD also plans to
send officers to the ARC-CSI Conference, CDR: Train the Trainer/Analyst course, and to
host an ACTAR training. Additionally, funds will be used for CDR hardware updates,
ACTAR software updates, MapScenes software updates and Leica ScanStation updates.
Grant funds may be used for related training, travel and equipment purchases if approved by
the Highway Safety Office.
Project Cost: $105,600.00 (FAST Act Section 402 FFY 2018 funds)
Project Title: Kauai Police Department Traffic Services
4
Project Number: PT18-01 (04-K-01)
Program Goal: To improve the accuracy and timeliness in collecting crash scene data by
training two law enforcement officers in highway safety-related disciplines by September 30,
2018.
Project Description: The project will enable the Kauai Police Department to send Traffic
officers to participate in the three IPTM courses being offered on Oahu. KPD will also send
two officers to the “Motor Vehicle Traffic Collision Investigation Training” that is hosted by
the Riverside County Sheriff’s Department. Funds will also be used to purchase a MSAB
forensic cellular phone extraction equipment/software, MapScenes CAD software and
Cyclone Image software. Grant funds may be used for related training and equipment
purchases if approved by the Highway Safety Office.
Project Cost: $102,824.00 (FAST Act Section 402 FFY 2018 funds)
Project Title: Traffic Safety Community/NHTSA Law Enforcement Liaison
5
Project Number: PT18-01 (05-S-01)
Program Goal: To improve communication between the four county police departments by
coordinating a minimum of four Traffic Commanders meetings.
Project Description: The funds will be used to fund a Traffic Safety Community/Law
Enforcement Liaison (LEL) position to develop stronger grassroots support for traffic safety
initiatives and to coordinate quarterly meetings and training with the four county police
departments. The liaison’s main responsibility is to oversee all aspects of Hawaii’s ignition
interlock program. He also chairs the Hawaii Traffic Records Coordinating Committee and
Impaired Driving Task Force. Funds will also be used to send the LEL to the Lifesavers
Conference, NHTSA Region 9 Partners Meeting, and GHSA Annual Meeting and Executive
Board meetings. Grant funds may be used for traffic safety-related training, travel and
equipment purchases if approved by the Highway Safety Office.
Project Cost: $88,440.00 (MAP-21 Section 402 FFY 2016 funds)
26Project Title: Traffic Safety Liaison
6
Project Number: PT18-01 (06-S-01)
Program Goal: To assist the Department of Transportation’s Highway Safety Section staff
with implementing the e-citation program, legislation and driver’s license compliance issues.
Project Description: Grant funds will be used to hire a part-time staff member to assist with
facilitating communication between State and County partners to: implement a statewide e-
citation program; coordinate efforts in addressing ignition interlock driver’s licensing issues
with the Judiciary; out-of-state driver’s licensing issues regarding ignition interlock
reciprocity; assist with traffic safety legislation; and driver’s license compliance
issues/requirements relating to issues such as distracted driving, graduated driving, etc. Funds
will also be utilized for travel to the annual AAMVA conference. Grant funds may be used
for traffic safety-related training, travel and equipment purchases if approved by the Highway
Safety Office.
Project Cost: $50,000.00
$20,000.00 - FAST Act Section 402 FFY 2017 funds
$30,000.00 – FAST Act Section 402 FFY 2018 funds
Project Title: Hawaii Department of Transportation – Traffic Branch Lifesavers
7
Conference
Project Number: PT18-01 (07-S-01)
Project Goal: To send a representative from the Hawaii Department of Transportation’s
(HDOT) Traffic Branch to the Lifesavers Conference to research the other factors (education,
enforcement and EMS) involved in reducing the number of fatalities and injuries on Hawaii’s
roadways.
Project Description: The funds will be used to pay for the travel expenses for one traffic
branch representative to attend the annual Lifesavers Conference. HDOT’s Traffic Branch
oversees the Traffic Accident Reporting System and coordinates traffic safety meetings to
address behavioral issues and programs. Grant funds may be used for traffic-safety related
training, travel and equipment purchases if approved by the Highway Safety Office.
Project Cost: $3,120.00 (FAST Act Section 402 FFY 2018 funds)
Project Title: Hawaii Department of Transportation Traffic Branch - Traffic Safety
8
Meetings
Project Number: PT18-01 (08-S-01)
Program Goal: To reduce motor vehicle fatalities and injuries by implementing strategies
identified in Hawaii’s Strategic Highway Safety Plan.
Project Description: The Department of Transportation’s Traffic Branch will use grant
funds to host nine statewide traffic safety meetings. The meetings will help identify the
State’s key safety needs and to guide investment decisions to achieve significant reductions in
highway fatalities and serious injuries on public roads through a cooperative process that
includes input from public and private safety stakeholders. The meetings will also align and
leverage resources and positions from all highway safety programs in the state to collectively
address the State’s safety challenges. Grant funds may be used for traffic safety-related
training, travel and equipment purchases if approved by the Highway Safety Office.
Project Cost: $27,810.00 (FAST Act Section 402 FFY 2018 funds)
27Project Title: Program Management
9
Project Number: PT18-01 (09-S-01) PM
Project Description: The funds will be used for program operations including reporting,
monitoring, technical assistance and development of plans.
Project Cost: $5,000.00 (MAP-21 Section 402 FFY 2016 funds)
Police Traffic Services Total: $627,604.00
Funding source: MAP-21 Section 402 FFY 2016 - $93,440.00
Funding source: FAST Act Section 402 FFY 2017 - $20,000.00
Funding source: FAST Act Section 402 FFY 2018 - $514,164.00
Hawaii Police Traffic Services Summary Sheet
FAST Act Section 402 FFY 2017/2018 Funds
Federal Fiscal Year 2018
POLICE TRAFFIC SERVICES FISCAL Allocation
SUMMARY
PT18-01 (01-O-01) HPD - Traffic Services $134,970.00
PT18-01 (02-H-01) HCPD - Traffic Services $109,840.00
PT18-01 (03-M-01) MPD - Traffic Services $105,600.00
PT18-01 (04-K-01) KPD - Traffic Services $102,824.00
PT18-01 (05-S-01) Law Enforcement Liaison $88,440.00
PT18-01 (06-S-01) Traffic Safety Liaison $50,000.00
PT18-01 (07-S-01) HDOT Traffic Branch – Lifesavers Conference $3,120.00
PT18-01 (08-S-01) HDOT Traffic Branch – Safety Meetings $27,810.00
PT18-01 (09-S-01) PM Program Management $5,000.00
Traffic Services Total: $627,604.00
MAP-21 Section 402 FFY 2016 Funds $93,440.00
FAST Act Section 402 FFY 2017 Funds $20,000.00
FAST Act Section 402 FFY 2018 Funds $514,164.00
28SPEED CONTROL
Excessive speed continues to be a major contributing circumstance in fatal crashes in Hawaii,
resulting in 40 fatalities in 2015.
A component of Police Traffic Services, speed enforcement is a top priority of Hawaii’s four
county police departments. The departments use grant funds to enforce the speeding laws;
conduct high visibility checkpoints and stealth operations; and curb speeding and aggressive
driving.
C-6: Speeding-Related Fatalities
2011 2012 2013 2014 2015
Actual numbers:
Number of Speeding-Related 43 69 45 36 40
Fatal Crashes
Number of Speeding-Related 45 69 45 36 40
Fatalities
Speeding Citations* 58,176 69,980 62,604 58,274 64,480
*FFY information provided by local police departments
Utilizing 5-year moving average:
Number of Speeding-Related 54 49 49 45 43
Fatal Crashes
Number of Speeding-Related 54 55 54 49 47
Fatalities (C-6)
Speeding continues to plague Hawaii’s roadways and was a contributing factor in 43 percent of
our traffic-related fatalities in 2015 (40 out of 93 fatalities). During FFY 2018, we will continue
to focus efforts on strict and consistent enforcement of Hawaii’s speeding laws. Based on our
five-year trendline analysis of Hawaii’s speed-related fatalities, our goal is to reduce speeding-
related fatalities by 2 percent from 47 (2011-2015 average) to 46 by 2018. Given our relatively
low annual number of fatalities, it is statistically possible for anomalies to occur.
29Speed Control Countermeasures
MAP-21 Section 402; FAST Act Section 402
Project Title: Honolulu Police Department Speed Enforcement
1
Project Number: SC18-06 (01-O-01)
Project Goal: Highly visible and sustained enforcement remains the most effective
countermeasure in reducing speed-related crashes and fatalities. The Honolulu Police
Department (HPD) will conduct a minimum of 4,000 hours of high visibility speed
enforcement.
Project Description: The HPD will use funds to pay for 4,000 speed enforcement
overtime hours for officers to detect and enforce the traffic violation of speeding. By
conducting 4,000 hours of highly visible sustained enforcement, the HPD anticipates
issuing 14,000 speed-related and 2,000 other citations. Funds will also be used to
purchase 25 Stalker DSR Moving Radars and 50 Stalker LIDAR XLR laser guns.
Grant funds may be used for related training, travel and equipment purchases if
approved by the Highway Safety Office.
Project Cost: $575,318.00
$200,000.00 FAST Act Section 402 FFY 2017 funds
$375,318.00 FAST Act Section 402 FFY 2018 funds
Project Title: Hawaii County Police Department Speed Enforcement
2
Project Number: SC18-06 (01-H-02)
Project Goal: Highly visible and sustained enforcement remains the most effective
countermeasure in reducing speed-related crashes and fatalities.
Project Description: The funds will be used to pay for overtime for officers to enforce
the speed-related laws. The Hawaii County Police Department (HCPD) will use crash,
fatal and injury data to focus their enforcement efforts in those areas that show a
speeding problem. HCPD hopes to conduct 120 or more checkpoints, specifically in
locations known for excessive speed violations and locations of recent crashes
involving serious injuries or death. They plan on issuing 1,300 or more speeding
citations using grant funding. Funds will be used to purchase 9 Stalker DSR-2X radar
units,10 Stalker II Moving Radars, and 20 LTI TruSpeed laser units. Additionally,
HCPD would like to purchase 10 Feniex Cobra Inner Visor Light Bars and 10
SoundOff Signal UltraLITE Interior Directional Warning Light bars for enforcement
using unmarked vehicles. Grant funds may be used for related training, travel and
equipment purchases if approved by the Highway Safety Office.
Project Cost: $173,901.60
$100,000.00 FAST Act Section 402 FFY 2017 funds
$73,901.60 FAST Act Section 402 FFY 2018 funds
30Project Title: Maui Police Department Speed Enforcement
3
Project Number: SC18-06 (01-M-03)
Project Goal: Highly visible and sustained enforcement remains the most effective
countermeasure in reducing speed-related crashes and fatalities.
Project Description: The Maui Police Department will use 1,350 overtime hours to
enforce the speeding laws. Approximately 2,700 speeding citations will be issued using
the grant funds. Funds will also be used to purchase a speed trailer with statistics
package, a motorcycle with related equipment (radio, emergency lights) and to attend
the mandatory subgrantee orientation in Honolulu. Grant funds may be used for related
training, travel and equipment purchases if approved by the Highway Safety Office.
Project Cost: $203,600.50
$100,000.00 FAST Act Section 402 FFY 2017 funds
$103,600.50 FAST Act Section 402 FFY 2018 funds
Project Title: Kauai Police Department Speed Enforcement
4
Project Number: SC18-06 (01-K-04)
Project Goal: Highly visible and sustained enforcement remains the most effective
countermeasure in reducing speed-related crashes and fatalities. The Kauai Police
Department (KPD) will conduct a minimum of 600 hours of high visibility enforcement
and issue 1,867 (county and grant funded) citations.
Project Description: The KPD will use 600 overtime hours to enforce the speeding
laws and issue 1,867 (county and grant funded) citations for speeding. KPD will also
use grant funds to purchase 10 Stalker DSR X2 radars and four LTI laser speed guns.
Funds will also be used to send two representatives to the subgrantee orientation on
Oahu. Grant funds may be used for related training, travel and equipment purchases if
approved by the Highway Safety Office.
Project Cost: $100,709.00 (FAST Act Section 402 FFY 2017 funds)
Project Title: Hawaii Department of Transportation – Speeding Media Campaign
5
Project Number: SC18-06 (02-S-01)
Project Goal: To conduct a statewide media campaign in support of Hawaii’s high
visibility speeding mobilizations.
Project Description: This grant will be administered through the HDOT. We will use
grant funds to purchase radio/television/movie theatre advertising schedules to air our
speeding public service announcement to educate the public about the dangers of
speeding. Grant funds may be used for related media training, equipment purchases and
media activities.
Project Cost: $25,000.00 (MAP-21 Section 402 FFY 2016 funds)
Project Title: Program Management
6
Project Number: SC18-06 (03-S-01) PM
Project Goal: To oversee and provide guidance to speed-related projects and media
campaigns.
Project Description: The funds will be used for program operations including
reporting, monitoring, technical assistance and development of plans for speed control-
related countermeasures.
Project Cost: $35,000.00 (MAP-21 Section 402 FFY 2016 funds)
31Speed Control Total: $1,113,529.10
Funding source: MAP-21 Section 402 FFY 2016 - $60,000.00
Funding source: FAST Act Section 402 FFY 2017 - $500,709.00
Funding source: FAST Act Section 402 FFY 2018 - $552,820.10
Hawaii Speed Control Summary Sheet
MAP-21 Section 402 FFY 2016; FAST Act Section 402 FFY 2017/2018 Funds
Federal Fiscal Year 2018
SPEED CONTROL FISCAL Allocation
SUMMARY
SC18-06 (01-O-01) HPD - Speed Enforcement $575,318.00
SC18-06 (01-H-02) HCPD - Speed Enforcement $173,901.60
SC18-06 (01-M-03) MPD - Speed Enforcement $203,600.50
SC18-06 (01-K-04) KPD - Speed Enforcement $100,709.00
SC18-06 (02-S-01) HDOT – Speed Media Campaign $25,000.00
SC18-06 (03-S-01) PM Program Management $35,000.00
Speed Control Total: $1,113,529.10
MAP-21 Section 402 FFY 2016 Funds $60,000.00
FAST Act Section 402 FFY 2017 Funds $500,709.00
FAST Act Section 402 FFY 2018 Funds $552,820.10
32IMPAIRED DRIVING
Impaired driving continues to be a major problem in Hawaii. Of the 93 traffic fatalities in 2015,
33 were alcohol impaired.
We will continue our “52/12” enforcement and media campaign during FFY 2018. As part of
the “52/12” enforcement program, Hawaii’s four county police departments have, at a minimum,
one sobriety checkpoint every week of the year, which means 52 weeks of enforcement during
the 12-month federal fiscal year. Additional sobriety checkpoints will be established during
major holiday periods.
We will also continue to use the “Drive Sober or Get Pulled Over” media slogan in all of our
education and media campaigns.
C-5: Alcohol-Impaired Driving Fatalities
2011 2012 2013 2014 2015
Actual numbers:
Alcohol-Impaired Fatalities 45 47 34 30 33
Utilizing 5-year moving average:
Alcohol-Impaired Fatalities 45 46 44 40 38
Despite a decrease in the number of traffic fatalities, from 95 in 2014 to 93 in 2015, impaired
driving continues to present a significant problem in Hawaii. The HDOT will continue to work
with our traffic safety partners to conduct statewide educational efforts and high visibility
enforcement. Based on our five-year trendline analysis of Hawaii’s alcohol-impaired fatalities,
our goal is to reduce alcohol-impaired driving fatalities by 3 percent from 38 (2011-2015
average) to 37 by 2018. Given our relatively low annual number of fatalities, it is statistically
possible for anomalies to occur.
Operating a Vehicle Under the Influence of an Intoxicant (OVUII) Arrests - Grant and County Funded
2011 2012 2013 2014 2015
OVUII* Total Charged OVUII* Total Charged OVUII* Total Charged OVUII* Total Charged OVUII* Total Charged
Arrests Arrests Arrests Arrests Arrests
Alcohol Drugs Alcohol Drugs Alcohol Drugs Alcohol Drugs Alcohol Drugs
Arrests Arrests Arrests Arrests Arrests Arrests Arrests Arrests Arrests Arrests
Honolulu N/A 4,902 4,791 N/A 4,748 4,652 N/A 4,309 4,203 N/A 4,567 4,410 N/A
Hawaii N/A 1,477 1,313 125 1,348 1,152 127 1,157 993 125 1,060 908 110
Maui N/A 957 840 140 1,084 970 127 577 486 95 765 675 90
Kauai N/A 240 195 5 264 237 5 271 217 5 277 212 10
Total** 6,044 5,624 N/A 7,576 7,139 270 7,444 7,011 259 6,314 5,899 225 6,669 6,205 210
*Alcohol and/or Drug Arrests
** Total does not include Honolulu's statistics as HPD's data was unavailable.
33You can also read