Reviews and syntheses: Trends in primary production in the Bay of Bengal - is it at a tipping point?
←
→
Page content transcription
If your browser does not render page correctly, please read the page content below
Biogeosciences, 18, 4953–4963, 2021
https://doi.org/10.5194/bg-18-4953-2021
© Author(s) 2021. This work is distributed under
the Creative Commons Attribution 4.0 License.

Reviews and syntheses: Trends in primary production in the Bay
of Bengal – is it at a tipping point?
Carolin R. Löscher
Nordcee, DIAS, Department of Biology, University of Southern Denmark, Campusvej 55, 5230 Odense M, Denmark

Correspondence: Carolin R. Löscher (cloescher@biology.sdu.dk)

Received: 15 January 2021 – Discussion started: 26 January 2021
Revised: 13 July 2021 – Accepted: 20 July 2021 – Published: 13 September 2021

Abstract. Ocean primary production is the basis of the ma-        munity composition of primary producers and an overall de-
rine food web, sustaining life in the ocean via photosynthesis,   crease in system productivity would strongly impact oxygen
and removing carbon dioxide from the atmosphere. Recently,        concentrations of the BoB’s low-oxygen intermediate waters.
a small but significant decrease in global marine primary pro-    Assuming decreasing nitrate concentrations and concurrent
duction has been reported based on ocean color data, which        decreasing biomass production, export, and respiration, oxy-
was mostly ascribed to decreases in primary production in         gen concentrations within the oxygen minimum zone would
the northern Indian Ocean, particularly in the Bay of Bengal.     not be expected to further decrease. This effect could be en-
   Available reports on primary production from the Bay of        hanced by stronger stratification as a result of future warming
Bengal (BoB) are limited, and due to their spatial and tem-       and thus possibly counteract oxygen decrease as a direct ef-
poral variability difficult to interpret. Primary production in   fect of stratification. Therefore, given a decrease in primary
the BoB has historically been described to be driven by di-       production, the BoB may not be at a tipping point for becom-
atom and chlorophyte clades, while only more recent datasets      ing anoxic, unless external nutrient inputs increase.
also show an abundance of smaller cyanobacterial primary
producers visually difficult to detect. The different charac-
ter of the available datasets, i.e., direct counts, metagenomic
and biogeochemical data, and satellite-based ocean color ob-      1   The role of the Bay of Bengal in primary production
servations, make it difficult to derive a consistent pattern.         in the global ocean – a historical perspective
However, making use of the most highly resolved dataset
based on satellite imaging, a shift in community composi-         Marine primary producers contribute around 50 % to global
tion of primary producers is visible in the BoB over the last     net primary production (Behrenfeld et al., 2001), leading
2 decades. This shift is driven by a decrease in chlorophyte      to a carbon flux from the atmosphere into the ocean of
abundance and a coinciding increase in cyanobacterial abun-       45–50 Pg C and up to 90 Pg C yr−1 (Longhurst et al., 1995;
dance, despite stable concentrations of total chlorophyll. A      Sabine et al., 2004; Sarmiento and Gruber, 2002). Changes
similar but somewhat weaker trend is visible in the Ara-          in ocean primary production exert an important control on at-
bian Sea, where satellite imaging points towards decreasing       mospheric carbon dioxide (CO2 ) concentrations, and thus on
abundances of chlorophytes in the north and increasing abun-      global climate (Falkowski et al., 1998). The BoB has often
dances of cyanobacteria in the eastern parts. Statistical anal-   been described as an area of low primary production com-
ysis indicated a correlation of this community change in the      pared to the Arabian Sea. This low productivity has classi-
BoB to decreasing nitrate concentrations, which may provide       cally been ascribed to a strongly stratified water column as a
an explanation for both the decrease in eukaryotic nitrate-       result of increased surface water temperatures (Kumar et al.,
dependent primary producers and the increase in small uni-        2004) in combination with lowered surface water salinity due
cellular cyanobacteria related to Prochlorococcus, which          to monsoon-governed episodes of massive rainfall and river
have a comparably higher affinity to nitrate. Changes in com-     discharge with maximum freshwater inputs in September
                                                                  (e.g., Mahadevan, 2016). The stratification extends through

Published by Copernicus Publications on behalf of the European Geosciences Union.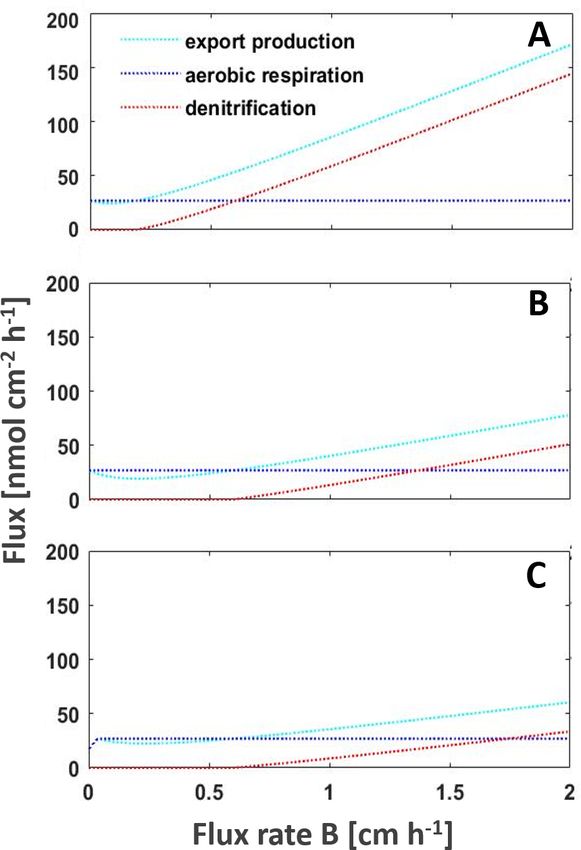
4954                                                                               C. R. Löscher et al.: Reviews and syntheses

                                                                     tion of 0.1–2.16 mg C m−2 d−1 for the shelf regions and 0.1–
                                                                     0.3 mg C m−2 d−1 for open ocean waters of the BoB. Compa-
                                                                     rably higher rates were reported from an expedition with the
                                                                     Russian RV Vityaz from 1956 to 1960, with rates between
                                                                     70 and 3600 mg C m−2 d−1 , from a record from 1970 with
                                                                     a rate of 190 mg C m−2 d−1 (Nair et al., 1973), and from a
                                                                     summer monsoon situation in August–September 1976 with
                                                                     rates between 130 and 330 mg C m−2 d−1 (Radhakrishna et
                                                                     al., 1978). Some of those earlier measurements were sug-
                                                                     gested to be biased as a result of trace metal contamination
                                                                     before trace metal clean techniques were available, a prob-
                                                                     lem identified by calculating primary production to chloro-
                                                                     phyll ratios, which turned out to be extremely high (250–
                                                                     2500 compared to an average of 23 ± 13 in later data pre-
                                                                     sented in Table 1; Madhupratap et al., 2003). Later reports
                                                                     show a high variability of primary production ranging be-
                                                                     tween 0.3 and 936 mg C m−2 d−1 (Gomes et al., 2000; Murty
Figure 1. (a) Trends or total organic carbon (TOC) in the sediment   et al., 2000; Balachandran et al., 2008; Madhupratap et al.,
record over the last 18 kyr before present adapted from Contreras-
                                                                     2003; Gauns et al., 2005; Kumar et al., 2010, 2004; Mo-
Rosales et al. (2016), and (b) modeled decrease in primary produc-
tion between 1998 and 2014 modified from Gregg and Rousseaux
                                                                     hanty et al., 2014; Subha Anand et al., 2017; Löscher et
(2019).                                                              al., 2020; Jyothibabu et al., 2004; Madhu et al., 2006; Mu-
                                                                     raleedharan et al., 2007; Prasanna Kumar et al., 2002; Sarma
                                                                     et al., 2020; Saxena et al., 2020; Singh et al., 2015) and
                                                                     extremes of 2200 mg C m−2 d−1 (Bhattathiri et al., 1980),
large parts of the BoB basin (Subramanian, 1993), restrict-          with generally higher rates in shelf regions compared to
ing nutrient fluxes to the surface and eventually limiting pri-      the open ocean, which were combined into average rates
mary production. In coastal areas, nutrient inputs from the          of 500 and 300 mg C m−2 d−1 for shelf and open ocean,
major rivers have been described to stimulate primary pro-           respectively, to obtain a carbon flux budget (Naqvi et al.,
duction; however, rapid consumption as well as a ballasting          2010). These average rates are quantitatively comparable
effect with lithogenic particles and subsequent sedimenta-           to the studies presented in Table 1; however, for instance
tion of organic matter prevent offshore transport (Singh et al.,     mesoscale water mass dynamics have been observed to pro-
2012; Singh and Ramesh, 2011; Krishna et al., 2016; Kumar            mote primary production in the BoB beyond those ranges
et al., 2004; Ittekkot, 1993). Open waters therefore appear          up to 920 mg C m−2 d−1 , likely because of eddy-related de-
low in macronutrients, exhibiting a slight nitrogen undersat-        creases in stratification and pumping of nutrients into oth-
uration at least temporarily (Bristow et al., 2017; Löscher          erwise nutrient-exhausted photic surface waters (Sarma and
et al., 2020). However, nitrogen fixation has been described         Udaya Bhaskar, 2018). Direct assessments of primary pro-
as low to non-existent (Saxena et al., 2020; Löscher et al.,         duction in eddies of the BoB showed an increase in pri-
2020), therefore not compensating for the nitrogen deficit.          mary production and surface chlorophyll concentrations due
The available geological record suggests that nitrogen fixa-         to eddy-related nutrient pumping (Singh et al., 2015; Sarma
tion is generally absent since the last glacial maximum where        et al., 2020), with increased primary production being as-
isotope records showed an enrichment in 15 N indicative of           sociated with diatom blooms (Vidya and Prasanna Kumar,
nitrogen fixation (Contreras-Rosales et al., 2016; Shetye et         2013). Eddies and other mesoscale and sub-mesoscale dy-
al., 2014; Dähnke and Thamdrup, 2013). Corresponding to              namics are frequent in the BoB (Cui et al., 2016; Greaser
this absence of N2 fixation, low primary production is sug-          et al., 2020; Dandapat and Chakraborty, 2016; Vimal Ku-
gested from deep time records of total organic carbon (TOC,          mar et al., 2016) and therefore may cause significant vari-
Fig. 1a) on a timescale of 18 kyr before present (BP).               ation in primary production patterns. Additional variation re-
   While a decrease in primary production has been de-               sults from the strong influence of the two monsoon-governed
rived in models for the last decades (Fig. 1b; Gregg and             seasons on primary production (Gomes et al., 2000; Jyoth-
Rousseaux, 2019; Roxy et al., 2016) in the Indian Ocean,             ibabu et al., 2018; Madhu et al., 2002; Gauns et al., 2005;
shorter historical records of primary production in the BoB          Table 1). Based on the presented data, a current estimate
are not too abundant. However, records of direct rate mea-           of primary production would be in the range of 361 ± 145
surements go back to the RV Galathea and RV Anton Bruun              and 236 ± 121 mg C m−2 d−1 for coastal and open ocean re-
expeditions in the early 1950s, followed by the Interna-             gions, respectively, which is 1 order of magnitude below the
tional Indian Ocean Expedition (IIOE) from 1959 to 1965              Arabian Sea, depending on the region and time of the year
(Snider, 1961). Those earliest records report primary produc-        (Naqvi et al., 2010).

Biogeosciences, 18, 4953–4963, 2021                                                    https://doi.org/10.5194/bg-18-4953-2021
C. R. Löscher et al.: Reviews and syntheses 4955
Table 1. Historical record of water-column-integrated chlorophyll a concentration, surface chlorophyll a concentration, and primary produc-
tion.
Year Month Season water column integrated Surface chl a Primary production Reference
chl a (mg m−2 ) (mg m−3 ) (mg C m−2 d−1 )
1951 0.1–2.16 Galathea and Anton Brunn
expedition,
Nielsen and Jensen (1957)
1956 70 to 3600 RV Vityaz in 1956–1960
1961 190 Nair (1970)
1976 Summer monsoon 8.63–28.45 0.084–1.67 129.99–329.49 Rhadakrishna et al. (1978)
1977 Summer monsoon 2.11–33.72 0.03–1.04 Devassy et al. (1983)
1978 August Summer monsoon 1.28–33.72 0.01–1.01 180–2200 Bhattahiri et al. (1980)
(up to 50)
1996 May–June Summer monsoon 0.01–0.2 Murty et al. (2000)
1996 April–May Spring intermonsoon up to 53 4.5 Gomes et al. (2000)
1996 Summer monsoon up to 92 0.3 Gomes et al. (2000)
2000 July–August Summer monsoon coastal: 350 ± 225 Madhu et al. (2006)
oceanic: 251 ± 177
2000 November– Winter monsoon 9.0–15 87–187 Balachandran et al. (2008)
December
2000 December Winter monsoon coastal: 252 ± 210 Madhu et al. (2006)
oceanic: 231 ± 150
2001 November– Winter monsoon coastal: 7–23 coastal: 0.06–0.16 coastal: 253–566 Gauns et al. (2005)
December oceanic: 8–18 oceanic: 0.06–0.28 oceanic: 99–423 Madhupratap et al. (2003)
2001 July–August Summer monsoon coastal: 12–19 coastal: 40–502 Gauns et al. (2005)
oceanic: 10–11 oceanic: 89–221
2002 April Spring intermonsoon coastal: 308 ± 120 Madhu et al. (2006)
oceanic: 303 ± 95
2002 April–May Spring intermonsoon 0.25–0.4 Kumar et al. (2010)
2002 September– Intermonsoon coastal: 11–19 coastal: 250–469 Gauns et al. (2005)
October oceanic: 13–16 oceanic: 202–427
2002 November– Winter monsoon coastal: 9–15 coastal: 115–187 Jyothibabu et al. (2004)
December oceanic: 9–13 oceanic: 87–164
2003 April–May Pre-monsoon 154–975 (average coastal: 552, Kumar et al. (2004)
average oceanic: 284)
2003 July–August Summer monsoon anticyclonic warm gyre: 1.84 anticyclonic warm gyre: Muraleedharan et al. (2006)
cyclonic eddy: 5.01 negligible
upwelling zone: 5.2 cyclonic eddy: 163
upwelling zone: 271
2003 September Summer monsoon 0.2–0.35 89.4–220.6 Kumar et al. (2010)
2003 Fall intermonsoon 0.3–0.4 184.14–512.85 Kumar et al. (2010)
2003 September– Post-monsoon coastal: 281 Kumar et al. (2004)
October oceanic: 364
2007 November– Pre-/early cyclonic eddy: 203–430 Singh et al. (2015)
December winter monsoon
2010 Summer 221.41 ± 4.97 Mohanty et al. (2014)
2010 Winter 186.69 ± 9.87 Mohanty et al. (2014)
2010 Monsoon 151.25 ± 2.16 Mohanty et al. (2014)
2010 Post-monsoon 167.87 ± 3.02 Mohanty et al. (2014)
2014 January NE monsoon 0.08–0.035 1.4–9.3 Löscher et al. (2020)
2014 March–April Intermonsoon 182–1261 (average 936 ± 350) Anand et al. (2017)
2018 March–April Intermonsoon 34.6 ± 4 cyclonic eddy 0.35 ± 0.08 411–920 Sarma, et al., 2019
2018 March–April Intermonsoon 26.4 ± 4 outside eddy 0.22 ± 0.06 Sarma et al. (2019)
2018 March–April Intermonsoon 23.6 ± 3 anticyclonic eddy northern Sarma et al. (2019)
region 0.11 ± 0.06
2018 March–April Intermonsoon 22.2 ± 3 anticyclonic eddy southern Sarma et al. (2019)
region 0.10 ± 0.03
2018 July–August Summer monsoon 288–1044 Saxena et al. (2020)
https://doi.org/10.5194/bg-18-4953-2021 Biogeosciences, 18, 4953–4963, 20214956 C. R. Löscher et al.: Reviews and syntheses
2 Key primary producers in BoB waters tion has been described to consist of several different eco-
types of the HLII clade with their respective abundances be-
Compared to records of primary production, even fewer ing governed by macro- and micronutrient distribution and
data on the primary producer community are available, and by temperature (Larkin et al., 2020; Pujari et al., 2019). Simi-
chlorophyll concentrations are often the only parameter pre- lar distributions of Prochlorococcus and Synechococcus have
sented (Table 1). Typically, coastal chlorophyll concentra- been found in other OMZ areas (Beman and Carolan, 2013;
tions are about an order of magnitude higher compared to Franz et al., 2012; Meyer et al., 2016), following similar
those in the central BoB (e.g., Radhakrishna et al., 1978; Ra- vertical and coast to open ocean patterns. The deeper max-
maiah et al., 2010; Balachandran et al., 2008; Gauns et al., imum of Prochlorococcus as a result of its pigment com-
2005; Kumar et al., 2010). A detailed glider-based survey in position adapting to lower light levels (Moore et al., 1998;
the southern open ocean waters of the BoB recorded chloro- Rocap et al., 2003) possibly allows for utilization of nutri-
phyll distributions with maxima of 0.3–1.2 mg m−3 located ents from sinking organic matter at the lower boundary of
at the base of the mixed layer at about 50–60 m water depth the mixed layer. Metagenomes from the Atlantic have previ-
(Thushara et al., 2019). Records of discrete measurements ously demonstrated the genetic potential of Prochlorococcus
show a comparable distribution for the open waters of the HLII clades to grow on nitrate (Rusch et al., 2007), support-
BoB and in addition an extension of chlorophyll concentra- ing the earlier suggestion that some Prochlorococcus eco-
tions of up to 0.3 mg m−3 north of 15◦ N possibly connected types thrive at the base of the euphotic zone to acquire ni-
to riverine nutrient imports (Bhushan et al., 2018; Löscher trate from underlying waters (Vaulot and Partensky, 1992;
et al., 2020; Li et al., 2012). Exemplary vertical profiles of Olson et al., 1990). While there is a body of literature de-
open ocean chlorophyll distributions and a diversity of typi- scribing distribution patterns of the Prochlorococcus ecotype
cally observable primary producers are depicted in Fig. 2. (e.g., Johnson et al., 2006; Martiny et al., 2009; Moore et al.,
Historically available phytoplankton diversity records 1998), the relative contribution of different Prochlorococcus
have methodological limitations relying mostly on direct ecotypes to primary production in the ocean is not well re-
or microscopic phytoplankton counts; therefore, small-sized solved. In addition, information on the specific contribution
phytoplankton and cyanobacteria are likely underrepre- of Prochlorococcus ecotypes detected in the BoB to bulk pri-
sented. There is, however, a general consensus in earlier mary production is not available. Thus, it is unclear whether
and newer studies that diatoms dominate the pool of pri- a change in Prochlorococcus ecotype composition as sug-
mary producers (Gauns et al., 2005; Madhupratap et al., gested by Larkin et al. (2019), in response to changing tem-
2003; Devassy et al., 1983), with some historical records peratures, nutrient concentration, or iron stress, would cor-
being astonishingly detailed, presenting phytoplankton dis- respond to changes in overall Prochlorococcus primary pro-
tribution down to the genus and species levels (Nair and duction. A community shift in small cyanobacteria may be
Gopinathan, 1983), and their results are comparable to more somewhat speculative and with unknown impacts on bulk
recent studies (Ramaiah et al., 2010) showing a diversity of primary production. However, an overall increase in abun-
diatoms including Thalassiothrix, Nitzschia, Thalassionema, dance of small cyanobacteria in concert with a decrease in
Skeletonema, Chaetoceros, and Coscinodiscus clades be- eukaryotic primary producers would be expected to impact
ing abundant (Devassy et al., 1983; Ramaiah et al., 2010). BoB biogeochemistry, especially with regard to the spatial
Diversity analysis based on bulk DNA and amplicon se- expansion and the intensity of the OMZ through modified
quencing complemented those previously available datasets export production and respiration in low-oxygen intermedi-
by adding a higher diversity of eukaryotic phytoplankton, ate waters.
including Pelagophyceae, Haptophyceae, Chrysophyceae, Besides those small cyanobacteria, there are reports on
Eustigamatophyceae, Xanthophyceae, Cryptophyceae, Dic- nitrogen-fixing cyanobacteria of the Trichodesmium clade
tyochophyceae, and Pinguiophyceae and importantly by (Devassy et al., 1983; Jyothibabu et al., 2017; Sahu et al.,
adding small cyanobacteria, which are difficult to count mi- 2017; Hegde et al., 2008; Shetye et al., 2013; Wu et al.,
croscopically and were therefore not included in previous 2019); other reports included diatom–diazotroph associa-
records (Löscher et al., 2020; Yuqiu et al., 2020; Bemal et tions playing a role in BoB nitrogen fixation (Bhaskar et al.,
al., 2019; Larkin et al., 2020; Pujari et al., 2019). Those 2007). However, for both types of nitrogen-fixing primary
cyanobacteria accounted for up to 60 % of the primary pro- producers, datasets are not conclusive and indicate high spa-
ducer abundance in sequence datasets in the central BoB (Li tial and temporal variability. Nitrogen-fixing microbes have
et al., 2012) and include Synechococcus and Prochlorococ- been proposed to be limited by iron, other micronutrients, or
cus. The former has been detected from the surface down to organic matter in the BoB (Löscher et al., 2020; Saxena et
the chlorophyll maximum, while the latter has been found al., 2020; Shetye et al., 2013; Benavides et al., 2018). While
to be abundant in the lower margin of the chlorophyll max- micronutrients would have the potential to also directly limit
imum at around 50–80 m water depth, slightly deeper than primary production, a limitation of nitrogen fixers by organic
the maximum of eukaryotic primary producers (Löscher et matter would result in a feedback regulation of low primary
al., 2020; Yuqiu et al., 2020). The Prochlorococcus popula-
Biogeosciences, 18, 4953–4963, 2021 https://doi.org/10.5194/bg-18-4953-2021C. R. Löscher et al.: Reviews and syntheses 4957
Figure 2. (a) Vertical profiles of chlorophyll a from four stations in the open ocean region of the BoB taken from Löscher et al. (2020).
(b) Schematic depiction of the phylogenetic diversity of primary producers identified in the BoB: green box: diatoms; blue box: cyanobacte-
ria.
production limiting nitrogen fixation and resulting low nitro- decade (Gregg and Rousseaux, 2019). Satellite-based imag-
gen availability limiting primary production. ing indeed showed a southward expansion and increase in
abundance of cyanobacteria in the Bay of Bengal and through
the southern Arabian Sea (Fig. 3). Molecular genetic data
3 Trends in primary production in the BoB showed, however, that Prochlorococcus is expanding and
mostly certain ecotypes of high-light Prochlorococcus in-
Satellite data from 1998 to 2015 suggest a decrease in pri- creased in abundance and extended their habitat (Larkin et
mary production in the global ocean (Gregg et al., 2003; al., 2020). Given the decrease in both nitrate and silicate, a
Behrenfeld et al., 2006), and recent studies deducted a de- decrease in the silicate-correlated ecotypes currently domi-
crease in ocean primary production of 2.1 % per decade as- nant in the northern BoB would be expected, and those may
sociated largely with a decrease in chlorophytes in the ma- be replaced by an open ocean ecotype sensitive to increas-
rine photic realm (Gregg et al., 2017; Gregg and Rousseaux, ing iron concentrations in those waters. The overall increase
2019). However, a recent study derived a nonlinear trend in cyanobacteria derived from satellite monitoring is, how-
in primary production from a similar time episode, between ever, not provable by direct measurements due to the lack of
1998 and 2018 (Kulk et al., 2020). Decreasing rates of pri- counts in the earlier reports and further does not seem to im-
mary production have been associated with high-latitude pact the overall prediction on primary production decrease.
regions (Gregg et al., 2003), but also with the northern Qualitatively consistent with the short-term trend of de-
and equatorial Indian Ocean with a decrease of 9.7 % and creasing primary production between 1998 and 2015, a pro-
17.2 % per decade, respectively (Gregg and Rousseaux, nounced decrease of up to 20 % in phytoplankton in the west-
2019). These estimates, based on satellite imaging, were ern Indian Ocean over the past 6 decades has been ascribed
explained by a decrease in diatom and chlorophyte pri- to increasing ocean stratification as a consequence of rapid
mary production of 15.4 % and 24.8 % per decade, respec- warming in the Indian Ocean, which suppresses nutrient mix-
tively, for both the BoB and its sister basin, the Arabian Sea ing from subsurface layers (Roxy et al., 2016). This result is
(Fig. 3). This decrease has been connected to decreasing ni- indeed consistent with a long-term trend with decreasing pro-
trate and silicate concentrations of 32.4 % and 22.8 % per ductivity since the last glacial maximum (Contreras-Rosales
decade in those waters, limiting those larger, fast-growing et al., 2016; Shetye et al., 2014). With primary production
primary producer groups (Gregg and Rousseaux, 2019), with leading to respiration and a concurrent oxygen loss in inter-
nitrate rather than silicate limiting primary production if as- mediate waters, this may provide an explanation for why the
suming Redfield stoichiometry (Kumar et al., 2010; Rad- BoB is the only oxygen minimum zone region with traces
hakrishna et al., 1978). At the same time, an increase in of oxygen left in its core waters. It has often been suggested
small cyanobacterial primary producers, Prochlorococcus that the BoB is at a tipping point in developing severe anoxia
and Synechococcus, was described in this region, with an in- (Bristow et al., 2017; Canfield et al., 2019; Rixen et al.,
crease in cyanobacterial primary production of 16.7 % per 2020), which is a threshold with only minor changes in bio-
https://doi.org/10.5194/bg-18-4953-2021 Biogeosciences, 18, 4953–4963, 20214958 C. R. Löscher et al.: Reviews and syntheses
Figure 3. Satellite-imaging-based comparison of chlorophytes (a, b) and cyanobacteria from 1998 and 2015 in mg m−3 . Data obtained from
a combination of the Sea-viewing Wide Field of view Sensor (SeaWiFS), the Moderate Resolution Imaging Spectroradiometer (MODIS-
Aqua), and the Visible Infrared Imaging Radiometer Suite (VIIRS) satellite product as available from https://giovanni.gsfc.nasa.gov (last
access: 12 January 2021) have been averaged from 1 January to 15 December 1998 and 2005. The combination of those sensors allows
for covering a range of different wavelengths useful to identify different phytoplankton clades. The maps have been generated using the
NASA Ocean Biogeochemical Model (NOBM; Gregg and Casey, 2007) using the most recent version of the NASA ocean color data product
(R2014). NOBM is designed to represent open ocean areas (water depths > 200 m).
geochemistry leading to a consumption of oxygen traces in temporal and spatial variability. They allow, however, for the-
the oxygen minimum zone. This scenario is, however, chal- oretically exploring what would happen to the BoB biogeo-
lenged by decreasing primary production on long-term and chemistry if nutrient concentrations would decrease further,
decadal timescales. with the exception of coastal regions, where nitrogen inputs
may increase and enter the ocean via rivers but would also at
the same time be removed quickly and close to the coast as
4 Possible scenarios in response to changes in primary is currently happening in the BoB (Naqvi et al., 2010), and
production on the BoB OMZ temperatures would increase.
Assuming a limitation of primary production by nitrogen
Reports of decreasing primary production in the BoB avail- availability, we would expect a niche for nitrogen fixation de-
able from geological records, Earth system modeling, and veloping in the BoB. Until now, nitrogen fixation rates have
satellite imaging are consistent over different timescales. But shown to be low (Löscher et al., 2020; Saxena et al., 2020),
explanations on why primary production and chlorophyll and while there were reports on local blooms of the efficient
concentrations decrease differ. Proposed important parame- nitrogen fixer Trichodesmium (Shetye et al., 2013), the nitro-
ters include iron stress with iron concentrations having de- gen fixer community is dominated by typically less active
creased in the geological record over the last 5000 years heterotrophic bacteria (Wu et al., 2019; Turk-Kubo et al.,
(Shetye et al., 2014), a decrease in nitrate and silicate avail- 2014). However, our understanding of the diazotroph com-
ability directly impacting primary producer growth (Gregg munity composition and N2 fixation rates is hampered by the
and Rousseaux, 2019), a rapid temperature increase of 0.6 ◦ C low number of available datasets and their spatial and sea-
over the last 6 decades, or a combination of those factors, sonal bias. Nitrogen fixers in general have a high require-
which may directly or indirectly via increased stratification ment for iron; therefore an iron limitation could ultimately
decrease primary production (Roxy et al., 2016). These con- limit nitrogen fixation and indirectly primary production, as
siderations cannot clearly be compared and evaluated using discussed earlier (Löscher et al., 2020). A further decrease in
the few direct measurements available, as those expose a high
Biogeosciences, 18, 4953–4963, 2021 https://doi.org/10.5194/bg-18-4953-2021C. R. Löscher et al.: Reviews and syntheses 4959
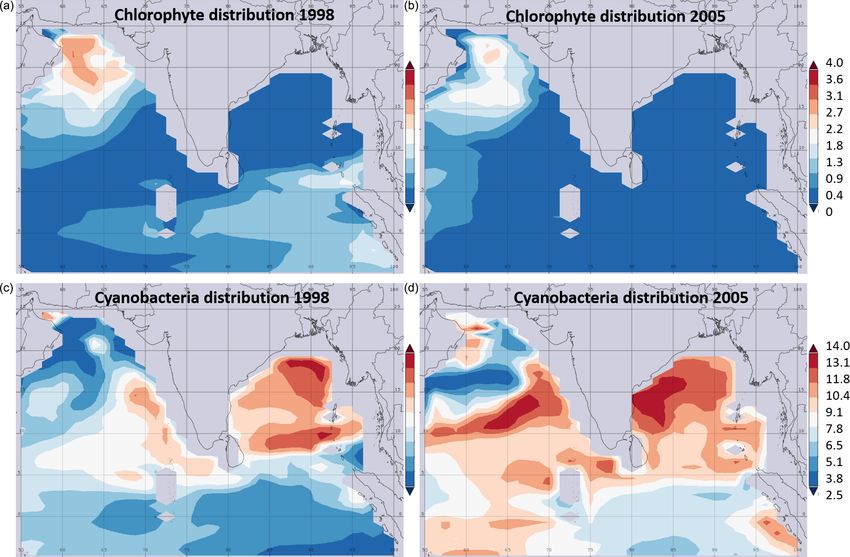
Figure 4. Model of the main processes export production, aero-
bic respiration, and denitrification shaping the intensity of the BoB Figure 5. Schematic depiction of fluxes impacting primary produc-
OMZ to changing nutrient fluxes from riverine, land, or atmospheric tion and the oxygen minimum zone in the BoB (a) during the last
inputs or upwelling to increased upwelling, with (a) current nutrient glacial maximum (modified from Contreras-Rosales et al., 2016),
loads (b) decreasing nitrate concentrations by 32 % as predicted by (b) currently (c) and in a scenario leading to an anoxic OMZ. The
Gregg et al. (2019) and (c) with both decreased nitrate concentra- latter would require higher nutrient fluxes from the atmosphere,
tions and decreased nutrient fluxes from deeper waters as a result of from upwelling, or from rivers and land. Fluxes from land may
warming-dependent increased stratification. The model is adapted increase, e.g., from deforestation or enhanced rainfalls; however,
from Boyle et al. (2013). higher terrigenous particle load would likely accompany increased
nutrient loads, and therefore, even if coastal primary production
would increase, export production would increase via ballasting,
too. The effect on the OMZ would then be rather small. Upwelling-
iron would intensify this limitation and progressive decrease
dependent nutrient pumping is unlikely to increase due to warming
the productivity in the BoB. In addition, a decrease in silicate and enhanced stratification but may occur in particular in eddy sys-
would limit diatom growth which need silica to form their tems, i.e., as eddy pumping. Grey triangles depict nutrient fluxes
frustules. Therefore, a combined decrease in iron, nitrate and from land and rivers, from upwelling along the shelf, and from
silicate concentrations will lower primary production of var- the atmosphere. Brown arrows depict terrigenous particle fluxes as
ious groups of primary producers at the same time, which imported from rivers and leading to ballasting and enhanced or-
may not only explain the trend visible from satellite imag- ganic carbon export. Green arrows depict organic material exported
ing (Gregg and Rousseaux, 2019) but may allow to predict a from the photic zone primary production (green bubble, PP) into
future trend for the BoB biogeochemistry. the OMZ (purple bubble). Sizes of triangles, arrows, and bubbles
Our earlier studies presented possible feedback cycles that qualitatively indicate proportions.
are able to explain the persistent nanomolar levels of oxy-
gen in the BoB OMZ (Canfield et al., 2019; Löscher et al.,
2020). One approach included low mixing levels, or perma- OMZ respiration will lower, low oxygen concentrations will
nent stratification limiting euphotic zone nutrient concentra- be maintained, and denitrification will only occur if nutrients
tions to an extent that new production is persistently low and are imported into the OMZ from land, via rivers, from the
organic matter recycling will not support the organic carbon atmosphere, or by increased upwelling (Fig. 4). This would
requirement of the detected heterotrophic nitrogen fixer com- mean the BoB may not be at a tipping point towards anoxia
munity. This we suggested to lead the system to being locked but is a system with a weakening OMZ in its open waters,
in a low productivity and increasingly nitrogen limited sce- with progressive warming stabilizing this trend by increas-
nario with the OMZ increasingly weakening. Applying lower ing stratification in the photic zone and cutting this part of
concentrations of nitrate and iron (Fig. 4; silicate is not pa- the water column off any nutrient supply.
rameterized in our model but would lead to a similar effect if Comparing scenarios of primary production and its im-
it would be limiting primary production), we observe that the pact on the BoB OMZ, the last glacial maximum signi-
https://doi.org/10.5194/bg-18-4953-2021 Biogeosciences, 18, 4953–4963, 20214960 C. R. Löscher et al.: Reviews and syntheses
fies an episode of high productivity in the geological record Review statement. This paper was edited by Viviane Menezes and
(Contreras-Rosales et al., 2016, Fig. 5a). Higher land runoff reviewed by Arvind Singh and Mar Benavides.
and riverine inputs led to both higher nutrient imports and in-
creased loads of terrigenous material, facilitating organic car-
bon export from the productive zone to the sediments through
References
ballasting. This effect is also currently seen, with nutrients
being imported and consumed close to the shelf and organic Balachandran, K. K., Laluraj, C. M., Retnamma, J., Madhu, N. V.,
material exported out of the photic zone (Fig. 5b), leading to Muraleedharan, K. R., Vijay, J. G., Maheswaran, P. A., Ashraff,
a carbon pump with similar export rates as in the Arabian Sea T. T. M., Nair, K. K. C., and Achuthankutty, C. T.: Hydrography
(Singh and Ramesh, 2015). A scenario with production being and biogeochemistry of the north western Bay of Bengal and the
enhanced would strongly depend on external nutrient inputs; north eastern Arabian Sea during winter monsoon, J. Mar Syst.,
those could come from land and riverine inflow and could 73, 76–86, https://doi.org/10.1016/j.jmarsys.2007.09.002, 2008.
for example result from deforestation, enhanced monsoon Behrenfeld, M. J., Randerson, J. T., McClain, C. R., Feldman, G. C.,
events, increasing atmospheric input, or enhanced upwelling, Los, S. O., Tucker, C. J., Falkowski, P. G., Field, C. B., Frouin,
which has been described to enhance primary production in R., Esaias, W. E., Kolber, D. D., and Pollack, N. H.: Biospheric
Primary Production During an ENSO Transition, Science, 291,
(sub-)mesoscale features (Sarma and Udaya Bhaskar, 2018,
2594–2597, https://doi.org/10.1126/science.1055071, 2001.
Fig. 5b). Because global warming will result in increased Behrenfeld, M. J., O’Malley, R. T., Siegel, D. A., McClain, C. R.,
stratification, enhanced nutrient pumping from deeper wa- Sarmiento, J. L., Feldman, G. C., Milligan, A. J., Falkowski,
ters may be limited to mesoscale eddies, the BoB may be a P. G., Letelier, R. M., and Boss, E. S.: Climate-driven trends
rather stable system in itself, and the observed and predicted in contemporary ocean productivity, Nature, 444, 752–755,
changes in primary producers are not suggestive of a devel- https://doi.org/10.1038/nature05317, 2006.
opment of anoxia in the BoB OMZ. Bemal, S., Anil, A. C., and Amol, P.: Picophytoplank-
ton variability: Influence of Rossby wave propagation in
the southeastern Arabian Sea, J. Mar Syst., 199, 103221,
Code availability. Code is available from the PANGAEA data https://doi.org/10.1016/j.jmarsys.2019.103221, 2019.
repository, https://doi.org/10.1594/PANGAEA.905498 (Boyle, Beman, J. M. and Carolan, M. T.: Deoxygenation alters
2019). bacterial diversity and community composition in the
oceans largest oxygen minimum zone, Nat. Commun., 4,
https://doi.org/10.1038/ncomms3705, 2013.
Competing interests. The authors declare that they have no conflict Benavides, M., Martias, C., Elifantz, H., Berman-Frank, I.,
of interest. Dupouy, C., and Bonnet, S.: Dissolved Organic Matter
Influences N2 Fixation in the New Caledonian Lagoon
(Western Tropical South Pacific), Front. Mar. Sci., 5, 89,
https://doi.org/10.3389/fmars.2018.00089, 2018.
Disclaimer. Publisher’s note: Copernicus Publications remains
Bhaskar, J. T., Ramaiah, N., Gauns, M., and Fernandes, V.: Prepon-
neutral with regard to jurisdictional claims in published maps and
derance of a few diatom species among the highly diverse micro-
institutional affiliations.
phytoplankton assemblages in the Bay of Bengal, J. Mar. Biol.,
152, 63–75, 2007.
Bhattathiri, P. M. A., Devassy, V. P., and Radhakrishna, K.: Primary
Special issue statement. This article is part of the special issue production in the Bay of Bengal during southwest monsoon of
“Understanding the Indian Ocean system: past, present and future 1978, Mahasagar-Bulletin of the National Institute of Oceanog-
(BG/ACP/OS/SE inter-journal SI)”. It is not associated with a con- raphy, 13, 315–323, 1980.
ference. Bhushan, R., Bikkina, S., Chatterjee, J., Singh, S. P., Goswami, V.,
Thomas, L. C., and Sudheer, A. K.: and Sudheer, A. K.: Evi-
dence for enhanced chlorophyll-a levels in the Bay of Bengal
Acknowledgements. I thank Christian Furbo Reeder, Peihang Xu, during early north-east monsoon, J. Ocean. Mar. Sci., 9, 15–23,
Jakob Bang Rønning, Jovitha Lincy and Donald Eugene Canfield https://doi.org/10.5897/JOMS2017.0144, 2018.
for helpful discussions on BoB productivity patterns and the BoB Boyle, R. A.: Code for ancient ocean 5 box model on euxinic/ fer-
OMZ. I thank Mar Benavides and Arvind Singh for their helpful ruginous balance and the nitrogen cycle, PANGAEA [data set],
and constructive reviews. https://doi.pangaea.de/10.1594/PANGAEA.905498, 2019.
Boyle, R. A., Clark, J. R., Poulton, S. W., Shields-Zhou, G., Can-
field, D. E., and Lenton, T. M.: Nitrogen cycle feedbacks as a
Financial support. This research has been supported by the Villum control on euxinia in the mid-Proterozoic ocean, Nat. Commun.,
Fonden (grant no. 29411). 4, 1533, https://doi.org/10.1038/ncomms2511, 2013.
Bristow, L. A., Callbeck, C. M., Larsen, M., Altabet, M. A.,
Dekaezemacker, J., Forth, M., Gauns, M., Glud, R. N., Kuypers,
M. M. M., Lavik, G., Milucka, J., Naqvi, S. W. A., Pratihary,
A., Revsbech, N. P., Thamdrup, B., Treusch, A. H., and Canfield,
Biogeosciences, 18, 4953–4963, 2021 https://doi.org/10.5194/bg-18-4953-2021C. R. Löscher et al.: Reviews and syntheses 4961
D. E.: N2 production rates limited by nitrite availability in the Gregg, W. W., Rousseaux, C. S., and Franz, B. A.: Global
Bay of Bengal oxygen minimum zone, Nat. Geosci., 10, 24–29, trends in ocean phytoplankton: a new assessment using re-
https://doi.org/10.1038/ngeo2847, 2017. vised ocean colour data, Remote Sens. Lett., 8, 1102–1111,
Canfield, D. E., Kraft, B., Löscher, C. R., Boyle, R. A., Thamdrup, https://doi.org/10.1080/2150704x.2017.1354263, 2017.
B., and Stewart, F. J.: The regulation of oxygen to low concentra- Gregg, W. W. and Rousseaux, C. S.: Global ocean pri-
tions in marine oxygen-minimum zones, J. Mar. Res., 77, 297– mary production trends in the modern ocean color satel-
324, https://doi.org/10.1357/002224019828410548, 2019. lite record (1998–2015), Environ. Res. Lett., 14, 124011,
Contreras-Rosales, L. A., Schefuß, E., Meyer, V., Palamenghi, https://doi.org/10.1088/1748-9326/ab4667, 2019.
L., Lückge, A., and Jennerjahn, T. C.: Origin and fate of Hegde, S., Anil, A., Patil, J., Mitbavkar, S., Krishnamurthy,
sedimentary organic matter in the northern Bay of Bengal V., and Gopalakrishna, V.: Influence of environmen-
during the last 18 ka, Glob. Planet. Change, 146, 53–66, tal settings on the prevalence of Trichodesmium spp. in
https://doi.org/10.1016/j.gloplacha.2016.09.008, 2016. the Bay of Bengal, Mar. Ecol. Prog. Ser., 356, 93–101,
Cui, W., Yang, J., and Ma, Y.: A statistical analysis of mesoscale https://doi.org/10.3354/meps07259, 2008.
eddies in the Bay of Bengal from 22-year altimetry data, Ac. Ittekkot, V.: The abiotically driven biological pump in the ocean
Ocean. Sin., 35, 16, https://doi.org/10.1007/s13131-016-0945-3, and short-term fluctuations in atmospheric CO2 contents,
2016. Glob. Planet. Change, 8, 17–25, https://doi.org/10.1016/0921-
Dandapat, S. and Chakraborty, A.: Mesoscale Eddies in the West- 8181(93)90060-2, 1993.
ern Bay of Bengal as Observed From Satellite Altimetry in Johnson, Z. I., Zinser, E. R., Coe, A., McNulty, N. P., Woodward, E.
1993–2014: Statistical Characteristics, Variability and Three- M., and Chisholm, S. W.: Niche partitioning among Prochloro-
Dimensional Properties, IEEE Journal of Selected Topics in Ap- coccus ecotypes along ocean-scale environmental gradients, Sci-
plied Earth Observations and Remote Sensing, 9, 5044–5054, ence, 311, 1737–1740, https://doi.org/10.1126/science.1118052,
https://doi.org/10.1109/JSTARS.2016.2585179, 2016. 2006.
Devassy, V. P., Bhattathiri, P. M. A., and Radhakrishna, K.: Pri- Jyothibabu, R., Maheswaran, P. A., Madhu, N. V., Asharaf, T. T.
mary production in the Bay of Bengal during August, 1977, M., Gerson, V. J., Haridas, C., Venugopal, P., Revichandran, C.,
Mahasagar-Bulletin of National Institute of Oceanography, 16, Nair, K. K. C., and Gopalakrishnan, T. C.: Differential response
443–447, 1983. of winter cooling on biological production in the northeastern
Dähnke, K. and Thamdrup, B.: Nitrogen isotope dynam- Arabian Sea and northwestern Bay of Bengal, Curr. Sci., 87,
ics and fractionation during sedimentary denitrification in 783–791, 2004.
Boknis Eck, Baltic Sea, Biogeosciences, 10, 3079–3088, Jyothibabu, R., Karnan, C., Jagadeesan, L., Arunpandi, N., Pandi-
https://doi.org/10.5194/bg-10-3079-2013, 2013. arajan, R. S., Muraleedharan, K. R., and Balachandran, K. K.:
Falkowski, P. G., Barber, R. T., and Smetacek, V. V.: Biogeochem- Trichodesmium blooms and warm-core ocean surface features
ical Controls and Feedbacks on Ocean Primary Production, Sci- in the Arabian Sea and the Bay of Bengal, Mar. Poll. Bull.,
ence, 281, 200–207, 1998. 121, 201–215, https://doi.org/10.1016/j.marpolbul.2017.06.002,
Franz, J., Krahmann, G., Lavik, G., Grasse, P., Dittmar, T., and 2017.
Riebesell, U.: Dynamics and stoichiometry of nutrients and phy- Jyothibabu, R., Arunpandi, N., Jagadeesan, L., Karnan, C., Lallu,
toplankton in waters influenced by the oxygen minimum zone in K. R., and Vinayachandran, P. N.: Response of phytoplankton to
the eastern tropical Pacific, Deep-Sea Res. Pt. I, 62, 20–31, 2012. heavy cloud cover and turbidity in the northern Bay of Bengal,
Gauns, M., Madhupratap, M., Nagappa, R., Retnamma, J., Sci. Rep., 8, 11282–11282, https://doi.org/10.1038/s41598-018-
Fernandes, V., Bhaskar, J., and PrasannaKumar, S.: Com- 29586-1, 2018.
parative accounts of biological productivity characteristics Krishna, M. S., Prasad, M. H. K., Rao, D. B., Viswanad-
and estimates of carbon fluxes in the Arabian Sea and ham, R., Sarma, V. V. S. S., and Reddy, N. P. C.: Ex-
the Bay of Bengal, Deep-Sea Res. Pt. II, 52, 2003–2017, port of dissolved inorganic nutrients to the northern In-
https://doi.org/10.1016/j.dsr2.2005.05.009, 2005. dian Ocean from the Indian monsoonal rivers during dis-
Gomes, H. R., Goes, J. I., and Saino, T.: Influence of physical charge period, Geochim. Cosmochim. Ac., 172, 430–443,
processes and freshwater discharge on the seasonality of phy- https://doi.org/10.1016/j.gca.2015.10.013, 2016.
toplankton regime in the Bay of Bengal, Cont. Shelf Res., 20, Kulk, G., Platt, T., Dingle, J., Jackson, T., Jönsson, B. F., Bouman,
313–330, 2000. H. A., Babin, M., Brewin, R. J. W., Doblin, M., Estrada, M.,
Greaser, S. R., Subrahmanyam, B., Trott, C. B., and Roman-Stork, Figueiras, F. G., Furuya, K., González-Benítez, N., Gudfinns-
H. L.: Interactions Between Mesoscale Eddies and Synoptic son, H. G., Gudmundsson, K., Huang, B., Isada, T., Kovač, Ž.,
Oscillations in the Bay of Bengal During the Strong Mon- Lutz, V. A., Marañón, E., Raman, M., Richardson, K., Rozema,
soon of 2019, J. Geophys. Res.-Oceans, 125, e2020JC016772, P. D., Poll, W. H. v. d., Segura, V., Tilstone, G. H., Uitz, J.,
https://doi.org/10.1029/2020JC016772, 2020. Dongen-Vogels, V. v., Yoshikawa, T., and Sathyendranath, S.:
Gregg, W. W., Conkright, M. E., Ginoux, P., O’Reilly, J. Primary Production, an Index of Climate Change in the Ocean:
E., and Casey, N. W.: Ocean primary production and cli- Satellite-Based Estimates over Two Decades, Remote Sens., 12,
mate: Global decadal changes, Geophys. Res. Lett., 30, 1809, 826, https://doi.org/10.3390/rs12050826, 2020.
https://doi.org/10.1029/2003GL016889, 2003. Kumar, S., Ramesh, R., Sardesai, S., and Sheshshayee, M.
Gregg, W. W. and Casey, N. W.: Modeling coccolithophores in the S.: High new production in the Bay of Bengal: Possible
global oceans, Deep-Sea Res. Pt. II, 54, 447–477, 2007. causes and implications, Geophys. Res. Lett., 31, L18304,
https://doi.org/10.1029/2004GL021005, 2004.
https://doi.org/10.5194/bg-18-4953-2021 Biogeosciences, 18, 4953–4963, 20214962 C. R. Löscher et al.: Reviews and syntheses Larkin, A. A., Garcia, C. A., Ingoglia, K. A., Garcia, N. S., Baer, Murty, V. S. N., Gupta, G. V. M., Sarma, V. V., Rao, B. P., Jyothi, D., S. E., Twining, B. S., Lomas, M. W., and Martiny, A. C.: Sub- Shastri, P. N. M., and Supraveena, Y.: Effect of vertical stability tle biogeochemical regimes in the Indian Ocean revealed by and circulation on the depth of the chlorophyll maximum in the spatial and diel frequency of Prochlorococcus haplotypes, Lim- Bay of Bengal during May-June, 1996, Deep-Sea Res. Pt. I, 47, nol. Oceanogr., 65, 220–232, https://doi.org/10.1002/lno.11251, 859–873, 2000. 2020. Nair, P. V. R., Samuel, S., Joseph, K. J., and Balachandran, V. K.: Li, G., Lin, Q., Ni, G., Shen, P., Fan, Y., Huang, L., and Tan, Primary production and potential fishery resources in the seas Y.: Vertical Patterns of Early Summer chlorophyll a Concentra- around India, in: Proceedings of the symposium on “Living re- tion in the Indian Ocean with Special Reference to the Varia- sources of the seas around India”, Cochin: Central Marine Fish- tion of Deep Chlorophyll Maximum, J. Mar. Biol., 2012, 801248, eries Research Institute, 184–198, 1973. https://doi.org/10.1155/2012/801248, 2012. Nair, P. V. R. and Gopinathan, C. P.: Primary production in coastal Longhurst, A. R., Sathyendrenath, S., Platt, T., Caverhill, C., and waters, CMFRI Bull., 34, 29–32, 1983. Res., J. P.: An estimat ion of global primary product ion in the Naqvi, S. W. A., Naik, H., D’Souza, W., Narvekar, P. V., Parop- ocean from satellite radiometer data, J. Plankton Res., 17, 1245– kari, A. L., and Bange, H. W.: Carbon and nitrogen fluxes in the 1271, 1995. North Indian Ocean, in: Carbon and nutrient fluxes in continental Löscher, C. R., Mohr, W., Bange, H. W., and Canfield, D. E.: No ni- margins: A global synthesis, edited by: Liu, K.-K., Atkinson, L., trogen fixation in the Bay of Bengal?, Biogeosciences, 17, 851– Quiñones, R., and Talaue-McManus, L., Springer-Verlag, New 864, https://doi.org/10.5194/bg-17-851-2020, 2020. York, 180–191, 2010. Madhu, N. V., Maheswaran, P. A., Retnamma, J., Sunil, V., Re- Nielsen, E. S. and Jensen, E. A.: Primary Oceanic Production: vichandran, C., Thangavel, B., Gopalakrishnan, T. C., and Nair, The Autotrophic Production of organic matter in the oceans, in: K. K. C.: Enhanced biological production off Chennai triggered Galathea Report Copenhagen 1957–9, Library of the National by October 1999 super cyclone (Orissa), Curr. Sci., 82, 1472– History Museum Copenhagen, 1, 49–136, 1957. 1479, 2002. Olson, R. J., Chisholm, S. W., Zettler, E. R., Altabet, M. A., and Madhu, N. V., Jyothibabu, R., Maheswaran, P., Gerson, V. J., Dusenberry, J.: Spatial and temporal distributions of prochloro- Gopalakrishnan, T., and Nair, K.: Lack of seasonality in phy- phyte picoplankton in the North Atlantic Ocean, Deep Sea toplankton standing stock (chlorophyll a) and production in the Res. Pt. A, 37, 1033–1051, 1990. western Bay of Bengal, Cont. Shelf Res., 26, 1868–1883, 2006. Prasanna Kumar, S., Muraleedharan, P. M., Thoppil, P., Gauns, M., Madhupratap, M., Gauns, M., Nagappa, R., PrasannaKumar, S., Nagappa, R., De Souza, S. N., Sardesai, S., and Madhupratap, Muraleedharan, P. M., DeSousa, S. N., Sardessai, S., and M.: Why Bay of Bengal is less productive during summer mon- Muraleedharan, D. U.: Biogeochemistry of the Bay of Ben- soon compared to the Arabian Sea?, Geophys. Res. Lett., 29, gal: Physical, chemical and primary productivity characteris- 881–884, https://doi.org/10.1029/2002GL016013, 2002. tics of the central and western Bay of Bengal during sum- Prasanna Kumar, S., Narvekar, J., Murukesh, N., Nagappa, R., mer monsoon 2001, Deep-Sea Res. Pt. II, 50, 881–896, Sardessai, S., Gauns, M., Fernandes, V., and Bhaskar, J.: Is the https://doi.org/10.1016/S0967-0645(02)00611-2, 2003. biological productivity in the Bay of Bengal light limited?, Curr. Mahadevan, A.: The Impact of Submesoscale Physics on Primary Sci., 98, 1331–1339, 2010. Productivity of Plankton, Annu. Rev. Mar. Sci., 8, 161–184, Pujari, L., Wu, C., Kan, J., Li, N., Wang, X., Zhang, G., Shang, https://doi.org/10.1146/annurev-marine-010814-015912, 2016. X., Wang, M., Zhou, C., and Sun, J.: Diversity and Spa- Martiny, A. C., Kathuria, S., and Berube, P. M.: Widespread tial Distribution of Chromophytic Phytoplankton in the Bay metabolic potential for nitrite and nitrate assimilation among of Bengal Revealed by RuBisCO Genes (rbcL), 10, 1501, Prochlorococcus ecotypes, P. Natl. Acad. Sci. USA, 106, 10787– https://doi.org/10.3389/fmicb.2019.01501, 2019. 10792, https://doi.org/10.1073/pnas.0902532106, 2009. Radhakrishna, K., Devassay, V. P., Bhargava, R. M. S., and Bhat- Meyer, J., Löscher, C. R., Neulinger, S. C., Reichel, A. F., Loginova, tathiri, P. M. A.: Primary production in the Northern Arabian Sea, A., Borchard, C., Schmitz, R. A., Hauss, H., Kiko, R., and Riebe- Ind. J. Mar. Sci., 7, 271–275, 1978. sell, U.: Changing nutrient stoichiometry affects phytoplankton Ramaiah, N., Fernandes, V., Bhaskar, J., Retnamma, J., Gauns, production, DOP accumulation and dinitrogen fixation – a meso- M., and Jayraj, E. A.: Seasonal variability in biological carbon cosm experiment in the eastern tropical North Atlantic, Biogeo- biomass standing stocks and production in the surface layers of sciences, 13, 781–794, https://doi.org/10.5194/bg-13-781-2016, the Bay of Bengal, IInd. J. Mar. Sci., 39, 369–379, 2010. 2016. Rixen, T., Cowie, G., Gaye, B., Goes, J., do Rosário Gomes, H., Mohanty, S. S., Pramanik, D. S., and Dash, B. P.: Primary Produc- Hood, R. R., Lachkar, Z., Schmidt, H., Segschneider, J., and tivity of Bay of Bengal at Chandipur in Odisha,India, Int. J. Sci. Singh, A.: Reviews and syntheses: Present, past, and future Res., 4, 1–13, 2014. of the oxygen minimum zone in the northern Indian Ocean, Moore, L. R., Rocap, G., and Chisholm, S. W.: Physiology and Biogeosciences, 17, 6051–6080, https://doi.org/10.5194/bg-17- molecular phylogeny of coexisting Prochlorococcus ecotypes, 6051-2020, 2020. Nature, 393, 464–467, https://doi.org/10.1038/30965, 1998. Rocap, G., Larimer, F. W., Lamerdin, J., Malfatti, S., Chain, P., Muraleedharan, K., Jasmine, P., Achuthankutty, C. T., Revichan- Ahlgren, N. A., Arellano, A., Coleman, M., Hauser, L., Hess, dran, C., Kumar, P. D., Anand, P., and Rejomon, G.: Influence W. R., Johnson, Z. I., Land, M., Lindell, D., Post, A. F., Regala, of basin-scale and mesoscale physical processes on biological W., Shah, M., Shaw, S. L., Steglich, C., Sullivan, M. B., Ting, productivity in the Bay of Bengal during the summer monsoon, C. S., Tolonen, A., Webb, E. A., Zinser, E. R., and Chisholm, Prog. Ocean., 72, 364–383, 2007. S. W.: Genome divergence in two Prochlorococcus ecotypes Biogeosciences, 18, 4953–4963, 2021 https://doi.org/10.5194/bg-18-4953-2021
C. R. Löscher et al.: Reviews and syntheses                                                                                            4963

   reflects oceanic niche differentiation, Nature, 424, 1042–1047,       Singh, A. and Ramesh, R.: Environmental controls on new and pri-
   https://doi.org/10.1038/nature01947, 2003.                               mary production in the northern Indian Ocean, Prog. Oceanogr.,
Roxy, M. K., Modi, A., Murtugudde, R., Valsala, V., Panickal, S.,           131, 138–145, https://doi.org/10.1016/j.pocean.2014.12.006,
   Prasanna Kumar, S., Ravichandran, M., Vichi, M., and Lévy,               2015.
   M.: A reduction in marine primary productivity driven by rapid        Singh, A., Gandhi, N., and Ramesh, R.: Contribution of atmospheric
   warming over the tropical Indian Ocean, Geophys. Res. Lett., 43,         nitrogen deposition to new production in the nitrogen limlited
   826–833, https://doi.org/10.1002/2015GL066979, 2016.                     photic zone of the northern Indian Ocean, J. Geophys. Res., 117,
Rusch, D. B., Halpern, A. L., Sutton, G., Heidelberg, K. B.,                C06004, https://doi.org/10.1029/2011JC007737, 2012.
   Williamson, S., Yooseph, S., Wu, D., Eisen, J. A., Hoff-              Singh, A., Gandhi, N., Ramesh, R., and Prakash, S.: Role
   man, J. M., Remington, K., Beeson, K., Tran, B., Smith,                  of cyclonic eddy in enhancing primary and new pro-
   H., Baden-Tillson, H., Stewart, C., Thorpe, J., Freeman, J.,             duction in the Bay of Bengal, J. Sea Res., 97, 5–13,
   Andrews-Pfannkoch, C., Venter, J. E., Li, K., Kravitz, S., Hei-          https://doi.org/10.1016/j.seares.2014.12.002, 2015.
   delberg, J. F., Utterback, T., Rogers, Y.-H., Falcón, L. I.,          Snider, R. G.: The Indian Ocean expedition – An international ven-
   Souza, V., Bonilla-Rosso, G., Eguiarte, L. E., Karl, D. M.,              ture, Eos, Transactions American Geophysical Union, 42, 289–
   Sathyendranath, S., Platt, T., Bermingham, E., Gallardo, V.,             294, https://doi.org/10.1029/TR042i003p00289, 1961.
   Tamayo-Castillo, G., Ferrari, M. R., Strausberg, R. L., Neal-         Subha Anand, S., Rengarajan, R., Sarma, V. V. S. S., Sudheer, A. K.,
   son, K., Friedman, R., Frazier, M., and Venter, J. C.: The Sor-          Bhushan, R., and Singh, S. K.: Spatial variability of upper ocean
   cerer II Global Ocean Sampling Expedition: Northwest At-                 POC export in the Bay of Bengal and the Indian Ocean deter-
   lantic through Eastern Tropical Pacific, PLOS Biol., 5, e77,             mined using particle-reactive 234Th, J. Geophys. Res.-Oceans,
   https://doi.org/10.1371/journal.pbio.0050077, 2007.                      122, 3753–3770, https://doi.org/10.1002/2016JC012639, 2017.
Sabine, C. L., Feely, R. A., Gruber, N., Key, R. M., Lee, K., Bullis-    Subramanian, V.: Sediment load of Indian rivers, Curr. Sci., 64,
   ter, J. L., Wanninkhof, R., Wong, C. S., Wallace, D. W. R.,              928–930, 1993.
   Tilbrook, B., Millero, F. J., Peng, T.-H., Kozyr, A., Ono, T., and    Thushara, V., Vinayachandran, P. N. M., Matthews, A. J., Webber,
   Rios, A. F.: The Oceanic Sink for Anthropogenic CO2 , 16, 367–           B. G. M., and Queste, B. Y.: Vertical distribution of chlorophyll
   371, https://doi.org/10.1126/science.1097403, Science, 2004.             in dynamically distinct regions of the southern Bay of Bengal,
Sahu, B. K., Baliarsingh, S. K., Lotliker, A. A., Parida, C., Srichan-      Biogeosciences, 16, 1447–1468, https://doi.org/10.5194/bg-16-
   dan, S., and Sahu, K. C.: Winter thermal inversion and Tri-              1447-2019, 2019.
   chodesmium dominance in north-western Bay of Bengal, Ocean            Turk-Kubo, K. A., Karamchandani, M., Capone, D. G., and Zehr,
   Sci. J., 52, 301–306, https://doi.org/10.1007/s12601-017-0028-1,         J. P.: The paradox of marine heterotrophic nitrogen fixation:
   2017.                                                                    abundances of heterotrophic diazotrophs do not account for ni-
Sarma, V. V. S. S. and Udaya Bhaskar, T. V. S.: Ventilation of Oxy-         trogen fixation rates in the Eastern Tropical South Pacific, En-
   gen to Oxygen Minimum Zone Due to Anticyclonic Eddies in                 viron Microbiol., 16, 3095–3114, https://doi.org/10.1111/1462-
   the Bay of Bengal, J. Geophys. Res.-Biogeo., 123, 2145–2153,             2920.12346, 2014.
   https://doi.org/10.1029/2018jg004447, 2018.                           Vaulot, D. and Partensky, F.: Cell cycle distributions of prochloro-
Sarma, V. V. S. S., Chopra, M., Rao, D., Priya, M., Ra-                     phytes in the north western Mediterranean Sea, 39, 727–742,
   jula, G., Lakshmi, D., and Rao, V.: Role of eddies on                    1992.
   controlling total and size-fractionated primary production            Vidya, P. J. and Prasanna Kumar, S.: Role of mesoscale eddies
   in the Bay of Bengal, Cont. Shelf Res., 204, 104186,                     on the variability of biogenic flux in the northern and cen-
   https://doi.org/10.1016/j.csr.2020.104186, 2020.                         tral Bay of Bengal, J. Geophys. Res.-Oceans, 118, 5760–5771,
Sarmiento, J. and Gruber, N.: Sinks for Anthropogenic Car-                  https://doi.org/10.1002/jgrc.20423, 2013.
   bon, Phys. Today, 55, 30–36, https://doi.org/10.1063/1.1510279,       Vimal Kumar, K., Jayalakshmi, K., Sajeev, R., and Gupta, G.: Role
   2002.                                                                    of Mesoscale Eddies in the Distribution Pattern of Zooplankton
Saxena, H., Sahoo, D., Khan, M. A., Kumar, S., Sudheer, A. K.,              Standing Stock of Western Bay of Bengal During Spring Tran-
   and Singh, A.: Dinitrogen fixation rates in the Bay of Bengal            sition, J. Mar. Biol. Oceanogr., 5, https://doi.org/10.4172/2324-
   during summer monsoon, Environ. Res. Commun., 2, 051007,                 8661.1000150, 2016.
   https://doi.org/10.1088/2515-7620/ab89fa, 2020.                       Wu, C., Kan, J., Liu, H., Pujari, L., Guo, C., Wang, X.,
Shetye, S. S., Sudhakar, M., Jena, B., and Mohan, R.: Occurrence of         and Sun, J.: Heterotrophic Bacteria Dominate the Dia-
   Nitrogen Fixing Cyanobacterium Trichodesmium under Elevated              zotrophic Community in the Eastern Indian Ocean (EIO)
   CO2 Conditions in the Western Bay of Bengal, Int. J. Ocean.,             during Pre-Southwest Monsoon, Microb. Ecol., 78, 804–819,
   2013, 350465, https://doi.org/10.1155/2013/350465, 2013.                 https://doi.org/10.1007/s00248-019-01355-1, 2019.
Shetye, S. S., Sudhakar, M., Mohan, R., and Jena, B.: Contrasting        Yuqiu, W., Xiangweic, Z., Zhao, Y., Huang, D., and Sun, J.:
   productivity and redox potential in Arabian Sea and Bay of Ben-          Biogeographic variations of picophytoplankton in three con-
   gal, J. Earth Sci., 25, 366–370, https://doi.org/10.1007/s12583-         trasting seas: the Bay of Bengal, South China Sea and
   014-0415-9, 2014.                                                        Western Pacific Ocean, Aquat. Microb. Ecol., 84, 91–103,
Singh, A. and Ramesh, R.: Contribution of riverine dissolved inor-          https://doi.org/10.3354/ame01928, 2020.
   ganic nitrogen flux to new production in the coastal northern In-
   dian Ocean: An assessment, Int. J. Oceanogr., 2011, 1687–9406,
   https://doi.org/10.1155/2011/983561, 2011.

https://doi.org/10.5194/bg-18-4953-2021                                                           Biogeosciences, 18, 4953–4963, 2021
You can also read