COVID-19, Australia: Epidemiology Report 15: Department of ...
←
→
Page content transcription
If your browser does not render page correctly, please read the page content below
2020               Vo lum e 4 4
https://doi.org/10.33321/cdi.2020.44.43

COVID-19, Australia: Epidemiology Report 15:
Reporting week ending 23:59 AEST 10 May 2020
COVID-19 National Incident Room Surveillance Team

                      Subscribe to the Australia COVID-19
                      weekly epidemiology report newsletter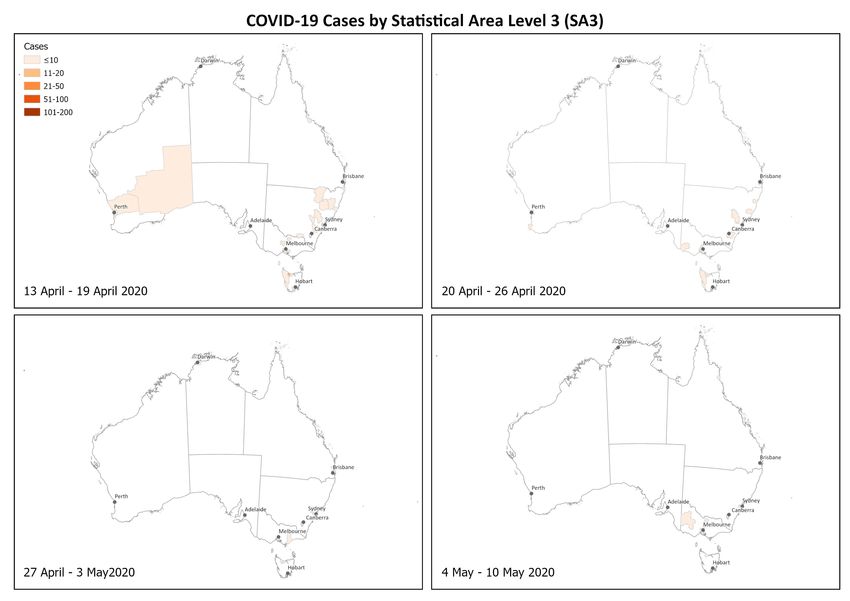
Communicable Diseases Intelligence                                      Communicable Diseases Intelligence
ISSN: 2209-6051 Online                                                  (CDI) is a peer-reviewed scientific
                                                                        journal published by the Office of Health
                                                                        Protection, Department of Health. The
This journal is indexed by Index Medicus and Medline.
                                                                        journal aims to disseminate information on
                                                                        the epidemiology, surveillance, prevention
Creative Commons Licence - Attribution-NonCommercial-
                                                                        and control of communicable diseases of
NoDerivatives CC BY-NC-ND
                                                                        relevance to Australia.
© 2020 Commonwealth of Australia as represented by the
                                                                        Editor
Department of Health
                                                                        Tanja Farmer
This publication is licensed under a Creative Commons Attribution-
                                                                        Deputy Editor
Non-Commercial NoDerivatives 4.0 International Licence from
                                                                        Simon Petrie
https://creativecommons.org/licenses/by-nc-nd/4.0/legalcode
(Licence). You must read and understand the Licence before using
                                                                        Design and Production
any material from this publication.
                                                                        Kasra Yousefi
Restrictions
                                                                        Editorial Advisory Board
The Licence does not cover, and there is no permission given for, use
                                                                        David Durrheim,
of any of the following material found in this publication (if any):
                                                                        Mark Ferson, John Kaldor,
                                                                        Martyn Kirk and Linda Selvey
• the Commonwealth Coat of Arms (by way of information, the
  terms under which the Coat of Arms may be used can be found at
                                                                        Website
  www.itsanhonour.gov.au);
                                                                        http://www.health.gov.au/cdi
• any logos (including the Department of Health’s logo) and
                                                                        Contacts
  trademarks;
                                                                        Communicable Diseases
                                                                        Intelligence is produced by:
• any photographs and images;
                                                                        Health Protection Policy Branch
• any signatures; and                                                   Office of Health Protection
                                                                        Australian Government
• any material belonging to third parties.                              Department of Health
                                                                        GPO Box 9848, (MDP 6)
Disclaimer                                                              CANBERRA ACT 2601
Opinions expressed in Communicable Diseases Intelligence are
those of the authors and not necessarily those of the Australian        Email:
Government Department of Health or the Communicable Diseases            cdi.editor@health.gov.au
Network Australia. Data may be subject to revision.
                                                                        Submit an Article
Enquiries                                                               You are invited to submit
Enquiries regarding any other use of this publication should be         your next communicable
addressed to the Communication Branch, Department of Health,            disease related article
GPO Box 9848, Canberra ACT 2601, or via e-mail to:                      to the Communicable
copyright@health.gov.au                                                 Diseases Intelligence (CDI)
                                                                        for consideration. More
Communicable Diseases Network Australia                                 information regarding CDI can
Communicable Diseases Intelligence contributes to the work of the       be found at:
Communicable Diseases Network Australia.                                http://health.gov.au/cdi.
http://www.health.gov.au/cdna
                                                                        Further enquiries should be
                                                                        directed to:
                                                                        cdi.editor@health.gov.au.
Weekly epidemiological report In the past reporting week new cases in Australia
are mostly considered to be locally acquired,
COVID-19, Australia: consistent with the drop in international travel.
Most locally-acquired cases can be linked back
Epidemiology Report 15: to a known case or cluster. Although the pro-
portion of locally-acquired cases has increased,
the overall rate of cases, regardless of place of
Reporting week ending 23:59 AEST 10 May 2020 acquisition, continues to decrease.
COVID-19 National Incident Room Surveillance Team
The crude case fatality rate in Australia remains
Notified cases of COVID-19 and associated deaths low (1.4%), compared with the WHO reported
reported to the National Notifiable Diseases global rate (6.9%). The low case fatality rate is
Surveillance System (NNDSS) to 10 May 2020. likely reflective of high case detection and high
quality of health care services in Australia.
Confirmed cases in Australia notified up to 10 May 2020 Deaths from COVID-19 in Australia have
Notifications 6,971 occurred predominantly among the elderly and
Deaths 98 those with comorbidities, with no deaths occur-
ring in those under 40 years.
Summary
The highest rate of COVID-19 continues to be
The incidence of new cases of COVID-19 has among people aged 60–79 years, with a third of
reduced dramatically since a peak in mid-March. these cases associated with several outbreaks
The reduction in international travel, social dis- linked to cruise ships. The lowest rate of disease
tancing measures and public health action have is in young children, a pattern reflected in inter-
likely been effective in slowing the spread of the national reports.
disease, in the Australian community.
Internationally, cases continue to increase, with
Cases of COVID-19 continue to be notified by some areas such as Brazil and India showing a
jurisdictions, albeit at a slowed rate. Testing dramatic rise in reported cases. Although some
rates over the past week have increased mark- low-income countries have currently reported
edly, with a very low proportion of people testing few cases, it is possible that this is due to limited
positive. These low rates of detection are indica- diagnostic and public health capacity, and may
tive of low levels of COVID-19 transmission. It not be reflective of disease occurrence.
is important that testing rates and community
adherence to public health measures remain Keywords: SARS-CoV-2; novel coronavirus;
high to support the continued suppression of 2019-nCoV; coronavirus disease 2019; COVID-
the virus, particularly in vulnerable high-risk 19; acute respiratory disease; epidemiology;
groups and settings. Australia
500 8000
Number of cases (cumulative)
450 7000
400
6000
Number of new cases
350
300 5000
250 4000
200 3000
150
2000
100
50 1000
0 0
03Mar2020
08Mar2020
13Mar2020
18Mar2020
23Mar2020
28Mar2020
02May2020
07May2020
13Jan2020
18Jan2020
23Jan2020
28Jan2020
02Feb2020
07Feb2020
12Feb2020
17Feb2020
22Feb2020
27Feb2020
02Apr2020
07Apr2020
12Apr2020
17Apr2020
22Apr2020
27Apr2020
Date of illness onset
health.gov.au/cdi Commun Dis Intell (2018) 2020;44(https://doi.org/10.33321/cdi.2020.44.43) Epub 15/5/2020 1 of 26Data caveats: Based on data extracted from the dictions, with the majority reported in areas
National Notifiable Diseases Surveillance System classified as ‘Major cities of Australia’ based
(NNDSS) on 12 May 2020. Due to the dynamic on the case’s usual place of residence (Table 2).
nature of the NNDSS, data in this extract are No cases among Aboriginal and Torres Strait
subject to retrospective revision and may vary Islander persons have been notified from remote
from data reported in published NNDSS reports or very remote areas of Australia.
and reports of notification data by states and ter-
ritories. Across all Australian cases, completeness of the
Indigenous status field was approximately 95%.
Australian cases: descriptive
epidemiology Thirty-six percent (n = 21) of cases in Aboriginal
and Torres Strait Islander persons acquired their
National trends and geographical infection overseas, while 51% (n = 30) of cases
distribution acquired their infection domestically. Eight
(14%) were still under investigation at the time
Following the national peak in cases during the of this report.
week 16–22 March, the incidence of new cases
has continued to decrease, indicative of a steady The median age of COVID-19 cases among
reduction in transmission. The incidence of new Aboriginal and Torres Strait Islander persons is
cases continues to decline or remain steady in all 34 years (interquartile range: 21–55 years), which
jurisdictions. is lower than the median age of non-Indigenous
COVID-19 cases.
At the jurisdictional level NSW, Vic, Qld, SA, and
ACT reported their highest rates of new cases Of the cases notified amongst Aboriginal and
during the week 16–22 March (Figure 1). The Torres Strait Islander persons, 10% were admit-
majority of cases continue to be notified from ted to hospital, which is similar to the propor-
major metropolitan areas with very few cases for tion of all cases hospitalised (all cases = 12%).
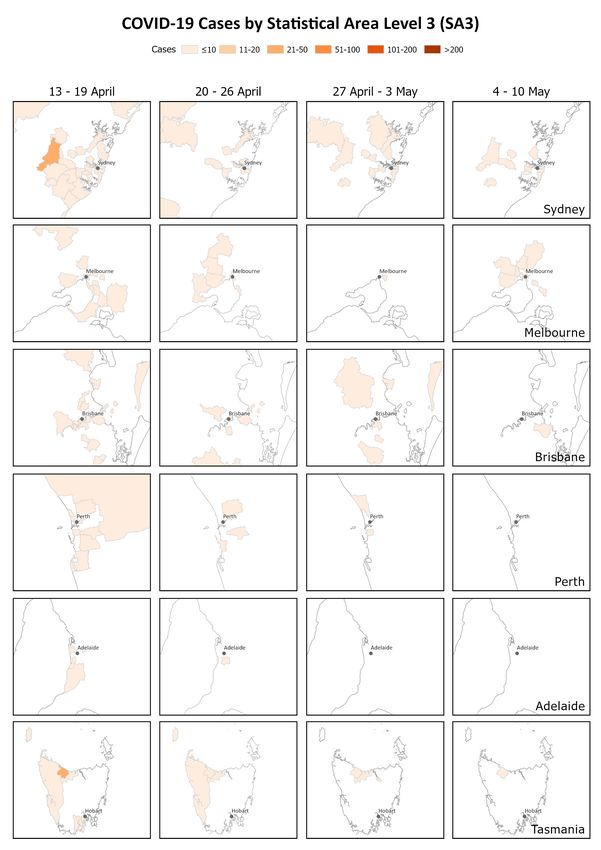
remote or very remote areas (Figures 2 and 3). Of cases in Aboriginal and Torres Strait Islander
The highest cumulative rates of COVID-19 have persons, none were reported as being admitted
been reported from NSW and Tasmania (Table to ICU.
1). The high rates in these states have likely been
driven by outbreaks or large clusters, including Age and gender distribution
cruise-ship-related outbreaks in NSW and a
recent large outbreak in North West Tasmania. The highest rate of disease was among those in
the 60–69 years age group, followed closely by
Across all cases, the median time between onset the 70–79 years age group, with 44 cases and
of symptoms and laboratory testing was 3 days 41 cases per 100,000 population respectively
(interquartile range, IQR: 1–6 days). This reflects (Figure 4). The high rate amongst those in the
an increase from a median of 2 days in the week 60–69 and 70–79 years age groups is linked to
of 13–19 April but is still lower than at the begin- outbreaks on cruise ships, with 29% of cases in
ning of the epidemic. the 60–69 years age group and 43% in the 70–79
years age group acquiring their infection at sea.
Aboriginal and Torres Strait
Islander persons The lowest rate of disease was among children
in the 0–9 years age group, with 2.6 cases per
Fifty-nine cases (0.8%) have been reported in 100,000 population. Among those in the 10–19
Aboriginal and Torres Strait Islander persons years age group, the rate of disease was 7.0 cases
since the start of the epidemic in Australia. per 100,000 population. The number of cases
These cases were reported across several juris- among school-aged children aged 5–18 years was
2 of 26 Commun Dis Intell (2018) 2020;44(https://doi.org/10.33321/cdi.2020.44.43) Epub 15/5/2020 health.gov.au/cdiFigure 1: Weekly COVID-19 new case notifications per 100,000 population, as at 10 May 2020, by jurisdiction
health.gov.au/cdi
16
NSW Vic Qld WA
14
SA Tas NT ACT
12
10
8
6
New case notifications per 100,000 population
4
Commun Dis Intell (2018) 2020;44(https://doi.org/10.33321/cdi.2020.44.43) Epub 15/5/2020
2
0
13/1-19/1 20/1-26/1 27/1-2/1 3/2-9/2 10/2-16/2 17/2-23/2 24/2-1/3 2/3-8/3 9/3-15/3 16/3-22/3 23/3-29/3 30/3-5/4 6/4-12/4 13/4-19/4 20/4-26/4 27/4-3/5 4/5-10/5
Date of illness onset week
3 of 26Table 1: Notifications and rates of COVID-19 and diagnostic tests performed, Australia,
by jurisdiction
Jurisdiction Cases per 100,000 population Cumulative Cumulative number
Total rate of tests performed
27 April – 3 cases (per 100,000 (proportion of tests
4–10 May
May population) positive %)
NSW 0.16 0.35 3,085 38.1 304,464 (1.01)
Vic 0.58 1.17 1,497 22.7 226,889 (0.66)
Qld 0.04 0.10 1,051 20.6 135,806 (0.77)
WA 0.04 0.04 536 20.4 55,758 (0.96)
SA – – 439 25.1 69,178 (0.63)
Tas 0.19 0.56 227 42.5 18,545 (1.22)
NT – – 29 11.8 5,495 (0.53)
ACT – – 107 25.1 11,737 (0.91)
Australia 0.22 0.45 6,971 27.5 827,872 (0.84)
172 cases (2.5% of total cases). This is consistent Of all cases with a reported place of acquisition,
with international reports, which indicate a 62% had a recent international travel history
low rate of infection among children. A similar and 27% were considered to have been locally
pattern was observed with other coronaviruses acquired from a confirmed case. The rate of
such as SARS and MERS with low rates of infec- new cases has declined in all place of acquisition
tion in children.1 categories with the steepest decline observed
in cases acquired overseas – likely due to the
Notifications by gender differed by age group reduction in international travel (Table 3, Figure
with a higher rate of notifications in females in 5). Of the locally-acquired cases, most were
the 20–29 age group and a higher rate in males considered to be contacts of a confirmed case,
in the 40–49 years age group, as well as in those with a very small proportion of cases not able
aged over 60 years (Figure 4). It is unlikely that to be epidemiologically linked to a confirmed
this disparity reflects differences in underlying case. Cases where a place of acquisition has not
susceptibility to COVID-19; instead, it is more been reported (0.6%) are currently under public
likely linked to transmission and possibly to dif- health investigation.
ferences in travel patterns.
In this reporting week, the overseas-acquired
Source of infection cases have reported travel history to the
Southern and Central Asia, Americas, and
Most cases of COVID-19 notified in Australia European regions (Figure 6). In the previous
in this reporting week were considered to be reporting week, 27 March – 3 May, the number
locally acquired, likely due to the reduction in of overseas-acquired cases was highest among
international travel. However the rate of new those who reported travel history to Southern
cases continues to be low, irrespective of place of and Central Asia.
acquisition, with a decrease in rate observed for
all places of acquisition. Of the cases considered
to be locally acquired most are associated with
contacts of confirmed cases or are associated
with known outbreaks.
4 of 26 Commun Dis Intell (2018) 2020;44(https://doi.org/10.33321/cdi.2020.44.43) Epub 15/5/2020 health.gov.au/cdiFigure 2: Number of cumulative new confirmed cases of COVID-19, Australia, by location of usual residence and statistical area level 3 (SA3),a
7 day heat maps for the four most recent weekly reporting periodsb
health.gov.au/cdi
Commun Dis Intell (2018) 2020;44(https://doi.org/10.33321/cdi.2020.44.43) Epub 15/5/2020
a Represents the usual location of residence of a case, which does not necessarily mean that this is the place where they acquired their infection or were diagnosed. Overseas residents who do not have a
usual place of residence in Australia are not shown.
5 of 26
b Based on diagnosis date from NNDSS reporting period up to 23:59 AEST 10 May 2020.Figure 3: Number of cumulative new confirmed cases of COVID-19, Australia, by location of
usual residence and selected areas,a 7 day heat maps for the four most recent weekly reporting
periodsb
a Represents the usual location of residence of a case, which does not necessarily mean that this is the place where they acquired their
infection or were diagnosed. Overseas residents who do not have a usual place of residence in Australia are not shown.
b Based on diagnosis date from NNDSS reporting period up to 23:59 AEST 10 May 2020.
6 of 26 Commun Dis Intell (2018) 2020;44(https://doi.org/10.33321/cdi.2020.44.43) Epub 15/5/2020 health.gov.au/cdiTable 2: COVID-19 cases, Australia, notified among persons by remoteness classification
Major cities of Inner regional Outer regional Remote/very
Population Total
Australia Australia Australia remote Australia
Aboriginal and Torres
39 13 7 0 59
Strait Islander persons
All persons 5,437 829 380 37 6,971a
a Total includes 181 overseas residents and 107 persons with unknown remoteness classification.
Table 3: Rate of weekly confirmed cases in Australia (per 100,000 population) by date of illness
onseta and place of acquisition
Locally acquired—
Locally acquired, Under
Week Overseas acquired close contact of a
confirmed case
not epi linked investigation
13–19 April 0.11 0.343 – 0.083
20–26 April 0.012 0.146 0.004 0.047
27 April – 3 May 0.032 0.051 – 0.032
4–10 May 0.02 0.039 – 0.158
a Based on diagnosis date from NNDSS reporting period up to 23:59 AEST 10 May 2020.
Cluster and outbreak investigations vulnerable to serious complications if they do
become infected. As of 10 May 2020, there have
Investigations are taking place in states and ter- been 121 cases of COVID-19 associated with 26
ritories in relation to a number of clusters and
outbreaks of COVID-19. To date the largest out-
breaks have been associated with cruise ships,
with some other large domestic clusters associ- Cluster:
ated with aged care and healthcare facilities and
private functions, such as weddings. The term ‘cluster’ in relation to COVID-19
refers to two or more cases (who do not
Cruise ships account for a substantial propor- reside in the same household) that are
tion of cases of COVID-19 in Australia. Of cases epidemiologically related in time, place or
with a reported place of acquisition, 18% (n = person where a common source (such as an
1,107) were acquired at sea on a cruise ship. The event or within a community) of infection
number of new cases acquired at sea on cruise is suspected but not yet established.
ships has decreased in comparison to previous
weeks; this in part reflects the implementation Outbreak:
of public health responses, in particular the
cruise ship arrivals ban. There have been 25 The term ‘outbreak’ in relation to COVID-
deaths among cases acquired on cruise ships in 19 refers to two or more cases (who do not
Australia. reside in the same household) among a spe-
cific group of people and/or over a specific
Residents of aged care facilities are at increased period of time where illness is associated
risk of COVID-19 infection due to the environ- with a common source (such as an event or
ment of communal living facilities and are more within a community).
health.gov.au/cdi Commun Dis Intell (2018) 2020;44(https://doi.org/10.33321/cdi.2020.44.43) Epub 15/5/2020 7 of 26Figure 4: COVID-19 rates per 100,000 population of all cases notified in Australia, by age group
and gender
50
Male Female
40
30
Rate per 100,000
20
10
0
0–9 10–19 20–29 30–39 40–49 50–59 60–69 70–79 80–89 90+
Age group (years)
residential aged care facilities, with 39 recoveries 580 cases. These conditions were reported in
and 26 deaths. Sixty-three of these cases occurred approximately 12% of cases, noting that this is
in aged care residents, with the remaining 58 currently not a standard field in NNDSS, and is
cases occurring in care staff. In addition, there likely to under-represent those presenting with
have been 41 cases associated with 29 in-home these symptoms.
Commonwealth funded aged care services pro-
viding support to older Australians who live at In a minority of cases more severe complications
home, with 27 recoveries and 3 deaths. Thirty- are reported, with pneumonia and/or acute res-
one of these cases occurred in care recipients, piratory disease (ARD) reported in 3% of cases
with the remaining 10 cases occurring in care with symptoms.
staff. Advice and guidelines have been provided
to aged care services, including the release of an The symptom profile of Australian cases is
outbreak management guide. broadly similar to the symptoms reported by
COVID-19 cases internationally. Among EU/
Symptom profile EEA countries, fever/chills, dry or productive
cough and sore through were the most com-
The symptoms reported by COVID-19 cases in monly reported symptoms.2 Differences in
Australia are consistent with a mild respiratory reported symptoms will be influenced by dif-
infection in the majority of cases. The most ferences in surveillance strategies and symptom
common symptoms reported (Figure 7) were reporting across countries.
cough (69%), fever (47%), sore throat (40%) and
headache (36%). In addition, loss of smell was
reported from 609 cases and loss of taste from
8 of 26 Commun Dis Intell (2018) 2020;44(https://doi.org/10.33321/cdi.2020.44.43) Epub 15/5/2020 health.gov.au/cdiFigure 5: Rate of weekly confirmed cases in Australia by date of illness onseta and place of acquisition
7
health.gov.au/cdi
6
Overseas acquired
5
Locally acquired-close contact of a confirmed case
4
Locally acquired, not epi linked
3
Under investigation
2
Weekly confirmed cases per 100,000 population
1
Commun Dis Intell (2018) 2020;44(https://doi.org/10.33321/cdi.2020.44.43) Epub 15/5/2020
0
Outbreak week
9 of 26
a Note that this graph is from NNDSS where there is a data completeness lag compared to more current proportions presented in text.Figure 6: Overseas-acquired confirmed cases in Australia by week of date of illness onset, by
travel history regions
16
New Zealand and Pacific Europe Americas
14 At Sea (cruise ships) North Africa and the Middle East North-East Asia
South-East Asia Southern and Central Asia Sub-Saharan Africa
12
Number of confirmed case
10
8
6
4
2
0
13/4-19/4 20/4-26/4 27/4-3/5 4/5-10/5
Date of illness onset week
Severity The highest rate of hospitalised cases in
Australia was among the 70–79 age group (10.5
Higher disease severity, as indicated by hospital- per 100,000 populations), followed by the 80–89
isation and death, was associated with increased years age group (9.2 per 100,000).
age and comorbidities (Figure 8). The median
age of cases who were hospitalised (median: Approximately 3% of hospitalised cases were
61, interquartile range (IQR): 43–72 years) and children and young adults aged 19 years and
died (median: 80, IQR: 74–86) was higher than under. Of this group, the highest proportion of
for cases overall (median: 47 years, IQR: 29–62 hospitalised cases was among children aged 5
years). This is consistent with international and under, with hospitalisation of 12% of cases.
reporting and reflects a greater risk of severe Some of these hospitalisations may be precau-
disease, complications, and deaths in the elderly tionary, rather than necessarily being due to
(Tables 4 and 5). illness severity. Of the hospitalised cases among
children and young adults, two were admitted to
The crude case fatality rate and the proportion ICU with one receiving ventilation; both cases
of cases requiring hospitalisation in Australia were both aged 10–19 years.
both remain substantially lower than the cor-
responding values reported from many other The most commonly reported comorbid condi-
comparable high-income countries. Of total tions among hospitalised cases were cardiac
cases of COVID-19 notified in Australia, 866 disease (19%), diabetes (18%) and chronic res-
(12%) were admitted to hospital compared to piratory conditions (13%). Obesity was reported
42% of cases reported requiring hospitalisation as a comorbid condition by 7% (n = 43) of hospi-
in the EU/EEA. It is noted that the higher pro- talised cases (Table 6).
portion reported by EU/EEA is affected by each
country’s testing strategies, with some European
countries now only testing hospitalised indi-
viduals for COVID-19.2
10 of 26 Commun Dis Intell (2018) 2020;44(https://doi.org/10.33321/cdi.2020.44.43) Epub 15/5/2020 health.gov.au/cdiTable 4: Demographics of all cases, hospitalised cases and deaths, Australia
All cases Hospitalisation Death
Male Female Persons Male Female Persons Male Female Persons
Median 48 47 47 62 60 61 79 81 80
age (IQR) (30–63) (28–62) (29–62) (45–73) (40–71) (43–72) (74–85) (76–89) (74–86)
Crude
1.6% 1.4% 1.3% 8.6% 6.9% 7.9% – – –
CFRa
a CFR = case fatality rate.
Table 5: Crude CFR of all cases and hospitalised cases, Australia, by age group
All cases Hospitalisation
Age group
CFR Total cases CFR Total cases
Under 50 0.03% 3,747 0.4% 273
50–59 0.2% 1,107 1.5% 131
60–69 1.0% 1,142 5.5% 183
70 and over 8.6% 975 19.7% 279
All age groups 1.4% 6,971 7.9% 866
Table 6: Common COVID-19 comorbidities for all cases, hospitalised cases, cases admitted to
ICU and cases ventilated in ICU
All cases Hospitalised Cases admitted Cases ventilated
(n = 5,074)a cases (n = 600)a to ICU (n = 124)a in ICU (n = 33)a
Common comorbidities
Cardiac disease (excluding
407 (8%) 112 (19%) 25 (20%) 6 (18%)
hypertension)
Diabetes 365 (7%) 107 (18%) 29 (23%) 9 (27%)
Chronic respiratory condition
173 (3%) 75 (13%) 17 (14%) 4 (12%)
(excluding asthma)
Obesity 196 (4%) 43 (7%) 18 (15%) 8 (24%)
Number of specified comorbiditiesb
One or more 1,478 (29%) 329 (55%) 80 (65%) 24 (73%)
Two or more 327 (6%) 105 (18%) 31 (25%) 8 (24%)
Three or more 77 (2%) 37 (6%) 13 (10%) 3 (9%)
a Excludes those with missing data on comorbidities or where comorbidity is unknown.
b Includes asthma, chronic respiratory conditions (excluding asthma), cardiac disease (excluding hypertension), immunosuppressive
condition/therapy, diabetes, obesity, liver disease, renal disease and neurological disorder.
health.gov.au/cdi Commun Dis Intell (2018) 2020;44(https://doi.org/10.33321/cdi.2020.44.43) Epub 15/5/2020 11 of 26Figure 7: Variation in combinations of COVID-19 symptoms in confirmed cases, Australiaa
12 of 26
Commun Dis Intell (2018) 2020;44(https://doi.org/10.33321/cdi.2020.44.43) Epub 15/5/2020
a This figure shows the variation in combinations of symptoms observed in reported cases (n = 6,476) for the five most frequently observed symptoms (cough, fever, sore throat, headache, runny nose). The
horizontal bars on the left show the frequency of symptom occurrence in any combination with other symptoms. The circles and lines indicate particular combinations of symptoms observed in individual
health.gov.au/cdi
patients. The vertical green bars indicate the frequency of occurrence of the corresponding combination of symptoms.Figure 8: Age distribution of all cases, hospitalised cases, and deaths with median, interquartile
range, and range
100
80
60
Age (years)
40
20
0
All cases Hospitalised cases Deaths
Of the hospitalised COVID-19 cases, 18% (n 2% reported three or more. The proportion of
= 159) were admitted to an intensive care unit COVID-19 cases who reported one or more
(ICU), with 45 cases receiving ventilation. The comorbid conditions increased with the level
most commonly-reported comorbid conditions of care required, with 73% of ventilated cases
among cases admitted to an ICU were diabetes reporting comorbid conditions.
(29%) and cardiac disease (25%), which is simi-
lar to the most commonly reported comorbid The median age of cases who died was 80 years
conditions among hospitalised cases. Compared (IQR: 74–86 years). Fifty-five of the cases were
with hospitalised cases, a greater proportion of male and 43 were female. The most commonly
cases admitted to an ICU or receiving ventila- reported comorbid conditions among COVID-
tion (15% and 24% respectively) were reported 19 deaths were cardiac disease (32%), diabetes
as being obese. (26%) and chronic respiratory disease (22%).
Immunosuppressive condition/therapy (18%)
Among those aged 19 years and under, asthma and neurological disorder (18%) were also more
was the most common comorbid condition, commonly reported among deceased cases.
reported by 12% (n = 23) of all cases and 27% Comorbid conditions were more common
(n = 3) of hospitalised cases in this age group. among cases who died, with 74% reported to
This aligns generally with the broader popula- have one or more specified comorbid condi-
tion, with 10.3% (95% CI 9.3–11.3%) of young tions, 42% with two or more and 14% with three
Australians aged 0–17 estimated to have asthma or more.
in 2017–2018.3
Of all cases, 29% reported one or more comor-
bid conditions, 6% reported two or more and
health.gov.au/cdi Commun Dis Intell (2018) 2020;44(https://doi.org/10.33321/cdi.2020.44.43) Epub 15/5/2020 13 of 26Similar comorbidities have been reported from The Australian Health Protection Principal
COVID-19 cases internationally, with cardiac Committee issues advice to inform the national
disorder (excluding hypertension), chronic lung public health response to the pandemic. This
disease (excluding asthma) and diabetes the most advice has most recently included national prin-
commonly reported underlying health condi- ciples for resumption of sport and recreation
tions in EU/EEA countries and the US.2,4 As in activities. The Australian Government has also
Australia, the proportion of cases with underly- launched a voluntary app called COVIDSafe, a
ing conditions in these countries increased with new tool to help speed up notification of people
COVID-19 severity. exposed to COVID-19. All Australians are being
encouraged to download the COVIDSafe app to
Public health response measures hasten the relaxing of physical distancing meas-
ures, with more than 5.3 million Australians
Since COVID-19 first emerged internationally, downloading the app so far. Key aspects of
Australia has implemented public health meas- Australia’s evolving public health response are
ures in response to the disease’s epidemiology, summarised in Table 8.
both overseas and in Australia (Figure 9). These
measures are focused on domestic and inter-
national travel and public gatherings; priorities
for testing and quarantining of suspected cases
and close contacts; guidance on effective social
distancing; and the protection of vulnerable
populations such as those in residential care
facilities and remote Aboriginal and Torres
Strait Islander communities.
On Friday 8 May, the Australian Government
announced a three-step framework for eas-
ing COVID-19 restrictions. Progress will be
reviewed every three weeks to assess the impact
of these changes, with the intention of achiev-
ing a COVID safe Australia in July 2020. States
and territories will ease restrictions at their
own pace depending on the current public
health situation and local epidemiology, noting
that restrictions in these jurisdictions also dif-
fer slightly. The Northern Territory, Western
Australia and Tasmania have announced ‘road-
maps’ for easing of restrictions with set dates for
each step of their respective plans. New South
Wales, Queensland and the Australian Capital
Territory have announced initial or further eas-
ing of restrictions during this reporting period
but have not published roadmaps for future eas-
ing of restrictions. Victoria and South Australia
have not announced easing of restrictions dur-
ing the current reporting period. A summary of
key announcements from this reporting week
regarding easing of restrictions in states and ter-
ritories is at Table 7.
14 of 26 Commun Dis Intell (2018) 2020;44(https://doi.org/10.33321/cdi.2020.44.43) Epub 15/5/2020 health.gov.au/cdiTable 7: State and territory announcements for easing COVID-19 restrictions, from 3 May to 10
May 2020
Jurisdiction Announcement or restrictions which have been eased
New South Wales On 10 May, the NSW Government announced that from 15 May the following restrictions
will be eased:5
Gatherings of up to 10 people will be permitted outdoors, in cafes and restaurants, or in
places of worship;
Up to 5 visitors may gather in a household;
Weddings up to 10 guests, indoor funerals up to 20 mourners and outdoor funerals up to
30 mourners; and
Use of outdoor equipment and outdoor pools permitted with restrictions.
Queensland On 8 May, the Qld Government announced the following restrictions will be eased:6
From 10 May, up to 5 visitors from one household or 2 visitors from different households
were permitted; and
From 11 May, community kindergarten, school children in years prep, 1, 11 or 12 and school
children of essential workers will be permitted to attend school.
Western Australia On 10 May, the WA Government announced a roadmap for easing restrictions. In phase 2
from May 18 the following restrictions will be eased:7
Indoor and outdoor gatherings of up to 20 people permitted. Weddings and funerals may
have 20 indoor or 30 people outdoors. Cafes and restaurants, places of worship, sports
classes and community facilities permitted up to 20 patrons; and
Regional travel restrictions to be relaxed.
Tasmania On 8 May, the Tasmanian Government released a phased roadmap for easing of restrictions.
In phase 1 from May 11 the following restrictions will be eased:8
Funerals may have 20 mourners attend;
Aged care visits to recommence with up to two visitors once per week;
National parks and reserves within 30km available for exercise; and
TAFE education permitted for some small groups for practical learning.
Australian Capital From 8 May the following restrictions were eased:9
Territory All indoor and outdoor gatherings may have up to 10 people, including household
gatherings, places of worship, outdoor personal fitness and open houses for real estate;
and
Weddings up to 10 guests, indoor funerals up to 20 mourners and outdoor funerals up to
30 mourners.
The ACT Government have announced that public schools will return to on-campus
learning over a four week period commencing from 18 May.9
Northern Territory On May 8, Northern Territory updated their roadmap for easing of restrictions. In phase 2
from May 15 the following restrictions will be eased:10
Cafes, restaurants, food courts, indoor markets and bars to reopen;
Sporting clubs, gymnasiums, physical training and exercise classes including dance to
recommence; and
Libraries, playgrounds, places of worship, art galleries, museums and zoos to reopen.
health.gov.au/cdi Commun Dis Intell (2018) 2020;44(https://doi.org/10.33321/cdi.2020.44.43) Epub 15/5/2020 15 of 26Table 8: Timeline of key COVID-19 related events, including Australian public health response
activities.
Date Event / response activity
8 May 2020 The Australian Government announces a three-step plan to ease COVID-19 restrictions.11
1 May 2020 AHPPC releases a statement on risk management for re-opening boarding schools and school-based
residential colleges.12
26 April 2020 The Australian Government launches a new voluntary coronavirus app, COVIDSafe.13
24 April 2020 AHPPC provides statements on the recommencement of kidney transplantation, updated advice
regarding schools, and use of PPE in hospital with patients with COVID-19.14
21 April 2020 AHPPC provides advice for residential aged care facilities about minimising the impact of COVID-19 with
information on entry restrictions, managing illness in visitors and staff, and hygiene measures.15
21 April 2020 The Australian Government announces the gradual ease of restrictions on elective surgery from Tuesday
28 April 2020.16
16 April 2020 AHPPC provides advice on reducing the potential risk of COVID-19 transmission in schools.17
9 April 2020 Air crew on international flights will be required to self-isolate at their place of residence (or hotel if not
in their local city) between flights or for 14 days, whichever is shorter.18
30 March 2020 Special provisions be applied to vulnerable people in the workplace and application of additional
regional social distancing measures to combat COVID-19.19
29 March 2020 Both indoor and outdoor public gatherings limited to two persons only.
28 March 2020 All people entering Australia required to undertake a mandatory 14-day quarantine at designated
facilities (e.g. hotels) in their port of arrival.
26 March 2020 Restricted movement into certain remote areas to protect community members from COVID-19.
24 March 2020 Temporary suspension of all non-urgent elective procedures in both the public and private sector;
Progressive scale up of social distancing measures with stronger measures in relation to non-essential
gatherings, and considerations of further more intense options; and
Aged care providers limit visits to a maximum of two visitors at one time per day.
25 March 2020 School-based immunisation programs, with the exception of the delivery of meningococcal ACWY
vaccine, are paused; and
Australian citizens and Australian permanent residents are restricted from travelling overseas.
21 March 2020 Qld, WA, NT and SA close borders to non-essential travellers.
20 March 2020 Travel ban on foreign nationals entering Australia;
Restriction of travel to remote communities; and
Tasmania closes borders to non-essential travellers.
18 March 2020 DFAT raises travel advice for all overseas destinations to Level 4 ‘Do Not Travel’;
Continuation of a 14-day quarantine requirement for all returning travellers; and
Restrictions on indoor gatherings.
16 March 2020 Non-essential static gatherings of > 500 people banned.
15 March 2020 All overseas arrivals required to self-isolate for 14 days and cruise ship arrivals banned.
8 March 2020 Restrictions on COVID-19 contacts and travellers from listed higher risk countries.
5 March 2020 Restrictions on travel from Republic of Korea.
1 March 2020 Restrictions on travel from Islamic Republic of Iran.
16 of 26 Commun Dis Intell (2018) 2020;44(https://doi.org/10.33321/cdi.2020.44.43) Epub 15/5/2020 health.gov.au/cdiFigure 9: COVID-19 notifications in Australia by date of onset, from 13 January to 10 May 2020,a with timing of key public health measures
500 20 March 2020
Travel ban on foreign
health.gov.au/cdi
nationals entering Australia.
Restriction of travel to
450 remote communities.
18 March 2020
Restrictions on
indoor gatherings
400
350 16 March 2020
Non-essential static
gatherings of >500 28 March 2020
people banned. All people entering Australia
300 required to undertake a
15 March 2020
mandatory 14-day
All overseas arrivals
quarantine at designated
required to self-isolate
facilities (e.g. hotels) in their
for 14 days and cruise
250 port of arrival.
ship arrivals banned.
8 May 2020
Government
200 announces three-
Number of new cases
step plan to ease
restrictions.
Implementations to
150 vary in states and
territories
27 April 2020
Start of easing restrictions in
100 select state and territories
50
Commun Dis Intell (2018) 2020;44(https://doi.org/10.33321/cdi.2020.44.43) Epub 15/5/2020
0
13Jan2020
18Jan2020
23Jan2020
28Jan2020
02Apr2020
07Apr2020
12Apr2020
17Apr2020
22Apr2020
27Apr2020
02Feb2020
07Feb2020
12Feb2020
17Feb2020
22Feb2020
27Feb2020
03Mar2020
08Mar2020
13Mar2020
18Mar2020
23Mar2020
28Mar2020
02May2020
07May2020
Date of illness onset
17 of 26
a Due to reporting delays, interpret the latest days’ new cases with caution.International situation20 unknown if detection of viral RNA correlates
with shedding of live virus and transmission
As at 18:00 AEST 10 May 2020, the total num- risk.2,23
ber of confirmed COVID-19 cases and deaths
reported to the World Health Organization A recent study suggests that children do not
(WHO) from the 216 affected countries territo- play a key role in household transmission and
ries and regions was 3,917,366 cases and 274,361 are unlikely to be the primary source of house-
deaths. Over the past four weeks, the number of hold infections.24 In a population-based study
new cases per week has remained consistent at in Iceland, children under 10 years old had a
approximately 550,000 and in the last week the lower incidence of SARS-CoV-2 infection than
number of new cases was 567,580. All WHO adults; 6.7% vs. 13.7% in children and adults
regions reported an increase in cases and deaths respectively.25
in the past week. The sharpest increase in both
cases and deaths was reported from the South- Incubation period
East Asia region (49% and 41%, respectively)
and the lowest increase was reported from the Estimates of median incubation period, based on
Western Pacific region (5% and 4%, respectively). seven published studies, are 5 to 6 days (ranging
Overall, approximately 57% of the total COVID- from 1 to 14 days). Patients with long incubation
19 deaths are from the European Region, 36% periods do occasionally occur; however, they are
from the Americas, and 7% from the remaining likely to be ‘outliers’ who should be studied fur-
Regions. ther but who are unlikely to represent a change
in epidemiology of the virus.26,27
Background
Molecular epidemiology
The current estimates on epidemiological param-
eters including severity, transmissibility and Since December 2019, the virus has diversified
incubation period are uncertain. Estimates are into multiple lineages as it has spread globally,
likely to change as more information becomes with some degree of geographical clustering.
available. The whole genome sequences currently avail-
able from Australian cases are dispersed across
Transmission these lineages, reflecting multiple concurrent
introductions into Australia.28,29 Genomic clus-
Human-to-human transmission of SARS-CoV-2 ters—closely related sequences reflecting local
is via droplets and fomites from an infected per- transmission chains—have also been identified
son to a close contact.21 A virological analysis of in Australia.28 Genomic epidemiology has suc-
hospitalised cases found active virus replication cessfully been used to link to known genomic
in upper respiratory tract tissues, with phar- clusters many cases that were epidemiologically
yngeal virus shedding during the first week of classified as ‘locally acquired – contact not iden-
symptoms.22 However, current evidence does tified’.28
not support airborne or faecal-oral spread as
major factors in transmission.21 Clinical features
Viral RNA has been identified in respiratory COVID-19 presents as mild illness in the major-
track specimens 1–2 days prior to symptoms ity of cases, with cough and fever being the most
onset, and has been observed after symptom commonly reported symptoms. Severe or fatal
cessation. In 50% of the patients, seroconversion outcomes are more likely to occur in the elderly
occurred after seven days with a range of up to or those with comorbid conditions.21,30
14 days; this seroconversion was not followed
by a rapid decline in viral load.23 However, it is
18 of 26 Commun Dis Intell (2018) 2020;44(https://doi.org/10.33321/cdi.2020.44.43) Epub 15/5/2020 health.gov.au/cdiFigure 10: Number of COVID-19 cases (logarithmic scale) by selected country and days since passing 100 cases, up to 10 May 2020
10,000,000
health.gov.au/cdi
Australia
Italy
Germany
1,000,000 UK
USA
Norway
Sweden
Denmark
100,000 Czech Republic
10,000
Number of cases (log scale)
1,000
Commun Dis Intell (2018) 2020;44(https://doi.org/10.33321/cdi.2020.44.43) Epub 15/5/2020
100
0 2 4 6 8 10 12 14 16 18 20 22 24 26 28 30 32 34 36 38 40 42 44 46 48 50 52 54 56 58 60 62 64 66
Days since passing 100 cases
19 of 26Figure 11: Number of COVID-19 deaths (logarithmic scale) by selected country and days since passing 50 deaths, up to 10 May 2020
20 of 26
50,000
5,000
Australia Italy
Germany UK
Number of deaths (log scale)
500 USA Norway
Sweden Denmark
Commun Dis Intell (2018) 2020;44(https://doi.org/10.33321/cdi.2020.44.43) Epub 15/5/2020
Czech Republic
50
0 2 4 6 8 10 12 14 16 18 20 22 24 26 28 30 32 34 36 38 40 42 44 46 48 50 52 54
Days since passing 50 deaths
health.gov.au/cdiSome COVID-19 patients show neurological medium-sized blood vessels throughout the
signs such as headache, nausea and vomiting. body, in particular, the coronary arteries (blood
There is evidence that SARS-CoV-2 viruses are vessels around the heart). It predominantly
not always confined to the respiratory tract and affects children under 5 years and the cause
may invade the central nervous system inducing is unknown. In Australia, there are usually
neurological symptoms. As such, it is possible around 200 to 300 cases diagnosed per year of
that invasion of the central nervous system is Kawasaki disease.44 Evidence of the association
partially responsible for the acute respiratory between COVID-19 and the development of
failure of COVID-19 patients.31 Kawasaki disease is currently inconclusive and
further investigation is needed due to variability
There is some evidence to suggest that impair- in clinical presentations in reported paediatric
ment or loss of the sense of smell (hyposmia/ cases.
anosmia) or taste (hypoguesia/aguesia) is asso-
ciated with COVID-19.32,33 This is supported by Treatment
research finding a biological mechanism for the
SARS-CoV-2 virus to cause olfactory dysfunc- Current clinical management of COVID-19 cases
tion.34,35 focuses on early recognition, isolation, appropri-
ate infection control measures and provision of
Examination of cases and their close contacts in supportive care.45 Whilst there is no specific
China found a positive association between age antiviral treatment currently recommended for
and time from symptom onset to recovery. The patients with suspected or confirmed SARS-
study also found an association between clini- CoV-2 infection, multiple clinical trials are
cal severity and time from symptom onset to underway to evaluate a number of therapeutic
time to recovery. Compared to people with mild agents, including remdesivir, lopinavir/ritona-
disease, those with moderate and severe disease vir, and chloroquine or hydroxychloroquine.46,47
were associated with a 19% and 58% increase in Several COVID-19 vaccines have commenced
time to recovery, respectively.36 clinical trials.
Several studies have identified cardiovascular Data considerations
implications resulting from COVID-19.37–39
Vascular inflammation has been observed in a Data were extracted from the NNDSS on 12 May
number of cases and may be a potential mecha- 2020, by diagnosis date. Due to the dynamic
nism for myocardial injury which can result in nature of the NNDSS, data in this extract are
cardiac dysfunction and arrhythmias. subject to retrospective revision and may vary
from data reported in published NNDSS reports
Recently published literature outside of Wuhan and reports of notification data by states and
found that approximately 10% of all cases devel- territories.
oped gastrointestinal symptoms associated with
COVID-19 infection either on admission or Acknowledgements
during hospitalisation.40,41 This number is higher
than the 3% previously reported in Wuhan. This report represents surveillance data reported
through CDNA as part of the nationally-coordi-
Paediatric cases nated response to COVID-19. We thank public
health staff from incident emergency operations
There have been some reported instances of centres in state and territory health departments,
children with COVID-19 presenting with a and the Australian Government Department
rare clinical presentation resembling Kawasaki of Health, along with state and territory public
disease.42,43 Kawasaki disease is a rare acute health laboratories.
febrile illness with inflammation of small- and
health.gov.au/cdi Commun Dis Intell (2018) 2020;44(https://doi.org/10.33321/cdi.2020.44.43) Epub 15/5/2020 21 of 26Author details 5. Government of New South Wales. NSW to
ease COVID-19 restrictions from Friday 15
Corresponding author May. [Internet.] Sydney: Government of New
South Wales; 2020. [Accessed on 12 May
COVID-19 National Incident Room 2020.] Available from: https://www.nsw.gov.
Surveillance Team, Australian Government au/news/nsw-to-ease-covid-19-restrictions-
Department of Health, GPO Box 9484, MDP from-friday-15-may.
14, Canberra, ACT 2601.
Email: epi.coronavirus@health.gov.au 6. Queensland Department of Health. Home
Confinement, Movement and Gathering Di-
References rection (No. 4): Understanding this direction.
[Internet.] Brisbane: Queensland Governent,
1. Zimmermann P, Curtis N. Coronavirus Department of Health; 2020. [Accessed on
infections in children including COVID-19: 12 May 2020.] Available from: https://www.
an overview of the epidemiology, clinical health.qld.gov.au/system-governance/legisla-
features, diagnosis, treatment and preven- tion/cho-public-health-directions-under-
tion options in children. Pediatr Infect Dis expanded-public-health-act-powers/home-
J. 2020;39(5):355–368. doi: https://doi. confinement-movement-gathering-direction/
org/10.1097/INF.0000000000002660. help.
2. European Centre for Disease Prevention and 7. Department of the Premier and Cabinet.
Control (ECDC). Rapid risk assessment: COVID-19 coronavirus: WA Roadmap.
Coronavirus disease 2019 (COVID-19) [Internet.] Perth: Government of Western
pandemic: increased transmission in the EU/ Australia, Department of the Premier and
EEA and the UK – ninth update. [Internet.] Cabinet; 2020. [Accessed on 12 May 2020.]
Solna: ECDC; 23 April 2020. Available from: Available from: https://www.wa.gov.au/or-
https://www.ecdc.europa.eu/en/publications- ganisation/department-of-the-premier-and-
data/rapid-risk-assessment-coronavirus-dis- cabinet/covid-19-coronavirus-wa-roadmap.
ease-2019-covid-19-pandemic-ninth-update.
8. Department of Premier and Cabinet. Tasma-
3. Australian Bureau of Statistics. 4364.0.55.001 nia’s Roadmap to Recovery. [Internet.] Ho-
- National Health Survey: First Results, 2017- bart: Tasmanian Government, Department
18. [Internet.] Canberra: Australian Govern- of Premier and Cabinet; 2020. [Accessed on
ment, Australian Bureau of Statistics; 2018. 12 May 2020.] Available from: http://www.
[Accessed on 12 May 2020.] Available from: premier.tas.gov.au/releases/tasmanias_road-
https://www.abs.gov.au/AUSSTATS/abs@. map_to_recovery.
nsf/DetailsPage/4364.0.55.0012017-18.
9. Australian Capital Territory Government.
4. Centers for Disease Control and Prevention Some easing of COVID-19 restrictions be-
(CDC). COVIDView: a weekly surveillance gins. [Internet.] Canberra: Australian Capital
summary of U.S. COVID-19 activity. Key Territory Government; 2020. [Accessed on
updates for week 18, ending May 2, 2020. 12 May 2020.] Available from: https://www.
[Internet.] Atlanta: United States Govern- act.gov.au/our-canberra/latest-news/2020/
ment Department of Health and Human may/some-easing-of-covid-19-restrictions-
Services, CDC; 2020. [Accessed on 14 May begins.
2020.] Available from: https://www.cdc.gov/
coronavirus/2019-ncov/covid-data/pdf/cov- 10. Northern Territory Government. Road-
idview-05-08-2020.pdf. map to the new normal. [Internet.] Darwin:
Northern Territory Government; 2020.
22 of 26 Commun Dis Intell (2018) 2020;44(https://doi.org/10.33321/cdi.2020.44.43) Epub 15/5/2020 health.gov.au/cdi[Accessed on 12 May 2020.] Available from: dential aged care facilities. [Internet.] Can-
https://coronavirus.nt.gov.au/steps-to-re- berra: Australian Government Department
start/roadmap-new-normal. of Health; 2020. [Accessed 28 April 2020.]
Available from: https://www.health.gov.au/
11. Department of the Prime Minister and news/australian-health-protection-principal-
Cabinet. Update on coronavirus measures. committee-ahppc-advice-on-residential-
[Internet.] Canberra: Australian Govern- aged-care-facilities.
ment, Department of the Prime Minister and
Cabinet; 2020. [Accessed on 12 May 2020.] 16. Australian Government Department of
Available from: https://www.pm.gov.au/me- Health. Government eases elective surgery
dia/update-coronavirus-measures-08may20. restrictions. [Internet.] Canberra: Australian
Government Department of Health; 2020.
12. Australian Government Department of [Accessed 28 April 2020.] Available from:
Health. Australian Health Protection Prin- https://www.health.gov.au/news/govern-
cipal Committee (AHPPC) statement on ment-eases-elective-surgery-restrictions.
risk management for re-opening board-
ing schools and school-based residential 17. Australian Government Department of
colleges. [Internet.] Canberra: Austral- Health. Australian Health Protection Princi-
ian Government Department of Health; pal Committee (AHPPC) advice on reducing
2020. [Accessed 5 May 2020.] Available the potential risk of COVID-19 transmission
from: https://www.health.gov.au/news/ in schools. [Internet.] Canberra: Australian
australian-health-protection-principal-com- Government Department of Health; 2020.
mittee-ahppc-statement-on-risk-manage- [Accessed 20 April 2020.] Available from:
ment-for-re-opening-boarding-schools-and- https://www.health.gov.au/news/australian-
school-based-residential-colleges. health-protection-principal-committee-ahp-
pc-advice-on-reducing-the-potential-risk-of-
13. Australian Government Department of covid-19-transmission-in-schools.
Health. COVIDSafe: New app to slow the
spread of coronavirus. [Internet.] Can- 18. Australian Government Department of
berra: Australian Government Department Prime Minister and Cabinet. Media State-
of Health; 2020. [Accessed 26 April 2020.] ment, 9 April 2020. [Internet.] Canberra:
Available from: https://www.health.gov.au/ Australian Government Department of
news/covidsafe-new-app-to-slow-the-spread- Prime Minister and Cabinet; 2020. Available
of-coronavirus. from: https://www.pm.gov.au/media/update-
coronavirus-measures-3.
14. Australian Government Department of
Health. Australian Health Protection Prin- 19. Australian Government Department of
cipal Committee (AHPPC) coronavirus Health. Australian Health Protection Princi-
(COVID-19) statements on 24 April 2020. pal Committee (AHPPC) Advice to National
[Internet.] Canberra: Australian Government Cabinet on 30 March 2020. [Internet.] Can-
Department of Health; 2020. [Accessed 28 berra: Australian Government Department
April 2020.] Available from: https://www. of Health; 2020. [Accessed 8 April 2020.]
health.gov.au/news/australian-health-protec- Available from: https://www.health.gov.au/
tion-principal-committee-ahppc-coronavi- news/australian-health-protection-principal-
rus-covid-19-statements-on-24-april-2020. committee-ahppc-advice-to-national-cabi-
net-on-30-march-2020.
15. Australian Government Department of
Health. Australian Health Protection Prin- 20. World Health Organization (WHO).
cipal Committee (AHPPC) advice on resi- Coronavirus disease 2019 (COVID-19)
health.gov.au/cdi Commun Dis Intell (2018) 2020;44(https://doi.org/10.33321/cdi.2020.44.43) Epub 15/5/2020 23 of 26situation report – 111. [Internet.] Geneva: tions for surveillance and response measures.
WHO; 2020. [Accessed 12 May 2020.] Lancet. 2020;395(10229):1039–46.
Available from: https://www.who.int/docs/
default-source/coronaviruse/situation- 28. Rockett RJ, Arnott A, Lam C, Sadsad
reports/20200510covid-19-sitrep-111.pdf. R, Timms V, Gray KA et al. Reveal-
ing COVID-19 transmission by SARS-
21. WHO. Report of the WHO-China joint CoV-2 genome sequencing and agent
mission on coronavirus disease 2019 (COV- based modelling. bioRxiv. doi: https://doi.
ID-19). [Internet.] Geneva: WHO; 2020. [Ac- org/10.1101/2020.04.19.048751.
cessed 1 Mar 2020.] Available from: https://
www.who.int/docs/default-source/corona- 29. Nextstrain team. Genomic epidemiology
viruse/who-china-joint-mission-on-covid- of novel coronavirus – Oceania-focused
19-final-report.pdf. subsampling. [Internet.] [Accessed on 5
May 2020.] Available online: https://next-
22. Zhou F, Yu T, Du R, Fan G, Liu Y, Liu Z et strain.org/ncov/oceania?c=division&f_
al. Clinical course and risk factors for mor- country=Australia&l=radial.
tality of adult inpatients with COVID-19 in
Wuhan, China: a retrospective cohort study. 30. Sun P, Qiu S, Liu Z, Ren J, Xi JJ. Clinical
Lancet. 2020;395:1054–62. characteristics of 50466 patients with 2019-
nCoV infection. medRxiv. 2020. doi: https://
23. Wölfel R, Corman VM, Guggemos W, Seil- doi.org/10.1101/2020.02.18.20024539.
maier M, Zange S, Müller MA et al. Virologi-
cal assessment of hospitalized patients with 31. Li B, Bai W, Hashikawa T. The neuroinvasive
COVID-2019. Nature. 2020. doi: https://doi. potential of SARS-CoV-2 may be at least par-
org/10.1038/s41586-020-2196-x. tially responsible for the respiratory failure of
COVID-19 patients. J Med Virol. 2020. doi:
24. Zhu Y, Bloxham CJ, Hulme KD, Sinclair https://doi.org/10.1002/jmv.25728.
JE, Tong ZW, Steele LE et al. Children are
unlikely to have been the primary source of 32. Mao L, Jin H, Wang M, Hu Y, Chen S, He Q
household SARS-CoV-2 infections. medRxiv. et al. Neurological manifestations of hos-
2020. doi: https://doi.org/10.1101/2020.03.26 pitalized patients with coronavirus disease
.20044826. 2019 in Wuhan, China. JAMA Neurol.
2020;e201127. doi: https://doi.org/10.1001/
25. Gudbjartsson DF, Helgason A, Jonsson H, jamaneurol.2020.1127.
Magnusson OT, Melsted P, Norddahl GL et
al. Spread of SARS-CoV-2 in the Icelandic 33. Drew DA, Nguyen LH, Steves CJ, Wolf J,
population. N Engl J Med. 2020. doi: https:// Spector TC, Chan AT. Rapid implementation
doi.org/10.1056/NEJMoa2006100. of mobile technology for real-time epide-
miology of COVID-19. medRxiv. 2020. doi:
26. WHO. Coronavirus disease 2019 (COV- https://doi.org/10.1101/2020.04.02.20051334.
ID-19) situation report – 29. [Internet.]
Geneva: WHO; 2020. [Accessed 22 Feb 34. Venkatakrishnan AJ, Puranik A, Anand
2020.] Available from: https://www.who.int/ A, Zemmour D, Yao X, Wu X et al.
docs/default-source/coronaviruse/situation- Knowledge synthesis from 100 million
reports/20200218-sitrep-29-covid-19.pdf. biomedical documents augments the deep
expression profiling of coronavirus re-
27. Pung R, Chiew CJ, Young BE, Chin S, Chen ceptors. bioRxiv. 2020. doi: https://doi.
M, Clapham HE. Investigation of three org/10.1101/2020.03.24.005702.
clusters of COVID-19 in Singapore: implica-
24 of 26 Commun Dis Intell (2018) 2020;44(https://doi.org/10.33321/cdi.2020.44.43) Epub 15/5/2020 health.gov.au/cdiYou can also read


