Using Tweets to Understand How COVID-19-Related Health Beliefs Are Affected in the Age of Social Media: Twitter Data Analysis Study
←
→
Page content transcription
If your browser does not render page correctly, please read the page content below
JOURNAL OF MEDICAL INTERNET RESEARCH                                                                                                  Wang et al

     Original Paper

     Using Tweets to Understand How COVID-19–Related Health
     Beliefs Are Affected in the Age of Social Media: Twitter Data
     Analysis Study

     Hanyin Wang1, BMed; Yikuan Li1, BSc, MSc; Meghan Hutch1, BSc; Andrew Naidech2, MD, MSPH; Yuan Luo1,
     PhD
     1
      Department of Preventive Medicine, Northwestern University, Chicago, IL, United States
     2
      Department of Neurology, Northwestern Universtity, Chicago, IL, United States

     Corresponding Author:
     Yuan Luo, PhD
     Department of Preventive Medicine
     Northwestern University
     750 N Lakeshore Dr
     Chicago, IL, 60611
     United States
     Phone: 1 312 503 5742
     Email: yuan.luo@northwestern.edu

     Abstract
     Background: The emergence of SARS-CoV-2 (ie, COVID-19) has given rise to a global pandemic affecting 215 countries and
     over 40 million people as of October 2020. Meanwhile, we are also experiencing an infodemic induced by the overabundance of
     information, some accurate and some inaccurate, spreading rapidly across social media platforms. Social media has arguably
     shifted the information acquisition and dissemination of a considerably large population of internet users toward higher
     interactivities.
     Objective: This study aimed to investigate COVID-19-related health beliefs on one of the mainstream social media platforms,
     Twitter, as well as potential impacting factors associated with fluctuations in health beliefs on social media.
     Methods: We used COVID-19-related posts from the mainstream social media platform Twitter to monitor health beliefs. A
     total of 92,687,660 tweets corresponding to 8,967,986 unique users from January 6 to June 21, 2020, were retrieved. To quantify
     health beliefs, we employed the health belief model (HBM) with four core constructs: perceived susceptibility, perceived severity,
     perceived benefits, and perceived barriers. We utilized natural language processing and machine learning techniques to automate
     the process of judging the conformity of each tweet with each of the four HBM constructs. A total of 5000 tweets were manually
     annotated for training the machine learning architectures.
     Results: The machine learning classifiers yielded areas under the receiver operating characteristic curves over 0.86 for the
     classification of all four HBM constructs. Our analyses revealed a basic reproduction number R0 of 7.62 for trends in the number
     of Twitter users posting health belief–related content over the study period. The fluctuations in the number of health belief–related
     tweets could reflect dynamics in case and death statistics, systematic interventions, and public events. Specifically, we observed
     that scientific events, such as scientific publications, and nonscientific events, such as politicians’ speeches, were comparable in
     their ability to influence health belief trends on social media through a Kruskal-Wallis test (P=.78 and P=.92 for perceived benefits
     and perceived barriers, respectively).
     Conclusions: As an analogy of the classic epidemiology model where an infection is considered to be spreading in a population
     with an R0 greater than 1, we found that the number of users tweeting about COVID-19 health beliefs was amplifying in an
     epidemic manner and could partially intensify the infodemic. It is “unhealthy” that both scientific and nonscientific events
     constitute no disparity in impacting the health belief trends on Twitter, since nonscientific events, such as politicians’ speeches,
     might not be endorsed by substantial evidence and could sometimes be misleading.

     (J Med Internet Res 2021;23(2):e26302) doi: 10.2196/26302

     https://www.jmir.org/2021/2/e26302                                                           J Med Internet Res 2021 | vol. 23 | iss. 2 | e26302 | p. 1
                                                                                                                (page number not for citation purposes)
XSL• FO
RenderX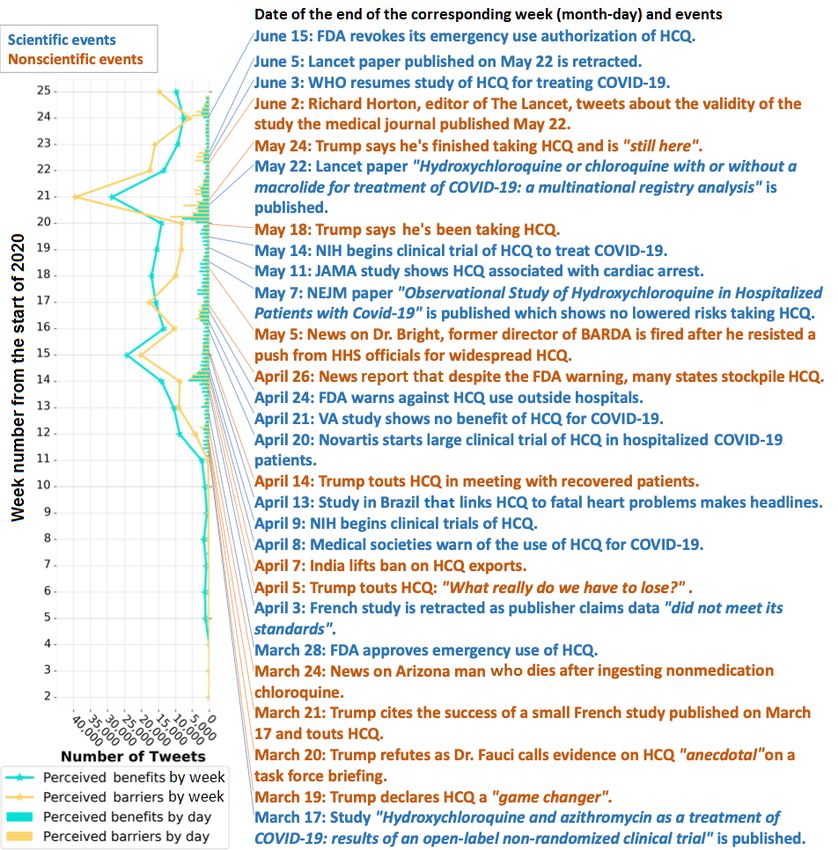
JOURNAL OF MEDICAL INTERNET RESEARCH                                                                                                   Wang et al

     KEYWORDS
     COVID-19; social media; health belief; Twitter; infodemic; infodemiology; machine learning; natural language processing

                                                                          are limited to the analyzed population and, therefore, may be
     Introduction                                                         biased. In this study, we expanded and diversified our study
     Beginning in December 2019, the outbreak of SARS-CoV-2               population by using crowdsourcing data from one of the
     rapidly evolved into a global pandemic [1-3]. As of the writing      mainstream social media platforms, Twitter, in order to
     of this paper, over 40 million cases and 1 million deaths from       investigate the health beliefs of the general public toward
     215 countries or regions have been confirmed [4]. However,           COVID-19 and its potential treatments.
     spreading faster than the virus is information. Sylvie Briand,       In addition to quantifying health beliefs, we aimed to identify
     Director of Infectious Hazards Management at the World Health        factors influencing fluctuations in public opinions. For instance,
     Organization (WHO)’s Health Emergencies Programme, pointed           the pandemic dynamics (ie, the number of cases and deaths due
     out “We know that every outbreak will be accompanied by a            to COVID-19) constitute one of the leading factors influencing
     kind of tsunami of information, but also within this information     attitudes toward the pandemic. Additionally, interventional
     you always have misinformation, rumors, etc.” [5]. The WHO           government policies may also impact the opinions of the general
     used the term infodemic to describe the overabundance of             public. Furthermore, it is reasonable to believe that health
     information and misinformation occurring during the COVID-19         belief–related posts can also be self-regulated as a consequence
     pandemic. Though the term infodemic was first coined in 2002         of their nature to induce or soothe panic for readers. Potential
     [6], the concerns over infodemics have recently become dramatic      treatments trigger massive discussions as well, such as the
     with the amplification effect from social media. The WHO held        debate over the appropriate use of the antimalarial drug
     the first Infodemiology Conference in June 2020 as the               hydroxychloroquine (HCQ) or chloroquine (CQ), advocated
     phenomenon had escalated to a level that required a coordinated      for by the then American President as a “game changer,” which
     response [7]. Even though we cannot avoid an infodemic, we           was then subsequently discarded. Public attitudes regarding
     can still manage it. Previous studies and commentaries proposed      potential treatments may be altered by public events, such as
     several perspectives to detect and fight the COVID-19 infodemic      the news or politicians’ speeches. Furthermore, rapidly emerging
     [5,8-10]. However, one of the critical points absent from these      scientific publications can also influence the point of view of
     studies is an investigation of health beliefs. Understanding how     the general public. In this paper, we aim to identify factors that
     the general public’s health beliefs are expressed and altered can    impact health beliefs on social media, which may serve as a
     facilitate our management of both the pandemic and infodemic.        probe for identifying better strategies to manage both the
     In conjunction, it is also essential to evaluate any concurrent or   pandemic and the infodemic.
     ongoing interventions.
                                                                          Contributions of this study include the following:
     The health belief model (HBM) quantifies health beliefs [11-13].
                                                                          1.   An evaluation of utilizing a mainstream social media
     The HBM was developed to investigate people’s beliefs about
     health problems. It consists of the following four core constructs        platform, Twitter, to facilitate a comprehensive
     that can be tailored for given hypotheses: (1) perceived                  understanding of health beliefs toward COVID-19 and
     susceptibility, (2) perceived severity, (3) perceived benefits,           potential treatments.
                                                                          2.   A publicly available data set annotated by multiple
     and (4) perceived barriers. The HBM has been widely used to
     investigate individual opinions toward diseases and                       professionals for studying the health beliefs related to
     interventional approaches, such as HIV risk behaviors [14],               COVID-19 and potential treatments.
                                                                          3.   Identification and comparison of factors that influence
     human papillomavirus (HPV) vaccines [15], and the gender
     difference in food choices [16]. In those cases, the HBM was              health beliefs toward COVID-19 and potential treatments,
     employed to evaluate people’s beliefs toward the given health             HCQ or CQ in particular.
                                                                          4.   An extendable framework for monitoring the general
     problem and their perceived benefits or barriers of action, for
     which each of the core constructs of the HBM is assessed based            public’s health beliefs during a pandemic and infodemic,
     on the corresponding definitions. During pandemics, researchers           which could be feasibly transferred to facilitate the
     have employed the HBM to investigate the health beliefs toward            management of future infodemic outbreaks, such as when
     public interventional policies, such as stay-at-home orders [17];         COVID-19 vaccines become available to the public.
     to analyze public health communication on Instagram during
     the Zika outbreak [18]; to examine public perceptions of             Methods
     physical distancing [19]; and to guide community pharmacists
                                                                          The entire workflow of data extraction, filtering, and
     in their communication with patients [20]. However, because
                                                                          classification is illustrated in Figure 1.
     these are survey-based or merely commentary studies, results

     https://www.jmir.org/2021/2/e26302                                                            J Med Internet Res 2021 | vol. 23 | iss. 2 | e26302 | p. 2
                                                                                                                 (page number not for citation purposes)
XSL• FO
RenderX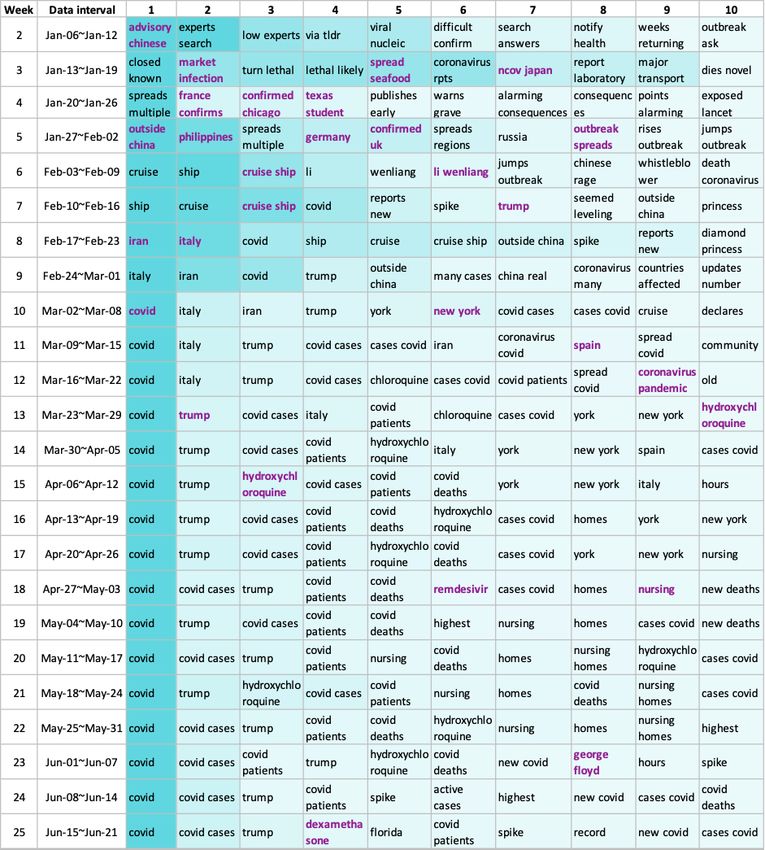
JOURNAL OF MEDICAL INTERNET RESEARCH                                                                                                            Wang et al

     Figure 1. The workflow of data selection, data annotation, and machine learning classifier training and implementation. API: application programming
     interface.

                                                                                of each tweet. The Social Media Mining Toolkit provided by
     Data                                                                       the Panacea Lab was used to hydrate the data set [22]. There is
     We used version 15.0 of the COVID-19 Twitter chatter data set              no limitation regarding the days prior to the extraction. A
     constructed by the Panacea Lab [21], which collected all                   language filter (ie, “lang” attribute in the tweet object = “en”)
     COVID-19-related tweets between January 6 and June 21, 2020.               was then applied to identify tweets written in the English
     The provided data set only contains the identifiers of                     language.
     corresponding tweets, so we used the application programming
     interface (API) provided by Twitter to extract the full content

     https://www.jmir.org/2021/2/e26302                                                                     J Med Internet Res 2021 | vol. 23 | iss. 2 | e26302 | p. 3
                                                                                                                          (page number not for citation purposes)
XSL• FO
RenderX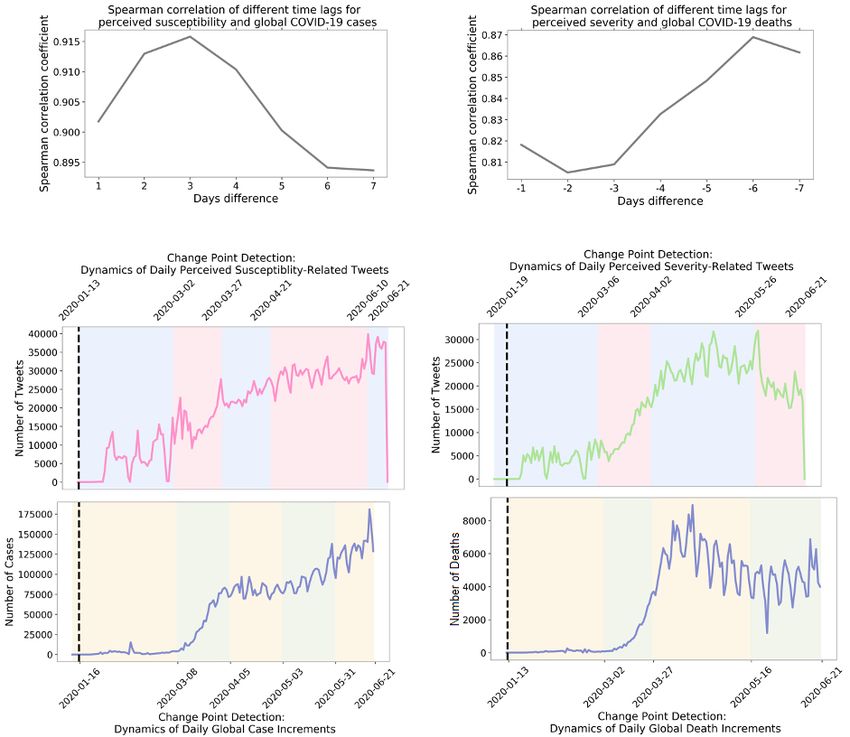
JOURNAL OF MEDICAL INTERNET RESEARCH                                                                                                               Wang et al

     Data Annotation for Constructing the Health Belief                            mapped to at least one of the four aforementioned constructs.
     Model                                                                         Thus, each tweet could potentially have up to five labels. The
                                                                                   annotation process was performed by three senior PhD students
     We employed the HBM to quantify health beliefs. As mentioned
                                                                                   in biomedical informatics (HW, YLi, and MH). All annotators
     above, it consists of the following four core constructs that can
                                                                                   classified the first 500 tweets individually, then reconciled
     be tailored for given hypotheses: (1) perceived susceptibility,
                                                                                   different opinions and built final annotation rules. The
     (2) perceived severity, (3) perceived benefits, and (4) perceived
                                                                                   definitions for each construct of the HBM are described in Table
     barriers. The HBM was developed to investigate people’s beliefs
                                                                                   1 with example tweets. Based on the rule, HW and YLi
     about health problems and has been widely used to investigate
                                                                                   annotated the rest of 5000 tweets independently and evaluated
     individual opinions toward diseases and interventional
                                                                                   the agreement using the Cohen κ score [23]. Finally, MH
     approaches, such as HIV risk behaviors [14], HPV vaccines
                                                                                   resolved the divergent annotations between HW and YLi with
     [15], and the gender difference in food choices [16].
                                                                                   further consideration. We made the data set with the 5000
     Specifically, for perceived benefits and barriers, we focused on
                                                                                   annotated tweets available for researchers [24]. To protect the
     HCQ or CQ, the antimalarial drug advocated for by the then
                                                                                   privacy of Twitter users and per Twitter’s policy, we did not
     American President as a “game changer,” which was then
                                                                                   include any tweet content in the data set. Instead, each tweet’s
     subsequently discarded. Tweets were labeled as positive or
                                                                                   unique identifier (ie, tweet ID) was provided.
     negative for being related to HBM, meaning they could be

     Table 1. Health belief model (HBM) constructs, definitions, and example tweets.
         Construct             Definitions of the construct                               Example tweet
         Perceived suscepti-   The assessment of the risk of getting COVID-19 infection “Across the UK, 194,990 people had tested positive for coronavirus
         bility                                                                         as of 9am on Tuesday, up from 190,584 at the same point on
                                                                                        Monday. Find out how many cases there are in your area.”
         Perceived severity    The assessment of whether COVID-19 is a sufficient health “US Recorded 1,297 Coronavirus Deaths in Past 24 Hours.”
                               concern
         Perceived benefits    The benefits of HCQa and CQb in prevention or treatment “Dr. Zelenko In NY has now treated 699 Coronavirus patients with
                               of COVID-19                                             100% success using Hydroxychloroquine.”
                               Positive statements or reports about HCQ and CQ
         Perceived barriers    The side effects of HCQ and CQ                             “Family of New York woman blames hydroxychloroquine combo
                               The unaffordable cost of HCQ and CQ                        for fatal heart attack.”
                               The inaccessibility of HCQ and CQ
                               Negative statements or reports about HCQ and CQ
         HBM related           Can be mapped to at least one of the four constructs above Any of the above tweets are examples for this construct

     a
         HCQ: hydroxychloroquine.
     b
         CQ: chloroquine.

                                                                                   kernel and l1 or l2 penalty; support vector machine with radial
     Machine Learning Classifiers                                                  basis function, polynomial, or sigmoid kernel; stochastic
     We trained machine learning classifiers on the annotated data,                gradient descent classifier with l1 or l2 or elastic net penalty;
     evaluated the performance, and automatically classified the 50                multinomial naïve Bayesian classifier; Bernoulli naïve Bayesian
     million tweets. The entire annotated data set was split into a                classifier; and logistic regression. Performance across classifiers
     training data set and a testing data set with a ratio of 8:2. Feature         was evaluated using the area under the receiver operating
     selection was applied by ignoring terms with a document                       characteristic (AUROC) curve, and the classifier that yielded
     frequency of less than 0.01 or greater than 0.99. Terms with                  the highest AUROC was chosen (see Multimedia Appendix 1,
     only letters were considered, but terms were ignored when there               Tables S1-S5). In total, five classifiers were built to construct
     were numbers or special characters. Before vectorization, we                  the final HBM. First, a classifier was trained to classify whether
     removed all the URLs; unified all the contractions, punctuation               a tweet was HBM related or not. Then, we collected all the
     marks, and white spaces; and converted all terms to lowercase                 tweets that were identified as HBM related for the following
     in the corpus. The free-text tweets were vectorized using both                task. Lastly, we built four classifiers to label each core construct
     bag-of-words and term frequency–inverse document frequency                    of the HBM separately.
     (tf-idf) algorithms. A list of English stop words provided by the
     natural language toolkit [25] was used to rule out unrelated                  The entire pipeline was built with Python 3.6.8 (Python Software
     words. Next, 5-fold cross-validation was performed to select                  Foundation). The bag-of-words algorithm, machine learning
     the best-suited classifier for the task. The machine learning                 classifiers, and model evaluations were implemented with the
     classifiers that we experimented on included Ridge classifier;                scikit-learn, version 0.22.1, package [26].
     perceptron; passive-aggressive classifier; k-nearest neighbors
     classifier; random forest; support vector machine with linear

     https://www.jmir.org/2021/2/e26302                                                                        J Med Internet Res 2021 | vol. 23 | iss. 2 | e26302 | p. 4
                                                                                                                             (page number not for citation purposes)
XSL• FO
RenderX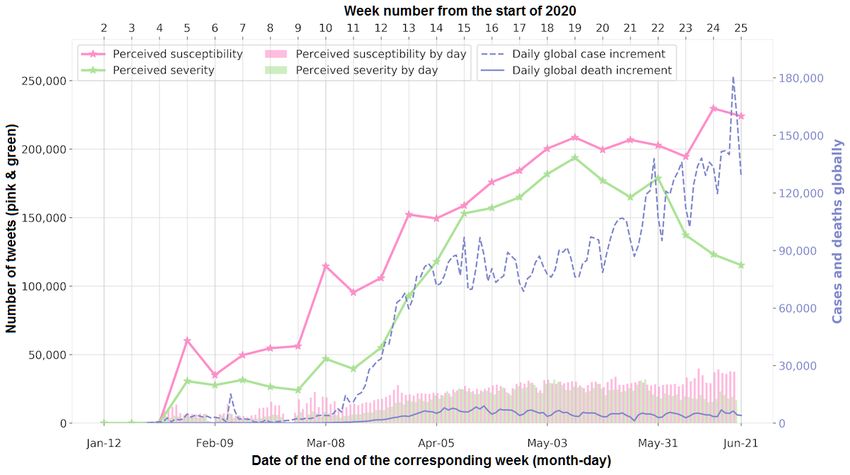
JOURNAL OF MEDICAL INTERNET RESEARCH                                                                                                              Wang et al

     The Overall Trend of Health Beliefs in Tweets                                severity. We visualized these two constructs together with the
     To quantify whether the information spread constituted an                    dynamics of the pandemic in Figure 2. We observed a similar
     infodemic, we applied one of the classic measurements in                     pattern in COVID-19 case dynamics and the number of tweets
     epidemiological models: the basic reproduction number, R0.                   regarding perceived susceptibility, as well as in the dynamics
                                                                                  of COVID-19 deaths and the number of tweets indicating
     We employed the susceptible-infectious-recovered (SIR) model
                                                                                  perceived severity. For the first pair, we observed an earlier
     [27], for which the detailed calculation can be found in the
                                                                                  increase in the number of perceived susceptibility tweets prior
     Multimedia Appendix 1. In our case of an infodemic, we
                                                                                  to a surge in COVID-19 cases, while for the second pair, there
     considered the users who tweeted about COVID-19 as the
                                                                                  was a delay in the increase of COVID-19 deaths compared with
     susceptible population; among this population, being infected
                                                                                  the number of perceived severity tweets. To investigate how
     meant a user tweeted about health beliefs defined in our HBM
                                                                                  many days the trend dynamics of health belief discussions
     scope, and recovering then indicated that a user stopped tweeting
                                                                                  followed or postponed the actual case or death increases, we
     about health beliefs. Thus, contact with infected individuals
                                                                                  calculated the Spearman correlation coefficient under various
     could be considered as reading health belief–related tweets
                                                                                  time lags (ie, for a 1-day lag, the correlation between the number
     posted by other users.
                                                                                  of tweets and the COVID-19 situation was calculated by moving
     The Trend of Health Belief Toward the Disease                                the COVID-19 trend 1 day forward). Moreover, we conducted
     There are two core constructs in the HBM that focus specifically             a change point analysis using the dynamic programming
     on the disease of interest: perceived susceptibility and perceived           algorithm [28] to detect the significant turning point of the
                                                                                  trends.
     Figure 2. Dynamics of perceived susceptibility and severity with COVID-19 case and death trends. The pink and green lines with "star" marks reflect
     the weekly cumulative number of tweets for perceived susceptibility and severity, while the pink and green bars on the x-axis indicate the daily number
     of tweets related to perceived susceptibility and severity. The global case and death dynamics have been available since January 22, 2020.

                                                                                  of interventions by visualizing the trends along with the timeline
     The Effect of Interventions                                                  of lockdowns in the United States.
     To evaluate the impact of interventions on the infodemic and
     the pandemic, we further investigated the lockdown in the                    News in the Top Topics
     United States. Because we were analyzing only tweets written                 To understand major topics in the tweets related to health beliefs,
     in the English language, and there were systematic official                  we extracted the top 10 phrases from the tweets each week. We
     lockdowns issued in the United States, we chose to study the                 considered unigrams and bigrams in this case. The frequency
     effect of US-based interventions on health beliefs. The location             of each phrase was not only calculated as the count; instead, we
     information is not available for each tweet. We analyzed 136,641             used the tf-idf score to find the highlighted topics of each week.
     tweets where the place was available—a variable in the tweet                 A higher tf-idf score is obtained if a given word or phrase
     object that, when present, indicates that the tweet is associated            frequently appears in one document but only appears in a small
     with a place—and subsequently identified 54,164 tweets                       number of documents.
     corresponding to the United States. We investigated the effect

     https://www.jmir.org/2021/2/e26302                                                                       J Med Internet Res 2021 | vol. 23 | iss. 2 | e26302 | p. 5
                                                                                                                            (page number not for citation purposes)
XSL• FO
RenderX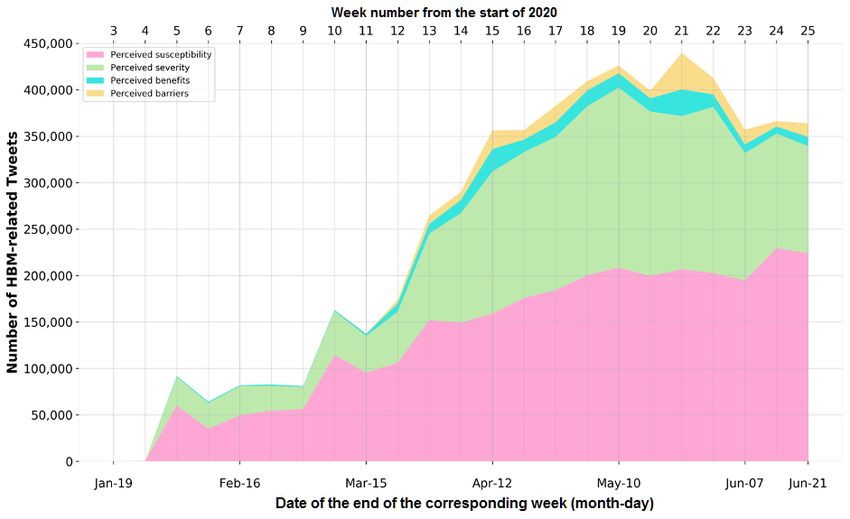
JOURNAL OF MEDICAL INTERNET RESEARCH                                                                                                             Wang et al

     The Influence of Scientific and Nonscientific Events                           of 51,792,817 English tweets. The Cohen κ score for interrater
     To evaluate the difference between the impact of scientific and                reliability of data annotation was 0.94 for identifying whether
     nonscientific events on health beliefs, we conducted a                         a given tweet was HBM related and was around 0.9 for the
     Kruskal-Wallis test. The Kruskal-Wallis test was chosen since                  annotation of all four individual HBM constructs (see Table 2).
     there was no reasonable assumed distribution for the influence                 Random forest was found to be the best-performing classifier
     of the two types of events, and the two groups being compared                  for the HBM-related classification and three of the HBM
     had different sample sizes. We collected events associated with                constructs (ie, perceived susceptibility, perceived benefits, and
     HCQ and CQ on the internet during the study period with no                     perceived barriers), while the passive-aggressive classifier was
     exclusion criteria. All the events were classified as scientific               found to be the most suitable choice for classifying whether a
     events if they were based on scientific evidence or endorsed by                tweet indicated perceived severity. The AUROC curves for
     authorities, while all remaining events were treated as                        HBM-related and the two disease-related constructs were all
     nonscientific events. To quantify the influences, for each event,              above 0.9, while AUROC curves for the two treatment-related
     we calculated the sum of the number of tweets that expressed                   constructs were around 0.86 (see Table 2).
     perceived benefits or perceived barriers regarding HCQ and CQ                  After classification, 5,585,780 tweets were HBM related, among
     on the day of the event and the day after.                                     which 3,058,121 (54.75%) tweets expressed perceived
                                                                                    susceptibility of COVID-19, 2,239,038 (40.08%) tweets
     Results                                                                        expressed perceived severity of COVID-19, 211,374 (0.04%)
                                                                                    tweets expressed perceived benefits of HCQ or CQ, and 190,839
     Data and Machine Learning Classifiers                                          (0.03%) tweets expressed perceived barriers toward HCQ or
     The data set contained identifiers for 104,512,658 unique tweets,              CQ. To further ensure the validity of the classification, we
     of which 92,687,660 were still available upon extraction. After                performed additional spot checks on the final results; examples
     applying the language filter, our final set for analysis consisted             can be found in Multimedia Appendix 1.

     Table 2. Performance of machine learning classifiers.
         Construct                        Cohen κa      Classifierb          AUROCc curve       Accuracy      Precisiond         Recalle             F1 scoref
         Perceived susceptibility         0.92          Random forest        0.97               0.94          0.92               0.85                0.88
         Perceived severity               0.88          Passive-aggressive   0.92               0.90          0.88               0.77                0.81
         Perceived benefits               0.92          Random forest        0.87               0.79          0.78               0.78                0.78
         Perceived barriers               0.92          Random forest        0.86               0.77          0.77               0.77                0.77

         HBMg related                     0.94          Random forest        0.90               0.84          0.84               0.84                0.84

     a
         The Cohen κ coefficient for interrater reliability of annotation.
     b
         The machine learning classifier selected by the best performance.
     c
         AUROC: area under the receiver operating characteristic.
     d
         Macro-averaged precision.
     e
         Macro-averaged recall.
     f
      Macro-averaged F1 score.
     g
         HBM: health belief model.

                                                                                    2020, and stacked together to show the total number of
     The Overall Trend of Health Beliefs in Tweets                                  HBM-related tweets. A dramatic increase can be observed from
     The visualization of the overall trend of health beliefs is shown              January to June, which indicates an increasing number of
     in Figure 3, with the number of tweets that fell into each core                discussions regarding personal health beliefs. The R0 was 7.62
     construct of the HBM. Each construct was displayed in a                        for the users who tweeted about health beliefs in our data.
     different color chronologically, starting from the third week of

     https://www.jmir.org/2021/2/e26302                                                                      J Med Internet Res 2021 | vol. 23 | iss. 2 | e26302 | p. 6
                                                                                                                           (page number not for citation purposes)
XSL• FO
RenderX
JOURNAL OF MEDICAL INTERNET RESEARCH Wang et al
Figure 3. Stacked area chart for the four core constructs of the health belief model (HBM) from January 19 to June 21, 2020.
depicted by color in Figure 4 also show similarities within the
The Trend of Health Belief Toward the Disease pair. For the second pair (ie, perceived severity and COVID-19
The left panel of Figure 4 displays the strongest correlation (ie, death trend in the right-hand panel of Figure 4), the strongest
0.92) between perceived susceptibility–related tweets and the correlation was found at –6 days (ie, 0.87), which indicates that
global case increment when imposing a 3-day lag (ie, moving changes in the perceived severity were lagging the actual death
the trend of COVID-19 cases 3 days forward so that the number dynamics by 6 days (ie, the strongest correlation was found
of perceived susceptibility tweets on January 13, 2020, will be when moving the death trend 6 days backward). The change
aligned with the number of COVID-19 cases on January 16, point analysis unraveled similar patterns between the trends of
2020). The patterns detected by the change point analysis perceived severity and COVID-19 deaths.
https://www.jmir.org/2021/2/e26302 J Med Internet Res 2021 | vol. 23 | iss. 2 | e26302 | p. 7
(page number not for citation purposes)
XSL• FO
RenderXJOURNAL OF MEDICAL INTERNET RESEARCH Wang et al
Figure 4. Correlation between perceived susceptibility–related tweets and COVID-19 case dynamics. Each pair of the lower four graphs are staggered
according to the time differences that achieve the highest correlation in the top graphs: 3 days and –6 days, respectively. The pink and blue as well as
the yellow and green shades depict the change points detected from the change point analysis.
Decisions made by Republican or Democratic governors are
The Effect of Interventions colored red and blue, respectively. The Republican states South
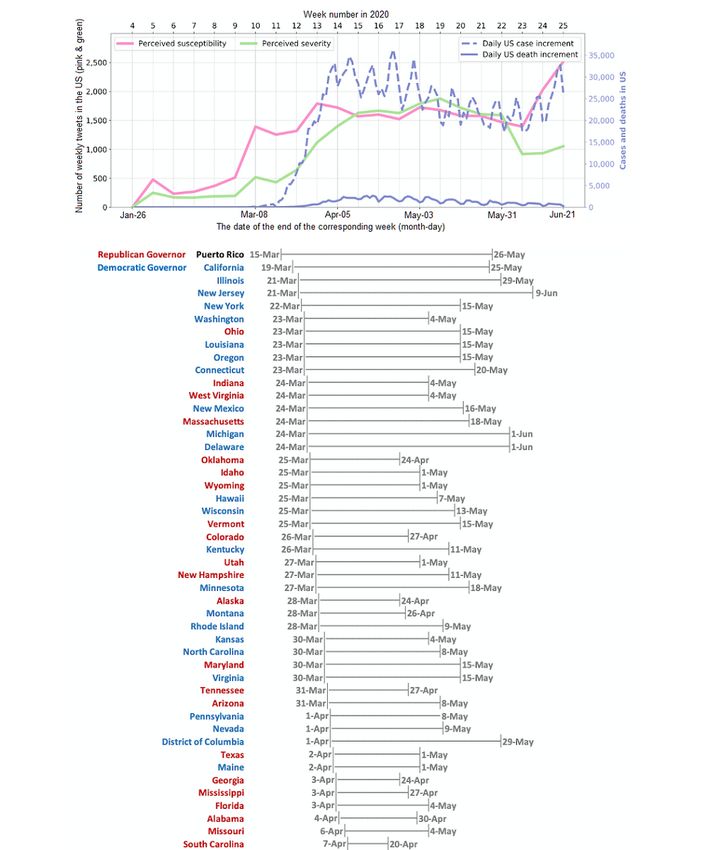
We visualized the trends of perceived susceptibility and Dakota, North Dakota, Iowa, Nebraska, and Arkansas did not
perceived severity along with the daily case and death dynamics announce official lockdowns and are not included in this figure.
in the United States in Figure 5. Meanwhile, lockdown The official documents of lockdown and reopen decisions for
information for each state is also listed by the timeline. each state are listed in Multimedia Appendix 1, Table S6.
https://www.jmir.org/2021/2/e26302 J Med Internet Res 2021 | vol. 23 | iss. 2 | e26302 | p. 8
(page number not for citation purposes)
XSL• FO
RenderXJOURNAL OF MEDICAL INTERNET RESEARCH Wang et al
Figure 5. Dynamics of health beliefs related to COVID-19 and the trend of case and death fluctuation in the United States with lockdown status. The
lower half of the figure shows the official lockdown circumstances in each US state by each governor. The lines corresponding to each state represent
the start and end date of the official lockdowns. The Republican states South Dakota, North Dakota, Iowa, Nebraska, and Arkansas did not announce
official lockdowns and are not shown in this figure. The full reference for each state can be found in Multimedia Appendix 1, Table S6.
of the cell indicates a higher tf-idf score. The featured phrases
News in the Top Topics that were closely related to the news during the corresponding
Top 10 topics, which where all changed to lowercase, according time periods are highlighted in purple.
to the tf-idf scores are shown in Figure 6, where a darker shade
https://www.jmir.org/2021/2/e26302 J Med Internet Res 2021 | vol. 23 | iss. 2 | e26302 | p. 9
(page number not for citation purposes)
XSL• FO
RenderXJOURNAL OF MEDICAL INTERNET RESEARCH Wang et al
Figure 6. Top 10 topics of each week. Top phrases for each week are organized horizontally in each row. The blue shade in each cell indicates the
term frequency–inverse document frequency (tf-idf) score of the phrase; the higher the tf-idf score, the darker the shade. The phrases that were likely
associated with news are highlighted in purple.
around the two most massive spikes, but scientific events were
The Influence of Scientific and Nonscientific Events majorly distributed along the timeline where many gentle
The list of events that we collected is shown on the right-hand fluctuations could be found. The Kruskal-Wallis test showed
side of Figure 7, while the trends of perceived benefits and no significant difference between the influence of scientific and
barriers are shown on the left-hand side. We observed that both nonscientific events for both perceived benefits and barriers
scientific and nonscientific events were associated with (H=0.078, P=.78; and H=0.002, P=.92, respectively). Full
fluctuations in health beliefs. The scales of the fluctuations references for each event can be found in Multimedia Appendix
observed varied over time. There were more nonscientific events 1, Table S7.
https://www.jmir.org/2021/2/e26302 J Med Internet Res 2021 | vol. 23 | iss. 2 | e26302 | p. 10
(page number not for citation purposes)
XSL• FO
RenderXJOURNAL OF MEDICAL INTERNET RESEARCH Wang et al
Figure 7. Dynamics of health beliefs related to hydroxychloroquine (HCQ) and chloroquine (CQ) with correlated scientific and nonscientific events.
Scientific events are those that have concrete scientific evidence or are endorsed by authorities, while nonscientific events account for the rest. The full
reference for each event can be found in Multimedia Appendix 1, Table S7. BARDA: Biomedical Advanced Research and Development Authority;
FDA: US Food and Drug Administration; HHS: United States Department of Health and Human Services; JAMA: The Journal of the American Medical
Association; NEJM: The New England Journal of Medicine; NIH: National Institutes of Health; VA: United States Department of Veterans Affairs;
WHO: World Health Organization.
that may play a role in altering health beliefs. These findings
Discussion lay the groundwork to better understand how the general public’s
Principal Findings COVID-19-related health beliefs are influenced by case and
mortality rates, government policies, current news, and
Through the utilization of natural language processing (NLP) significant events. Through careful study of these observations,
and machine learning, we employed the HBM to identify tweets we may better implement management strategies to combat the
associated with health beliefs. Through further evaluation of pandemic and the infodemic.
HBM-related tweets, our findings demonstrated that trends in
health beliefs were correlated with dynamics in positive case In commonly used models for infectious diseases, infection is
and mortality rates. Additionally, we observed a decline in considered to be spreading in a population when R0 is greater
perceived disease susceptibility during government-issued than 1, and the epidemic is harder to control with a larger value
lockdowns, while perceived severity appeared unaltered. Lastly, of R0. Therefore, given the R0 of 7.62, it is reasonable to
our study identified top news events, scientific and nonscientific, conclude that an infodemic is ongoing in our study population.
https://www.jmir.org/2021/2/e26302 J Med Internet Res 2021 | vol. 23 | iss. 2 | e26302 | p. 11
(page number not for citation purposes)
XSL• FO
RenderXJOURNAL OF MEDICAL INTERNET RESEARCH Wang et al
It is interesting that health beliefs involving perceived beliefs, which may contribute to and even exacerbate the
susceptibility increased in advance of the actual evolvement of infodemic on social media.
the pandemic. Because we observed the basic reproduction
We observed that speeches by politicians could have dramatic
number R0 of 7.62, suggestive of an infodemic, these findings
impacts on the health beliefs of the general public who read the
may suggest that the volume of information regarding news. However, politicians’ speeches do not necessarily
COVID-19 affects Twitter users’ perspectives regarding the recapitulate scientific facts or evidence and could sometimes
risk of infection. In the early stages of the pandemic, before be misleading [35]. Thus, we expect to rely more on scientific
mortalities were observed, it is possible that less severity was sources, such as publications with scientific evidence or
assumed. Over time, perceived severity may have increased as announcements made by health authorities, for more accurate
the number of deaths cumulated. Strong correlations between and reliable information regarding the pandemic. However, it
perceived susceptibility and perceived severity regarding the is uncertain whether scientific events or nonscientific events
case and death dynamics may suggest that the ongoing situation have a more profound influence on altering the health beliefs
of the pandemic is a significant impact factor affecting health of the general public.
beliefs.
The results from the Kruskal-Wallis test imply that scientific
From the line chart in Figure 5, we observed a dramatic increase events and nonscientific events did not significantly differ from
in daily cases between week 11 and week 14. There was also one another in regard to their effect on health beliefs within the
an upward trend in perceived susceptibility starting from week given period (ie, January 6 to June 21, 2020). We found it
11, which began decreasing by week 13. This phenomenon is surprising that scientific events did not appear to be significantly
interesting when we take the lockdown situation into associated with altering the health beliefs toward potential
consideration, as starting from week 13 was when most of the treatments in our data set. This might be due to the public’s
states were under the government-issued lockdown. Thus, distrust in science arising from the many uncertainties involving
official interventions were observed to potentially mitigate the the pandemic or the instances of being delivered conflicting
general public’s perceived susceptibility of COVID-19. information, such as “Don't wear masks” to “Wear masks all
Meanwhile, we saw the growth of the number of confirmed the time.” To better cope with COVID-19 circumstances,
cases slowing down during this same period. Interestingly, we everyone in society, online and offline, should be aware of the
failed to see a decline in perceived severity even when almost overabundance of information and its potential impact on health
all the states were under quarantine. Previously, we showed that beliefs. Thus, it is essential to be prudent to screen the
perceived severity was found to most strongly correlate with authenticity of each piece of information.
mortality; thus, it is reasonable that lockdown policies did not
ease such health concerns, perhaps owing to the fact that while Limitations and Future Work
lockdowns slow down the spread of infection, they do not offer We have identified some limitations in this study. The tweets
complete protection, especially in the absence of viable analyzed in this study covered the English language, and there
medications or treatment strategies. might be divergences across different languages that were not
As shown in Figure 6, for the first 3 to 4 weeks, topics addressed. Although English tweets constitute the largest
predominately covered confirmed cases worldwide when the proportion among all the tweets, the number of tweets in other
global pandemic was not yet affirmed by the authorities. In the languages or undefined languages are still considerable [36].
following weeks, the terms cruise ship [29] and li wenliang [30] We hope to expand the analysis to a multilingual setting in
came into the spotlight. In early February, a large and notable future work. Additionally, although we did not cover every
cluster of COVID-19 cases occurred on the Diamond Princess potential treatment at this stage, our framework is extensible to
cruise ship. Dr Wenliang Li, the Chinese doctor who tried to assess the influence on health beliefs of additional treatments
raise the alarm about a possible outbreak of a disease that or interventions, such as vaccines. In fact, we plan to apply
resembled SARS-CoV-2 in Wuhan, China, died of the infection similar approaches to investigate health beliefs in COVID-19
on February 7 , 2020. During weeks 8 and 9, when the vaccines once they are available to the general public.
COVID-19 outbreak heightened in Italy [31] and Iran [32], Furthermore, we likely have not considered other factors that
topics related to these countries began trending. On March 18, may contribute to alterations in health beliefs.
2020 (ie, week 12), then President Trump announced that he This analysis used data extracted from one social media
was taking HCQ as prophylaxis for COVID-19 [33] and platform, Twitter, which may also introduce bias. Users’ health
triggered massive discussions. In fact, starting at week 13, beliefs may not represent those of the entire population, since
discussions involving HCQ and CQ began to dominate. Lastly, not everyone uses Twitter. More social media platforms will
we were initially surprised to observe other topics like george be incorporated in future work, such as Facebook, Instagram,
floyd [34] in the health belief–related tweets. However, this and Reddit. Additionally, it would be interesting to compare
topic is related to many events where people gathered that our crowdsourcing results with health beliefs obtained through
happened while many states were still under lockdown, possibly hospital-administrated surveys from patients with COVID-19
provoking health concerns. Through this analysis, we suspect and their caretakers.
that the news from all sources may penetrate into discussions
regarding health beliefs and, thus, may influence health beliefs. Technically, this study employed the very classic text
Therefore, the news that we consume every day may classification methods, which used a combination of the
inadvertently be a substantial factor that affects our health bag-of-words model and machine learning classifiers. Yet, the
https://www.jmir.org/2021/2/e26302 J Med Internet Res 2021 | vol. 23 | iss. 2 | e26302 | p. 12
(page number not for citation purposes)
XSL• FO
RenderXJOURNAL OF MEDICAL INTERNET RESEARCH Wang et al
experiments showed that they worked well (ie, AUROC curve of various NLP techniques on the current text classification
over 0.9) on the given data. Deep learning architectures were tasks.
not discussed in this study, mainly because there is no guarantee
that deep learning models always work better than simple
Conclusions
machine learning classifiers. Meanwhile, deep learning models Our data suggest that we are not only fighting a pandemic but
bear higher technical barriers, which compromise the also an infodemic. The excessive information disseminated on
accessibility for people from other domains. Deep learning social media platforms and other sources is closely related to
models are also known to demand considerable energy [37], so the dynamics of the general public’s health beliefs. The
we were also trying to trade off the energy-performance balance. dynamics of the pandemic, news, scientific and nonscientific
However, it is definitely worth a whole other study to discuss events, and even the related tweets already published on social
various NLP techniques for the classification task. For future media platforms may influence the health beliefs of the general
studies, we are also interested in investigating the performance public on social media to some extent. Our findings provide
clues and evidence for more effective management of the
infodemic associated with the COVID-19 pandemic.
Acknowledgments
HW, YLi, and YLuo conceived of the presented idea. HW, YLi, and MH contributed to the data annotation and validation. HW
carried out all the experiments and conducted all the data analyses. HW wrote the manuscript and designed the tables and figures
with support from MH and YLi. AN provided clinical insights and contributed to the results interpretation. YLuo advised and
supervised the entire project. We thank Twitter for providing the API for developers to retrieve tweets for this research.
Conflicts of Interest
None declared.
Multimedia Appendix 1
Supplementary information.
[DOCX File , 70 KB-Multimedia Appendix 1]
References
1. Chen N, Zhou M, Dong X, Qu J, Gong F, Han Y, et al. Epidemiological and clinical characteristics of 99 cases of 2019
novel coronavirus pneumonia in Wuhan, China: A descriptive study. Lancet 2020 Feb 15;395(10223):507-513 [FREE Full
text] [doi: 10.1016/S0140-6736(20)30211-7] [Medline: 32007143]
2. Huang C, Wang Y, Li X, Ren L, Zhao J, Hu Y, et al. Clinical features of patients infected with 2019 novel coronavirus in
Wuhan, China. Lancet 2020 Feb 15;395(10223):497-506 [FREE Full text] [doi: 10.1016/S0140-6736(20)30183-5] [Medline:
31986264]
3. Zhu N, Zhang D, Wang W, Li X, Yang B, Song J, China Novel Coronavirus Investigating and Research Team. A novel
coronavirus from patients with pneumonia in China, 2019. N Engl J Med 2020 Feb 20;382(8):727-733 [FREE Full text]
[doi: 10.1056/NEJMoa2001017] [Medline: 31978945]
4. Coronavirus disease (COVID-19) weekly epidemiological update and weekly operational update. World Health Organization.
2020. URL: https://www.who.int/emergencies/diseases/novel-coronavirus-2019/situation-reports/ [accessed 2020-10-17]
5. Zarocostas J. How to fight an infodemic. Lancet 2020 Feb 29;395(10225):676 [FREE Full text] [doi:
10.1016/S0140-6736(20)30461-X] [Medline: 32113495]
6. Eysenbach G. Infodemiology: The epidemiology of (mis)information. Am J Med 2002 Dec 15;113(9):763-765. [doi:
10.1016/s0002-9343(02)01473-0] [Medline: 12517369]
7. 1st WHO Infodemiology Conference. World Health Organization. 2020. URL: https://www.who.int/news-room/events/
detail/2020/06/30/default-calendar/1st-who-infodemiology-conference [accessed 2020-10-17]
8. Cinelli M, Quattrociocchi W, Galeazzi A, Valensise CM, Brugnoli E, Schmidt AL, et al. The COVID-19 social media
infodemic. Sci Rep 2020 Oct 06;10(1):16598 [FREE Full text] [doi: 10.1038/s41598-020-73510-5] [Medline: 33024152]
9. Eysenbach G. How to fight an infodemic: The four pillars of infodemic management. J Med Internet Res 2020 Jun
29;22(6):e21820 [FREE Full text] [doi: 10.2196/21820] [Medline: 32589589]
10. Hua J, Shaw R. Corona virus (COVID-19) "infodemic" and emerging issues through a data lens: The case of China. Int J
Environ Res Public Health 2020 Mar 30;17(7):2309 [FREE Full text] [doi: 10.3390/ijerph17072309] [Medline: 32235433]
11. Janz NK, Becker MH. The health belief model: A decade later. Health Educ Q 1984;11(1):1-47. [doi:
10.1177/109019818401100101] [Medline: 6392204]
12. Rosenstock IM. Historical origins of the health belief model. Health Educ Monogr 1974 Dec 01;2(4):328-335. [doi:
10.1177/109019817400200403]
https://www.jmir.org/2021/2/e26302 J Med Internet Res 2021 | vol. 23 | iss. 2 | e26302 | p. 13
(page number not for citation purposes)
XSL• FO
RenderXJOURNAL OF MEDICAL INTERNET RESEARCH Wang et al
13. Strecher V, Rosenstock I. The health belief model. In: Baum A, Newman S, Weinman J, West R, McManus C, editors.
Cambridge Handbook of Psychology, Health and Medicine. Cambridge, UK: Cambridge University Press; 1997:113-116.
14. Rosenstock IM, Strecher VJ, Becker MH. The health belief model and HIV risk behavior change. In: DiClemente RJ,
Peterson JL, editors. Preventing AIDS: Theories and Methods of Behavioral Interventions. Boston, MA: Springer; 1994:5-24.
15. Du J, Cunningham RM, Xiang Y, Li F, Jia Y, Boom JA, et al. Leveraging deep learning to understand health beliefs about
the human papillomavirus vaccine from social media. NPJ Digit Med 2019;2:27 [FREE Full text] [doi:
10.1038/s41746-019-0102-4] [Medline: 31304374]
16. Wardle J, Haase AM, Steptoe A, Nillapun M, Jonwutiwes K, Bellisle F. Gender differences in food choice: The contribution
of health beliefs and dieting. Ann Behav Med 2004 Apr;27(2):107-116. [doi: 10.1207/s15324796abm2702_5] [Medline:
15053018]
17. Czeisler MÉ, Tynan MA, Howard ME, Honeycutt S, Fulmer EB, Kidder DP, et al. Public attitudes, behaviors, and beliefs
related to COVID-19, stay-at-home orders, nonessential business closures, and public health guidance - United States, New
York City, and Los Angeles, May 5-12, 2020. MMWR Morb Mortal Wkly Rep 2020 Jun 19;69(24):751-758 [FREE Full
text] [doi: 10.15585/mmwr.mm6924e1] [Medline: 32555138]
18. Guidry JP, Carlyle KE, LaRose JG, Perrin P, Messner M, Ryan M. Using the health belief model to analyze Instagram
posts about Zika for public health communications. Emerg Infect Dis 2019 Jan;25(1):179-180 [FREE Full text] [doi:
10.3201/eid2501.180824] [Medline: 30561302]
19. Sesagiri Raamkumar A, Tan SG, Wee HL. Use of health belief model-based deep learning classifiers for COVID-19 social
media content to examine public perceptions of physical distancing: Model development and case study. JMIR Public
Health Surveill 2020 Jul 14;6(3):e20493 [FREE Full text] [doi: 10.2196/20493] [Medline: 32540840]
20. Carico RRJ, Sheppard J, Thomas CB. Community pharmacists and communication in the time of COVID-19: Applying
the health belief model. Res Social Adm Pharm 2021 Jan;17(1):1984-1987 [FREE Full text] [doi:
10.1016/j.sapharm.2020.03.017] [Medline: 32247680]
21. Banda J, Tekumalla R, Wang G, Yu J, Liu T, Ding Y, et al. A large-scale COVID-19 Twitter chatter dataset for open
scientific research--An international collaboration. arXiv. Preprint posted online on April 7, 2020. [FREE Full text]
22. Tekumalla R, Banda JM. Social Media Mining Toolkit (SMMT). Genomics Inform 2020 Jun;18(2):e16. [doi:
10.5808/gi.2020.18.2.e16]
23. McHugh ML. Interrater reliability: The kappa statistic. Biochem Med 2012;22(3):276-282. [doi: 10.11613/bm.2012.031]
24. Wang H. Understanding COVID-19 health beliefs using tweets. GitHub. 2020. URL: https://github.com/HanyinWang/
CovidHealthBeliefTweets [accessed 2021-02-09]
25. Bird S, Klein E, Loper E. Natural Language Processing with Python: Analyzing Text with the Natural Language Toolkit.
Sebastopol, CA: O'Reilly Media; 2009.
26. Pedregosa F, Varoquaux G, Gramfort A, Michel V, Thirion B, Grisel O, et al. Scikit-learn: Machine learning in Python. J
Mach Learn Res 2011;12:2825-2830 [FREE Full text]
27. Bailey NT. The Mathematical Theory of Infectious Diseases and its Applications. London, UK: Charles Griffin & Company;
1975.
28. Truong C, Oudre L, Vayatis N. Selective review of offline change point detection methods. Signal Processing 2020
Feb;167:107299. [doi: 10.1016/j.sigpro.2019.107299]
29. Moriarty L, Plucinski MM, Marston BJ, Kurbatova EV, Knust B, Murray EL, CDC Cruise Ship Response Team, California
Department of Public Health COVID-19 Team, Solano County COVID-19 Team. Public health responses to COVID-19
outbreaks on cruise ships - Worldwide, February-March 2020. MMWR Morb Mortal Wkly Rep 2020 Mar 27;69(12):347-352
[FREE Full text] [doi: 10.15585/mmwr.mm6912e3] [Medline: 32214086]
30. Green A. Li Wenliang. Lancet 2020 Feb 18;395(10225):682 [FREE Full text] [doi: 10.1016/s0140-6736(20)30382-2]
31. Remuzzi A, Remuzzi G. COVID-19 and Italy: What next? Lancet 2020 Apr 11;395(10231):1225-1228 [FREE Full text]
[doi: 10.1016/S0140-6736(20)30627-9] [Medline: 32178769]
32. Abdi M. Coronavirus disease 2019 (COVID-19) outbreak in Iran: Actions and problems. Infect Control Hosp Epidemiol
2020 Jun;41(6):754-755 [FREE Full text] [doi: 10.1017/ice.2020.86] [Medline: 32192541]
33. Lovelace Jr B, Breuninger K. Trump says he takes hydroxychloroquine to prevent coronavirus infection even though it's
an unproven treatment. CNBC. 2020 May 18. URL: https://www.cnbc.com/2020/05/18/
trump-says-he-takes-hydroxychloroquine-to-prevent-coronavirus-infection.html [accessed 2020-08-27]
34. George Floyd protests. Wikipedia. 2020. URL: https://en.wikipedia.org/wiki/George_Floyd_protests [accessed 2020-08-27]
35. Lewandowsky S, Jetter M, Ecker U. Using the president's tweets to understand political diversion in the age of social media.
Nat Commun 2020 Nov 10;11(1):5764 [FREE Full text] [doi: 10.1038/s41467-020-19644-6] [Medline: 33173060]
36. Pobiruchin M, Zowalla R, Wiesner M. Temporal and location variations, and link categories for the dissemination of
COVID-19-related information on Twitter during the SARS-CoV-2 outbreak in Europe: Infoveillance study. J Med Internet
Res 2020 Aug 28;22(8):e19629 [FREE Full text] [doi: 10.2196/19629] [Medline: 32790641]
37. Strubell E, Ganesh A, McCallum A. Energy and policy considerations for deep learning in NLP. In: Proceedings of the
57th Annual Meeting of the Association for Computational Linguistics. 2019 Presented at: 57th Annual Meeting of the
https://www.jmir.org/2021/2/e26302 J Med Internet Res 2021 | vol. 23 | iss. 2 | e26302 | p. 14
(page number not for citation purposes)
XSL• FO
RenderXJOURNAL OF MEDICAL INTERNET RESEARCH Wang et al
Association for Computational Linguistics; July 28-August 2, 2019; Florence, Italy p. 3645-3650 URL: https://www.
aclweb.org/anthology/P19-1355.pdf [doi: 10.18653/v1/p19-1355]
Abbreviations
API: application programming interface
AUROC: area under the receiver operating characteristic
CQ: chloroquine
HBM: health belief model
HCQ: hydroxychloroquine
HPV: human papillomavirus
NLP: natural language processing
SIR: susceptible-infectious-recovered
tf-idf: term frequency–inverse document frequency
WHO: World Health Organization
Edited by R Kukafka, C Basch; submitted 06.12.20; peer-reviewed by J Banda Orozco, R Zowalla; comments to author 22.12.20;
revised version received 08.01.21; accepted 31.01.21; published 22.02.21
Please cite as:
Wang H, Li Y, Hutch M, Naidech A, Luo Y
Using Tweets to Understand How COVID-19–Related Health Beliefs Are Affected in the Age of Social Media: Twitter Data Analysis
Study
J Med Internet Res 2021;23(2):e26302
URL: https://www.jmir.org/2021/2/e26302
doi: 10.2196/26302
PMID: 33529155
©Hanyin Wang, Yikuan Li, Meghan Hutch, Andrew Naidech, Yuan Luo. Originally published in the Journal of Medical Internet
Research (http://www.jmir.org), 22.02.2021. This is an open-access article distributed under the terms of the Creative Commons
Attribution License (https://creativecommons.org/licenses/by/4.0/), which permits unrestricted use, distribution, and reproduction
in any medium, provided the original work, first published in the Journal of Medical Internet Research, is properly cited. The
complete bibliographic information, a link to the original publication on http://www.jmir.org/, as well as this copyright and license
information must be included.
https://www.jmir.org/2021/2/e26302 J Med Internet Res 2021 | vol. 23 | iss. 2 | e26302 | p. 15
(page number not for citation purposes)
XSL• FO
RenderXYou can also read