Urban Heat Island Monitoring and Impacts on Citizen's General Health Status in Isfahan Metropolis: A Remote Sensing and Field Survey Approach - MDPI
←
→
Page content transcription
If your browser does not render page correctly, please read the page content below
remote sensing
Article
Urban Heat Island Monitoring and Impacts on
Citizen’s General Health Status in Isfahan Metropolis:
A Remote Sensing and Field Survey Approach
Mohsen Mirzaei 1 , Jochem Verrelst 2 , Mohsen Arbabi 3,4, *, Zohreh Shaklabadi 3
and Masoud Lotfizadeh 4
 1    Environmental Pollutions, Grape Environmental Science Department, Research Institute for Grapes and
      Raisin (RIGR), Malayer University, Malayer 65719-95863, Iran; mohsen.mirzaei@stu.malayeru.ac.ir
 2    Image Processing Laboratory (IPL), Parc Científic, Universitat de València, Paterna, 46980 València, Spain;
      jochem.verrelst@uv.es
 3    Department of Environmental Health Engineering, School of Health, Shahrekord University of Medical
      Sciences, Shahrekord 88157-13471, Iran; zohre.sheklabadi@gmail.com
 4    Social Determinants of Health Research Center, Shahrekord University of Medical Sciences,
      Shahrekord 88157-13471, Iran; m.lotfizadeh@skums.ac.ir
 *    Correspondence: m.arbabi@skums.ac.ir; Tel.: +98-912-371-9343

 Received: 10 March 2020; Accepted: 23 April 2020; Published: 24 April 2020

 Abstract: Urban heat islands (UHIs) are one of the urban management challenges, especially in
 metropolises, which can affect citizens’ health and well-being. This study used a combination of
 remote sensing techniques with field survey to investigate systematically the effects of UHI on citizens’
 health in Isfahan metropolis, Iran. For this purpose, the land surface temperature (LST) over a
 three-year period was monitored by Landsat-8 satellite imagery based on the split window algorithm.
 Then, the areas where UHI and urban cold island (UCI) phenomena occurred were identified and a
 general health questionnaire-28 (GHQ-28) was applied to evaluate the health status of 800 citizens
 in terms of physical health, anxiety and sleep, social function, and depression in UHI and UCI
 treatments. The average LST during the study period was 45.5 ± 2.3 ◦ C and results showed that the
 Zayandeh-Rood river and the surrounding greenery had an important role in regulating the ambient
 temperature and promoting the citizens’ health. Citizens living in the suburban areas were more
 exposed to the UHIs phenomena, and statistical analysis of the GHQ-28 results indicated that they
 showed severe significant (P < 0.05) responses in terms of non-physical health sub-scales (i.e., anxiety
 and sleep, social functioning, and depression). Therefore, it can be concluded that not all citizens in
 the Isfahan metropolis are in the same environmental conditions and city managers and planners
 should pay more attention to the citizens living in the UHIs. The most important proceedings in this
 area would be the creation and development of parks and green belts, as well as the allocation of
 health-medical facilities and citizen education.

 Keywords: urban heat island; land surface temperature; split window algorithm; general health
 questionnaire-28; Isfahan metropolis

1. Introduction
     Over the last decades, global warming has threated human and environment health [1–4]. At the
same time, urbanization and urban activities can exacerbate the effects of global warming, as more
populations are exposed to heating effects [5,6]. Human activities in changing natural land covers
can lead to changes in thermal capacities, albedo coefficient, heat conductivity, and moisture [7–9].
Urban land use can cause the local air and surface temperatures to increase several degrees higher

Remote Sens. 2020, 12, 1350; doi:10.3390/rs12081350                           www.mdpi.com/journal/remotesensing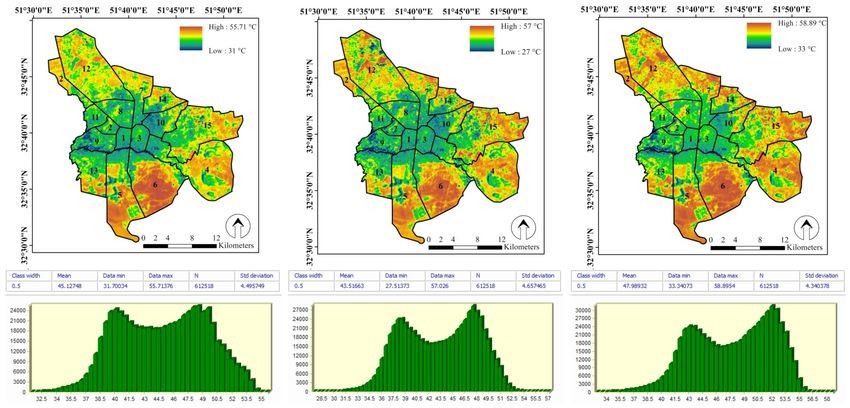
Remote Sens. 2020, 12, 1350                                                                          2 of 17

than the temperatures of the surrounding environment [10–12]. This phenomenon is often referred to
as an urban heat island (UHI), which has been documented since Howard [13].
       With the rise of urbanization and the formation of metropolises, the UHI shows more impact
on humans and living environments and supports a wide range of environmental changes in cities,
i.e., ecosystem services and functions and local weather and micro-climates [14–16]. In fact, in many
previous studies the occurrence of the UHI phenomenon was considered as one of the most important
problems of overheating in urban areas (e. g., Li et al. [17] in Shanghai, Enete et al. [18] in Douala,
Umar et al. [19] in Kano, and de Faria Peres et al. [20] in Rio de Janeiro).
       The UHI can be identified by earth surface temperatures [14]. Nowadays, many satellite sensors
can be used to monitor and evaluate earth characteristics. Among these, some satellite data are more
commonly used in UHI monitoring, such as MODIS [21,22], ASTER [15], and Landsat TM, ETM+ and
OLI/TIRS [15,23,24]. Landsat-8 with OLI and TIRS sensors at sufficiently high and medium spatial
resolutions (equal to 30 and 100 m, respectively) proved to be particularly suitable for observing land
surface temperature (LST) at city scale [15,25]. According to Mohamed et al. [25], the usage of two
separate, relatively narrow thermal bands has been shown to minimize error in the retrieval of LST.
Therefore, Landsat-8 that is equipped with two thermal infrared channels in the atmospheric window
provides a new LST retrieval opportunity based on the widely used split-window algorithm (SWA)
rather than the single-channel method [25–27].
       Increased temperature adds extra pressure to human physiology and makes the body more
vulnerable to stresses. Residents living in a UHI region, or in its vicinity, are at increased health
risk [28]. Therefore, the UHI is one of the major urban planning problems, which requires monitoring
as well dedicated strategies to reduce its impact [29]. As an example, Gosling et al. [30] reported that an
increasing urban temperature has a direct impact on the increase in mortality rate. Other studies have
shown that citizens in UHI areas suffer with heat-related illnesses, e.g., digestive diseases, nervous
system issues, insomnia, depression, and mental illnesses [31,32]. UHIs have also directly led to a rise in
infectious diseases [33]. Along with this, in a systematic review by Thompson et al. [34] increased risks
of mental health-related admissions and emergency department visits in higher temperatures areas
were found. The findings of Jenerette et al. [35] also demonstrated that the symptoms of heat-related
illness were correlated with parcel-scale surface temperature patterns during the daytime in an urban
ecosystem. More psychological and social health issues associated to UHI, such as depression and the
restriction of social activities, were further reported by Wong et al. [36].
       Therefore, when aiming to evaluate the effect of UHIs on the health of citizens a simple tool
is required that can easily assess the health status of citizens. Using a questionnaire to assess the
health state is a rapid, low-cost, common, and practical approach which can be applied on a large
scale (such as in a metropolis) [37–39]. In this regard, the general health questionnaire-28 (GHQ-28)
is one of the most commonly used tools for assessing physical and mental health worldwide and
has multiple, self-administered constructs. The method was developed by Goldberg [40] and has
a 28-item measure of emotional distress in medical settings [41]. The GHQ-28 has been tested in
numerous populations including people with stroke [42], spinal cord injury [43], heart disease [44],
various musculoskeletal conditions including whiplash associated disorders [45], and occupational
lower back pain [46], amongst others. Thus, for clinicians, there is a wealth of data with which to relate
patient outcomes [41].
       Isfahan is the third largest metropolis in Iran. The city has grown substantially in population and
industrialization over the recent decades. The occurrence and spatial pattern of the UHI in Isfahan in
2013–2015 was earlier investigated by Ahmadi and Roudbari [47]. Their results showed that there is
a sharp temperature difference among the various regions of the city. This extreme heat variance in
different regions of the city can lead to disturbances in the citizen’s health parameters. In other words,
our main question was whether citizens of the heat island show an increased health risk. Assessing the
relation between the UHI and human general health status is an important step in order to provide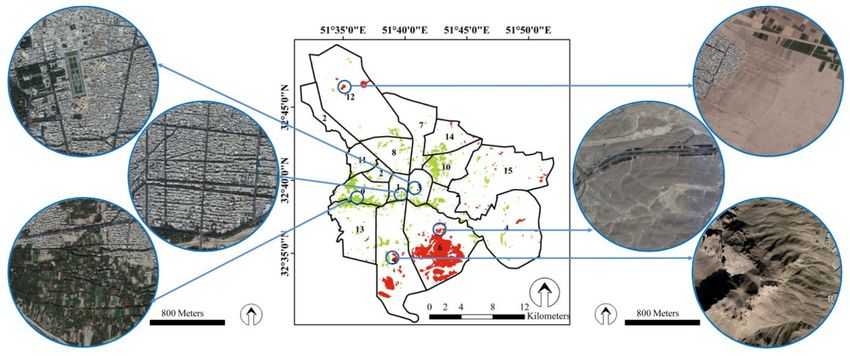
Remote Sens. 2020, 12, 1350 3 of 17
information for future planning projects, plans, programs, and policies contributing to public health
protection in Isfahan metropolis.
To this end, the first step to take in examining its effects on citizen’s health is determining regions
where heat and cold islands occur. Secondly, based on the identified heat map, it should lead to a
benchmark that can quantify the different general health sub-scales (physical health, anxiety and sleep,
social function, and depression) of the citizens in the heat and cold island regions. Therefore, in order
to identify the location of the UHI and urban cold island (UCI) in Isfahan the Landsat-8 satellite data
with a SWA were used because of their good adaptation and high performance in LST estimation and
UHI monitoring [25,26]. After estimating the LST in Isfahan and the spatial-temporal analysis of cold
and hot islands in the city, the health status of the citizens related to life in UHIs and UCIs was assessed
using a GHQ-28.
2. Materials and Methods
2.1. Study area
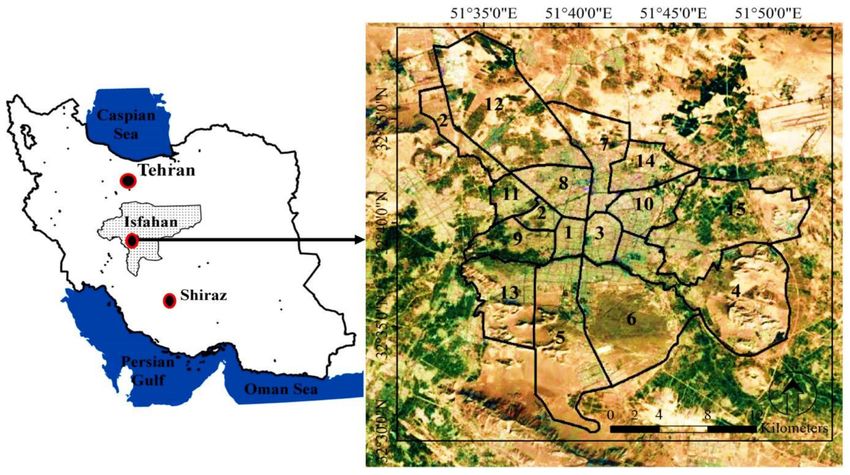
The study area of Isfahan (between 32◦ 30’00”N to 32◦ 50’00”N and 51◦ 32’30”E to 51◦ 52’00”E)
(Figure 1), with a population of 1,961,260 (in 2016) and area of 551 km2 , is the third largest metropolis
of Iran. Isfahan is one of the most important historical, cultural, political, and religious centers of
Iran. This city has always been a destination for tourism due to its ancient attractions and architecture.
Isfahan has 15 urban-management regions, the locations of which are shown in Figure 1. The study
area has a hot and arid climate, with hot summers and cold winters (maximum temperature: 40.6 ◦ C,
minimum temperature: −10.6 ◦ C and average annual temperature: 16.7 ◦ C) [48,49]. The annual
precipitation is low (average 116.9 mm) and rainfall occurs mostly in wintertime. The Zayandeh-Rood
river passes through the middle of the city and the river shores are covered by green space, but for
the last several years the river flow has been cut off in summertime. Furthermore, a large number of
immigrants migrated from rural areas to Isfahan and it led to the replacement of natural lands with
urban landscapes. The green space per capita in Isfahan is 26 m2 , but the green space in all areas of the
city is not evenly distributed and is densely colonized along the Zayandeh-Rood river and the city
center [48].
Figure 1. Location of Isfahan metropolis (study area) in Iran and illustration of its 15 management zones.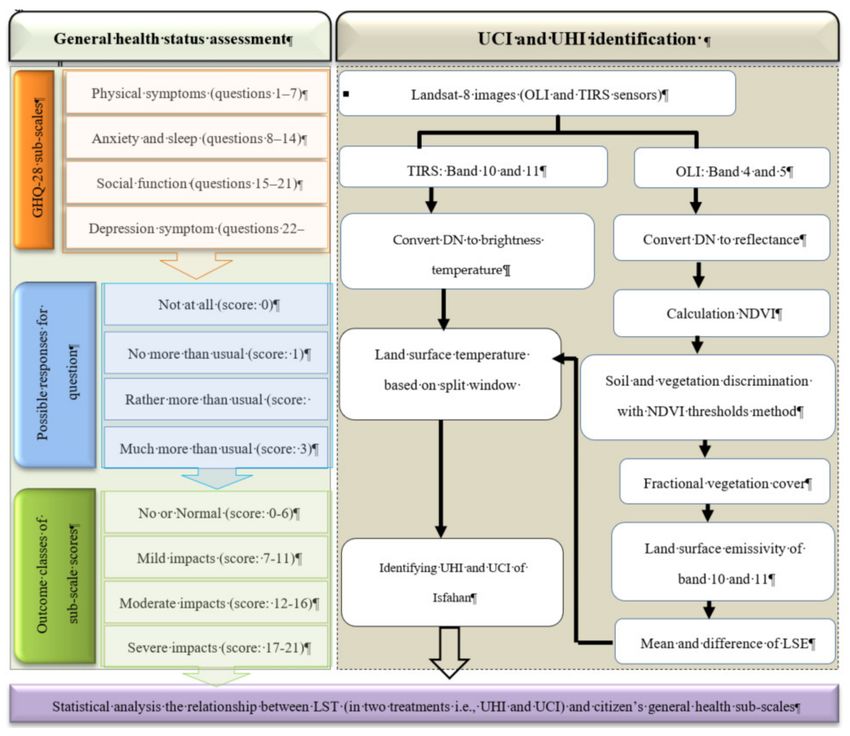
Remote Sens. 2020, 12, 1350                                                                          4 of 17

2.2. UHI Monitoring

2.2.1. Satellite Images and Pre-Possessing
     Images from the Landsat-8 Collection 1 Level-1 were collected from the Earth Explorer website
(https://earthexplorer.usgs.gov/). This satellite has two sensors: the operational land imager (OLI)
and the thermal infrared sensor (TIRS) with nine spectral bands (spatial resolution of 30 m) and two
thermal bands (spatial resolution of 100 m; band 10: 10.60 µm to 11.19 µm, and band 11: 11.50 µm
to 12.51 µm) [27]. A total of nine Landsat images taken during summers from 2016 to 2018 were
downloaded, which covered Isfahan metropolis in the path and row of 164 and 37, respectively.
For each summer, three Landsat images were collected from June, July, and August. For all studied
images, the geometric correction was made by in-field control points. Pre-processing corrections, i.e.,
convert raw digital numbers (DN) to at-satellite brightness temperature for thermal bands and convert
raw DN to reflectance with apparent reflectance correction model for multispectral bands, were also
applied for all studied images. Then, the image subset tool was used to clip the study boundary from
the Landsat image frame. After these pre-processing steps, the images of Isfahan metropolis were
prepared for the data processing and subsequent LST analysis. In addition, Isfahan regional maps and
Isfahan street maps were used.

2.2.2. Image Processing
     In order to detect the UHI in Isfahan, it was necessary to map the LST of the metropolis. Various
approaches have attempted to establish methods for retrieving the LST from optical remote sensing
data. The TM and ETM+ sensors of Landsat are equipped with only one thermal band, while the TIRS
sensor provides two thermal bands. Therefore Landsat-8 is more suited for the split window algorithm
(SWA) [27,50,51]. Figure 2 shows the flowchart of the study and overview for performing the SWA.
We performed SWA in seven main steps [51,52]: (i) estimation of the top-of-atmospheric (TOA) spectral
radiance, (ii) estimation of the brightness temperature (BT), (iii) estimation of the normalized difference
vegetation index (NDVI), (iv) estimation of the fractional vegetation cover (FVC), (v) combination of
LSE of band 10 and 11, (vi) estimation of land surface temperature (LST), and (vii) classifying hot and
cold islands.
     As the absolute temperature was not of importance for this study, we instead derived the relative
temperature of pixels. Thus, we were only looking for the relative temperature in the studied areas
in order to enable identification of the heat and cold islands. In cases where the measurement of
the absolute LST is considered, however, the use of Stray Light Correction algorithm for band 11 of
Landsat is recommended to increase the accuracy of results [53,54].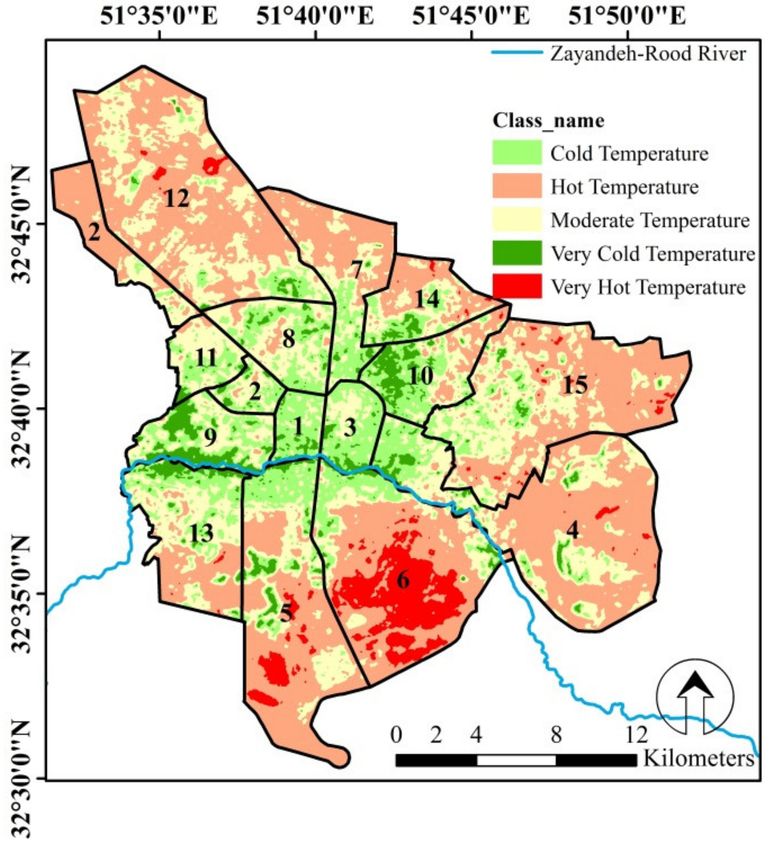
Remote Sens. 2020, 12, 1350                                                                         5 of 17

      Figure 2. The main flowchart of the study (general health questionnaire-28 (GHQ-28) methodology
      and retrieving land surface temperature (LST)).

2.2.3. Split Window Algorithm
     The SWA was applied in order to detect the LST. This algorithm uses BT of two TIRS bands (band
10 and 11 of Landsat imagery), mean, and difference in land surface emissivity (LSE) for estimating the
LST of an area. The basic formula for applying this algorithm to Landsat images and measuring LST is
as follows [52]:

                    LST = BTB10 + C1 (BTB10 − BTB11) + C2 (BTB10 − BTB11)2 + C0 +
                                                                                                        (1)
                           (C3 + C4 × W) (1 − mLSE) + (C5 + C6 × W) × ∆LSE

where, BTB10 and BTB10 are brightness temperature of band 10 and 11, respectively. C0 to C6 are
SWA constant coefficients (Table 1), mLSE and ∆LSE are mean and difference of LSE, respectively.
W is atmospheric water vapor content (0.05 ≤water vapor content ≤ 0.21 g/cm2 , calculated based on
meteorological data from Isfahan metropolitan area at the time of the satellites overpass).
     BT is the microwave radiation radiance traveling upward from the top of Earth’s atmosphere.
The transformation process for converting thermal DN values of band 10 and 11 to BT was applied.
The TOA spectral radiance is needed for finding BT of an area. BT for both the TIRs bands was
calculated as follows:
                                                   K2
                                        BT =                                                    (2)
                                               Ln K2
                                                     (( Lλ )+1)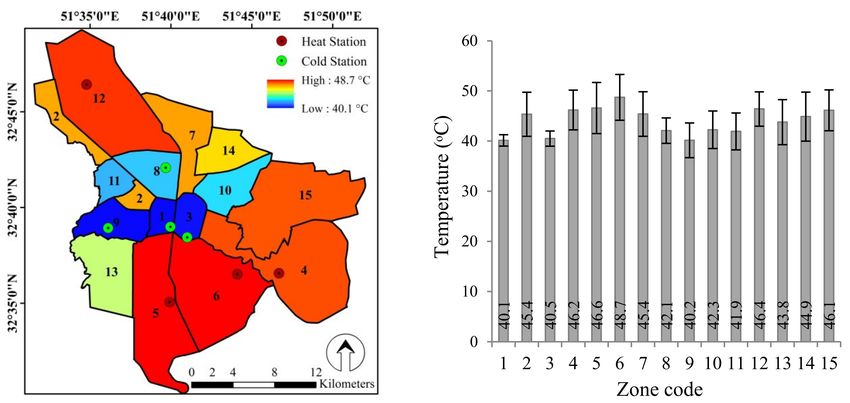
Remote Sens. 2020, 12, 1350                                                                          6 of 17

where, K1 and K2 are thermal conversion values of band 10 and 11 (Table 1). Lλ is TOA spectral
radiance and calculated by Equation (3):

                                              Lλ = RM × DNband 10/11 + RA                               (3)

where, RM and RA are band specific multiplicative rescaling factor and band specific additive rescaling
factor, respectively (Table 1). DN is raw digital number of band 10 and 11.

                   Table 1. Details of the data used to run the SWA on Landsat-8 images [51,52].

                              Input Name           Band 10           Band 11          Values
                                                          Emissivity
                                  εsoil             0.971            0.977
                               εvegetation          0.987            0.989
                                                    Thermal constant value
                                  K1              774.8853           480.8883
                                  K2              1321.0789         1201.1442
                                                        Rescaling Factor
                                  RM              0.0003342        0.0003342
                                  RA              0.1000000        0.1000000
                                                   SWA constant coefficients
                                   C0                 -                 -              −0.268
                                   C1                 -                 -              1.378
                                   C2                 -                                 0.183
                                   C3                 -                 -              54.300
                                   C4                 -                 -              −2.238
                                   C5                 -                 -             −129.200
                                   C6                 -                 -              16.400

    Before obtaining the LST, we first calculated the LSE for the study area in each of the Landsat
images. Accordingly, the mean (mLSE) and difference (∆LSE) of LSE band 10 and 11 was calculated.
LSE was estimated using NDVI threshold method as follow:

                                        LSE = εsoil × (1 − FVC) + εvegatation × FVC                     (4)

where, εsoil and εvegetation are emissivity values of soil and vegetation in the corresponding bands,
respectively (Table 1). FVC is fractional vegetation cover, which was calculated based on the following
equation:
                                                NDVI − NDVIsoil
                                     FVC =                                                           (5)
                                             NDVIvegetation − NDVIsoil
where, NDVIsoil and NDVIvegetation are reclassified NDVI for soil and vegetation, respectively. NDVI
calculated from the red and near-infrared reflectance of Landsat OLI bands [55]. The NDVI values
are ranged between −1 and +1, when we divided the NDVI images as −1 ≤ NDVIsoil < 0.2 and 0.2 ≤
NDVIvegetation ≤ 1 [50]; soil and vegetation were well separated. Finally, the LST maps (in K◦ ) of all the
Landsat images of the Isfahan metropolis were generated based of the SWA. It should be noted that all
the above steps were done in the TerrSet software package version 18 (formerly IDRISI).

2.2.4. Classification of Heat and Cold Islands
     After calculating the temperature, each pixel was assigned to one of the classes according to
Table 2. The table was used to identify UHIs and UCIs based on mean standard deviation method.
In this regard, the LST classified the map into six thermal levels from the lowest (i.e., cold island) to
highest (i.e., heat island) LST. Afterwards, two Boolean maps were prepared from hot (UHI) and cold
Remote Sens. 2020, 12, 1350 7 of 17
(UCI) pixels, and four points randomly selected from each of them by X-tool extension in ArcGIS
version 9.3 software. Subsequently, these points were used to identify the nearest health centers and
questionnaires were completed at the respective health centers. Since the management zones are the
determining units in the planning and management of the Isfahan metropolis, the variation of LST at
the zone level was also analyzed. This was done with the zone statistics tool in ArcGIS. It should be
noted that the Isfahan metropolis has 15 administrative-management zones, the distribution of which
was shown in Figure 1 (www.isfahan.ir).
Table 2. LST classification of the studied images [56].
Class Name Class Range
Very cold temperature T ≤ Tmean − 1.5std
Cold temperature Tmean − 1.5std < T ≤ Tmean + std
Moderate temperature Tmean − std < T ≤ Tmean + std
Hot temperature Tmean + std < T ≤ Tmean + 1.5std
Very hot temperature T > Tmean + 1.5std
2.3. Health Assessment of the Study Subjects
After identifying the hot and cold islands and ranking Isfahan’s management zones in terms of
LST, four healthcare centers located in UCIs and four centers located in UHIs were selected. Then, at
each healthcare center 100 people were randomly selected to complete the GHQ-28 in August 2019.
In Isfahan, there are healthcare centers that provide various services, e.g., vaccination, mother and
child-care, annual censuses, family planning services, occupational medicine and occupational health
services, and environmental health services. Each of these centers cover a population of about 5000
and most people go to them for healthcare monitoring (http://dh.zaums.ac.ir/21258.page). Healthcare
centers record all medical and personal information of covered population in the form of lists. We used
these lists to randomly select participants. Therefore, GHQ-28 assessed the health status of 400 subjects
in the UHIs and 400 subjects in the UCIs.
It is worth noting that here the health status of the subjects affected by UHIs and UCIs was
for the first time assessed using the GHQ. The GHQ is one of the most commonly used tools for
assessing physical and mental health worldwide and has multiple, self-administered constructs.
The questionnaire was developed by Goldberg [40]. This questionnaire is one of the most well-known
screening tools for mental disorders as well [57]. Several methods are possible to score the GHQ-28.
The questionnaire was scored by the Likert method [58,59]. The GHQ-28 has four sub-scales, each of
which has seven questions. The sub-scales of this questionnaire are: physical (somatic) symptoms
(questions 1–7); anxiety and sleep (questions 8–14); social function (questions 15–21), and depression
symptoms (questions 22–28) [40,41]. Each question is accompanied by four possible responses, which
can be scored from 0 to 3, i.e., Not at all (score: 0), No more than usual (score: 1), Rather more than usual
(score: 2), and Much more than usual (score: 3). Therefore, the total score of each questionnaire can be
between 0 and 84 (28 × 3 = 84). In this method, the total scores are given in four outcome classes, i.e.,
(1) No or Normal (total score: 0–22), (2) Mild impacts (total score: 23–40), (3) Moderate impacts (total
score: 41–60), and Severe impacts (total score: 61–84). It should be noted that a total score more than 22
is considered as the threshold for the presence of distress [41]. This classification was also defined for
sub-scale scores. The total score of each sub-scale can be allocated in four outcome classes, i.e., (1) No
or Normal (score: 0–6), (2) Mild impacts (score: 7–11), (3) Moderate impacts (score: 12–16) and Severe
impacts (score: 17–21).
To evaluate the validity and reliability of this questionnaire, multiple studies have been conducted
abroad and internally [58–61]. It is also worth mentioning that the quality of this questionnaire has been
proven in previous studies in Iran [59,62,63]. Test-retest reliability has been reported to be high (0.78 to
0.90) [42] and interrater and intrarater reliability have both been shown to be excellent (Cronbach’s α
0.90–0.95) [44]. In a study conducted by Askary-Ashtiani et al. [64] on the 28-question form of thisRemote Sens. 2020, 12, 1350 8 of 17
questionnaire, sensitivity was 80%, specificity 99%, criterion validity coefficient 0.78 and Cronbach’s
alpha was 0.97. A high internal consistency has also been reported [44]. The GHQ-28 correlates well
with the Hospital Depression and Anxiety Scale (HADS) [43] and other measures of depression [42].
2.4. Statistical Analysis
One-way ANOVA test was used to compare the average LST of the studied years and detect any
significant difference with a 95% confidence level (P = 0.05). It should be noted that we had nine images
(three images per year) and that LST was estimated for each pixel of them. For each pixel, the annual
mean of the studied years (2016, 2017, and 2018) was calculated separately and three corresponding
data sets were obtained at pixel level. Then, one-way ANOVA test was applied to compare the mean
between these three groups. This test also was used for comparing the average temperature between
Isfahan management zones. We applied Mann–Whitney test (at 95% confidence level) to compare
general health sub-scales (i.e., physical health, anxiety and sleep, social function, and depression)
between citizens in UHI and UCI and determine the significant differences between the treatments.
Statistical analysis and graph drawing were done with Microsoft Excel 2010 and the SPSS version 16.
3. Results and Discussion
3.1. Temporal Variation of LST
LST monitoring was carried out on the summer of 2016, 2017, and 2018 with nine images of the
Landsat satellite (three images for each year) in Isfahan metropolis based on the SWA. Figure 3 shows
the mean LST maps of 2016, 2017 and 2018, and summary statistics of LST. Accordingly, the minimum
and maximum LST for the years 2016, 2017, and 2018 were 31–55.7 ◦ C, 27–57 ◦ C and 33–58.9 ◦ C,
respectively. The mean LST during these years was 45.1, 43.5, and 48 ◦ C, respectively. Although along
the studied years the LST was varied (2018 and 2017 had the highest and lowest LST, respectively), the
mean comparison test showed that there was no significant difference (P > 0.05) between the LST in
the studied years. The lack of significant difference between the mean LST in the studied years could
be due to the short duration of the study period (three years) and the lack of changes in the factors
affecting the ground surface temperature in Isfahan metropolis. One of the most important factors
affecting urban LST is land use composition, e.g., green spaces and man-made surfaces [5,14,65,66].
In this respect in Shirani-bidabadi et al. [56], where the Isfahan green spaces and LST interactions over
a 17-year period (1999-2016) were investigated, significant differences were observed between the
studied years in terms of LST. Madanian et al. [49] also examined the effect of land use characteristics
on LST in Isfahan metropolis over a 30-year period (1985-2015). Their results showed that land use
change had a significant effect on Isfahan land surface temperature during this period. Thus, in
general, it can be assumed that the surface temperature during the studied three-year period kept
approximately the same pattern. We chose this period to select cold and heat islands for distribution of
health questionnaires in the year 2019.Remote Sens. 2020, 12, 1350 9 of 17
Figure 3. Mean LST maps of 2016, 2017, and 2018 (n = 3) and summary statistics of them (Vertical axis: No. of pixel, Horizontal axis: temperature in ◦ C).Remote Sens. 2020, 12, 1350 10 of 17
3.2. Spatial Variation of LST
Figure 4 shows the LST map of the Isfahan metropolis in five classes: (1) very cold, (2) cold,
(3) moderate, (4) hot, and (5) very hot temperature. These classes covered 4.9%, 16.5%, 30.1%, 43.8% and
4.7% of the Isfahan metropolis area, respectively. We considered the extremes, “very cold temperature
class” and “very hot temperature class”, as UCI and UHI, respectively. This map was produced
from the mean of LST maps in the years 2016, 2017, and 2018. Accordingly, the central parts of the
Isfahan metropolis exhibited the highest portion of cold and very cold classes. Whereas the northern,
eastern, and southern parts of Isfahan exhibited higher LST and were classified as hot and very
hot. While the highest population density and the highest traffic volume are focused in the central
parts of the city, there are some contributing factors that can maintain temperature balance in the
city center, e.g., the flow of Zayandeh-Rood river and the greenery congestion around the river [56].
In support of this finding, Madanian et al. [49] also acknowledged that the Zayandeh-Rood river
and its surrounding greenery play a vital role in controlling Isfahan’s LST. The Zayandeh-Rood river
flows through the center of Isfahan and is surrounded by dense parks and greenery, in particular trees
prevent the increasing earth temperature through shading. Peng et al. [29] suggested that green spaces
play a significant role in mitigating the LST in the Beijing metropolitan area, especially if the green
space patches are integrated and wide, their cooling effect will increase. Park et al. [66] investigated
the influence of green spaces on UHIs in Seoul, South Korea. They found that green space patches
with an area over 300 m2 and 650 m2 can lower the LST by 1 and 2 ◦ C, respectively. It is worth
noting that despite the importance of green space in regulating the earth’s temperature, the results of
Shirani-bidabadi et al. [56] showed that the green space of the Isfahan metropolis had decreased in
2016 as compared to in 1999, and this is a cause for concern.
Figure 4. LST classified map of Isfahan based on mean-standard deviation method (n = 9) in the
study period.
In order to gain a better understanding in the location of the heat and cold islands in Isfahan, more
details of the city land covers are shown in Figure 5. This figure confirms that the greenery around the
river or on the outskirts of the streets led to the creation of cold islands.
Isfahan is located in a hot and arid region and its suburban area is covered by bare and rocky
lands [49]. This land cover absorbs and reflects more sunlight and leads to a higher surface temperature
in suburban areas [67]. In confirmation of this, Lazzarini et al. [68] stated that cities located in hot and
arid regions exposed higher surface temperatures in their suburban as opposed to central parts.Remote Sens. 2020, 12, 1350 11 of 17
Most of the heat islands are located in the northern, eastern, and southern parts of Isfahan. Figure 5
also confirms that these parts have a lack of, or poor, vegetation cover and are often covered by barren
rocky terrain as well as man-made surfaces. It is worth mentioning that some human activities led to
an increase in LST, e.g., a military-based area (in the south east), a passenger transport terminal (in the
south west), and an increase in the activities of thermal power plants and petrochemical complexes
and an oil refinery in the western part of Isfahan [56].
Figure 5. Map of heat and cold islands in Isfahan metropolis and zoomed examples by Google
Earth images.
This study investigated Isfahan LST and the determination of UHI and UCI in the years 2016,
2017, and 2018 to identify suitable healthcare centers for completing GHQ-28 in 2019. Isfahan city
management is based on its 15 zones. Therefore, the environmental conditions, services, and available
facilities in each zone have a direct impact on the health of its residents. In Figure 6, Isfahan management
zones were ranked based on the mean LST over the three-year period. Accordingly, zones 1 and 6
exhibited the coldest (40.1 ◦ C) and hottest (48.7 ◦ C) LSTs, with a temperature difference of 8.6 ◦ C.
A significant difference (P < 0.05) was also observed between the surface temperatures of these zones.
We identified four of the hottest zones (UHI) and four of the coldest zones (UCI) in Isfahan based on the
results shown in Figure 6 and selected a healthcare center in each zone to complete the GHQ. Therefore
zones 1, 3, 8, and 9 were assigned to the UCI treatment, and zones 4, 5, 6, and 12 were considered as
UHI treatment.
Figure 6. Map of the average LST in the management zones and location of selected heat and cold
stations (left), and statistical summary chart (average and standard deviation: n = 9) of LST in the
management zones (right).Remote Sens. 2020, 12, 1350 12 of 17
3.3. Relation Between UHI and General Health Sub-Scales
UHIs are one of the most important factors affecting the health and quality of citizen’s life [32,35,36].
But it is necessary to prove this hypothesis accurate with statistical analysis. Therefore, the usage of a
questionnaire can be a rapid, easy, and low-cost way to test this hypothesis. We used the GHQ-28 to
analyze the effects of UHIs/UCIs on citizens’ health status. In this respect, a fundamental difference
between this and previous related studies [30,31,69,70] is that we assessed the general health status of
citizens based on a questionnaire (GHQ-28), while in the earlier studies the health data were obtained
through hospitalization statistics, mortality rate, etc.
To sum up, we monitored UHIs and UCIs over a three-year period (2016–2018) in the Isfahan
metropolitan area and the relationship between citizens’ general health status and the urban surface
temperature was determined using a GHQ-28 based on statistical analysis. Scoring was done based on
GHQ-28 and the results were compared in two groups, i.e., citizens in UHIs and in UCIs. Considering
the statistical analysis of the GHQ-28 in the four sub-scales, i.e., (1) physical health, (2) anxiety and
sleep, (3) social functioning and (4) depression, the results are presented in Table 3.
The results of statistical analysis (Mann–Whitney test) showed that the physical health of citizens
in both UHIs and UCIs was not significantly different (P > 0.05), but there was significant difference
between the two groups of citizen in terms of: (1) social function, (2) depression, and (3) anxiety and
sleep (P < 0.05). In other words, according to the results presented in the table, it can be stated that the
citizens in UHIs have shown more severe responses in terms of social function, depression, and anxiety
and sleep. These are important health indicators and underline the importance of paying attention to
UHIs and the role of city planning.
Consistent with our findings, the studies of Huynen et al. [31] and Gosling et al. [30] found that
UHIs strongly affect citizens’ health indices, even leading to higher mortality rates in these areas.
Similarly, Jagai et al. [69] studied heat stress diseases in urban and surrounding areas. Their results
showed that high temperature had a significant effect on the hospitalization rate. Psychological and
social health issues associated to UHIs, such as depression and the restriction of social activities, were
also reported by Wong et al. [36]. In another study, Chan et al. [70] reported a positive relationship
between ambient temperatures and mental disorder hospitalizations in the Hong Kong special
administrative region. Wong et al. [71] also examined the effects of UHI on social, physical, and mental
health indices of citizen in Greater Kuala Lumpur, Malaysia. Their results stressed the importance of
the health effects of UHIs. They found that the urban temperature can alter the rate of psychological
distresses, e.g., anxiety, depression, and aggressive behaviors. They also reported that the levels of
socialization were reduced and prominent physical health impacts such as heat exhaustion, respiratory
problems, and heat stroke.
When bringing all these studies together with ours, we can conclude that the role of the UHIs in
creating a health risk to citizens is substantial. Moreover, the important point is that the present results
show that the non-physical sub-scale of the citizens’ health (i.e., anxiety and sleep, social functioning,
and depression) were affected by UHIs. Conversely, the physical health index of the citizens in the UHI
and UCI treatments had a similar pattern. Overall, 92.7 % and 91.2 % of citizens showed Moderate
and severe responses to physical health in UHI and UCI treatments, respectively (Table 3), and this
shows that the heat has generally disrupted the physical health of citizens. The lack of a significant
difference in physical health between citizens in the two treatments could be due to the fact that it is
easier to cope with and modify the effects of heat. For example, wearing cooler clothing, using cooling
equipment, and going into the shade can reduce the physical effects of heat. However, non-physical
dimensions of heat increase the anxiety, concern, and social functioning of citizens and make it more
difficult to cope with and is a concern.Remote Sens. 2020, 12, 1350 13 of 17
Table 3. Summary of GHQ-28 results and statistical comparing of GHQ-28 sub-scales (i.e., physical
health, social function, depression, and anxiety and sleep) in two groups of citizen (urban heat island
(UHI) and urban cold island (UCI)) based on Mann–Whitney test (at 95% confidence level).
Citizens in UHI Citizens in UCI
Responses p Value
Number Percentage Number Percentage
physical health
Mild 29 7.3 32 8.1
Moderate 318 80.7 320 80.8 0.102
Severe 47 12.0 44 11.1
Social Function
Mild 18 4.6 20 5.1
Moderate 332 84.3 364 91.9 0.007
Severe 44 11.2 12 3
Depression
Mild 324 81.4 366 92.4
Moderate 60 15.1 18 4.5 0.002
Severe 14 3.5 12 3
Anxiety and Sleep
Mild 216 54.3 230 58.4
Moderate 124 32.2 142 36 0.012
Severe 58 14.6 22 5.6
As a final remark, although numerous studies analyzed urban heat islands and their effects
on human general health status, so far, no study has been conducted using GHQ-28 and this study
is innovative in this respect. However, the efficacy and utility of using GHQ approaches to assess
and quantify the health status of communities is well known. For example, Dzhambov et al. [72]
investigated the relationships between noise and air pollution in the mental illnesses of 720 students
(18–35 years) in Bulgaria. In their study, general health status was assessed by GHQ, and they cited
the GHQ method as a rapid, economical, and practical approach for assessing general health status.
Other studies also used the GHQ approach to analyze the relationship between citizens’ health and
environmental pollution, e.g., road traffic noise and persistent organic pollutants [73,74]. Accordingly,
combining GHQ approaches together with remote sensing analysis, as demonstrated here, proved to
be an effective and cheap method to monitor the life quality of citizens.
4. Conclusions
Due to the adverse effects of urban heat islands (UHIs) on human health, energy consumption,
and environment components, evaluating the distribution patterns of this phenomenon can play a
significant role in mitigating UHI effects, especially in metropolises. The aim of this study was to
investigate the effect of UHIs on community general health status using a remote sensing and field
survey approach in the Isfahan metropolis, Iran. UHI monitoring of the Isfahan metropolis was
conducted by Landsat-8 images and split window algorithm for three years (2016, 2017, and 2018),
and the health status of citizens in two treatments (UHI and UCI) evaluated by GHQ-28. Our most
important findings are listed as follows:
i) The average LST during the study period was 45.5 ± 2.3 ◦ C, and no significant difference
(P > 0.05) was found between these years. This suggests that the LST pattern was almost identical
during the study period and that the citizens were exposed to UHI and UCI during the period.
ii) UCI and UHI extremes covered 4.9 % and 4.7 % of the Isfahan metropolitan area, respectively,
and the Zayandeh-Rood river and the surrounding greenery played an important and vital role in
moderating the surface temperature in the densest and most trafficked part of the city.Remote Sens. 2020, 12, 1350 14 of 17
iii) A total of 800 citizens completed the GHQ-28 in both UCI and UHI treatments. The results
showed that non-physical sub-scales of citizens’ health (i.e., anxiety and sleep, social functioning, and
depression) in UHIs were more severely affected.
Our results demonstrated that suburban areas of the Isfahan metropolis, rather than the central
parts, are more influenced by UHI effects. The suburbs of Isfahan are characterized by poor vegetation
cover and the barren rocky terrain and man-made surfaces. Therefore, it could be a suggestion for city
administrators to consider greener space and health facilities for citizens in hot management zones.
More interventions should be developed to impart knowledge and encourage the citizens to engage in
measures to counter the effects of UHIs and maintain optimal well-being. The factors influencing health
impacts found in this study can and should inform policy and public health responses to mitigate
UHI effects.
This study exemplified that the combination of optical remote sensing techniques and ground-based
survey can play an important role in monitoring citizens’ health and optimizing urban management,
providing valuable information at a low cost and in a short time. The survey GHQ-28 is easy, rapid,
and low-cost, and is capable of assessing the general health status of citizens’ and providing useful
information. It is suggested to conduct similar studies on other metropolises and evaluate the role of
UHIs in increasing environmental risk to citizens’ health.
Author Contributions: M.M. performed the calculus, methodology, designed experiments and wrote the paper,
J.V. edited, supervised the form of the paper and funding acquisition, M.A. supervised and supported the work
and funding the Project, Z.S. conducted the experiments and M.L. observed the scientific content of the paper.
All authors have read and agreed to the published version of the manuscript.
Funding: This research was funded by the Deputy of Research and Technology of Shahrekord University of
Medical Sciences (Grant No. SKUMS 2945-2019). J.V. was supported by the European Research Council (ERC)
under the ERC-2017-STG SENTIFLEX project (grant agreement 755617) for publishing the Project.
Acknowledgments: The authors gratefully acknowledge financial support from the SKUMS.
Conflicts of Interest: The authors declare no conflict of interest.
References
1. Sailor, D.J.; Lu, L. A top–down methodology for developing diurnal and seasonal anthropogenic heating
profiles for urban areas. Atmos. Environ. 2004, 38, 2737–2748. [CrossRef]
2. McMichael, A.J.; Woodruff, R.E.; Hales, S. Climate change and human health: Present and future risks. Lancet
2006, 367, 859–869. [CrossRef]
3. Singh, A.; Purohit, B.M. Public health impacts of global warming and climate change. Peace Rev. 2014, 26,
112–120. [CrossRef]
4. Al-Ghussain, L. Global warming: Review on driving forces and mitigation. Environ. Prog. Sustain. Energy
2019, 38, 13–21. [CrossRef]
5. Weng, Q.; Lu, D.; Schubring, J. Estimation of land surface temperature–vegetation abundance relationship
for urban heat island studies. Remote Sens. Environ. 2004, 89, 467–483. [CrossRef]
6. Dwivedi, A.; Khire, M. Application of split-window algorithm to study Urban Heat Island effect in Mumbai
through land surface temperature approach. Sustain. Cities Soc. 2018, 41, 865–877. [CrossRef]
7. Reisi, M.; Ahmadi Nadoushan, M.; Aye, L. Remote sensing for urban heat and cool islands evaluation in
semi-arid areas. Glob. J. Environ. Sci. Manag. 2019, 5, 319–330.
8. Li, H.; Harvey, J.; Kendall, A. Field measurement of albedo for different land cover materials and effects on
thermal performance. Build. Environ. 2013, 59, 536–546. [CrossRef]
9. Odunuga, S.; Badru, G. Landcover change, land surface temperature, surface albedo and topography in the
Plateau Region of North-Central Nigeria. Land 2015, 4, 300–324. [CrossRef]
10. Streutker, D.R. Satellite-measured growth of the urban heat island of Houston, Texas. Remote Sens. Environ.
2003, 85, 282–289. [CrossRef]
11. Wang, X.; Prigent, C. Comparisons of Diurnal Variations of Land Surface Temperatures from Numerical
Weather Prediction Analyses, Infrared Satellite Estimates and In Situ Measurements. Remote Sens. 2020,
12, 583. [CrossRef]Remote Sens. 2020, 12, 1350 15 of 17
12. Yu, K.; Chen, Y.; Wang, D.; Chen, Z.; Gong, A.; Li, J. Study of the seasonal effect of building shadows on
urban land surface temperatures based on remote sensing data. Remote Sens. 2019, 11, 497. [CrossRef]
13. Howard, L. The Climate of London. 1818. Available online: https://www.urban-climate.org/documents/
LukeHoward_Climate-of-London-V1.pdf (accessed on 2 March 2020).
14. Imhoff, M.L.; Zhang, P.; Wolfe, R.E.; Bounoua, L. Remote sensing of the urban heat island effect across biomes
in the continental USA. Remote Sens. Environ. 2010, 114, 504–513. [CrossRef]
15. Liu, L.; Zhang, Y. Urban heat island analysis using the Landsat TM data and ASTER data: A case study in
Hong Kong. Remote Sens. 2011, 3, 1535–1552. [CrossRef]
16. Wang, J.; Huang, B.; Fu, D.; Atkinson, P.M. Spatiotemporal variation in surface urban heat island intensity
and associated determinants across major Chinese cities. Remote Sens. 2015, 7, 3670–3689. [CrossRef]
17. Li, Y.-y.; Zhang, H.; Kainz, W. Monitoring patterns of urban heat islands of the fast-growing Shanghai
metropolis, China: Using time-series of Landsat TM/ETM+ data. Int. J. Appl. Earth Obs. Geoinf. 2012, 19,
127–138. [CrossRef]
18. Enete, I.; Awuh, M.; Ikekpeazu, F. Assessment of Urban Heat Island (Uhi) situation in Douala Metropolis,
Cameroon. J. Geogr. Earth Sci. 2014, 2, 55–57.
19. Umar, U.M.; Kumar, J.S. Spatial and temporal changes of urban heat island in Kano Metropolis, Nigeria.
Int. J. Res. Eng. Sci. Technol. 2014, 1, 1–9.
20. De Faria Peres, L.; de Lucena, A.J.; Rotunno Filho, O.C.; de Almeida França, J.R. The urban heat island in Rio
de Janeiro, Brazil, in the last 30 years using remote sensing data. Int. J. Appl. Earth Obs. Geoinf. 2018, 64,
104–116. [CrossRef]
21. Hashemi Darebadami, S.; Darvishi Boloorani, A.; AlaviPanah, S.K.; Bayat, R. Investigation of changes in
surface urban heat-island (SUHI) in day and night using multi-temporal MODIS sensor data products (Case
Study: Tehran metropolitan). Sci. J. Manag. Syst. 2019, 19, 113–128. [CrossRef]
22. Gawuc, L.; Struzewska, J. Impact of MODIS quality control on temporally aggregated urban surface
temperature and long-term surface urban heat island intensity. Remote Sens. 2016, 8, 374. [CrossRef]
23. Weng, Q. Thermal infrared remote sensing for urban climate and environmental studies: Methods,
applications, and trends. ISPRS J. Photogramm. Remote Sens. 2009, 64, 335–344. [CrossRef]
24. Kaplan, G.; Avdan, U.; Avdan, Z.Y. Urban heat island analysis using the landsat 8 satellite data: A case study
in Skopje, Macedonia. Proceedings 2018, 2, 358. [CrossRef]
25. Mohamed, A.A.; Odindi, J.; Mutanga, O. Land surface temperature and emissivity estimation for Urban
Heat Island assessment using medium-and low-resolution space-borne sensors: A review. Geocarto Int. 2017,
32, 455–470. [CrossRef]
26. Rozenstein, O.; Qin, Z.; Derimian, Y.; Karnieli, A. Derivation of land surface temperature for Landsat-8 TIRS
using a split window algorithm. Sensors 2014, 14, 5768–5780. [CrossRef]
27. Du, C.; Ren, H.; Qin, Q.; Meng, J.; Zhao, S. A practical split-window algorithm for estimating land surface
temperature from Landsat 8 data. Remote Sens. 2015, 7, 647–665. [CrossRef]
28. Tomlinson, C.J.; Chapman, L.; Thornes, J.E.; Baker, C.J. Including the urban heat island in spatial heat health
risk assessment strategies: A case study for Birmingham, UK. Int. J. Health Geogr. 2011, 10, 42. [CrossRef]
29. Peng, J.; Xie, P.; Liu, Y.; Ma, J. Urban thermal environment dynamics and associated landscape pattern factors:
A case study in the Beijing metropolitan region. Remote Sens. Environ. 2016, 173, 145–155. [CrossRef]
30. Gosling, S.N.; Lowe, J.A.; McGregor, G.R.; Pelling, M.; Malamud, B.D. Associations between elevated
atmospheric temperature and human mortality: A critical review of the literature. Clim. Chang. 2009, 92,
299–341. [CrossRef]
31. Huynen, M.-M.; Martens, P.; Schram, D.; Weijenberg, M.P.; Kunst, A.E. The impact of heat waves and cold
spells on mortality rates in the Dutch population. Environ. Health Perspect. 2001, 109, 463–470. [CrossRef]
32. Tan, J.; Zheng, Y.; Tang, X.; Guo, C.; Li, L.; Song, G.; Zhen, X.; Yuan, D.; Kalkstein, A.J.; Li, F. The urban
heat island and its impact on heat waves and human health in Shanghai. Int. J. Biometeorol. 2010, 54, 75–84.
[CrossRef] [PubMed]
33. Méndez-Lázaro, P.; Muller-Karger, F.E.; Otis, D.; McCarthy, M.J.; Rodríguez, E. A heat vulnerability index to
improve urban public health management in San Juan, Puerto Rico. Int. J. Biometeorol. 2018, 62, 709–722.
[CrossRef] [PubMed]Remote Sens. 2020, 12, 1350 16 of 17
34. Thompson, R.; Hornigold, R.; Page, L.; Waite, T. Associations between high ambient temperatures and heat
waves with mental health outcomes: A systematic review. Public Health 2018, 161, 171–191. [CrossRef]
[PubMed]
35. Jenerette, G.D.; Harlan, S.L.; Buyantuev, A.; Stefanov, W.L.; Declet-Barreto, J.; Ruddell, B.L.; Myint, S.W.;
Kaplan, S.; Li, X. Micro-scale urban surface temperatures are related to land-cover features and residential
heat related health impacts in Phoenix, AZ USA. Landsc. Ecol. 2016, 31, 745–760. [CrossRef]
36. Wong, L.P.; Alias, H.; Aghamohammadi, N.; Aghazadeh, S.; Sulaiman, N.M.N. Urban heat island experience,
control measures and health impact: A survey among working community in the city of Kuala Lumpur.
Sustain. Cities Soc. 2017, 35, 660–668. [CrossRef]
37. König, H.H.; Bernert, S.; Angermeyer, M. Health Status of the German population: Results of a representative
survey using the EuroQol questionnaire. Gesundh. Bundesverb. Der Arzte Des Offentlichen Gesundh. 2005, 67,
173–182.
38. Joore, M.; Brunenberg, D.; Zank, H.; Van Der Stel, H.; Anteunis, L.; Boas, G.; Peters, H. Development of a
questionnaire to measure hearing-related health state preferences framed in an overall health perspective.
Int. J. Technol. Assess. Health Care 2002, 18, 528–539.
39. Ebijuwa, A.S.; Ogunmodede, T.A.; Oyetola, S.O. Health information need and information sources of
pregnant women in Ogbomoso Metropolis, Oyo State, Nigeria. Libr. Philos. Pract. 2013, 1, 9245530.
40. Goldberg, D. Manual of the general health questionnaire. J. Norweg. Med. Assoc. 1989, 109, 1391–1394.
41. Hughes, P. The Neer sign and Hawkins-Kennedy test for shoulder impingement. J. Physiother. 2011, 57, 260.
[CrossRef]
42. Robinson, R.G.; Price, T.R. Post-stroke depressive disorders: A follow-up study of 103 patients. Stroke 1982,
13, 635–641. [CrossRef] [PubMed]
43. Sakakibara, B.M.; Miller, W.C.; Orenczuk, S.G.; Wolfe, D.L. A systematic review of depression and anxiety
measures used with individuals with spinal cord injury. Spinal Cord 2009, 47, 841–851. [CrossRef]
44. Failde, I.; Ramos, I.; Fernandez-Palacin, F. Comparison between the GHQ-28 and SF-36 (MH 1–5) for the
assessment of the mental health in patients with ischaemic heart disease. Eur. J. Epidemiol. 2000, 16, 311–316.
[CrossRef] [PubMed]
45. Sterling, M.; Kenardy, J.; Jull, G.; Vicenzino, B. The development of psychological changes following whiplash
injury. Pain 2003, 106, 481–489. [CrossRef] [PubMed]
46. Feyer, A.-M.; Herbison, P.; Williamson, A.M.; de Silva, I.; Mandryk, J.; Hendrie, L.; Hely, M.C. The role
of physical and psychological factors in occupational low back pain: A prospective cohort study.
Occup. Environ. Med. 2000, 57, 116–120. [CrossRef] [PubMed]
47. Ahmadi, M.; Roudbari, A.D. The Identification of Urban Thermal Islands based on an Environmental
Approach, Case Study: Isfahan Province. Geogr. Environ. Plan. 2017, 28, 1–20.
48. Nasrollahi, N.; Hatami, Z.; Taleghani, M. Development of outdoor thermal comfort model for tourists in
urban historical areas; A case study in Isfahan. Build. Environ. 2017, 125, 356–372. [CrossRef]
49. Madanian, M.; Soffianian, A.R.; Koupai, S.S.; Pourmanafi, S.; Momeni, M. Analyzing the effects of urban
expansion on land surface temperature patterns by landscape metrics: A case study of Isfahan city, Iran.
Environ. Monit. Assess. 2018, 190, 189. [CrossRef]
50. Yu, X.; Guo, X.; Wu, Z. Land surface temperature retrieval from Landsat 8 TIRS—Comparison between
radiative transfer equation-based method, split window algorithm and single channel method. Remote Sens.
2014, 6, 9829–9852. [CrossRef]
51. Latif, M.S. Land Surface Temperature Retrival of Landsat-8 Data Using Split Window Algorithm-A Case
Study of Ranchi District. Int. J. Eng. Dev. Res. 2014, 2, 2840–3849.
52. Rajeshwari, A.; Mani, N. Estimation of land surface temperature of Dindigul district using Landsat 8 data.
Int. J. Res. Eng. Technol. 2014, 3, 122–126.
53. Wang, Y.; Ientilucci, E. A practical approach to Landsat 8 TIRS stray light correction using multi-sensor
measurements. Remote Sens. 2018, 10, 589. [CrossRef]
54. Gerace, A.; Montanaro, M. Derivation and validation of the stray light correction algorithm for the thermal
infrared sensor onboard Landsat 8. Remote Sens. Environ. 2017, 191, 246–257. [CrossRef]
55. Carlson, T.N.; Ripley, D.A. On the relation between NDVI, fractional vegetation cover, and leaf area index.
Remote Sens. Environ. 1997, 62, 241–252. [CrossRef]Remote Sens. 2020, 12, 1350 17 of 17
56. Shirani-Bidabadi, N.; Nasrabadi, T.; Faryadi, S.; Larijani, A.; Roodposhti, M.S. Evaluating the spatial
distribution and the intensity of urban heat island using remote sensing, case study of Isfahan city in Iran.
Sustain. Cities Soc. 2019, 45, 686–692. [CrossRef]
57. Stochl, J.; Böhnke, J.R.; Pickett, K.E.; Croudace, T.J. An evaluation of computerized adaptive testing for
general psychological distress: Combining GHQ-12 and Affectometer-2 in an item bank for public mental
health research. Bmc Med Res. Methodol. 2016, 16, 58. [CrossRef] [PubMed]
58. Van Dierendonck, D. The construct validity of Ryff’s Scales of Psychological Well-being and its extension
with spiritual well-being. Personal. Individ. Differ. 2004, 36, 629–643. [CrossRef]
59. Noorbala, A.; Mohammad, K. The validation of general health questionnaire-28 as a psychiatric screening
tool. Hakim Res. J. 2009, 11, 47–53.
60. Cheng, S.-T.; Chan, A.C. Measuring psychological well-being in the Chinese. Personal. Individ. Differ. 2005,
38, 1307–1316. [CrossRef]
61. Taghavi, M. Evaluate the validity and reliability of public health. J Psych 2001, 20, 81–89.
62. Ghasemi, E.; Aliha, J.M.; Bastani, F.; Samiei, N.; Haghani, H. General health status in women with coronary
artery disease. Koomesh 2013, 14, 474–482.
63. Yaghoobi, H. Screening for Mental Disorders: The Place of Tests and How to Determine the Score and Credit
Score. Ment. Health 2008, 1, 39–51.
64. Askary-Ashtiani, A.; Ebrahimi-Takamejani, I.; Torkaman, G.; Amiri, M.; Mousavi, S.J. Reliability and validity
of the persian versions of the fear avoidance beliefs questionnaire and tampa scale of kinesiophobia in
patients with neck pain. Spine 2014, 39, E1095–E1102. [CrossRef] [PubMed]
65. Doick, K.J.; Peace, A.; Hutchings, T.R. The role of one large greenspace in mitigating London’s nocturnal
urban heat island. Sci. Total Environ. 2014, 493, 662–671. [CrossRef] [PubMed]
66. Park, J.; Kim, J.-H.; Lee, D.K.; Park, C.Y.; Jeong, S.G. The influence of small green space type and structure at
the street level on urban heat island mitigation. Urban For. Urban Green. 2017, 21, 203–212. [CrossRef]
67. Georgescu, M.; Moustaoui, M.; Mahalov, A.; Dudhia, J. An alternative explanation of the semiarid urban
area “oasis effect”. J. Geophys. Res. Atmos. 2011, 116. [CrossRef]
68. Lazzarini, M.; Molini, A.; Marpu, P.R.; Ouarda, T.B.; Ghedira, H. Urban climate modifications in hot desert
cities: The role of land cover, local climate, and seasonality. Geophys. Res. Lett. 2015, 42, 9980–9989. [CrossRef]
69. Jagai, J.S.; Grossman, E.; Navon, L.; Sambanis, A.; Dorevitch, S. Hospitalizations for heat-stress illness
varies between rural and urban areas: An analysis of Illinois data, 1987–2014. Environ. Health 2017, 16, 38.
[CrossRef]
70. Chan, E.Y.; Lam, H.C.; So, S.H.; Goggins, W.B.; Ho, J.Y.; Liu, S.; Chung, P.P. Association between ambient
temperatures and mental disorder hospitalizations in a subtropical city: A time-series study of Hong Kong
special administrative region. Int. J. Environ. Res. Public Health 2018, 15, 754. [CrossRef]
71. Wong, L.P.; Haridah, A.; Nasrin, A.; Sima, A.; Nik, M.N.S. Physical, psychological, and social health impact
of temperature rise due to urban heat island phenomenon and its associated factors. Biomed. Environ. Sci.
2018, 31, 545–550.
72. Dzhambov, A.M.; Markevych, I.; Tilov, B.; Arabadzhiev, Z.; Stoyanov, D.; Gatseva, P.; Dimitrova, D.D.
Pathways linking residential noise and air pollution to mental ill-health in young adults. Environ. Res. 2018,
166, 458–465. [CrossRef] [PubMed]
73. Dzhambov, A.M.; Markevych, I.; Tilov, B.G.; Dimitrova, D.D. Residential greenspace might modify the effect
of road traffic noise exposure on general mental health in students. Urban For. Urban Green. 2018, 34, 233–239.
[CrossRef]
74. Gasull, M.; Pallares, N.; Salcedo, N.; Pumarega, J.; Alonso, J.; Porta, M. Self-rated health and chronic
conditions are associated with blood concentrations of persistent organic pollutants in the general population
of Catalonia, Spain. Environ. Res. 2015, 143, 211–220. [CrossRef] [PubMed]
© 2020 by the authors. Licensee MDPI, Basel, Switzerland. This article is an open access
article distributed under the terms and conditions of the Creative Commons Attribution
(CC BY) license (http://creativecommons.org/licenses/by/4.0/).You can also read