Diel cycle of sea spray aerosol concentration
←
→
Page content transcription
If your browser does not render page correctly, please read the page content below
ARTICLE
                  https://doi.org/10.1038/s41467-021-25579-3                 OPEN

                  Diel cycle of sea spray aerosol concentration
                  J. Michel Flores 1 ✉, Guillaume Bourdin 2,3, Alexander B. Kostinski 4, Orit Altaratz 1, Guy Dagan5,
                  Fabien Lombard 3, Nils Haëntjens 2, Emmanuel Boss 2, Matthew B. Sullivan6, Gabriel Gorsky3,7,
                  Naama Lang-Yona 8,11, Miri Trainic1, Sarah Romac 9, Christian R. Voolstra 10, Yinon Rudich 1,
                  Assaf Vardi 8 ✉ & Ilan Koren 1 ✉
1234567890():,;

                  Sea spray aerosol (SSA) formation have a major role in the climate system, but measure-
                  ments at a global-scale of this micro-scale process are highly challenging. We measured
                  high-resolution temporal patterns of SSA number concentration over the Atlantic Ocean,
                  Caribbean Sea, and the Pacific Ocean covering over 42,000 km. We discovered a ubiquitous
                  24-hour rhythm to the SSA number concentration, with concentrations increasing after
                  sunrise, remaining higher during the day, and returning to predawn values after sunset. The
                  presence of dominating continental aerosol transport can mask the SSA cycle. We did not
                  find significant links between the diel cycle of SSA number concentration and diel variations
                  of surface winds, atmospheric physical properties, radiation, pollution, nor oceanic physical
                  properties. However, the daily mean sea surface temperature positively correlated with the
                  magnitude of the day-to-nighttime increase in SSA concentration. Parallel diel patterns in
                  particle sizes were also detected in near-surface waters attributed to variations in the size of
                  particles smaller than ~1 µm. These variations may point to microbial day-to-night modulation
                  of bubble-bursting dynamics as a possible cause of the SSA cycle.

                                                                   Konstanzer Online-Publikations-System (KOPS)
                                                         URL: http://nbn-resolving.de/urn:nbn:de:bsz:352-2-1226h8m42yh7k2

                  1 Weizmann Institute of Science, Department of Earth and Planetary Sciences, Rehovot, Israel. 2 School of Marine Sciences, University of Maine, Orono, ME,

                  USA. 3 Sorbonne Université, CNRS, Laboratoire d’Océanographie de Villefranche, Villefranche-sur-Mer, France. 4 Department of Physics, Michigan
                  Technological University, Houghton, MI, USA. 5 Atmospheric, Oceanic and Planetary Physics, Department of Physics, University of Oxford, Oxford, UK.
                  6 Departments of Microbiology and Civil, Environmental and Geodetic Engineering, Ohio State University, Columbus, OH, USA. 7 Research Federation for the

                  Study of Global Ocean Systems Ecology and Evolution, FR2022/Tara Oceans-GOSEE, Paris, France. 8 Weizmann Institute of Science, Department of Plant
                  and Environmental Science, Rehovot, Israel. 9 Sorbonne Université, CNRS, Station Biologique de Roscoff, AD2M, UMR 7144, ECOMAP, Roscoff, France.
                  10 Department of Biology, University of Konstanz, Konstanz, Germany. 11Present address: Civil and Environmental Engineering, Technion - Israel Institute of

                  Technology, Haifa, Israel. ✉email: flores@weizmann.ac.il; assaf.vardi@weizmann.ac.il; ilan.koren@weizmann.ac.il

                  NATURE COMMUNICATIONS | (2021)12:5476 | https://doi.org/10.1038/s41467-021-25579-3 | www.nature.com/naturecommunications                                 1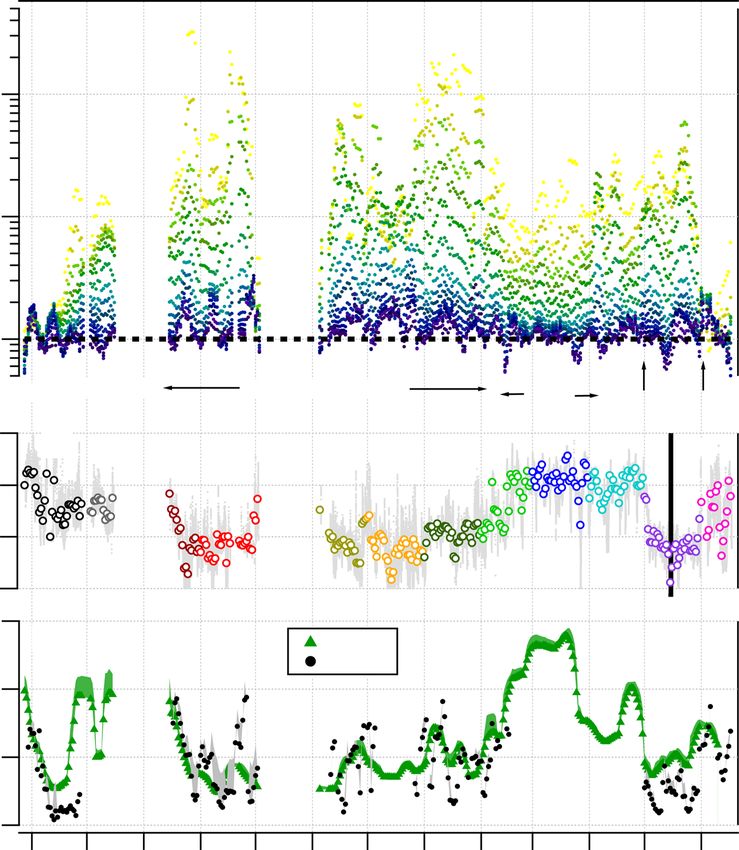
ARTICLE                                                                 NATURE COMMUNICATIONS | https://doi.org/10.1038/s41467-021-25579-3

M
            arine aerosols (MA), defined as the aerosols present in           four components:
            the atmospheric marine boundary layer (AMBL), con-
            sist of a mixture of natural and anthropogenic com-                               NMA ¼ NSSA þ NLRT þ NSOA þ NSE                 ð1Þ
ponents. MA are predominantly composed of four main sources:
sea spray aerosols (SSA), aerosols transported from land (i.e.,              where NLRT is the number concentration of long-range con-
long-range transport), gas-to-particle conversion (homogeneous               tinental transport, NSOA is the number concentration from
and heterogeneous nucleation, and condensation), and particles               aerosols formed from gas-to-particle conversion mechanisms,
from ship exhausts. The total concentration of MA depends on                 and NSE refers to the number concentration from ship emissions.
the distance from its source in combination with transport and                  To distinguish between different aerosol sources, it is common
deposition processes. This leads to large spatial variability of MA          to discuss the different aerosol types and properties according to
concentrations, with higher concentrations near continents where             their sizes (for dried particles or particle sizes measured at a
the terrestrial contribution is larger, than in open ocean                   certain RH), where different regimes of the aerosol size
regions1,2. Moreover, the distance from the shore also acts as a             distribution belong to different aerosol types and processes5.
size sorter as smaller particles are transported, in general, longer         For instance, the freshly produced marine secondary organic
distances and have longer lifetimes than coarse particles3. SSA,             aerosol (SOA) is small in diameter (0.1 µm at an RH ~80%)4. The marine
surface by wind-driven processes and have a major effect on                  anthropogenic sources, such as engine pollution, yield sporadic
climate as they impact atmospheric chemistry, Earth’s radiative              large number concentrations of small submicron particles1. And,
balance, cloud formation, and rain properties4–8. As ocean waves             continental aerosols that are transported over the ocean have a
break, SSA forms when bubbles burst and create film and jet                   variety of sources and therefore sizes; for example, the typical
droplets9. At strong winds (above ~9 m s−1) spume drops10 can                sizes of biomass burning and pollution aerosols are fine18,
be torn off the wave crest. SSA production depends on the                    whereas desert dust aerosols are usually coarser (>~0.6 μm19).
physical11 and chemical12,13 properties of the ocean surface as              Given we report NMA measurements for Dop > 0.25 μm, we can
these, together with wind stress, determine the bubble’s bursting            discard significant contributions to the total NMA from NSE and
dynamics and, therefore, the quantity, size, and composition of              NSOA, and we only have an interplay between the contribution of
the emitted drops. The emitted drops transport, in turn, depends             NLRT and NSSA. To this end, given the surface winds range we
on the AMBL conditions such as the wind, profiles of relative                 encountered (U30 < 16 m s−1), as a first approximation, the
humidity (RH), temperature, instability, and rain4, and have an              attribution between the local contribution of NSSA and NLRT
average (tropospheric) residence time of about half a day6.                  can be scaled to the concentration. SSA is produced by the wind
Understanding the processes that control SSA flux into the                    stress over the ocean surface, and its concentration has been
atmosphere is essential to better understand the climate system,             shown to be (nonlinearly) propositional to the wind speed4,20,21,
weather, and accurate ocean-atmosphere models. However,                      with typical concentrations in the range of 10 s per cubic
global-scale coverage is generally restricted to remote sensing              centimeter21,22. Whereas the contribution of NLRT is proportional
daytime measurements, and many of these processes, including                 to the yields of the continental sources (dust, pollution, smoke),
whether a diel cycle in SSA production exists, have only been                the distance the aerosol traveled, and with aerosol lifetime in the
explored using artificial bubbling13,14, where diel variability in            atmosphere, in general, inversely proportional to the aerosol
mass and number fluxes was observed in biologically productive                size3,23,24, the quantity of smaller diameters will be greater. For
waters.                                                                      example, being near the Saharan desert and tropical biomass
   In this study, we explored and quantified diurnal patterns of              burning areas (tropical Africa and the Amazon), the Atlantic
the number concentration of marine aerosols (NMA) in high                    ocean’s atmosphere is much more polluted compare to the Pacific
spatial and temporal (every minute) resolution along 42,000 km               ocean1,25. Thus, low NMA values (i.e., ~ 0.25 µm)
over the Atlantic Ocean, the Caribbean Sea, and Pacific Ocean,                indicate that NSSA is the primary contributor with low contribution
measured aboard the schooner Tara during the Tara Pacific                     from NLRT, and an indicator of the contribution from NLRT will be
Expedition1,15,16. The expedition began on 28 May 2016 from                  seen as an increase in the NMA.
Lorient, France, and finished the first year of the campaign on 17
June 2017, in Whangarei, New Zealand. Using an optical particle              Diel pattern in marine aerosol number concentration. We
counter (OPC), aerosol size distributions (for optical diameters,            explored temporal patterns of the NMA with Dop ≥ 0.25 μm and
Dop, between 0.25 and 32 µm at RH < 40%) were continuously                   found there is a consistently higher number of aerosols during
measured at 30 m above sea level, along with the spectral parti-             daytime compared to nighttime (Fig. 1A).
culate absorption and attenuation coefficients (cp) at ~1.5 m water              We calculated the day to nighttime ratios (DNR) by averaging
depth17, as well as AMBL (temperature, RH, wind speed and                    from 07:00 to 17:00 MST (mean solar time; all data were
direction, and photosynthetic active radiation) and oceanic                  converted from UTC to MST, see “Methods”) for the day and
(salinity, sea surface temperature, and chlorophyll a) variables. In         from 19:00 to 05:00 MST for the night. The measurements
addition, aerosols were collected on filters (see “Methods” for               between 05:00 to 07:00 and 17:00 to 19:00 were excluded to avoid
instrumentation details). Tara’s route combined sailing periods              strong fluctuations of the ratio. The DNR were calculated across
with days to week-long stops near islands. Here we report the                Tara’s route for each size bin of the OPC and found it to be >1 for
discovery of a distinct 24-h pattern in the number concentration             all sizes on the vast majority of the route (Fig. 1). DNR are shown
of marine aerosols, show that SSA number concentration (NSSA)                to depend strongly on the aerosol diameter and the region (Figs. 1
variations are responsible for this pattern, and suggest a possible          and 2). For smaller aerosol diameters (0.25 < Dop < 0.5 μm) the
mechanism.                                                                   DNR is closer to one (for the Atlantic and along the Keelung to
                                                                             Fiji leg in the Pacific Ocean, we could calculate the DNR for
                                                                             D < 0.25 μm and found it to be ~1 for all diameters down to
Results and discussion                                                       ~0.03 μm; Supplementary Fig. 1), and it becomes larger as the
Main components of the marine aerosol number concentra-                      diameters increase, reaching DNR > 10 for Dop > 1.0 μm. The
tion. We can define the total concentration of MA as the sum of               DNR are larger for all diameters for the Pacific Ocean where total

2                NATURE COMMUNICATIONS | (2021)12:5476 | https://doi.org/10.1038/s41467-021-25579-3 | www.nature.com/naturecommunications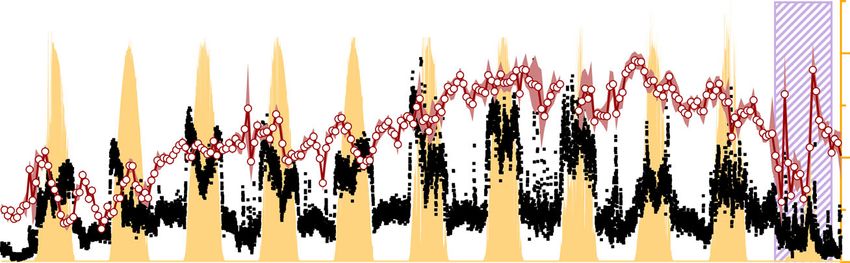
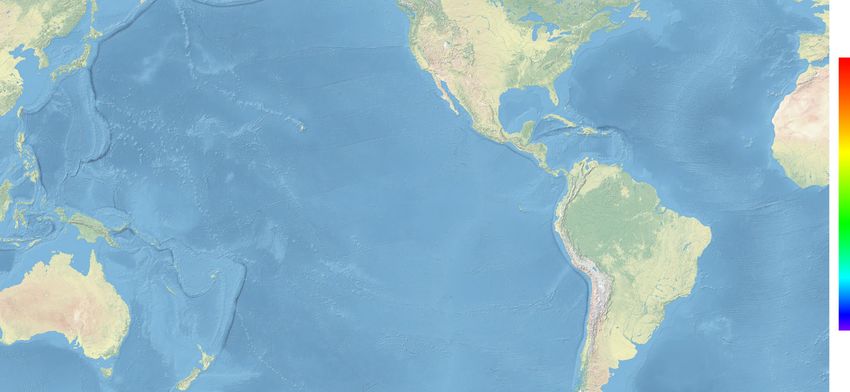
NATURE COMMUNICATIONS | https://doi.org/10.1038/s41467-021-25579-3                                                                           ARTICLE

Fig. 1 Day-to-night ratios for individual bins of the optical particle counter, total marine aerosol count for optical diameter (Dop) ≥ 0.25 μm, and
chlorophyll-a concentration along R/V Tara’s route. (M) Tara’s route, color-coded by month and dotted arrows showing the sailing direction. A The ratio
(5-day running average) of day-to-night concentration of marine aerosol for each size bin of the optical particle counter. B The total aerosol count (daily
mean) for Dop ≥ 0.25 μm, the gray dots are the raw total counts per minute. The colors as defined in the map. C A 5-day running average of chlorophyll-a
concentration measured with the AC-S aboard Tara (black circles) and calculated using satellite data (green triangles; see “Methods”), with the shaded
area outlining one standard deviation. The day-to-night ratios are greater than one on the vast majority of the route and largest in clean areas with low chl-a
concentration, i.e., in oligotrophic (“blue”) waters.

aerosol concentrations are lowest (NMA ≈ 10 cm−3), and are                       were coming directly from New Zealand (see next section and
smaller in areas where the aerosol concentration is higher                       Fig. 3M). In all these areas the DNR was closer to one (Fig. 2),
(Figs. 1A, B and 2); for example, the Atlantic Ocean, around                     suggesting that a stronger influence of NLRT from the continents
Japan, near some of the Pacific islands, and on the leg from Fiji to              masks the local cycle.
New Zealand. Given the MA properties listed above, the increase                     In addition, aerosol lifetime and dry deposition velocities can
in the concentration, to around NMA ≈ 100 cm−3 over these areas,                 also play a role in the size dependence of the DNR. The lifetime of
indicates larger contribution of NLRT. The Atlantic Ocean has                    fine mode aerosols can easily exceed a few days6, therefore, any
generally higher background aerosol concentration due to high                    cycle that its characteristic periodicity is a day or longer will be
mineral dust load1,5,25, in the Japan and Taiwan legs Tara was                   averaged out for such aerosols. The larger the aerosols are, the
near the coast, and in the Fiji to New Zealand the back trajectories             shorter their lifetime and greater their dry deposition velocity24,

NATURE COMMUNICATIONS | (2021)12:5476 | https://doi.org/10.1038/s41467-021-25579-3 | www.nature.com/naturecommunications                                     3
ARTICLE                                                                   NATURE COMMUNICATIONS | https://doi.org/10.1038/s41467-021-25579-3

                                                                               clarity only 11 days are shown. See Supplementary Table 1 for the
                                                                               other days and “Methods” for the classification scheme). We found
                                                                               that over 94% of the particles analyzed contained Na, of which
                                                                               sea-salt particles comprised between 45 and 98% of the total
                                                                               particles by number. Up to 1000 km (May 9; orange-shaded area in
                                                                               the map of Fig. 3) away from Keelung, Taiwan, we identified a
                                                                               noticeable depletion of chloride (Supplementary Fig. 4), together
                                                                               with a lower sea-salt fraction (45–75%) and an increase in the
                                                                               presence of other metals (e.g., Al, Si, K, Ca, S) and sulfate. The
                                                                               chlorine depletion (seen as a second mode in the chlorine mass
                                                                               distribution with Cl mass %  0.3 μm. We used SEM-EDX analysis and a similar particle                 wind speed for both the Pacific and Atlantic Oceans (Fig. 4A, B),
classification scheme as described in Laskin et al.28 (Fig. 3B; a total         consistent with previous studies4,5,21. However, the Pacific Ocean
of 15.5 days were analyzed between 3 and 17 May, 2017, but for                 daytime NSSA ≥ 0.58 µm values consistently exceeded the nighttime

4                  NATURE COMMUNICATIONS | (2021)12:5476 | https://doi.org/10.1038/s41467-021-25579-3 | www.nature.com/naturecommunications
NATURE COMMUNICATIONS | https://doi.org/10.1038/s41467-021-25579-3 ARTICLE Fig. 3 Twenty-four cycle of aerosol concentration and marine particle size index. (M) Map of R/V Tara’s route, with dotted arrows along the sailing direction and solid black lines along the 48-h back-trajectories. Filled circles on the route are colored by the value of the day-to-night concentration ratio. The data in panels (A) through (C) are from the orange and blue-shaded transect in the western Pacific between Keelung and Fiji (next to the double- ended arrow). The orange-shaded region represents anthropogenic polluted conditions, and the blue-shaded refers to clean ones. A Main observation. Aerosol concentration per liter (optical diameter (Dop) > 0.58 μm, collected 30 m above sea surface), superimposed on the 24-h beat of incoming solar flux as represented by the photo-synthetically active radiation (PAR). Time series are punctuated by abrupt spikes at dawn and drops at dusk. The diel rhythm (away from land) is evident, ubiquitous, and persists on cloudy days. Pollution origin of this cycle is ruled out by the 48-h back-trajectories. B Aerosol composition determined by SEM-EDX for geometrical diameters (Dgeo) > 0.3 μm. N and D denote night and day, respectively. This is compelling evidence for the marine origin of the aerosols. The collection filters were replaced at about 08:00–09:30 and 20:00–21:30 (see Supplementary Table 1 in the SI for timing details). C Twenty-hour signal of marine particle size index γ (vertical axis inverted), where the mean particle size increases during the day and decreases during the night. Data collected at 0.5–3 m below the sea surface. NATURE COMMUNICATIONS | (2021)12:5476 | https://doi.org/10.1038/s41467-021-25579-3 | www.nature.com/naturecommunications 5
ARTICLE                                                                   NATURE COMMUNICATIONS | https://doi.org/10.1038/s41467-021-25579-3

Fig. 4 Dependence of the sea spray aerosol number concentration with optical diameters (Dop) ≥ 0.58 μm (NSSA ≥ 0.58 µm) on wind speed. Box plots of
the NSSA ≥ 0.58 µm vs. wind speed, binned at 2 ms−1 for the Pacific Ocean (A) and by 4 ms−1 for the Atlantic Ocean (B) where data collected further than
100 km away from land was used. The day and night data are offset for clarity. The y-axis scale is different for the two panels. While the expected increase
of aerosol concentration with wind speed is indeed observed, no relation between the 24-h cycle and wind speed is found. The box plots show the median,
and the 10th, 25th, 75th, and 90th percentiles. For the daytime (nighttime) Pacific Ocean, N = 3612 (4057), 11,638 (14,833), 20,134 (19,506), 19,988
(23,136), 15,701 (16,097), and 8129 (9034) samples where used for the 0–2, 2–4, 4–6, 6–8, 8–10, and >10 m s−1 bins, respectively. For the daytime
(nighttime) Atlantic Ocean, N = 1089 (949), 4768 (5056), and 1082 (1707) samples were used for the 0–4, 4–8, and >8 m s−1 bins, respectively.

ones, compared at similar wind speeds (Fig. 4A). This shows that               cycles are evident also when there is no air temperature variability
the wind is a key player in the process of SSA emission, but is not            (Supplementary Fig. 5). These observations suggest that atmo-
driving the observed diel cycles.                                              spheric stability does not play a significant role in driving the diel
   To evaluate the interplay between the diel cycle, the wind speed,           cycles. Changes in AMBL height do not fully explain the diel
and the influence of long-range continental transport, we explored              cycles in NSSA either. If height variations within the AMBL were
the relationship between the DNR of NSSA ≥ 0.58 µm, and the total              driving the diel pattern in NSSA ≥ 0.58 μm, given there are no
aerosol concentration (taken as the concentration for Dop ≥ 0.25 μm            changes in the production between day and night, the diurnal
during daytime) at different wind speed regimes (Fig. 5). As                   concentration changes should follow those seen in the AMBL. For
discussed above, higher concentrations imply greater contribution              the period with clear diel cycles in NSSA ≥ 0.58 μm shown in Fig. 3A,
of nonlocal aerosols that mask the cycle. Figure 5 shows that for the          we did not find AMBL height (using ERA5 reanalysis data36; see
cases with concentration >100 # cm−3, the DNR approaches unity                 “Methods”) diurnal changes that follow those we measured in
regardless of the wind speed and location. In the cleaner conditions           NSSA ≥ 0.58 μm, and the changes we found of the AMBL height were
of the Pacific Ocean (NMA < 50 cm−3), we found high variability of
NATURE COMMUNICATIONS | https://doi.org/10.1038/s41467-021-25579-3                                                                         ARTICLE

Fig. 5 Dependence of the day-to-nighttime ratio (DNR) of the sea spray          Fig. 6 Day-to-night changes of the sea spray aerosol number
aerosol number concentration with an optical diameter (Dop) ≥ 0.58 μm           concentration with optical diameters (Dop) ≥ 0.58 μm (NSSA ≥ 0.58 µm)
(NSSA ≥ 0.58 µm) on total daytime aerosol count for three different wind        and the rate of change of γ (∂γ/∂t (hr−1)). A Box plot analysis of the
speed regimes. For daily mean wind speeds below 4 ms−1 (black circles),         282 days with the 24-h cycle in the Pacific Ocean shows the compelling
between 4 and 8 ms−1 (orange triangles), and above 8 ms−1 (blue squares)        statistical significance of the day and night counts. B Box plot analysis of
for A all the data, and B a clean atmosphere (i.e., only in the Pacific Ocean    the γ rate of change (vertical axis inverted) for the 167 days (near the
at least 100 km away from the continents). N refers to the number of days       Pacific islands, Japan, and Taiwan there is no data). Statistically significant
analyzed. While there is no clear relationship between the DNR of               day to night variation is readily discernible. The box plots show the median,
NSSA ≥ 0.58 μm and the wind speed, the DNR tending to one as the total          and the 5th, 25th, 75th, and 95th percentiles; the orange line is the mean. N
aerosol count increases shows that long-range transport of aerosols can         refers to the number of days analyzed.
mask the diel cycle.

SST (R2 = 0.89; Supplementary Fig. 11), consistent with the                     suggests that the diel cycle may be triggered by changes in the
recent report showing that higher SST enhances SSA                              ocean surface itself.
generation21. This suggests that SST is not likely to drive the
NSSA ≥ 0.58 µm diel cycles, but it does play a role in modulating the           Diel patterns of SSA are correlated to the size of seawater
intensity of the DNR.                                                           particles. The identified NSSA diel cycles in the lower atmosphere
   These findings suggest that neither atmospheric nor oceanic                   were accompanied by distinct diel cycles of the near-surface
environmental factors can fully explain the NSSA ≥ 0.58 µm diel                 ocean light attenuation wavelength dependence of cp (expressed
cycles, and consequently the greater amount of aerosol we                       as particle size index γ; Fig. 3C). cp is an inherent optical property
measured in all the other diameters. While the wind speed and                   that depends, theoretically, on all the particles present in the
SST affect the diel cycles, they do not drive them. Furthermore,                water column (i.e., autotrophic and heterotrophic micro-organ-
the ubiquitous occurrence of the diel cycle, whether in the                     isms, as well as detritus and mineral particles). Given cp is
presence of anthropogenic pollutants (Fig. 3A, B and Supple-                    wavelength-dependent, γ is found via a power-law fit41,42:
mentary Fig. 4) or in clean conditions (with NMA ≈ 10 cm−3),
implies that anthropogenic and continental sources are also not
                                                                                                                       λ γ
the cause. Together with the high variability of the DNR of                                                cp ¼ cp λ0                                    ð2Þ
NSSA ≥ 0.58 µm in clean conditions of the Pacific Ocean (Fig. 5B), it                                                    λ0

NATURE COMMUNICATIONS | (2021)12:5476 | https://doi.org/10.1038/s41467-021-25579-3 | www.nature.com/naturecommunications                                   7
ARTICLE NATURE COMMUNICATIONS | https://doi.org/10.1038/s41467-021-25579-3
where cp(λ0) is cp at a reference wavelength λ0 and γ is the spectral biofilms and marine snow53. Recently, in a different context, EPS
slope of cp. Variability of γ indicates changes in the median released by bacteria were found to increase bubble lifetime,
particle size and is most sensitive to particles in the range of thereby dramatically decreasing their film thickness, and yielding
0.22–20 µm41,43, with smaller γ associated with larger median more numerous and transportable droplets at burst than those
particle size (similar to the Ångström exponent for aerosols). produced by clean bubbles (see Fig. 1 in ref. 54). This observations
Figure 3C shows that there is a congruency between the NSSA ≥ can be directly linked to SSA formation since it is directly related
0.58 μm diel cycle and the daily changes of γ. Note that γ reached a maximum value to film drops formed by the fragmentation of the thin fluid cap
began
(i.e., minimum mean diameter) right after sunrise when the NSSA ≥ 0.58 μm film55.
to increase, and a minimum value (i.e., maximum mean dia- Consequently, we conjecture that the diel changes in NSSA are
meter) before sunset when NSSA ≥ 0.58 μm decreased (Fig. 3C). We, controlled by microbial processes in the ocean surface. Such
therefore, calculated the rate of change of γ (∂γ/∂t (hr−1); see processes whether at the near-surface water-AMBL interface, or in
“Methods” for concurrent days (167 days in total) where the the upper several meters of the ocean through bubble scavenging
NSSA ≥ 0.58 μm was also measured (Fig. 6A, B). We found a parallel of the excreted EPS from bacteria, may affect bubble bursting
behavior, with a continuous decrease in the mean particle dia- dynamics, changing the number and size of the emitted droplets
meter at nighttime (∂γ/∂t (hr−1) > 0) when NSSA ≥ 0.58 μm were and therefore NSSA. The AMBL typically mixes within an hour. A
lowest, and a continuous increase (∂γ/∂t (hr−1) < 0) between characteristic time is in the order of 20 min for a 500 m AMBL4.
07:00 and 17:00, when NSSA ≥ 0.58 μm were highest. We also found Hence, significant changes in the production of droplets can be
an inverse relationship between NSSA ≥ 0.58 μm and ∂γ/∂t (hr−1) expected to happen within a similar timeframe in which we
(Supplementary Fig. 12; R2 = 0.51), with higher NSSA ≥ 0.58 μm observed the transient increase and decrease of NSSA. Although we
when ∂γ/∂t (hr−1) is negative. do not pinpoint a direct role of marine bacteria affecting bubble-
In the Pacific Ocean, most γ values were above 0.8 bursting dynamics in the open ocean surface, recent studies have
(Supplementary Fig. 13A) reaching 1.4 with a strong latitudinal shown a possible role for bacteria modulating ocean surface
dependence (Supplementary Fig. 13B). In the Atlantic Ocean properties53,56–59 and bubble-bursting dynamics54,60,61.
(Supplementary Fig. 13A), its values were below 0.8, indicating a Biological activity near the ocean surface has been shown to
larger mean particle size and thereby suggesting the presence of affect SSA abundance and chemical composition13,14,62–64. In
larger planktonic species than in the Pacific Ocean. This indicates particular, Long et al.13 and Keene et al.14 explored differences in
that it is not the size of the planktonic species which is the SSA production between day and night, generating SSA
significant factor but ∂γ/∂t. artificially from seawater on ships at sea. Differently from our
Similar diel cycles of γ in the open ocean have been previously study, they reported an increase in the number and mass of SSA
documented42–44. Changes in γ can be driven by different during the day in biologically active waters and not in
reasons; for example, cell growth, division, and aggregation, oligotrophic ones. They attributed the increased number
selective changes in particle size or concentration due to a balance concentration of SSA following sunrise to biogenic surfactants
between primary production and cell loss due to grazing and viral emitted either from biota or produced photochemically. Other
pressure, or changes in the refractive index of the cell population, studies focused on links between biological activity and SSA
which is related to their carbon content. In the Equatorial Pacific, production have shown contradicting results. In the laboratory,
phytoplankton cells were reported to contribute from 50 to 83% on the one hand, SSA production increased when diatomaceous
of the total particulate organic carbon concentration45, and the exudate62 or actively growing bacteria and phytoplankton65 were
changes in cp and γ throughout the day, were principally driven present in the seawater; and on the other hand, a decrease
by phytoplankton growth and division. During daytime, cells in production occurred when surfactants were present12, or when
photosynthesize, fix inorganic carbon, and accumulate carbohy- there was an increase in algal biomass66. A satellite observation
drates and lipids which are respired during the night, subse- study67, reported a negative correlation of chl-a concentration to
quently cells generally divide. We found that the daytime increase coarse-mode aerosol optical depth in the south Pacific Gyre on a
in γ is associated with cell growth or aggregation of pico- seasonal time scale and suggested that high biological activity
phytoplanktonic populations, as the γ changes measured during suppresses particle production.
NSSA ≥ 0.58 μm diel cycles (in the western Pacific) can be attributed We presented in situ evidence that the number concentration
to variations in size of particles smaller than ~1 µm (see of SSA with Dop ≥ 0.25 μm (at RH < 40%; for dry NaCl particles it
“Methods” and Supplementary Fig. 14). We also observed a daily is equivalent to Dgeo ≥ 0.26 μm, see Supplementary Fig. 2) have a
increase in particulate organic carbon (Supplementary Fig. 15). distinct 24-h cycle (clearly visible for NSSA ≥ 0.58 μm), with higher
The decrease in mean size at night can be due to selective grazing, number concentrations during the day than at night over vast
cell division, or virus-induced lysis46,47. areas of the Pacific Ocean, the Caribbean Sea, and the Atlantic
Ocean. Our results show an inverse correlation between the
ambient aerosol concentration and the magnitude of the observed
Microbial processes might control SSA production. The NSSA cycle (Fig. 5), as the ambient aerosol concentration increases the
diel cycles were observed across high and low chloropyll a (chl-a) day-to-night ratio tends to one, suggesting that over areas with
concentrations regions (Fig. 1), suggesting that processes in oli- high aerosol concentration (e.g., with a strong contribution from
gotrophic waters can be the dominant factors driving the cycles. long-range transport of continental aerosol) the cycle is present
In oligotrophic oceanic regions, the dominating marine phyto- but masked. In addition, the increase of the magnitude of the diel
plankton are picocyanobacteria48,49, in which growth and divi- cycle for larger diameters (Figs. 1 and 2) suggests that the longer
sion have been shown to be well synchronized with daylight50 lifetimes of smaller aerosols (the lifetime of aerosols, excluding
and to contribute a large proportion of the daily variations of cp51. rain events, is inversely proportional to their size) also contributes
During photosynthesis, which begins within tens of seconds after to masking the cycle, particularly for the small sizes. While it is
light exposure, and carbon fixation within minutes52, eukaryotic known that SSA formation originates from the interaction of
phytoplankton and cyanobacteria can secrete extracellular poly- wind and waves, with bulk oceanic properties (i.e., SST, salinity,
meric substances (EPS). EPS are a diverse array of large molecules chl-a) affecting it5,21, here we show that there is a concomitant
which form a major component of the dissolved organic carbon daily mechanism that modulates aerosol concentration in a 24-h
pool in the ocean, and have been implicated in the formation of rhythm with the magnitude of the daytime concentration increase
8 NATURE COMMUNICATIONS | (2021)12:5476 | https://doi.org/10.1038/s41467-021-25579-3 | www.nature.com/naturecommunicationsNATURE COMMUNICATIONS | https://doi.org/10.1038/s41467-021-25579-3 ARTICLE
positively correlated with SST. While we do not provide (or hyperspectral particulate absorption (ap) and particulate attenuation (cp) with a
possess) direct measurements of near-surface water microbial ~4 nm resolution, and an ECO-BB3 (WetLabs Inc.) set in a BB-box of ~4.5 L
measuring particulate backscattering at three wavelength (470, 532, and 650 nm),
processes, the parallel increase of the mean particle size within the altogether mounted in an autonomous setup described in Dall’Olmo et al.72 and
ocean surface during the day, driven by photosynthetic growth Slade et al.44. The size range of the measured particles is >0.2 µm, but contribution
and secretion of extracellular polymeric substances, points of particles >20 µm is assumed negligible. Particulate organic carbon (POC) con-
towards a possible link between microbial processes at the ocean centrations were computed from cp73 and chlorophyll-a concentrations were
surface and the NSSA cycle. estimated from the particulate absorption line height17. In addition, a particle size
index (γ), an estimate of the mean particle size in the ocean near-surface waters,
Although the SSA number fraction (for D > ~0.5 μm) in the was calculated using the wavelength-dependency of cp and that its spectral shape
AMBL, by number, is [Al, Si, K, Ca] but [Na] < [S];
was relocated to the top of the backstay (~30 m asl). (iv) Sulfates: [Na]=0 and [S] >0; and (v) Other: all remaining particles.
The OPC measures single particles at 683 nm and it was calibrated at the To perform the SEM-EDS analysis, we used a Zeiss Sigma500 SEM with a
refractive index of polystyrene latex spheres. It collects the scattered light using a Bruker XFlash®-6|60 Quantax EDS detector, and the Bruker ESPRIT feature
wide-angle collector optic at a mean scattering angle of 90°; the optical design software package for automatic particle detection and chemical classification
smoothes out Mie scattering resonances and reduces the sensitivity to particle in EDS.
shape. A Nafion dryer was installed before the OPC, which reduced the sampled air The SEM was set at a working distance of about 7.5 mm (±0.1), an accelerating
relative humidity to below 40%1. The flow through the OPC was 1.2 L/min and it voltage of 8.0 kV, an aperture size of 60 μm, and a magnification of 2000. The
produced a particle size distribution every 60 s. Particle loss corrections to the OPC backscatter detector was used to acquire the images. For each filter four images,
were applied taking into account the inlet’s length and the tube’s internal diameter covering a total of 2471 μm2 surface area, were taken and each particle above a
using the particle loss calculator71. During the Atlantic crossing and the Keelung to minimum area of 0.08 μm2 was counted and an EDS spectrum acquired. After the
Fiji leg, a scanning mobility particle sizer was functioning and the overlap region acquisition of the images and EDS spectra, we took only the particles that had an
with the OPC was used to check and correct it if necessary; see Flores et al.1 for average diameter >0.3 μm and for each of their corresponding EDS spectra, the
details. method described in ref. 74 was used to calculate the mass percent of each detected
The filters from the custom-made system were changed, in general, twice a day, element. We excluded C from the mass percent calculation since the filters were
collecting aerosols for periods of at least 12 h. The filter holder for the analysis made of polycarbonate. Following the mass calculation, the method described by
presented here contained 0.8 µm polycarbonate filters (ATTP04700, Millipore) that Laskin et al. was applied. First, particles containing sodium above 0.01 mass
were stored at room temperature in PetriSlide dishes preloaded with absorbent percent ([Na] > 0) were first separated from those without sodium. The Na
pads (Millipore, PDMA04700) to keep the filters dry while stored. The flow containing particles with more sodium than any other detected element (besides
through the filter was 30 L/min for the filters analyzed here. Blank filters were Cl) were denoted Sea-salt. The rest of Na containing particles were subdivided into
collected every few days by placing filters on the filter holders, closing the system two classes: Metals with Na if [Na] < [Al], [Ca], [K], [Si], and mixed SeaSalt/Sulfate
for a few seconds, reopening the holders, and storing them in a PetriSlide dish. —if [Na] > [Al], [Ca], [K], [Si] [Na] but [Na] < [S]. The sodium-free particles were
assigned to two classes: Sulfate if [S] >0 and Other for the remaining particles. A
total of 14,339 particles, where 13,405 had average D ≥ 0.3 μm, were analyzed. In
Continuous water measurements. The R/V Tara was equipped with an ocean the 14 daytime filters (for the period between 4 May and 17 May, 2017; see
surface flow-through autonomous sampling system, similar to the one installed Supplementary Table 1) we counted a total of 7247 particles and 6901 with
during the Tara Oceans Expeditions, to measure sea surface physical and bio- D ≥ 0.3 μm. In the 15 nighttime ones we counted a total of 5894 particles with all
optical properties as described in ref. 17. The inline system consisted of a Sea-Bird having D ≥ 0.3 μm. We had between 80 and 781 particles per filter.
Electronics SBE45 MicroTSG for measurements of sea surface temperature (SST) Supplementary Fig. 4A shows the SSA0.58 μm counts per litre calculated using the
and salinity and an AC-S spectrophotometer (WET Labs, Inc.) measuring SEM images (particle count and area imaged) and the total air sampled.
NATURE COMMUNICATIONS | (2021)12:5476 | https://doi.org/10.1038/s41467-021-25579-3 | www.nature.com/naturecommunications 9ARTICLE NATURE COMMUNICATIONS | https://doi.org/10.1038/s41467-021-25579-3
Supplementary Fig. 4B shows histograms of the chlorine mass percentage found in except Japan and Fiji. To calculate the anomalies, first we converted the data to mean
the particles per filter. solar time and took every 24-h period as independent, then we took the mean between
midnight and 05:00 and subtracted the mean value at each hour, and finally took the
mean at each hour.
Daytime and nighttime SSA0.58 μm concentration vs wind speed. In order to
understand the role of wind speed in the NSSA ≥ 0.58 µm cycle, we separated the Pacific
data (for days when a cycle was detected) into daytime (07:00–17:00) and nighttime Rate of change of γ (∂γ/∂t). As mentioned above, γ is an indicator of the size
(19:00–05:00) periods, and binned the total aerosol counts of D ≥ 0.58 µm into 2 m s distribution among particles (NATURE COMMUNICATIONS | https://doi.org/10.1038/s41467-021-25579-3 ARTICLE
2. Mayol, E. et al. Long-range transport of airborne microbes over the global observation of efflorescence during humidification. Atmos. Chem. Phys. 15,
tropical and subtropical ocean. Nat. Commun. 8, 201 (2017). 11273–11290 (2015).
3. D. A. Gillette, “Environmental Factors Affecting Dust Emission by Wind 31. Guo, L. et al. A comprehensive study of hygroscopic properties of calcium-
Erosion,” In: C. Morales, Ed., Saharan Dust, Scope 14, John Wiley & Sons, and magnesium-containing salts: implication for hygroscopicity of mineral
New York, 1979, pp. 71–91. dust and sea salt aerosols. Atmos. Chem. Phys. 19, 2115–2133 (2019).
4. Lewis, R. & Schwartz, E. Sea Salt Aerosol Production: Mechanisms, Methods, 32. Zieger, P. et al. Revising the hygroscopicity of inorganic sea salt particles. Nat.
Measurements and Models—a Critical Review Vol. 152 (American Commun. 8, 15883 (2017).
Geophysical Union, 2004). 33. Rosati, B., Paul, A., Iversen, E. M., Massling, A. & Bilde, M. Reconciling
5. de Leeuw, G. et al. in Ocean-Atmosphere Interactions of Gases and Particles atmospheric water uptake by hydrate forming salts. Environ. Sci. Process.
(eds. Liss, P. S. & Johnson, M. T.) 171–246 (Springer Berlin Heidelberg, 2014). Impacts 22, 1759–1767 (2020).
6. Textor, C. et al. Analysis and quantification of the diversities of aerosol life 34. McInnes, L. M., Quinn, P. K., Covert, D. S. & Anderson, T. L. Gravimetric
cycles within AeroCom. Atmos. Chem. Phys. 6, 1777–1813 (2006). analysis, ionic composition, and associated water mass of the marine aerosol.
7. Gantt, B. et al. Global distribution and climate forcing of marine organic Atmos. Environ. 30, 869–884 (1996).
aerosol—Part 2: Effects on cloud properties and radiative forcing. Atmos. 35. Quinn, P. K. & Coffman, D. J. Local closure during the First Aerosol
Chem. Phys. 12, 6555–6563 (2012). Characterization Experiment (ACE 1): aerosol mass concentration and
8. McCoy, D. T. et al. Natural aerosols explain seasonal and spatial patterns of scattering and backscattering coefficients. J. Geophys. Res. Atmos. 103,
Southern Ocean cloud albedo. Sci. Adv. 1, e1500157 (2015). 16575–16596 (1998).
9. Wu, J. Evidence of sea spray produced by bursting bubbles. Science 212, 36. Hersbach, H. et al. The ERA5 global reanalysis. Q. J. Royal Met. Soc. https://
324–326 (1981). doi.org/10.1002/qj.3803 (2020).
10. Monahan, E. C., Spiel, D. E. & Davidson, K. L. in Oceanic Whitecaps (eds. 37. Paasonen, P. et al. Comprehensive analysis of particle growth rates from
Monahan, E. C. & Niocaill, G. M.) Vol. 2, 167–174 (Springer Netherlands, nucleation mode to cloud condensation nuclei in boreal forest. Atmos. Chem.
1986). Phys. 18, 12085–12103 (2018).
11. Salter, M. E. et al. An empirically derived inorganic sea spray source function 38. Burkart, J. et al. Organic condensation and particle growth to CCN sizes in the
incorporating sea surface temperature. Atmos. Chem. Phys. 15, 11047–11066 summertime marine arctic is driven by materials more semivolatile than at
(2015). continental sites. Geophys. Res. Lett. 44, 725–10,734 (2017).
12. Modini, R. L., Russell, L. M., Deane, G. B. & Stokes, M. D. Effect of soluble 39. Drushka, K., Gille, S. T. & Sprintall, J. The diurnal salinity cycle in the tropics.
surfactant on bubble persistence and bubble-produced aerosol particles. J. J. Geophys. Res. Oceans 119, 5874–5890 (2014).
Geophys. Res. Atmos. 118, 1388–1400 (2013). 40. Kawai, Y. & Wada, A. Diurnal sea surface temperature variation and its
13. Long, M. S. et al. Light-enhanced primary marine aerosol production from impact on the atmosphere and ocean: a review. J. Oceanogr. 63, 721–744
biologically productive seawater. Geophys. Res. Lett. 41, 2661–2670 (2014). (2007).
14. Keene, W. C. et al. Factors that modulate properties of primary marine aerosol 41. Boss, E., Twardowski, M. S. & Herring, S. Shape of the particulate beam
generated from ambient seawater on ships at sea. J. Geophys. Res. Atmos. 122, attenuation spectrum and its inversion to obtain the shape of the particulate
961–11,990 (2017). size distribution. Appl. Opt. 40, 4885 (2001).
15. Planes, S. et al. The Tara Pacific expedition—A pan-ecosystemic approach of 42. Dall’Olmo, G. et al. Inferring phytoplankton carbon and eco-physiological
the “-omics” complexity of coral reef holobionts across the Pacific Ocean. rates from diel cycles of spectral particulate beam-attenuation coefficient.
PLoS Biol. 17, e3000483 (2019). Biogeosciences 8, 3423–3439 (2011).
16. Gorsky, G. et al. Expanding Tara oceans protocols for underway, ecosystemic 43. Boss, E., Haëntjens, N., Westberry, T. K., Karp-Boss, L. & Slade, W. H.
sampling of the ocean-atmosphere interface during Tara Pacific expedition Validation of the particle size distribution obtained with the laser in-situ
(2016–2018). Front. Mar. Sci. 6, 750 (2019). scattering and transmission (LISST) meter in flow-through mode. Opt. Express
17. Boss, E. et al. The characteristics of particulate absorption, scattering and 26, 11125–11136 (2018).
attenuation coefficients in the surface ocean; contribution of the Tara Oceans 44. Slade, W. H. et al. Underway and moored methods for improving accuracy in
expedition. Methods Oceanogr. 7, 52–62 (2013). measurement of spectral particulate absorption and attenuation. J. Atmos. Ocean.
18. Lighty, J. S., Veranth, J. M. & Sarofim, A. F. Combustion aerosols: factors Technol. 27, 1733–1746 (2010).
governing their size and composition and implications to human health. J. Air 45. Grob, C. et al. Contribution of picoplankton to the total particulate organic
Waste Manag Assoc. 50, 1565–1618 (2000). discussion 1619. carbon concentration in the eastern South Pacific. Biogeosciences 4, 837–852
19. Maring, H. et al. Aerosol physical and optical properties and their relationship (2007).
to aerosol composition in the free troposphere at Izaña, Tenerife, Canary 46. Cullen, J. J., Lewis, M. R., Davis, C. O. & Barber, R. T. Photosynthetic
Islands, during July 1995. J. Geophys. Res. 105, 14677–14700 (2000). characteristics and estimated growth rates indicate grazing is the proximate
20. de Leeuw, G. et al. Production flux of sea spray aerosol. Rev. Geophys. 49, control of primary production in the equatorial Pacific. J. Geophys. Res. 97,
RG2001 (2011). 639 (1992).
21. Liu, S. et al. Sea spray aerosol concentration modulated by sea surface 47. Stramski, D. & Reynolds, R. A. Diel variations in the optical properties of a
temperature. Proc. Natl. Acad. Sci. USA 118, https://doi.org/10.1073/ marine diatom. Limnol. Oceanogr. 38, 1347–1364 (1993).
pnas.2020583118 (2021). 48. Bidigare, R. R. & Ondrusek, M. E. Spatial and temporal variability of
22. Quinn, P. K., Coffman, D. J., Johnson, J. E., Upchurch, L. M. & Bates, T. S. phytoplankton pigment distributions in the central equatorial Pacific Ocean.
Small fraction of marine cloud condensation nuclei made up of sea spray Deep Sea Res. Part II: Topical Stud. Oceanogr. 43, 809–833 (1996).
aerosol. Nat. Geosci. 10, 674–679 (2017). 49. Ras, J., Claustre, H. & Uitz, J. Spatial variability of phytoplankton pigment
23. Maring, H. Mineral dust aerosol size distribution change during atmospheric distributions in the Subtropical South Pacific Ocean: comparison between
transport. J. Geophys. Res. 108, 8592 (2003). in situ and predicted data. Biogeosciences 5, 353–369 (2008).
24. Witek, M. L., Flatau, P. J., Teixeira, J. & Markowicz, K. M. Numerical 50. Vaulot, D. & Marie, D. Diel variability of photosynthetic picoplankton in the
investigation of sea salt aerosol size bin partitioning in global transport equatorial Pacific. J. Geophys. Res. 104, 3297–3310 (1999).
models: implications for mass budget and optical depth. Aerosol Sci. Technol. 51. Binder, B. J. & DuRand, M. D. Diel cycles in surface waters of the equatorial
45, 401–414 (2011). Pacific. Deep Sea Res. Part II: Topical Stud. Oceanogr. 49, 2601–2617 (2002).
25. Ben-Ami, Y., Koren, I., Altaratz, O., Kostinski, A. & Lehahn, Y. Discernible 52. Ruban, A. V. Evolution under the sun: optimizing light harvesting in
rhythm in the spatio/temporal distributions of transatlantic dust. Atmos. photosynthesis. J. Exp. Bot. 66, 7–23 (2015).
Chem. Phys. 12, 2253–2262 (2012). 53. Decho, A. W. & Gutierrez, T. Microbial extracellular polymeric substances
26. Stein, A. F. et al. Noaa’s HYSPLIT atmospheric transport and dispersion (EPSs) in ocean systems. Front. Microbiol. 8, 922 (2017).
modeling system. Bull. Am. Meteor. Soc. 96, 2059–2077 (2015). 54. Poulain, S. & Bourouiba, L. Biosurfactants change the thinning of
27. Rolph, G., Stein, A.& Stunder, B. Real-time Environmental Applications and contaminated bubbles at bacteria-laden water interfaces. Phys. Rev. Lett. 121,
Display sYstem: READY. Environ. Model. Softw. 95, 210–228 (2017). 204502 (2018).
28. Laskin, A. et al. Tropospheric chemistry of internally mixed sea salt and 55. Wang, X. et al. The role of jet and film drops in controlling the mixing state of
organic particles: surprising reactivity of NaCl with weak organic acids. J. submicron sea spray aerosol particles. Proc. Natl Acad. Sci. USA 114, 6978–6983
Geophys. Res. 117, https://doi.org/10.1029/2012JD017743 (2012). (2017).
29. Flores, J. M., Trainic, M., Borrmann, S. & Rudich, Y. Effective broadband 56. Ottesen, E. A. et al. Ocean microbes. Multispecies diel transcriptional oscillations
refractive index retrieval by a white light optical particle counter. Phys. Chem. in open ocean heterotrophic bacterial assemblages. Science 345, 207–212 (2014).
Chem. Phys. 11, 7943–7950 (2009). 57. Iuculano, F., Mazuecos, I. P., Reche, I. & Agustí, S. Prochlorococcus as a
30. Gupta, D., Eom, H. J., Cho, H. R. & Ro, C. U. Hygroscopic behavior of possible source for transparent exopolymer particles (TEP). Front. Microbiol.
NaCl–MgCl2 mixture particles as nascent sea-spray aerosol surrogates and 8, 709 (2017).
NATURE COMMUNICATIONS | (2021)12:5476 | https://doi.org/10.1038/s41467-021-25579-3 | www.nature.com/naturecommunications 11ARTICLE NATURE COMMUNICATIONS | https://doi.org/10.1038/s41467-021-25579-3
58. Kurata, N. et al. Surfactant-associated bacteria in the near-surface layer of the Tara Pacific consortium. A.K. was supported by NSF AGS-1639868. This study has been
ocean. Sci. Rep. 6, 19123 (2016). conducted using E.U. Copernicus Marine Service Information and Mercator Ocean
59. Ribalet, F. et al. Light-driven synchrony of Prochlorococcus growth and products. G.D. is supported by the European Research Council (ERC) project con-
mortality in the subtropical Pacific gyre. Proc. Natl Acad. Sci. USA 112, stRaining the EffeCts of Aerosols on Precipitation (RECAP) under the European Union’s
8008–8012 (2015). Horizon 2020 research and innovation program with grant agreement No. 724602. F.L. is
60. Poulain, S., Villermaux, E. & Bourouiba, L. Ageing and burst of surface supported by Sorbonne Université, Institut Universitaire de France and the Fondation
bubbles. J. Fluid Mech. 851, 636–671 (2018). CA-PCA. The in-line and atmospheric optics dataset was collected and analyzed with
61. Poulain, S. & Bourouiba, L. Disease transmission via drops and bubbles. Phys. support from NASA Ocean Biology and Biogeochemistry program under grants
Today 72, 70–71 (2019). NNX13AE58G and NNX15AC08G to the University of Maine. M.S.B. is supported by
62. Fuentes, E., Coe, H., Green, D., Leeuw, Gde & McFiggans, G. On the impacts of NSF OCE1829831. N.L.Y. acknowledges support from the Women Bridging position and
phytoplankton-derived organic matter on the properties of the primary marine the Sustainability and Energy Research Initiative (SAERI), Weizmann Institute of Sci-
aerosol—Part 1: source fluxes. Atmos. Chem. Phys. 10, 9295–9317 (2010). ence. This is publication number # 13 of the Tara Pacific Consortium. Permits to access
63. Facchini, M. C. et al. Primary submicron marine aerosol dominated by the areas sampled were given by Ministerio de Ambiente, Republica de Panama on 13-
insoluble organic colloids and aggregates. Geophys. Res. Lett. 35, https:// 06-2016, No. SE/AP-18-16; Parques Nacionales Naturales de Colombia on 22-02-2016,
doi.org/10.1029/2008GL034210 (2008). Codigo: AMSPNN_FO_16, No: 2016230420500002E; Armada de Chile Servicio Hidro-
64. Quinn, P. K., Collins, D. B., Grassian, V. H., Prather, K. A. & Bates, T. S. grafico y Oceanografico on 29-08-2016, No. 13270/24/457/Vrs.; Convention sur le
Chemistry and related properties of freshly emitted sea spray aerosol. Chem. commerce international des espèces de flore et de faune sauvages menacées d’extinction,
Rev. 115, 4383–4399 (2015). Polynésie Française (France), on 03/11/2016 for No. FR1698700198-E and on 21/11/2016
65. Alpert, P. A. et al. The influence of marine microbial activities on aerosol for No. FR16987002189-E; Cook Island Research Committee, Cook Islands, on 12/09/
production: a laboratory mesocosm study. J. Geophys. Res. Atmos. 120, 2016, file ref: 510.3; Ministry of Natural Resources and Environment, Samoa, on 29/11/
8841–8860 (2015). 2016, No. SAMC16012; Administration superieure des Iles Wallis et Futuna, Terrirtoire
66. Christiansen, S., Salter, M. E., Gorokhova, E., Nguyen, Q. T. & Bilde, M. Sea des Iles Wallis et Futuna, on 24/11/2016, No. 2016-527; Ministry of Foreign Affairs,
spray aerosol formation: laboratory results on the role of air entrainment, Trade, Tourism, Environment and Labor, Government of Tuvalu, on 19/10/2016, No.
water temperature, and phytoplankton biomass. Environ. Sci. Technol. 53, 2016/753527; Environment and Conservation Division, Republic of Kiribati, on 24/11/
13107–13116 (2019). 2016, No. 015/16; Department of Resources & Development, Federated States of
67. Dror, T., Lehahn, Y., Altaratz, O. & Koren, I. Temporal-scale analysis of Micronesia, on 19/01/17, No. CFM17-01-01; Department of Agriculture, Guam, on 4/2/
environmental controls on sea spray aerosol production over the South Pacific 2017, No. SC-17-004; Ministry of Agriculture, Forestry and Fisheries, Japan, on 18/1/
Gyre. Geophys. Res. Lett. 45, 8637–8646 (2018). 2017, No. 019; Ministry of Foreign Affairs, Republic of Fiji, on 11/07/2017, No. 456/2017.
68. Dagan, G., Koren, I. & Altaratz, O. Aerosol effects on the timing of warm rain
processes. Geophys. Res. Lett. 42, 4590–4598 (2015).
69. Dagan, G., Koren, I., Altaratz, O. & Heiblum, R. H. Time-dependent, non-
Author contributions
Conceptualization, J.M.F., O.A., A.K., M.T., E.B., F.L., G.G., Y.R., A.V., and I.K.; data
monotonic response of warm convective cloud fields to changes in aerosol
curation, J.M.F., G.B., N.H., E.B., and F.L.; formal analysis, J.M.F. lead, G.B., G.D., N.H.,
loading. Atmos. Chem. Phys. 17, 7435–7444 (2017).
and F.L. supporting; funding acquisition, E.B., F.L., G.G., A.V., and I.K.; investigation,
70. Koren, I., Dagan, G. & Altaratz, O. From aerosol-limited to invigoration of
J.M.F., G.B. N.H., N.L.-Y., and F.L.; project administration, J.M.F., G.B., M.T., E.B., F.L.,
warm convective clouds. Science 344, 1143–1146 (2014).
G.G., A.V., and I.K.; supervision, J.M.F., E.B., F.L., G.G., Y.R., A.V., and I.K.; visualiza-
71. von der Weiden, S. L., Drewnick, F. & Borrmann, S. Particle Loss Calculator—
tion, J.M.F., A.V., and I.K.; writing—original draft, J.M.F.; writing—review & editing,
a new software tool for the assessment of the performance of aerosol inlet
J.M.F., A.K., O.A., I.K., and A.V. lead, G.B., G.D., N.H., M.S.B., N.L.-Y., M.T., E.B., F.L.,
systems. Atmos. Meas. Tech. 2, 479–494 (2009).
G.G., S.R., C.R.V., and Y.R. supporting.
72. Dall’Olmo, G., Westberry, T. K., Behrenfeld, M. J., Boss, E. & Slade, W. H.
Significant contribution of large particles to optical backscattering in the open
ocean. Biogeosciences 6, 947–967 (2009). Competing interests
73. Gardner, W. D., Mishonov, A. V. & Richardson, M. J. Global POC The authors declare no competing interests.
concentrations from in-situ and satellite data. Deep Sea Res. Part II: Topical
Stud. Oceanogr. 53, 718–740 (2006).
74. Salge, T., Neumann, R., Andersson, C. & Patzschke, M. Advanced mineral Additional information
classification using feature analysis and spectrum imaging with EDS. in Supplementary information The online version contains supplementary material
Proceedings: International Mining Congress and Exhibition, 23rd, Turkey, available at https://doi.org/10.1038/s41467-021-25579-3.
UCTEA Chamber of Mining Engineers of Turkey Vol. 357 (2013).
75. Twardowski, M. S. et al. A model for estimating bulk refractive index from the Correspondence and requests for materials should be addressed to J.M.F., A.V. or I.K.
optical backscattering ratio and the implications for understanding particle
Peer review information Nature Communications thanks Matthew Salter, Merete Bilde
composition in case I and case II waters. J. Geophys. Res. 106, 14129–14142 (2001).
and Xiaofei Wang for their contribution to the peer review of this work. Peer reviewer
76. Durand, M. D. & Olson, R. J. Contributions of phytoplankton light scattering
reports are available.
and cell concentration changes to diel variations in beam attenuation in the
equatorial Pacific from flow cytometric measurements of pico-, ultra- and
Reprints and permission information is available at http://www.nature.com/reprints
nanoplankton. Deep Sea Res. Part II: Topical Stud. Oceanogr. 43, 891–906
(1996).
Publisher’s note Springer Nature remains neutral with regard to jurisdictional claims in
published maps and institutional affiliations.
Acknowledgements
Special thanks of gratitude to the R/V Tara crew. The authors would like to thank the
Tara Pacific Coordinators for their valuable comments on the manuscript. This research Open Access This article is licensed under a Creative Commons
was supported by a research grant from Scott Jordan and Gina Valdez, the De Botton for Attribution 4.0 International License, which permits use, sharing,
Marine Science, the Yeda-Sela center for Basic research, and a research grant from the adaptation, distribution and reproduction in any medium or format, as long as you give
Yotam Project. Special thanks to the Tara Ocean Foundation, the R/V Tara crew, and the appropriate credit to the original author(s) and the source, provide a link to the Creative
Tara Pacific Expedition Participants (https://doi.org/10.5281/zenodo.3777760). We are Commons license, and indicate if changes were made. The images or other third party
keen to thank the commitment of the following institutions for their financial and material in this article are included in the article’s Creative Commons license, unless
scientific support that made this unique Tara Pacific Expedition possible: CNRS, PSL, indicated otherwise in a credit line to the material. If material is not included in the
CSM, EPHE, Genoscope, CEA, Inserm, Université Côte d’Azur, ANR, agnès b., article’s Creative Commons license and your intended use is not permitted by statutory
UNESCO-IOC, the Veolia Foundation, the Prince Albert II de Monaco Foundation, regulation or exceeds the permitted use, you will need to obtain permission directly from
Région Bretagne, Billerudkorsnas, AmerisourceBergen Company, Lorient Aggloméra- the copyright holder. To view a copy of this license, visit http://creativecommons.org/
tion, Oceans by Disney, L’Oréal, Biotherm, France Collectivités, Fonds Français pour licenses/by/4.0/.
l’Environnement Mondial (FFEM), Etienne Bourgois, and the Tara Ocean Foundation
teams. Tara Pacific would not exist without the continuous support of the participating
institutes. The authors also particularly thank Serge Planes, Denis Allemand, and the © The Author(s) 2021
12 NATURE COMMUNICATIONS | (2021)12:5476 | https://doi.org/10.1038/s41467-021-25579-3 | www.nature.com/naturecommunicationsYou can also read