THE QUEENSLAND CLOUD SEEDING RESEARCH PROGRAM
←
→
Page content transcription
If your browser does not render page correctly, please read the page content below
The Queensland Cloud
        Seeding Research Program
   by Sarah A. Tessendorf, Roelof T. Bruintjes, Courtney Weeks, James W. Wilson, Charles A. Knight,
      Rita D. Roberts, Justin R. Peter, Scott Collis, Peter R. Buseck, Evelyn Freney, Michael Dixon,
      Matthew Pocernich, Kyoko Ikeda, Duncan A xisa, Eric Nelson, Peter T. May, Harald Richter,
    Stuart Piketh, Roelof P. Burger, Louise Wilson, Steven T. Siems, Michael Manton, Roger C. Stone,
        Acacia Pepler, Don R. Collins, V. N. Bringi, M. Thurai, Lynne Turner, and David McR ae

            An innovative approach to studying the effects of cloud seeding on precipitation is to
                   focus on understanding the natural variability of precipitation and the
                                    microphysical responses to aerosol.

F
     or much of the last decade, most of eastern
     and southern Australia was under severe
     drought conditions due to mounting rain-
fall deficiencies. The Bureau of Meteorology
(2011) reported that the lack of late winter and
spring rains in 2006 made matters worse; in
fact, that period was the third driest August–
November period across Australia based on the
historical record dating from 1900. Needless
to say, the availability of water became a com-
munity concern, such that water restrictions
were commonplace and conservation pro-
grams became a top priority. Plans to build
desalination plants in all the major coastal
cities of Australia were enacted. In addition,
cloud seeding was considered by a number of
communities. Australia has a long history of
cloud seeding (Kraus and Squires 1947; Smith
et al. 1963, 1979; Warburton and Wetzel 1992;
Ryan and King 1997; Huggins et al. 2008;
Morrison et al. 2009, 2010), although most of
these efforts have been focused on glaciogenic
seeding techniques (using silver iodide) over
the mountains in southeastern Australia and
Tasmania.
    In late 2006 the Queensland government         Fig. 1. Map of southeast Queensland region targeted for the
decided to establish the Queensland Cloud          QCSRP field effort and associated facilities and landmarks.
Seeding Research Program (QCSR P) in               The 30º beam crossing angle dual-Doppler lobes are overlaid
southeastern Queensland (Fig. 1) to determine      in black. [Courtesy of Kevin Sampson, NCAR.]

    AMERICAN METEOROLOGICAL SOCIETY                                                     January 2012     |   75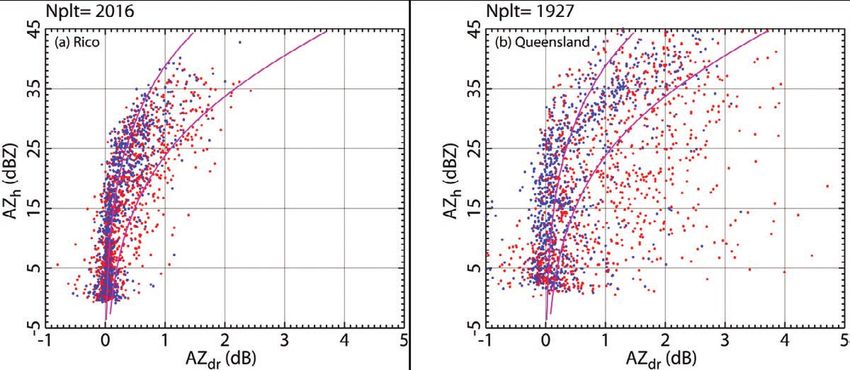
the feasibility of cloud seeding as a component                     been inundated by catastrophic flooding. While this
      of its long-term water management strategy. The                     did not affect the purpose and need for the QCSRP at
      Queensland water management strategy recognizes                     the time, it is pertinent to point out that the dramatic
      the need for a broad portfolio of water sources to                  climate changes this region of the world is undergoing
      account for the uncertainties and costs associated                  has an extraordinary impact on the communities in
      with each type of source. While it was not expected                 the region, and thus developing methods to mitigate
      that cloud seeding would restore southeastern                       these impacts is crucial to the sustainability of these
      Queensland’s water supply levels to predrought                      communities.
      values, it seemed valuable to determine whether
      certain types of seeding techniques might impact                    Experimental strategy. The concep-
      rainfall and water supplies in the region and whether               tual model of hygroscopic seeding is based on the
      that impact could be quantified. The project was                    principle that if you can enhance the collision and
      developed as a collaboration between a number of                    coalescence process, then it will yield more rainfall
      institutions from Australia, the United States, and                 at the ground, thereby improving the precipitation
      South Africa, and included field measurements over                  efficiency of a cloud [for more background, see re-
      the course of two wet seasons. A two-pronged ap-                    views by Cotton (1982), Bruintjes (1999), and Cotton
      proach was taken to a) conduct a randomized cloud                   (2009)]. Thus, clouds are seeded with hygroscopic
      seeding experiment and b) assemble state-of-the-                    materials (particles that take on water easily, such as
      art instrumentation systems to collect data on the                  salts) in the updraft region of the cloud just below the
      complete physical process from cloud formation to                   cloud base. These particles are then carried into the
      seeding to precipitation.                                           cloud by the updraft where water vapor condenses on
         Meanwhile, in stark contrast to the drought                      them to form additional liquid cloud droplets, whose
      and since the conclusion of the QCSRP, the state of                 size depends on the size of the hygroscopic particles
      Queensland has undergone a dramatic climatic shift,                 introduced into the cloud. Adding hygroscopic par-
      having had several rainy seasons and recently having                ticles of larger sizes should help enhance collision and
                                                                          coalescence processes and convert more of the cloud
                                                                          water to rainfall.
Affiliations: Tessendorf, B ruintjes , Weeks , J. W. Wilson,                  There are many complicating factors, however,
Knight, Roberts , Dixon, Pocernich, Ikeda , A xisa , and Nelson —
                                                                          behind trying to assess the impact of hygroscopic
National Center for Atmospheric Research, Boulder, Colorado;
                                                                          cloud seeding, or even pollution aerosols, on clouds
Peter—Queensland Climate Change Centre of Excellence,
Indooroopilly, Queensland, and Monash University, Melbourne,              and ultimately on rainfall. In the atmosphere, we
Victoria, Australia; Collis and May—Centre for Australian                 do not have control cases as one would create in a
Weather and Climate Research, Melbourne, Victoria, Australia;             lab setting, and thus such atmospheric experiments
Richter—Bureau of Meteorology Training Centre, Melbourne,                 always fall short of being able to isolate causality of
Victoria, Australia; B useck and Freney—Arizona State University,         such aerosol effects. Statistical analysis has often
Tempe, Arizona; Piketh and B urger—University of the                      been used in cloud seeding assessment studies (e.g.,
Witwatersrand, Johannesburg, South Africa; L. Wilson, Siems , and
                                                                          Mather et al. 1997; Bruintjes 1999; Silverman 2003),
Manton —Monash University, Melbourne, Victoria, Australia;
Stone —University of Southern Queensland, Toowoomba,
                                                                          in which clouds are seeded (or not) based on a set
Queensland, Australia; Pepler—Macquarie University, Sydney,               of predetermined randomized decision cards. Once
New South Wales, Australia; Collins —Texas A&M University,                the seeding aircraft finds a cloud that meets a set of
College Station, Texas; B ringi and Thurai —Colorado State                basic criteria for the randomized experiment, a case
University, Fort Collins, Colorado; Turner and McR ae —                   is declared, the next sequential randomized decision
Queensland Climate Change Centre of Excellence, Dutton Park,              card is opened, and the cloud is then either seeded (or
Queensland, Australia
                                                                          not) based on the predetermined action. The criteria
Corresponding author: Sarah A. Tessendorf, Research
Applications Laboratory, NCAR, P.O. Box 3000, Boulder, CO
                                                                          used in the QCSRP randomized experiment to select
80307-3000                                                                a cloud was that a cloud needed to have a rain-free
E-mail: saraht@ucar.edu                                                   cloud base at least 2 km in diameter, with an updraft
                                                                          that was detectable by the pilot of roughly 2 m s−1 or
The abstract for this article can be found in this issue, following the
table of contents.
                                                                          greater. This builds up a sample of cases that ideally
DOI:10.1175/BAMS-D-11-00060.1                                             are all similar in nature, with roughly half having
                                                                          been seeded, and statistical tests can be performed
In final form 19 July 2011
©2012 American Meteorological Society                                     on various characteristics of the observed cells. These
                                                                          characteristics, such as precipitation flux, rain mass,

76   |          January 2012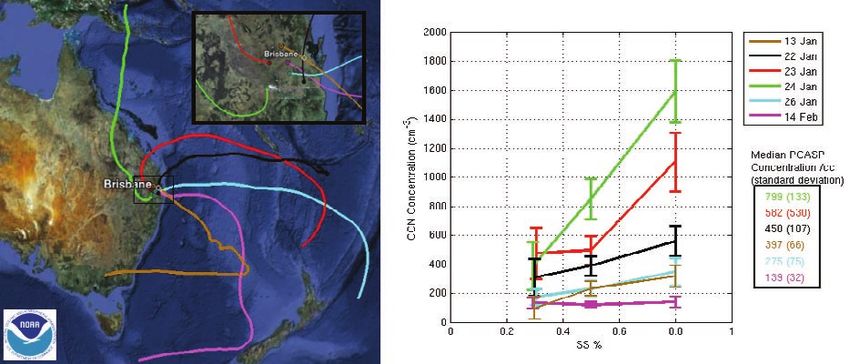
and storm duration, are
traditionally derived from
single-polarization1 radar
echoes of the randomized
cases. 2 However, this sta-
tistical approach is usually
limited by the number of
randomized cases that can
be declared and measured
by radar (and/or aircraft)
for a given limited time
frame experiment as well as
by the lack of physical ob-
servations to substantiate         Fig . 2. Facilities operated during the QCSRP included (a) the CP2 radar
and explain any statistical        (photo depicts the S-band and X-band antennae), and (b) the SAWS Aero
relationships that may be          Commander research/seeding aircraft depicted in flight on a research mis-
found. Furthermore, in             sion. [Photos courtesy Scott Collis, CAWCR.]
regions with considerable
natural variability, it is even more challenging to in getting a large enough sample of cases in random-
obtain a large enough sample to achieve statistical ized seeding statistical experiments. This is especially
significance because of the underlying “noise” that true in regions with great natural variability, such as
results from that variability.                             in the coastal region of southeast Queensland. Thus,
    For the first objective of our two-pronged ap- the rationale for using physical measurements to first
proach in the QCSRP, we conducted a traditional understand the natural variability, perhaps even prior
randomized cloud seeding experiment (Mather et al. to conducting a randomized seeding experiment, has
1997). Over the course of two seasons, we performed been an important outcome from this program.
randomized cloud seeding in 127 clouds and then               For the second objective of our two-pronged
a statistical analysis was performed using single- approach, we focused on gaining a physical under-
polarization, radar-derived quantities to character- standing of the effects of both ambient aerosols
ize the rainfall and behavior of each randomized and seeding material on precipitation formation in
cloud. Despite collecting that reasonable sample of southeast Queensland clouds. To meet this goal, the
randomized cases, a major obstacle in the statisti- QCSRP employed a unique observational infrastruc-
cal analysis of randomized seeding datasets is the ture compared to past cloud seeding experiments.
effect of initial biases and outliers (large storms) in In the region of interest, the Australian Bureau of
addition to the effects of merging and splitting cells Meteorology (BOM) operates a dual-wavelength
that can complicate the radar-based analysis. Thus, (S and X bands), dual-polarization Doppler radar
after accounting for these factors, only 39 of the 127 (CP2;3 Fig. 2a) as well as an operational Doppler radar
randomized cases were able to be included in the (Mt Stapylton) and other operational weather radars.
statistical analysis, which was too small of a sample The QCSRP operational domain was focused in this
to gain statistical significance among the natural vari- region near Brisbane, Australia, around the loca-
ability in the sample (Tessendorf et al. 2010). Without tion of the CP2 research radar, and also utilized the
the predictive ability to only target those clouds that nearby Marburg and Mt Stapylton BOM operational
will produce radar echoes, but not merge and become radars (Fig. 1). The combination of the CP2 and Mt
outliers, these issues will always be limiting factors Stapylton Doppler radars also provided dual-Doppler

1
    Such methods for calculating rainfall quantities for randomized experiments can be misleading since single-polarization
    radars assume a constant drop size distribution when calculating rainfall quantities, and seeding may be altering the size
    distribution. Dual-polarization radars have promise, in that they infer drop size and yield improved rainfall estimates; however,
    methodologies to utilize such dual-polarization measurements in the statistical analysis are not fully developed.
2
    Tracking software, such as Thunderstorm Identification, Tracking, Analysis, and Nowcasting (TITAN; Dixon and Wiener
    1993), is often used to objectively track the echoes.
3
    CP2 was acquired by the BOM in 2006 from the National Center for Atmospheric Research (NCAR; Keenan et al. 2007).
    Characteristics of the radar are presented in Bringi and Hendry (1990) and Keenan et al. (2007).

AMERICAN METEOROLOGICAL SOCIETY                                                                             January 2012            |   77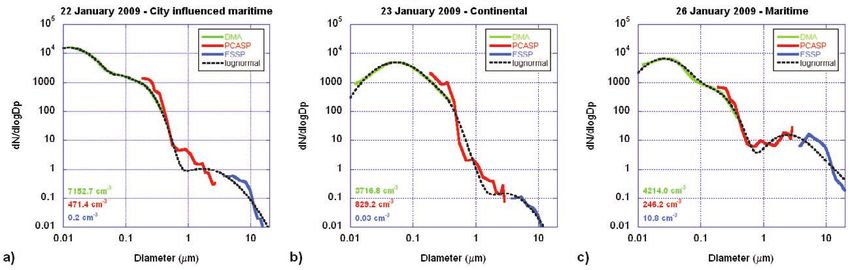
radar analysis capabilities (see Fig. 1). The use of              Table 1. Novel instruments for cloud seeding research
     multiparameter radar in the QCSRP provided for the                included the differential mobility analyzer (DMA) for
     first time the ability to study cloud seeding with in-            measuring the fine-mode range of aerosol particle
     novative remote sensing observations. The field phase             sizes and an aerosol impact sampler for assessing par-
     of the project also incorporated an instrumented re-              ticle composition, in addition to the normal suite of
     search aircraft and a cloud seeding aircraft: the South           aerosol and cloud physics probes. Figure 3 illustrates
     African Weather Service (SAWS) Aero Commander                     the region around Brisbane in which airborne seeding
     was the primary research aircraft, but it also served as          and research operations were conducted.
     a secondary seeding aircraft if conditions warranted;4                The measurements collected in the QCSRP are
     and the Weather Modification, Inc. (WMI) Piper                    being used for a variety of analysis objectives5 aimed
     Cheyenne II was the primary seeding aircraft. The                 at assessing the impacts of both ambient aerosol and
     SAWS Aero Commander (Fig. 2b) carried flare racks                 cloud seeding particles on rain formation. The over-
     on each wing (10 burn-in-place flare capacity each),              arching goals of the QCSRP are to 1) determine the
     and it had a full suite of atmospheric instrumentation            characteristics of local cloud systems (i.e., weather
     capable of taking aerosol and microphysical measure-              and climate, 2) document the properties of atmo-
     ments in seeded and unseeded clouds, described in                 spheric aerosol and their microphysical effects on

     4
         In season 2, only the SAWS research aircraft was available and thus also served as the seeding aircraft.
     5
         Additional details on the QCSRP experimental strategy and objectives are discussed in Tessendorf et al. (2010).

     Table 1. List of cloud physics and aerosol instrumentation on the SAWS Aero Commander in
     each season of the QCSRP. PMS = Particle Measuring Systems; DMT = Droplet Measurement
     Technologies; FSSP = Forward Scattering Spectrometer Probe; CAPS = Cloud, Aerosol, and
     Precipitation Spectrometer.
                     Instrument                                Purpose/comment                            Range            Season
                                                             Cloud physics
     PMS FSSP                                       Cloud droplet spectra                           3–47 µm                  1
     DMT SPP-100 FSSP                               Cloud droplet spectra                           3–47 µm                 Both
                                                    Small precipitation particle size,
     PMS 2D-C                                                                                       25–800 µm                1
                                                    concentration, and shape
                                                    Large precipitation particle size,
     PMS 2D-P                                                                                       200–6,400 µm             1
                                                    concentration, and shape
                                                    Small precipitation particle size,
     DMT Cloud Imaging Probe (CIP)                  concentration, and shape (part of CAPS          25–1,550 µm             Both
                                                    probe listed below)
                                                    Large precipitation particle size,
     DMT Precipitation Imaging Probe (PIP)                                                          100–6,200 µm             2
                                                    concentration, and shape
     PMS Hot-Wire (King) Liquid Water
                                                    LWC                                             0.01–3 g m−3            Both
     Content (LWC) Probe
                                                    Aerosol through precipitation size
     DMT CAPS probe                                 spectrometer; LWC; CIP; static and              Multiple                Both
                                                    dynamic pressure; temperature
                                                                Aerosols
                                                                                                    Depends on
     DMT CCN Counter                                CCN concentration                                                       Both
                                                                                                    supersaturation
     DMA                                            Fine-mode aerosol concentration, spectra        0.01– 0.38 µm           Both
     PCASP                                          Aerosol concentration, spectra                  0.1– 3 µm                1
     DMT SPP-200 PCASP                              Aerosol concentration, spectra                  0.1– 3 µm                2
     Aerosol particle impact sampler                Aerosol chemical composition                    N/A                     Both

78   |          January 2012
precipitation formation, and 3) assess the impact of     base aerosol measurements (see Fig. 4). A variety
cloud seeding on cloud microphysical and dynami-         of influences were recognized, including maritime
cal processes to enhance rainfall. During the course     versus continental flow, and that some aerosol mea-
of the field program, it became clear that there is      surements may have been influenced by the city of
great variability in the natural cloud systems in the    Brisbane itself (e.g., 13 and 22 January; see inset map
southeast Queensland region, and understanding that      in Fig. 4). The aerosol and CCN concentrations sup-
variability would be necessary before any conclusions    port the back-trajectory variations from continental
could be made regarding the impact of cloud seeding.     to maritime flow, with higher aerosol concentra-
This article presents research highlights and progress   tions observed on days with more continental flow
toward achieving the goals of the program, along         and cleaner (less aerosol) conditions on days with
with the challenges associated with conducting cloud     maritime flow.
seeding research experiments.

Local environmental character-
istics and aerosol properties. The
climatology of weather, especially pertaining to
rainfall, in southeast Queensland has been charac-
terized (see Tessendorf et al. 2010) and can generally
be divided into “wet” and “dry” regimes. The wet
regimes occur during the austral summer months
of November–February. The QCSRP focused on the
summer season in southeast Queensland with two
field campaigns: December 2007–March 2008 and
November 2008–February 2009.
    To characterize the environment in which clouds
were forming, regular f lights were conducted to
obtain measurements under the bases of clouds
in the region. These measurements were collected
                                                         Fig. 3. Map of various flight tracks (each indicated by
with the instruments listed in Table 1 and have
                                                         a different color) around the Brisbane region. The
been used to document the concentration, size, and       dual-Doppler lobes (from Fig. 1) are overlaid, and
composition of aerosol particles entering the clouds,    the Archerfield and Brisbane airports are highlighted
in particular those that serve as cloud condensation     for reference. Faint gray lines indicate the watershed
nuclei (CCN), which affect microphysical processes.      boundaries in the region.
Determining the aerosol
properties in the region
is the first step toward
assessing the impacts of
aerosol particles on rain
formation.
    To characterize the
various aerosol condi-
tions observed in the
region, back trajecto-
ries 6 were calculated
from each of the cloud-

                              Fig. 4. (left) Map of 120-h HYSPLIT back trajectories for six sampling days in
6
    Back t rajectories were
                              2009 (13, 22–24, and 26 Jan, and 14 Feb) and (right) associated color-coded CCN
    calculated with the
                              concentration measurements at three supersaturations (0.3%, 0.5%, 0.8%) with
    Hybrid Single-Par ticle
                              whiskers indicating plus/minus one standard deviation for each filter sampling
    Lagrangian Integrated     measurement (see legend). The median (and standard deviation in parentheses)
    Trajector y (H YSPLIT)    PCASP aerosol concentration for each measurement is also noted by color for
    model (Draxler and Hess   each day in the legend. An inset map is included to provide a zoomed-in view of
    1997)                     the trajectory paths relative to the city of Brisbane.

AMERICAN METEOROLOGICAL SOCIETY                                                            January 2012        |   79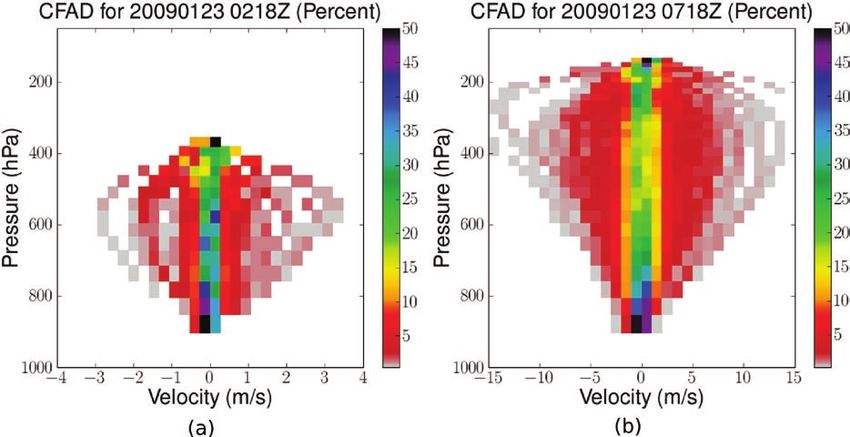
Fig. 5. Aerosol size distributions created from the DMA (green), PCASP (red), and FSSP (blue) measurements
for (a) 22 Jan 2009, (b) 23 Jan 2009, and (c) 26 Jan 2009. A lognormal fit has been applied to the combined dataset
based on methods in Hussein et al. (2005) and is overlaid as a black dashed line. The mean total concentration
per probe (same color as distribution line) is indicated in the lower left corner.

        In addition to the concentration of aerosol and environmental transmission electron microscopy
     CCN, the size distributions of the aerosol are also (ETEM) to study their response to humidification.
     important for cloud microphysical processes. Larger Mineral dust, ammonium sulfate, sodium chloride,
     (coarse mode) aerosol preferentially serve as CCN and magnesium-bearing organic particles were the
     than smaller (fine mode) particles, and broader size major particle types observed (Fig. 6). Furthermore,
     distributions of aerosol can also lead to broader particle compositions were distinctly different in
     size distributions of cloud droplets as
     they nucleate on the aerosol particles,
     which can lead to more efficient collision
     and coalescence processes. The DMA,
     Passive Cavity Aerosol Spectrometer
     Probe (PCASP), and FSSP are probes that
     count and size the aerosol particles that
     when combined, cover a broad range of
     sizes (see Table 1). Examples of the aerosol
     size distributions measured by these three
     instruments on three different days are
     shown in Fig. 5—one with a maritime in-
     fluence, one with a continental influence,
     and one with a maritime history that has
     been influenced by city of Brisbane (see
     Fig. 4).
        To assess the composition of the aero-
     sol, a three-stage particle impact sampler
     (MPS-3, California Measurements, Inc.)
     was used to collect aerosol particles during
     the QCSRP and then a transmission
     electron microscope (TEM) was used to
     determine the properties of the indi-
     vidual aerosol particles (Abel et al. 2003;
     Niemi et al. 2006; Adachi and Buseck 2008;   F i g . 6. Examples of par ticles collected during selected
                                                  research flights. “S bearing” particles are sulfur bearing, and
     Freney et al. 2009; Pósfai and Buseck 2010).
                                                  “Mg bearing” are magnesium-bearing particles. The fibrous,
     Approximately 700 particles were studied     spider web-like material is the lacy-carbon substrate on which
     from six sampling days in 2009 using a       the particles were collected. The date on which particles were
     CM200 TEM, and of these approximately        sampled is shown above each image, all of which occurred in
     70 particles were further examined using     2009. Note the different scale for the 24 Jan image.

80   |      January 2012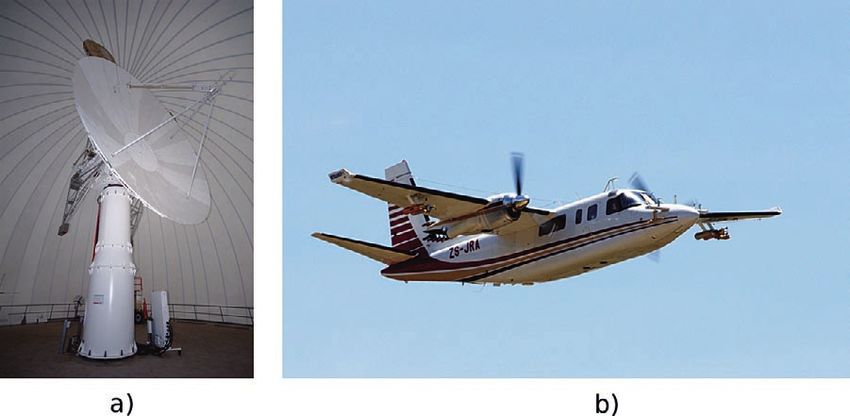
the coarse and fine fractions of all samples studied    aerosol and CCN concentrations overall (Fig. 4).
   with the TEM. Particles in the coarse fraction were     These measurements help to quantify properties
   almost exclusively mineral dust, whereas the fine-      of the aerosol that impact cloud microphysical pro-
   mode particle compositions were more variable in        cesses that our sizing and counting aerosol probes
   composition.                                            cannot provide, and they can help us validate our
      Days containing the highest number of sulfur-        microphysical observations and models. Moreover,
   bearing particles in the fine fraction also had the     by linking the properties of the in situ aerosol
   highest CCN concentrations and had back trajec-         measurements with properties of their back trajec-
   tories indicative of continental or urban-influenced    tories, we are working to develop a predictive tool
   air masses (22, 23, and 24 January in Fig. 4). The      for estimating the aerosol conditions at any given
   more maritime-influenced cases, such as 26 January      location in the region, which will be useful in future
   and 14 February, had the highest number of salt-        analyses for which we may not have direct in situ
   bearing fine-mode particles while having the lowest     aerosol measurements.

Table 2. Examples from the literature of cloud drop measurements near cloud base in cumuliform
clouds from various regions. ACE1 = the first Aerosol Characterization Experiment; ASTEX = Atlantic
Stratocumulus Transition Experiment; PASE = Pacific Atmospheric Sulfur Experiment; SCMS = Small
Cumulus Microphysics Study; INDOEX = Indian Ocean Experiment. Statistics listed in this table depend
upon what was presented in the cited study. Note that calculation methodologies varied and that direct
comparisons should be avoided. Rather, these values provide an indication of the range of measured drop
concentrations and how they vary by region. Drop concentration statistics include flight-averaged drop
concentrations or mean cloud maximum concentrations (ranges of the observations from a given study
or plus/minus the standard deviation were also included when available). The diameters included are
means, ranges of means, or means plus/minus the standard deviation. Cloud types included are cumulus
(Cu), stratocumulus (StrCu), shallow boundary layer cumulus or stratocumulus (BL Cu or BL StrCu,
respectively), and cumulonimbus (Cb). All measurements made with a FSSP except as noted, where *
indicates drop impactor and ** indicates continuous Formvar replicator.
                               Concentration     Diameter
     Location (notes)                                            Cloud type                    Reference
                                   (cc−1)          (µm)
Southwest Pacific (ACE1)          58 ± 32                          BL StrCu      Yum et al. (1998)
Azores (ASTEX)                      ~100                           BL StrCu      Duynkerke et al. (1995)
Caribbean (RICO)                  111 ± 46        17.1 ± 2.1          Cu         Hudson and Mishra (2007)
Pacific Ocean (PASE)              139 ± 39                          BL Cu        Hudson and Noble (2009)
Hawaii                            148–170                             Cu         Twohy and Hudson (1995)
Florida (SCMS maritime)           150 ± 49         15 ± 3.7           Cu         Hudson and Yum (2001)
Indian Ocean (INDOEX
                                  189 ± 64        13.7 ± 5.7        BL Cu        Hudson and Yum (2002)
clean)
Queensland (off coast)            300–450                             Cu         Warner and Twomey (1967)*
Florida (SCMS continental)        312 ± 68        10.9 ± 0.9          Cu         Hudson and Yum (2001)
Queensland
                                 332 ± 211        10.1 ± 2.3        Cu, Cb       Present study
(QCSRP maritime)
Queensland
                                 425 ± 149        10.0 ± 2.1        Cu, Cb       Present study
(QCSRP continental)
Indian Ocean
                                 478 ± 114         8.9 ± 1.1        BL Cu        Hudson and Yum (2002)
(INDOEX polluted)
Florida
                                    487                               Cu         Laird et al. (2000)
(near-adiabatic SCMS)
Queensland (near cane fires)      710–920                             Cu         Warner and Twomey (1967)*
St. Louis (upwind)                689–927          8.1–8.9         Cu, StrCu     Fitzgerald and Spyers-Duran (1973)**
Montana                           800–900           8–10              Cb         Dye et al. (1986)
St. Louis (downwind)             1,157–1,427       5.9–6.8         Cu, StrCu     Fitzgerald and Spyers-Duran (1973)**

   AMERICAN METEOROLOGICAL SOCIETY                                                            January 2012       |      81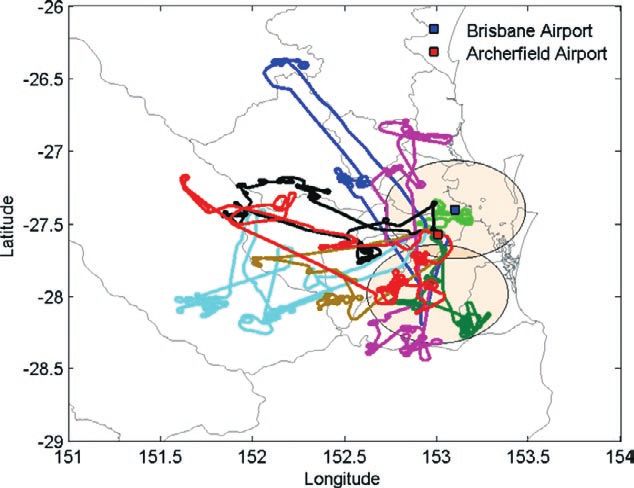
Precipitation formation studies.                                    is less established. Since the QCSRP observational
     In situ measurements of cloud droplet proper-                       domain was near the coast and varied synoptic con-
     ties (Table 2), at altitudes just above cloud base up               ditions provided both continental and maritime sur-
     through the −12°C level, constituted the second                     face flow, we expect clouds to exhibit some amount
     step in assessing the impacts of the aerosol on rain                of variability in their raindrop characteristics,
     formation. There has been a long observational his-                 particularly in their early formation. The QCSRP
     tory demonstrating that increasing continentality                   provided a unique opportunity to investigate the
     is normally associated with increasing CCN con-                     use of polarimetric radar to observe such changes
     centrations in the subcloud layer (Rosenfeld et al.                 in the DSD that might be the result of aerosol or
     2008). As the CCN concentrations increase, so typi-                 cloud seeding.
     cally does the cloud droplet number concentrations                      A polarimetric radar can estimate aspects of the
     near cloud base, which may also be accompanied by                   DSD during the evolution of a storm by utilizing
     narrower cloud droplet spectra, thereby enhancing                   the differential reflectivity (Z dr), which is the ratio
     the colloidal stability of the clouds (Squires 1958).               between horizontal and vertical radar reflectivity
     Thus, in theory, aerosol and CCN measurements                       factors 9 (Z h and Z v, respectively); Z dr provides a
     beneath clouds should be highly correlated with the                 measure of the oblateness of the raindrops, which
     cloud droplet concentrations just above cloud base;                 increases with the size of the raindrops. Thus, Z dr
     however, making such comparisons is challenging,                    is related to raindrop size.10 For reference, a mono-
     given the effects of varying supersaturation, entrain-              disperse size distribution of raindrops 3.6 mm
     ment of cloud-free air, and drizzle formation on in                 (5.8 mm) in diameter has a Z dr of 2 dB (4 dB; Knight
     situ droplet measurements.                                          et al. 2002).
        Despite these challenges and variable measure-                       A number of studies have examined the use of Zdr
     ment methods utilized in the literature,7 droplet                   to estimate DSDs (e.g., Bringi et al. 1986; Wakimoto
     concentrations have typically been observed to be                   and Bringi 1988; Brandes et al. 2004). A Z dr-based
     much lower over the oceans than in continental                      technique was used by Knight et al. (2008) to study
     or more polluted regions (Table 2), which is often                  the evolution of DSDs in trade wind cumulus in
     related to regional aerosol content. The droplet                    the northeastern Caribbean Sea during the Rain in
     concentrations measured just above cloud base in                    Cumulus over the Ocean (RICO) experiment (Rauber
     the QCSRP clouds8 were most similar to those ob-                    et al. 2007). Here we compare the evolution of Zh and
     served in other coastal locations, such as Florida, or              Zdr from the small, maritime clouds in RICO with
     in the polluted portions of the Indian Ocean, even                  those from the QCSRP to obtain a measure of the
     when split by continental or maritime inf luence                    naturally occurring variability of the DSDs (Fig. 7).
     (see Table 2), indicating that the QCSRP region’s                   Knowledge of the natural variability of Zh versus Zdr
     range of drop measurements fall within an inter-                    is important when assessing any possible effects cloud
     mediate category on a global spectrum from clean                    seeding may have on the raindrop size distribution
     to polluted conditions. The QCSRP measurements                      (Wilson et al. 2011).
     are in general agreement with the previous droplet                      The convective clouds studied (Fig. 7) were pri-
     measurements documented by Warner and Twomey                        marily individual single-cell storms that were not
     (1967) that were collected in clouds off the coast of               part of an existing cluster of precipitating clouds.
     Queensland (and upwind of seasonal cane fires)                      There is a considerable difference between Figs. 7a
     north of the QCSRP domain 40 years ago.                             and 7b, in that the maritime data from RICO are
        Even though the effects of aerosol content and                   confined mostly between the two reference curves
     cloud droplet concentrations have been linked, the                  and that the QCSRP data have much greater scat-
     impact of varying CCN on precipitation efficiency                   ter, particularly toward larger AZ dr values. The fact
     and the resulting raindrop size distribution (DSD)                  that these larger values of AZ dr at low values of AZ h

     7
        Several methods for calculating droplet concentrations from aircraft measurements have been explored in the literature and
        vary from flight-averaged concentrations to methods that attempt to identify concentrations in the near-adiabatic core of
        the clouds (Yum et al. 1998; Hudson and Yum 2001).
     8
        The “binmax” method (from Yum et al. 1998) has been used for the QCSRP droplet measurement statistics presented in
        Table 2.
     9
        In this paper, all radar reflectivities are equivalent to radar reflectivity; however, for simplicity, the subscript e is not used.
     10
        For more information on polarimetric radar variables, see Doviak and Zrnić (1993) or Bringi and Chandrasekar (2001).

82   |        January 2012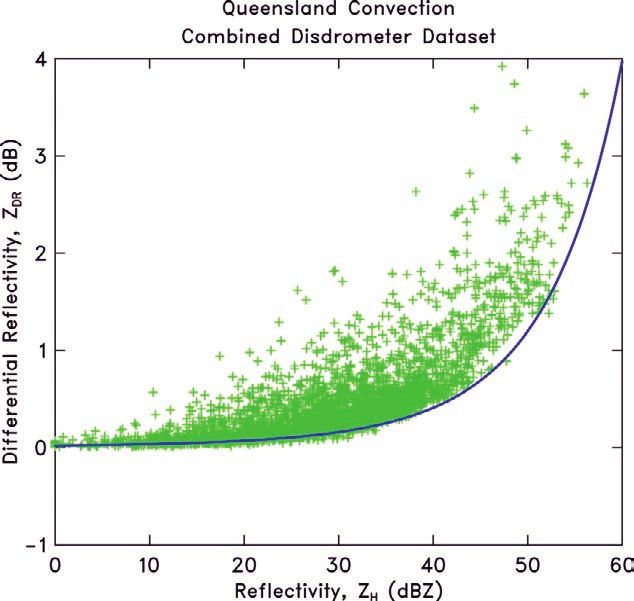
are mostly during the growing phase of the clouds                    trajectory: one associated with air masses that
shows that in Queensland, the initial precipitation                  were maritime in nature and the other with more
formation can have a very bimodal DSD, with Z h                      continental air masses.11 Moreover, their analysis
dominated almost completely by very sparse rain-                     documents the variability of the DSD even over
drops in some clouds. It is worth noting that the                    the lifetime of a single cloud, and thus it highlights
RICO data represented warm clouds (tops warmer                       the need to analyze such effects at a similar stage
than freezing) almost exclusively, and that the QC-                  of cloud growth (i.e., the early growth stage) to
SRP clouds were a mixture of warm and cold clouds                    prevent any possible microphysical signals from
from both maritime- and continentally influenced                     being masked by the noise of natural variability (see
environments. Wilson et al. (2011) studied these                     sidebar for information about direct measurements
trends in more detail on a case-by-case basis for 45                 of raindrop size).
cells in Queensland and found two general types                         Bringi et al. (2002, 2003, 2009) developed a meth-
of raindrop size evolution patterns. From their                      odology for retrieving parameters of the DSD with
analysis, Wilson et al. concluded that the ice phase                 polarimetric radar variables. They showed that when
does not likely influence the differences observed.                  the DSD is described by a gamma distribution, it can be
Rather, they found that the two general raindrop                     succinctly described by size and concentration param-
size evolution types were most likely related to the                 eters: D0, the mass-weighted mean diameter, and Nw,
continentality of the air mass, based on its back                    the drop number concentration. Using climatological

11
     The continentality of an air mass may be defined by variable aerosol properties (recall Fig. 4) but also by variable cloud-base
     heights and subcloud moisture, which affect a cloud’s liquid water path. Several recent studies have cited the importance of
     liquid water path on precipitation formation (e.g., Stevens and Feingold 2009; Sorooshian et al. 2009), and thus this effect
     needs to be considered in addition to potential aerosol effects as the cause for observed microphysical differences.

Fig. 7. Scatter plots of AZh versus AZdr for (a) the maritime Caribbean environment from RICO (190
clouds) and (b) Queensland from the QCSRP (30 clouds). The letter A is used to signify that the indi-
vidual points represent area Zh and Zdr values that are calculated for the whole sweep (single elevation
angle) through the cell, which is not equal to averaging over all of the individual pulse-volume values
but by calculating the values the sweep would have as a single pulse volume (as was done in Knight et al.
2008). The data points represent multiple heights and multiple times through the life of the convective
cells. For ease of viewing and comparison with Queensland, only every sixth point has been plotted
for the RICO data. The number of points in each plot is denoted by “Nplt” at the top of each panel.
Red points represent scans during the growing phase of a cloud, defined as increasing total-volume
values of Zh. Blue points represent decreasing Zh. Following the procedure in Knight et al. (2008), two
reference curves are included: the curve to the left is expected from a Marshall–Palmer distribution,
while that to the right is from single-sized water drops at a 1 m−3 concentration. This is meant to ap-
proximate an extremely bimodal distribution for which the smaller mode contributes negligibly to Zh
and the larger mode is sparse raindrops. [From Wilson et al. 2011.]

AMERICAN METEOROLOGICAL SOCIETY                                                                             January 2012           |   83
disdrometer data, D0 and Nw can also be used to de-
rive rain rates (Bringi et al. 2009). The methodology
has recently been employed to examine differences
in rain rates and DSDs in different climatic regimes
(Bringi et al. 2003; Thurai et al. 2010). Furthermore,
May et al. (2011) applied the technique to storms
with similar dynamic and thermodynamic charac-
teristics, thereby isolating the effects of aerosol on a
deep convective storm. This type of analysis has also
been proposed for the QCSRP to investigate whether
aerosol effects are observable in radar-retrieved DSDs.
As a demonstration of this technique, four days were
chosen to illustrate DSD characteristics of Queensland
clouds: two days with maritime flow and two days that
were continentally influenced (Fig. 8). These initial
results show that differences between D0 and Nw for
all clouds occurring over entire days with maritime
and continental influences are subtle, and that future
Fig. 8. Histogram comparisons of probability dis-
tributions for radar-retrieved DSD parameters
(top) D 0 and (bottom) log(N w) from CP2 radar
data for continental- and maritime-influenced
flow conditions; D 0 is the median volume diameter,
and Nw is the “generalized” intercept parameter,
which is related to the concentration. The conti-
nental flow conditions were obtained from all quality-controlled CP2 data sweeps on 23 and 24 Jan 2009,
while the maritime cases were obtained in the same manner on 13 and 26 Jan 2009. The airmass trajectories
and subcloud aerosol characteristics for these days are presented in Fig. 4.
Direct measurements OF RAINDROP size
D irect measurements of the DSD in rain can be
measured by raindrop disdrometers; however, such
measurements are taken at the surface and may not
reflect the DSD in the cloud, which is what is mea-
sured by radar. Nonetheless, raindrop disdrometers
offer guidance on the relationship between reflectivity
and differential reflectivity in convective rainfall
(Fig. SB1). Intense rainfalls typically are associated with
larger drops (high reflectivity) that are more oblate
(large differential reflectivity). Light rainfall rates are
usually characterized by small, near-spherical drops
(low reflectivity and differential reflectivity). The
correlation between variables is generally reduced
(noisier) for radar-based measurements, however.
As a difference quantity, the differential reflectivity is
sensitive to issues regarding precipitation gradients,
statistical error in the measurements, radar sidelobes,
ground clutter contamination, and the presence of
hail and insects. Hence, radar-derived distributions of
reflectivity and differential reflectivity may often show
more scatter, as is the case in Fig. 7. A potential issue
Fig. SB1. Radar reflectivity plotted vs differential reflec-
with disdrometer observations, nonetheless, is the
tivity, as calculated from disdrometer observations for
limited sampling of large drop concentrations. convective rainfall in Queensland (3,396 1-min samples).
84 | January 2012focus should be on comparing observations at similar tion and, in mixed-phase scenarios, fusion. In the
stages of the microphysical evolution of clouds12 and QCSRP, dual-Doppler measurements with the CP2
for clouds with similar dynamic and thermodynamic and Mt Stapylton radars were available and thus the
characteristics to isolate potential aerosol effects on three-dimensional wind field, including the vertical
raindrop size and concentration. velocity, can be retrieved to directly estimate the
dynamics of the observed storms. Figures 9 and 10
Thermodynamic and dynamic considerations. The ther- present examples of the dual-Doppler wind retrieval13
modynamic profile of the storm environment influ- for two very different storm cells that initiated in
ences the height and temperature of the cloud base the same location five hours apart. Subcloud aero-
and the portion of the cloud that is warmer or cooler sol conditions between the two were similar with
than freezing, and thus whether warm or cold cloud PCASP concentrations between 500 and 550 cm−3.
microphysical processes will be affecting precipita- Figure 9 highlights the difference in vertical extent
tion formation. The vertical velocity of a cloud is in- and intensities of reflectivity and updrafts between
dicative of the dynamic
intensity of the system
and is dependent on the
buoyancy of the rising
air parcel that is creat-
ing the cloud, which is
also determined by the
environmental thermo-
dynamic profile. The
buoyancy of a rising
air parcel may also be
inf luenced by aerosol
microphysical effects
through the release of
latent heat of condensa-
12
Reca l l t hat t he resu lts Fig. 9. Vertical cross sections of CP2 radar reflectivity (color contours; scale
from Wilson et al. (2011), on right) and dual-Doppler-derived storm vertical motion vectors at constant
which were focused on longitude (152.43ºE) for (a) shallow (0218 UTC) and (b) deep (0718 UTC)
individual clouds not en- precipitating systems on 23 Jan 2009.
tire days, highlighted that
microphysical differences
between clouds within the
maritime and continental
regimes were most evident
only in the growth phase of
a cloud.
13
The retrieval of the veloc-
ity structure presented
herein is from gridded
radar moments using grid-
ding methods from Mohr
and Vaughan (1979) and
Collis et al. (2010) and a
variational algorithm that
is an adaptation of the tech-
nique first reported in Ray
Fig. 10. CFADs (Yuter and Houze 1995) of vertical motion for the two storms
et al. (1980) and further depicted in Fig. 9 from 23 Jan 2009 at (a) 0218 and (b) 0718 UTC. Note differ-
refined by Scialom and ence in the velocity scale between the two panels. Each color represents the
Lemaître (1990) and Protat frequency (as a percentage of the total storm volume) that a given vertical
and Zawadzki (2000). velocity occurred at a given height.
AMERICAN METEOROLOGICAL SOCIETY January 2012 | 85the two storm cells. Contoured frequency by altitude The first constraint was due to air safety regu-
diagrams (CFADs; Yuter and Houze 1995) contrast lations in Australia that prevented us from flying
the structure of vertical velocity for these two storms both aircraft simultaneously with less than 2,000 ft
(Fig. 10). CFADs are a commonly used technique for of vertical separation; so, if the seeding aircraft was
quantifying characteristics of storm vertical structure at cloud base, the research aircraft had to be at least
over large volumes of radar data (see Cifelli et al. 2,000 ft above cloud base. Furthermore, the air traffic
2007; Stephens and Wood 2007). The CFADs show control (ATC) system was quite busy with its normal
the difference in maximum updraft and downdraft load of air traffic in the controlled air space around
magnitudes between the two storms as well as heights Brisbane, which made it difficult to get clearances to
and frequencies of these maxima (Fig. 10). fly the two aircraft in coordinated flight patterns as
Thermodynamic considerations add a substantial well as to be able to target specific clouds at the right
challenge to investigating the impact of cloud– times. Nonetheless, we were able to simultaneously
aerosol and/or cloud seeding interactions on the measure nearly one-half of the randomized cases
microphysics and the dynamics of precipitating targeted by the seeding aircraft in the first season
systems. The analysis highlights presented in Figs. 7 with the research aircraft. Furthermore, this issue
and 8 were composed of clouds that formed under was somewhat alleviated in the second field season,
different thermodynamic/dynamic conditions; having just one aircraft and because we held regular
therefore, the observed differences in the DSD briefings with ATC to inform them of our intended
characteristics could be due to these factors rather flight plans. In doing the latter, ATC was better pre-
than variations in the subcloud aerosol. Nonetheless, pared to handle our unique requests, and we gained a
we aim to utilize the techniques presented herein better appreciation of what requests were likely to not
for assessing microphysical differences that could be granted because of their operational constraints.
be due to aerosol and cloud seeding, especially the The physical terrain in the region also served as a
effect of cloud seeding on the DSD, by normalizing constraint on our flight capabilities that unfortunately
by cases with similar stability and airmass histo- cannot be avoided with current aviation navigation
ries. Dual-Doppler air motion retrievals could be technology. The minimum safe flight altitudes for
used to isolate cases of similar intensity by being flying in clouds (no visibility) over areas with higher
able to stratify by updraft velocity, for example (or terrain were often several thousand feet above cloud
use CFADs to stratify by cases with similar vertical base. Moreover, certain clouds were unable to be
structure of the updraft velocity), and then look for targeted for hygroscopic cloud seeding at cloud base
microphysical effects under similar thermodynamic if they were initiated over the higher terrain areas
and dynamic conditions. and the cloud base was lower than the terrain height.
These terrain issues (especially the minimum safe
Challenges. The observational infrastructure altitude rule that prevented measurements at 1,000 ft
in the QCSRP provided an opportunity to validate the above cloud base) impacted roughly one-quarter of
physical chain of events of the hygroscopic seeding the f lights. These conditions made it unsafe and
conceptual model through the ability to seed and logistically impossible to f ly an aircraft in those
measure storms at the same time (using both air- target areas. Therefore, other in situ measurement
craft), to document microphysical characteristics and seeding techniques would need to be developed
and development both in situ (aircraft) and remotely for such conditions.
(polarimetric radar), and to assess dynamic responses Besides these physical and logistical constraints,
through dual-Doppler radar analysis. However, a another challenging issue for cloud seeding research
number of physical and logistical constraints pre- experiments is to seed at the appropriate time (Tzivion
vented us from being able to take regular in situ et al. 1994; Reisin et al. 1996). By the time a radar
measurements at key heights (within 1,000 ft of echo appears on precipitation radar for a typical
cloud base14) and times for cloud droplet nucleation airmass storm, it already has precipitation that has
in seeded clouds. formed and may often already be dissipating. Thus,
14
Droplet spectra should be established by this height, and natural droplet spectral broadening processes start to occur above
this height. Inconsistent measurement heights make it difficult to then identify if a measured droplet spectra was broader
(or narrower) because of nucleation on ambient CCN spectra or cloud seeding particles versus natural broadening processes.
There is unfortunately no way to correct this discrepancy, as the rate of droplet growth and spectral broadening depends on
many variables, including supersaturation (i.e., updraft speed and the initial CCN spectra).
86 | January 2012using precipitation radar to guide the aircraft often fill some of the gaps that the observational constraints
results in seeding after the peak updraft has occurred. have left open. A parcel or bin microphysics modeling
Furthermore, without having a tracer released con- approach could address questions regarding the
current with the seeding material (and an appropri- timing from cloud to rain formation under various
ate instrument on the research aircraft to measure aerosol conditions (including those perturbed by hy-
said tracer), it is not trivial to determine whether the groscopic seeding). These models can hold thermody-
research aircraft flew through a portion of the cloud namic parameters constant and use the observations
affected by the seeding material or not. In Queensland, to help constrain the results to assess the impacts of
we did not employ a tracing capability because of the aerosol on rain formation.
limitations of current tracing technologies (e.g., chaff or As more stress is placed on water resources in our
sulfur hexafluoride gas); however, this severely limited changing climate, especially in already arid regions
our dual-aircraft cloud seeding detection capabilities. and those with rapidly growing populations, this
Thus, we would highly recommend the development area of research is of vital importance for com-
and use of effective tracers for future experiments. munities to develop successful water management
strategies. Nonetheless, the large-scale drivers of
Future efforts. Despite the challenges, this climate [especially the El Niño–Southern Oscillation
kind of analysis of combining state-of-the-art instru- (ENSO) phenomenon, low-frequency systems related
mentation and observations to improve our physical to decadal and interdecadal Pacific Ocean sea surface
understanding of microphysical processes is relevant temperatures, as well as aspects related to climate
and necessary for any observational studies investi- change] are still clearly dominant factors when it
gating aerosol or cloud seeding microphysical effects. comes to long-term precipitation patterns, as is
We learned that having a better understanding of the evidenced by the reversal of southeast Queensland’s
natural variability would be a helpful precursor to drought from a few years ago to the recent devastating
conducting a randomized seeding experiment, and floods the region has experienced. This in itself in-
we recommend utilizing that knowledge by perhaps troduces another set of challenges associated with
only targeting clouds that fit a certain thermodynam- the effects of such extreme climate shifts on society,
ic and aerosol profile to reduce some of the variability and how the public will perceive and adapt to each
among the randomized population that will be used extreme. Cloud seeding is one possible avenue that
for statistical analysis. some communities have pursued (and welcomed) to
There is a great opportunity for a lot of research mitigate water shortages, but it could easily be blamed
combining all of the data that were collected in the for disastrous flooding when the opposite situation
QCSRP to study aerosol and cloud seeding effects on arises. Thus, scientists conducting cloud seeding re-
microphysical processes. The unique dataset collected search efforts need to be cautious in their approach,
during the extensive time in the field [typical field and they should include interdisciplinary teams that
campaigns have intensive observing periods (IOPs) integrate input from many scales of decision making,
on the order of 1–2 months, whereas this experiment scientific knowledge, and public opinion.
ran for 4 months] is available for such studies, and we
encourage collaboration within the community to Acknowledgments. The Queensland Cloud
address the issues related to understanding aerosol Seeding Research Program was sponsored by t he
microphysical interactions from both observational Queensland Department of Environment and Resource
and numerical modeling approaches. For example, Management through the Queensland Climate Change
the knowledge we have gained about the natural Centre of Excellence (QCCCE). We acknowledge the tre-
variability in the region now needs to be utilized to mendous efforts of the field project personnel from NCAR,
help constrain detailed case studies of the microphys- QCCCE, USQ, Monash University, BOM’s CAWCR,
ics (using the multiparameter radar data and in situ SAWS, WITS, MIPD Pty Ltd, and WMI, who executed
measurements) to study impacts on precipitation the field operations. The program design, execution, and
processes, such as secondary ice production and pre- subsequent scientific analysis are the result of collabora-
cipitation efficiency. Future studies could also address tions with the above-mentioned institutions as well as with
how changes in cloud microphysical processes may Texas A&M University and Arizona State University (via
alter the updraft/downdraft structure and subsequent NSF Grant ATM-0531926 and the John M. Cowley Center
dynamics of cloud systems by utilizing the polarimet- for High Resolution Microscopy). The authors gratefully
ric and dual-Doppler radar data from the project. In acknowledge NOAA’s Air Resources Laboratory (ARL) for
particular, modeling studies are also needed to help the use of the HYSPLIT transport and dispersion model.
AMERICAN METEOROLOGICAL SOCIETY January 2012 | 87Collis, S., A. Protat, and K.-S. Chung, 2010: The effect
REFERENCES of radial velocity gridding artifacts on variation-
Abel, S. J., J. M. Haywood, E. J. Highwood, J. Li, and ally retrieved vertical velocities. J. Atmos. Oceanic
P. R. Buseck, 2003: Evolution of biomass burning Technol., 27, 1239–1246.
aerosol properties from an agricultural fire in Cotton, W. R., 1982: Modification of precipitation from
southern Africa. Geophys. Res. Lett., 30, 1783, warm clouds – A review. Bull. Amer. Meteor. Soc.,
doi:10.1029/2003GL018342. 63, 146–160.
Adachi, K., and P. R. Buseck, 2008: Internally mixed soot, —, 2009: Parallels and contrasts between deliberate
sulfates, and organic matter in aerosol particles from cloud seeding and aerosol pollution effects. Aerosol
Mexico City. Atmos. Chem. Phys., 8, 6469–6481. Pollution Impact on Precipitation: A Scientific Review,
Brandes, E. A., G. Zhang, and J. Vivekanandan, 2004: Z. Levin and W. R. Cotton, Eds., Springer, 277–294.
Comparison of polarimetric radar drop size distribu- Dixon, M., and G. Wiener, 1993: TITAN: Thunderstorm
tion retrieval algorithms. J. Atmos. Oceanic Technol., identification, tracking, analysis, and nowcasting—
21, 584–598. A radar-based methodology. J. Atmos. Oceanic
Bringi, V. N., and A. Hendry, 1990: Technology of po- Technol., 10, 785–797.
larization diversity radars for meteorology. Radar in Doviak, R. J., and D. S. Zrnić, 1993: Doppler Radar and
Meteorology, David Atlas, Ed., Amer. Meteor. Soc., Weather Observations. 2nd ed. Academic Press,
153–190. 562 pp.
—, and V. Chandrasekar, 2001: Polarimetric Doppler Draxler, R. R., and G. D. Hess, 1997: Description of the
Weather Radar: Principles and Applications. HYSPLIT_4 modeling system. NOAA Tech. Memo.
Cambridge University Press, 636 pp. ERL ARL-224, 24 pp.
—, R. M. Rasmussen, and J. Vivekanandan, 1986: Duynkerke, P. G., H. Zhang, and P. J. Jonker, 1995:
Multiparameter radar measurements in Colorado Microphysical and turbulent structure of nocturnal
convective storms. Part I: Graupel melting studies. stratocumulus as observed during ASTEX. J. Atmos.
J. Atmos. Sci., 43, 2545–2562. Sci., 52, 2763–2777.
—, G.-J. Huang, V. Chandreseakar, and E. Gorgucci, Dye, J. E., and Coauthors, 1986: Early electrification
2002: A methodology for estimating the parameters and precipitation development in a small, iso-
of a gamma raindrop size distribution model from lated Montana cumulonimbus. J. Geophys. Res., 91,
polarimetric radar data: Application to a squall-line 1231–1247.
event from the TRMM/Brazil campaign. J. Atmos. Fitzgerald, J. W., and P. A. Spyers-Duran, 1973: Changes
Oceanic Technol., 19, 633–645. in cloud nucleus concentration and cloud droplet size
—, V. Chandresekar, J. Hubbert, E. Gorgucci, W. L. distribution associated with pollution from St. Louis.
Randeu, and M. Schoenhuber, 2003: Raindrop size J. Appl. Meteor., 12, 511–516.
distribution in different climatic regimes from dis- Freney, E. J., S. T. Martin, and P. R. Buseck, 2009:
drometer and dual-polarized radar analysis. J. Atmos. Deliquesecence and efflorescence of potassium salts
Sci., 60, 354–365. relevant to biomass-burning aerosol particles.
—, C. R. Williams, M. Thurai, and P. T. May, 2009: Aerosol Sci. Technol., 43, 799–807.
Using dual-polarized radar and dual-frequency Hudson, J. G., and S. S. Yum, 2001: Maritime–continental
profiler for DSD characterization: A case study from drizzle contrasts in small cumuli. J. Atmos. Sci., 58,
Darwin, Australia. J. Atmos. Oceanic Technol., 26, 915–926.
2107–2122. —, and —, 2002: Cloud condensation nuclei
Bruintjes, R. T., 1999: A review of cloud seeding experi- spect ra a nd pol luted a nd clea n clouds over
ments to enhance precipitation and some new pros- the Indian Ocean. J. Geophys. Res., 107, 8022,
pects. Bull. Amer. Meteor. Soc., 80, 805–820. doi:10.1029/2001JD000829.
Bureau of Meteorology, cited 2011: Drought state- —, and S. Mishra, 2007: Relationships between
ment - Issued 4th December, 2006: Drought in- CCN and cloud microphysics variations in clean
tensifies over eastern and southern Australia. maritime air. Geophys. Res. Lett., 34, L16804,
[Available online at w w w.bom.gov.au/climate doi:10.1029/2007GL030044.
/drought/archive/20061204.shtml.] —, and S. Noble, 2009: CCN and cloud droplet con-
Cifelli, R., S. W. Nesbitt, S. A. Rutledge, W. A. Petersen, centrations at a remote ocean site. Geophys. Res. Lett.,
and S. Yuter, 2007: Radar characteristics of precipita- 36, L13812, doi:10.1029/2009GL038465.
tion features in the EPIC and TEPPS regions of the Huggins, A. W., S. L. Kenyon, L. Warren, A. D. Peace,
east Pacific. Mon. Wea. Rev., 135, 1576–1595. S. P. Bilish, and M. J. Manton, 2008: The snowy
88 | January 2012precipitation enhancement research project: A de- Pósfai, M., and P. R. Buseck, 2010: Nature and climate scription and preliminary results. J. Wea. Modif., effects of individual tropospheric aerosol particles. 40, 28–53. Annu. Rev. Earth Planet. Sci., 38, 17–43. Hussein, T., M. Dal Maso, T. Petaga, I. K. Koponen, Protat, A., and I. Zawadzki, 2000: Optimization of P. Paatero, P. P. Aalto, K. Hameri, and M. Kulmala, dynamic retrievals from a multiple-Doppler radar 2005: Evaluation of an automatic algorithm for fit- network. J. Atmos. Oceanic Technol., 17, 753–760. ting the particle number size distributions. Boreal Rauber, R. M., and Coauthors, 2007: Rain in shallow Environ. Res., 10, 337–355. cumulus over the ocean: The RICO campaign. Bull. Keenan, T., J. W. Wilson, J. Lutz, K. Glasson, and P. T. Amer. Meteor. Soc., 88, 1912–1928. May, 2007: Rationale and use of the CP2 testbed in Ray, P. S., C. L. Ziegler, W. Bumgarner, and R. J. Serafin, Brisbane, Australia. Preprints, 33rd Conf. on Radar 1980: Single- and multiple-Doppler radar obser- Meteorology, Cairns, QLD, Australia, Amer. Meteor. vations of tornadic storms. Mon. Wea. Rev., 108, Soc., 12B.1. [Available online at http://ams.confex 1607–1625. .com/ams/33Radar/techprogram/paper_123253 Reisin, T., S. Tzivion, and Z. Levin, 1996: Seeding con- .htm.] vective clouds with ice nuclei or hygroscopic par- Knight, C. A., J. Vivekanadan, and S. G. Lasher-Trapp, ticles: A numerical study using a model with detailed 2002: First radar echoes and the early ZDR history of microphysics. J. Appl. Meteor., 35, 1416–1434. Florida cumulus. J. Atmos. Sci., 59, 1454–1472. Rosenfeld, D., U. Lohmann, G. B. Raga, C. D. O’Dowd, —, L. J. Miller, and R. A. Rilling, 2008: Aspects of M. Kulmala, S. Fuzzi, A. Reissell, and M. O. Andreae, precipitation development in trade wind cumu- 2008: Flood or drought: How do aerosols affect pre- lus revealed by differential reflectivity at S band. cipitation? Science, 321, 1309–1313. J. Atmos. Sci., 65, 2563–2580. Ryan, B. F., and W. D. King, 1997: A critical review of Kraus, E. B., and P. Squires, 1947: Experiments on the the Australian cloud seeding experience. Bull. Amer. stimulation of clouds to produce rain. Nature, 159, Meteor. Soc., 78, 239–254. 489–491. Scialom, G., and Y. Lemaître, 1990: A new analysis for Laird, N. F., H. T. Ochs III, R. M. Rauber, and L. J. Miller, the retrieval of three-dimensional mesoscale wind 2000: Initial precipitation formation in warm Florida fields from multiple Doppler radar. J. Atmos. Oceanic cumulus. J. Atmos. Sci., 57, 3740–3751. Technol., 7, 640–665. Mather, G. K., D. E. Terblanche, F. E. Steffens, and Silverman, B. A., 2003: A critical assessment of hy- L. Fletcher, 1997: Results of the South African cloud groscopic seeding of convective clouds for rain- seeding experiments using hygroscopic f lares. fall enhancement. Bull. Amer. Meteor. Soc., 84, J. Appl. Meteor., 36, 1433–1447. 1219–1230. May, P. T., V. N. Bringi, and M. Thurai, 2011: Do Smith, E. J., E. E. Adderly, and D. T. Walsh, 1963: we observe aerosol impacts on DSDs in strongly Cloud-seeding experiment in the snowy mountains, forced tropical thunderstorms? J. Atmos. Sci., 68, Australia. J. Appl. Meteor., 2, 324–332. 1902–1910. —, L. G. Veitch, D. E. Shaw, and A. J. Miller, 1979: Mohr, C. G., and R. L. Vaughan, 1979: An economical A cloud-seeding experiment in Tasmania. J. Appl. procedure for Cartesian interpolation and display of Meteor., 18, 804–815. reflectivity factor data in three-dimensional space. Sorooshian, A., G. Feingold, M. D. Lebsock, H. Jiang, and J. Appl. Meteor., 18, 661–670. G. L. Stephens, 2009: On the precipitation suscepti- Morrison, A. E., S. T. Siems, M. J. Manton, and bility of clouds to aerosol perturbations. Geophys. A. Nazarov, 2009: On the analysis of a cloud seeding Res. Lett., 36, L13803, doi:10.1029/2009GL038993. dataset over Tasmania. J. Appl. Meteor. Climatol., Squires, P., 1958: The microstructure and colloidal sta- 48, 1267–1280. bility of warm clouds. Tellus, 10, 256–271. —, —, —, and —, 2010: A modeling case study Stephens, G. L., and N. B. Wood, 2007: Properties of of mixed-phase clouds over the Southern Ocean and tropical convection observed by millimeter-wave Tasmania. Mon. Wea. Rev., 138, 839–862. radar systems. Mon. Wea. Rev., 135, 821–842. Niemi, J. V., S. Saarikoski, H. Tervahattu, T. Mkel, Stevens, B., and G. Feingold, 2009: Untangling aerosol R. Hillamo, H. Vehkamäki, L. Sogacheva, and effects on clouds and precipitation in a buffered M. Kulama, 2006: Changes in background aerosol system. Nature, 461, 607–613. composition in Finland during polluted and clean pe- Tessendorf, S. A., and Coauthors, 2010: Overview of riods studied by TEM/EDX individual particle analy- the Queensland Cloud Seeding Research Program. sis. Atmos. Chem. Phys. Discuss., 6, 6753–6799. J. Wea. Modif., 42, 33–48. AMERICAN METEOROLOGICAL SOCIETY January 2012 | 89
You can also read