Linking human male vocal parameters to perceptions, body morphology, strength and hormonal profiles in contexts of sexual selection - Nature
←
→
Page content transcription
If your browser does not render page correctly, please read the page content below
www.nature.com/scientificreports
OPEN Linking human male vocal
parameters to perceptions,
body morphology, strength
and hormonal profiles in contexts
of sexual selection
Christoph Schild1, Toe Aung2, Tobias L. Kordsmeyer3, Rodrigo A. Cardenas4,
David A. Puts2,5* & Lars Penke3,5*
Sexual selection appears to have shaped the acoustic signals of diverse species, including humans.
Deep, resonant vocalizations in particular may function in attracting mates and/or intimidating same-
sex competitors. Evidence for these adaptive functions in human males derives predominantly from
perception studies in which vocal acoustic parameters were manipulated using specialist software.
This approach affords tight experimental control but provides little ecological validity, especially when
the target acoustic parameters vary naturally with other parameters. Furthermore, such experimental
studies provide no information about what acoustic variables indicate about the speaker—that is,
why attention to vocal cues may be favored in intrasexual and intersexual contexts. Using voice
recordings with high ecological validity from 160 male speakers and biomarkers of condition, including
baseline cortisol and testosterone levels, body morphology and strength, we tested a series of pre-
registered hypotheses relating to both perceptions and underlying condition of the speaker. We found
negative curvilinear and negative linear relationships between male fundamental frequency (fo) and
female perceptions of attractiveness and male perceptions of dominance. In addition, cortisol and
testosterone negatively interacted in predicting fo, and strength and measures of body size negatively
predicted formant frequencies (Pf). Meta-analyses of the present results and those from two previous
samples confirmed that fonegatively predicted testosterone only among men with lower cortisol
levels. This research offers empirical evidence of possible evolutionary functions for attention to men’s
vocal characteristics in contexts of sexual selection.
Acoustic signals comprise a fundamental component of mating competition1–4 and are highly sexually dimorphic
in many species, including many anthropoid primates. Humans in particular exhibit strong sexual dimorphism
in acoustic signals5, such that the distributions of male and female vocal parameters related to pitch and timbre
barely overlap6.
From hearing the voice alone, humans can assess diverse salient social characteristics of a speaker, such bio-
logical sex, age and physical s trength7–9. Many of these evaluations rely on inter-individual variation in specific
sets of vocal parameters, including fundamental frequency and formant frequencies5,10. Fundamental frequency
(fo) is the rate of vocal fold vibration during phonation and influences perceptions of pitch. Formant frequen-
cies are resonant frequencies determined by the length and shape of the vocal tract and influence perceptions
of vocal timbre.
1
Department of Psychology, University of Copenhagen, Øster Farimagsgade 2A, 1353 Copenhagen,
Denmark. 2Department of Anthropology and Center for Brain, Behavior and Cognition, Pennsylvania State
University, University Park, PA 16802, USA. 3Department of Psychology and Leibniz ScienceCampus Primate
Cognition, University of Goettingen, Gosslerstrasse 14, 37073 Göttingen, Germany. 4Department of Psychology,
Pennsylvania State University, University Park, PA 16802, USA. 5These authors jointly supervised this work: David
A. Puts and Lars Penke. *email: dap27@psu.edu; lpenke@uni‑goettingen.de
Scientific Reports | (2020) 10:21296 | https://doi.org/10.1038/s41598-020-77940-z 1
Vol.:(0123456789)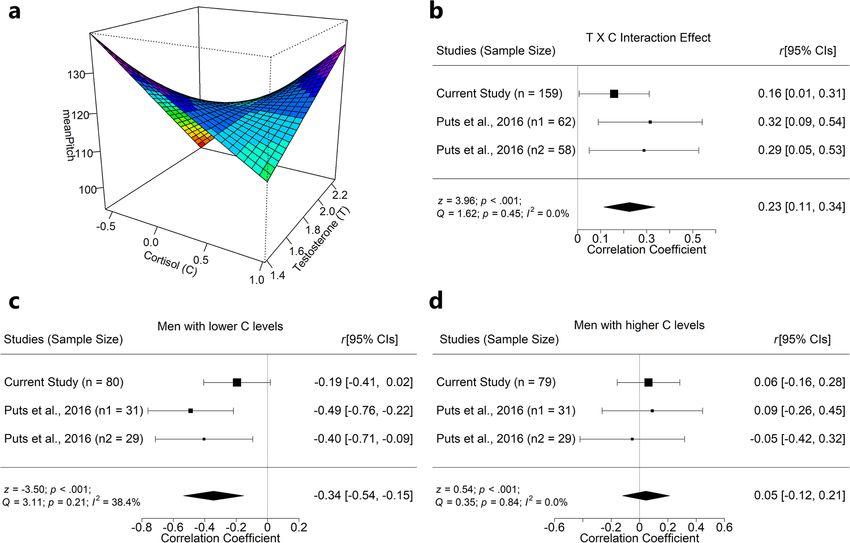
www.nature.com/scientificreports/
Fundamental and formant frequencies are some of the most sexually dimorphic characteristics in humans,
suggesting a past influence of sexual s election11. Indeed, lower male fo predicts greater perceptions of attractive-
ness, dominance and m asculinity12–14, as well as greater mating s uccess14,15 (but s ee16 for a null finding) and
reproductive success15,17 (see also18,19). Likewise, male formant frequencies influence perceptions of attractive-
ness, dominance and masculinity12,13,20,21.
Despite the abundance of evidence linking acoustic parameters to perceptions relevant in mating competi-
tion, a fundamental question remains: Why have humans evolved to attend to these parameters? Costly signaling
theory (originally proposed b y22,23, but see24) which concerns the transmission of reliable information between
signalers and receivers, is a useful theoretical tool to answer this question and helps us understand the mainte-
nance of signal honesty via receiver-independent (production costs, developmental costs, maintenance costs)
and receiver-dependent costs (e.g., retaliation costs, vulnerability costs; s ee25,26 for reviews). Recently, some
authors27,28 have pointed out weak receiver-independent costs associated with men’s fo and concluded that men’s
fo does not signal formidability. O thers29–31 suggest that men’s fo is likely to be partly honest.
Although fo influences perceptions of physical dominance, it correlates only weakly with physical strength6,9,32
(see29 for a meta-analysis) and body height33. Past research also points to associations with hormonal profiles in
males: fo decreases strongly during, and higher circulating testosterone levels predict lower fo in men11,34,35 (see29
for a meta-analysis). Further, the relationship between fo and testosterone was found to be stronger in men with
lower cortisol levels5, a pattern that has been associated with immunocompetence36. Another study37 that utilized
salivary immunoglobulin-A (sIgA; a marker of mucosal immunity) as a measure of immunocompetence reported
that sIgA was negatively correlated with fo. In a similar vein, listeners assigned higher dominance ratings, but not
higher health ratings, to speakers with higher self-reported health38. Overall, these studies suggest, that fo may be
a partly honest signal of condition29–31. Formants are closely tied to vocal tract length and are therefore indirect,
albeit weak, correlates of body size in humans33,39,40. Additionally, a recent study showed significant correlations
with other somatometric measures, such as body mass index and hip circumference41. However, links between
formants and physical strength are equivocal6,32.
In addition to the paucity of evidence concerning the information content of male voices, there are also sig-
nificant gaps in knowledge concerning how men’s voices may influence social perceptions. For example, because
most prior studies manipulated only one acoustic parameter at a time in experimental settings, the relative impor-
tance of different parameters in forming social judgments have not been well characterized. Prior research also
has primarily investigated linear relationships (Table 1), and thus it remains largely unknown whether acoustic
parameters have curvilinear effects on perceptions, which have been predicted in some c ases11. Vocal stimuli
in most prior work are also unnaturally invariant in content and motivation, with all speakers uttering a series
of vowels, counting, or speaking precisely the same, often socially irrelevant, phrase; hence, the generalizability
and external validity of such results depend on whether the effects they reveal persist in natural speech13. Finally,
only a few, mostly low-powered studies (Table 1) have simultaneously shown that these acoustic parameters are
related to both perceptions of attractiveness and/or dominance on the one hand and indirect measures of mate
quality and formidability on the other.
Given the fundamental gaps in knowledge outlined above, we conducted a preregistered study (preregis-
tration: https://osf.io/nrmpf/) to examine (1) how vocal parameters are utilized in assessing dominance and
attractiveness, and (2) why using those parameters for judgments could be adaptive insofar as they are associ-
ated with indirect measures of mate quality and/or formidability. In contrast to most studies on perceived vocal
attractiveness and dominance, which have used standardized voice samples (i.e. counting, vowels or standardized
passages), more natural stimuli were used to augment external validity. Importantly, we use a relatively large
(N = 160) and rich dataset, which allows relationships between vocal parameters, baseline cortisol and testos-
terone levels, body morphology and strength to be tested in a single sample.
Perceptions of attractiveness and dominance. Because deep male voices may display social power29,
threat potential11, and predict greater a nticipated42,86,87 and a ctual42,88 sexual infidelity, there may be costs as well
as benefits to mating with males with masculine v oices11. Further, some studies suggest that the link between
mean fo and attractiveness is weaker and rather curvilinear: Very low-pitched voices are not seen as more attrac-
tive and sometimes even less attractive as low-pitched voices11,64. In line with the context-dependent nature of
costs and benefits and reports from previous literature, we therefore predicted negative linear5 and negative
quadratic11 relationships between attractiveness ratings and both mean fo (H1) and formant position (Pf) (H2).
Pf is a measure of formant structure, calculated as the average standardized formant value for the first n (usually
four) formants6.
Masculine voices (i.e. low fo and Pf) have been found to be preferred by females to a greater extent in short-
term compared to long-term relationship c ontexts14,89. This might reflect an adaptive trade-off strategy in which
a mate’s genetic fitness, putatively indicated by masculine traits, is granted greater value in short-term contexts,
whereas his expected investment and fidelity are valued more in long-term c ontexts89,90. Consequently, we pre-
dicted stronger relationships between short-term, compared to long-term, attractiveness ratings and both mean
fo (H3) and Pf (H4).
It has been hypothesized that deep voices display threat p otential6; hence, we predicted negative relationships
between dominance ratings and both mean fo (H5) and Pf (H6). According to the source-filter theory, fo and
Pf are theoretically distinct91. They are also only weakly correlated10 and seem to convey different information
about a male s peaker6. Accordingly, we predicted fo and Pf to be independent predictors of both attractiveness
(H7) and dominance (H8) ratings.
Scientific Reports | (2020) 10:21296 | https://doi.org/10.1038/s41598-020-77940-z 2
Vol:.(1234567890)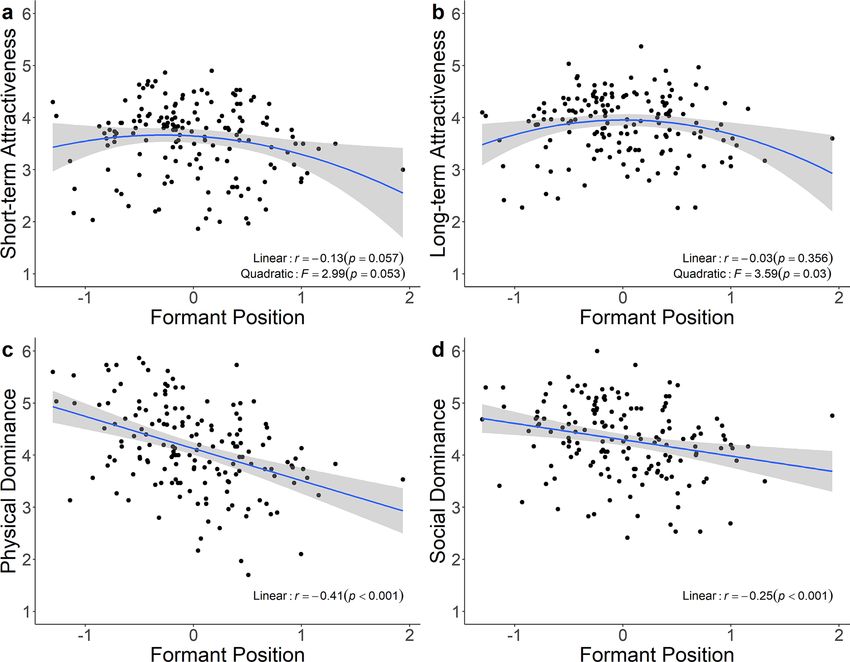
www.nature.com/scientificreports/
No Studies Rater (n) Vocalizers (n) Perceptions evaluated Vocalizer’s condition Natural voices Cuvilinear tested
1 Schild et al.42 95 181 Trus Trus + +
2 issing43
Collins and M 30 30 Att; Age Size +
3 Puts et al.5 1126 548 Att; Dom T; C +
4 Raine et al.44 150 61 Size Size +
5 Raine et al.45 135 61 Size Size +
6 Rendall et al.46 163 68 Size Size +
7 Rosenfield et al.15 84 4 Att; Pres; Dom MS +
8 Šebesta et al.47 62 93 Att Size +
9 Šebesta et al.48 63 40 Dom Size +
10 Simmons et al.49 30 44 Att; Mas Semen +
11 Valentova et al.50 203 152 Att Size +
12 Armstrong et al.27 224 183 Dom; Size Size +
13 Feinberg et al.51 991 123 Age; Att; Fem + +
14 Babel et al.52 30 60 Att +
15 Gregory et al.53 118 60 Com Qual +
16 Hodges-Simeon et al.13 330 111 Att; Dom +
17 Knowles et al.54 180 32 Cop +
Michalsky and
18 20 20 Att; Like +
Schoormann55
56
19 Pisanski and Rendall 129 89 Size; Att; Mas; Fem +
20 Pisanski et al.57 68 20 Size; Att; Mas; Fem +
21 Sorokowski et al.58 39 51 Comp; Auth +
22 Valentova et al.59 84 30 Att; Mas +
23 Hill et al.60 1349 471 Att Fac Sym +
24 uts61
Wolff and P 376 117 Dom Size; T; Agg +
25 Shirazi et al.62 128 6 Att E; P
26 Re et al.63 19 64 Att; Mas; Fem +
27 Saxton et al.64 40 6 Att; Dom +
28 Apicella and Feinberg65 88 10 Att
Borkowska and
29 473 58 Att; Dom
Pawlowski66
67
30 Bruckert et al. 64 55 Att
31 Feinberg et al.68 68 5 Att; Dom
32 Feinberg et al.69 26 8 Att; Dom
33 Feinberg et al.70 1759 6 Pref
34 Feinberg et al.71 83 6 Att
35 Fraccaro et al.72 179 8 Att; Dom
36 Hughes et al.73 40 40 Att
37 Jones et al.74 800 12 Att; Dom
38 Klofstad et al.75 382 27 Com; Size; Trus
39 Leaderbrand et al.76 48 4 Att
40 O’Connor et al.77 138 6 Att; Inv
41 Puts et al.78 86 111 Dom
42 Puts et al.20 42 30 Dom
43 Puts et al.79 109 4 Att; Flir
44 Puts14 142 111 Att
45 Riding et al.80 54 9 Att
46 Suire et al.81 225 58 Att
47 Tigue et al.82 165 15 Int; Prow; Vote
48 Vukovic et al.83 70 6 Att; Dom; Trus
49 Watkins et al.84 50 10 Dom
50 Xu et al.85 42 2 Att; Emo
Table 1. A non-exhaustive list of studies (n = 50) on human voice perception. A list of 50 studies that relate
to mating-relevant perceptions of human voice was obtained via Google Scholar search. Most studies that
investigate human voice perceptions tested only on perceptions (n = 35), used manipulated voice stimuli
(n = 28), and tested linear relationships (n = 44). Agg = Aggressiveness; Att = Attractiveness; C = Cortisol;
Com = Competent; Com Qual = Communication Quality; Cop = Cooperativeness; Dom = Dominance;
Emo = Emotions; E = Estradiol; Fac Sym = Facial Symmetry; Flir = Flirtatiousness; Fem = Femininity;
Int = Integrity; Inv = Investing; Mas = Masculinity; MS = Mating Success; P = Progesterone; Pref = Preference;
Pres = Prestige; Prow = Prowess; T = Testosterone; Trus = Trustworthiness; + = Presence.
Scientific Reports | (2020) 10:21296 | https://doi.org/10.1038/s41598-020-77940-z 3
Vol.:(0123456789)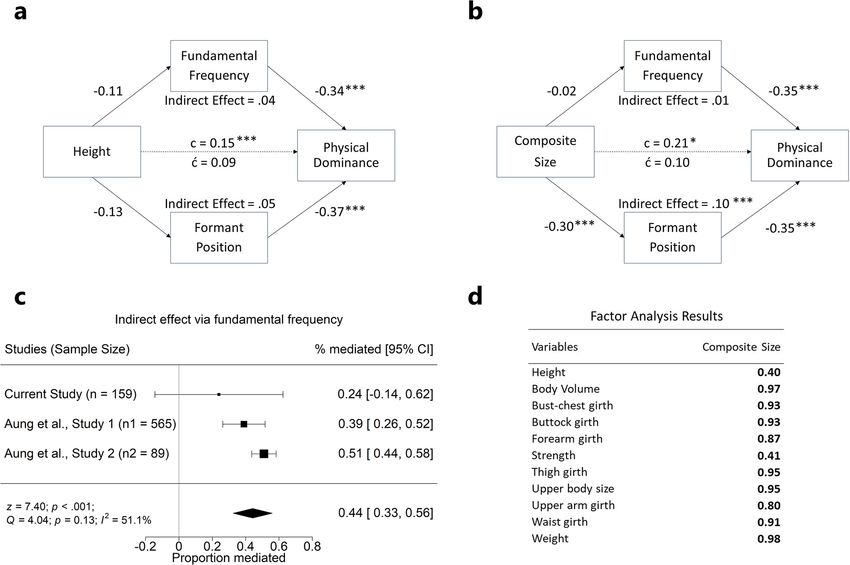
www.nature.com/scientificreports/
Indirect measures of mate quality and formidability. Previous studies34,35 linked lower fo to higher
circulating testosterone levels, and more recently this relationship was found to be stronger in men with lower
cortisol levels5, a result seemingly consistent with the stress-linked immunocompetence handicap hypothesis
that fo honestly signals a speaker’s physical condition36. We therefore predicted a negative relationship between
mean fo and testosterone (H9) and predicted that this relationship would be attenuated by high baseline cortisol
(H10).
Formants have been shown to relate moderately to body height, a phenotype that is relevant in both intra- and
intersexual selective contexts92. We therefore predicted a negative relationship between Pf and body height (H11).
Exploratory analyses. In addition to these preregistered predictions, we conducted the following explora-
tory analyses. First, we examined how vocal parameters related to physical strength and body morphology.
Second, we compared whether distinct parameters are used as cues for ratings on social dominance (i.e. being
respected) and physical dominance (i.e. fighting ability), as they describe separate aspects of social e valuation93.
Third, we explored whether jitter and shimmer influence attractiveness and dominance perceptions, as these
acoustic parameters seem to provide information on male body shape. Jitter and shimmer quantify cycle-to-
cycle variation in fo and amplitude, respectively, and influence perceptions of voice roughness. Fourth, we con-
ducted three mediation analyses: (1) a moderated mediation model to test whether fo mediates the relationship
between vocalizers’ testosterone levels (condition) and dominance ratings (perception), and whether this media-
tion is further moderated by cortisol, (2) a mediation model to test whether fo and Pf, mediate the relationship
between vocalizers’ height and dominance ratings, and 3) a mediation model to test whether fo and Pf, mediate
the relationship between vocalizers’ composite measure of size (extracted via factor analysis with varimax rota-
tion) and dominance ratings. We conducted a separate mediation model for height, in addition to its inclusion
in the factor analysis, as height has been shown to reflect good nutrition and low stress during development, as
well as genetic predictors of immune function94. Additionally, a recent study31 reported that fo mediated the rela-
tionship between height and physical dominance ratings in two separate samples. Finally, we conducted three
meta-analyses to test: (1) the mediating effect of fo between height and dominance ratings, (2) whether cortisol
and testosterone negatively interact to predict male fo, and 3) whether fo negatively predicts testosterone levels,
especially among men with lower cortisol levels.
Design and methods
Participants. One hundred sixty-five heterosexual males participated in a study on testosterone reactivity
and personality state changes, which was conducted at the University of Goettingen, Germany (for details, see95).
Each participant provided a standardized video recording, saliva samples, body morphology measurements, and
handgrip as well as upper-body strength. Data from five individuals could not be used due to technical issues
during video recording or because consent for further use of the video material was not given, resulting in a final
sample of 160 males (mean age = 24.28, SD = 3.25 years). All participants were at least 18 years old. In a sensitivity
power analysis using G*Power96 this sample had sufficient power (> 0.80) to detect an effect size of r = + / − 0.20,
assuming one-tailed alpha = 0.05. All procedures were in accordance with relevant guidelines and regulations,
and received ethics approval from the local Ethics Committees at the University of Goettingen and the Pennsyl-
vania State University. Informed consent was obtained from all subjects.
Voice recordings. Standardized video recordings were obtained using a Full-HD camera and Line6 Modell
XD-V75 microphones. The participants were instructed to describe what is great about themselves, choosing
three domains such as “friendship” or “success in studies/job” from a list of overall eight domains (for details,
see95). The video clips were cut to a length of 5 s, beginning 5 s after participants had begun to speak, and voice
clips were extracted. Five seconds were chosen because vocal parameters usually show strong correlations across
different recordings, independent of length and c ontent88,97, and both attractiveness and dominance ratings are
stable and highly correlated across different r ecordings6,97. Further, the use of relatively brief voice clips allowed
us to avoid rater fatigue. The voice clips were analyzed using PRAAT s oftware98 (Version 6.0.36). The measures
obtained were mean fo, the first four formant frequencies (F1–F4), four measures of jitter and five measures
of shimmer. Because both jitter (all rs > 0.83, ps < 0.001) and shimmer measures (all rs > 0.56, ps < 0.001) were
highly intercorrelated, a standardized mean was calculated for each perturbation measure10. Additionally, Pf was
computed for the first four formants6. Formants were measured at each glottal pulse using automated detection
in PRAAT. Formant measurement across standardized speech samples produces highly similar results to meas-
urement of individual vowels and averaging across these measurements6.
It should be noted that different methods of measuring formant structure are used across studies. Formant
dispersion (Df), for example, describes the distance between the highest (e.g., F4) and lowest formants (e.g., F1)
measured39. While Df is commonly used, it has also been criticized especially for not using information about the
middle formants (e.g., F2 and F3). Further, although Df is theoretically dependent on body height, other meas-
ures of formant structure have shown stronger relations with body height 6,33. One of these measures is formant
position (Pf) which describes the average standardized formant value for the first n formants (e.g., F1–F4) and
thus utilizes information of all formants measured6. Given these advantages of Pf over Df, Pf was chosen as the
relevant measure for formant structure in this study. For further discussion, see 6.
Saliva samples. Based on previous s tudies99,100, we controlled for circadian variation in participants’ hor-
monal reactivity by collecting saliva samples only between 2 and 6 pm. Approximately 12–15 min after each
participant arrived at the lab, he rinsed his mouth with water and provided at least 2 ml of saliva via passive
drool through a straw, just prior to the video recording. The collected samples were immediately transported
Scientific Reports | (2020) 10:21296 | https://doi.org/10.1038/s41598-020-77940-z 4
Vol:.(1234567890)www.nature.com/scientificreports/
to an ultra-low temperature freezer (− 80 °C), where salivary testosterone is expected to be stable for at least 36
months101. At the end of the data collection period (see95 for details), saliva samples were shipped on dry ice to
the Technical University of Dresden and analyzed using chemiluminescence-immuno-assays with high sensitiv-
ity (IBL International, Hamburg, Germany). The intra- and inter-assay coefficients (CVs) for cortisol are below
8% and for testosterone below 11%. Basal cortisol and testosterone outliers were identified and winsorized to 3
SDs102. To correct for skewness, we log10-transformed both variables.
Body morphology and strength measurements. As this procedure was also reported in103, proce-
dural and methodological descriptions overlap. Participants were scanned three times using a Vitus Smart XXL
3D body scanner, running AnthroScan software (both Human Solutions GmbH, Kaiserslautern, Germany).
Participants wore standardized tight underwear and were instructed to stand upright with legs hip-width apart,
arms extended and held slightly away from the body, making a fist with thumbs showing forward, the head posi-
tioned in accordance with the Frankfort Horizontal, and to breathe normally during the scanning process. Using
AnthroScan’s automatic measures (according to ISO 20685), we extracted muscularity-relevant body dimen-
sions from the body scan: body volume, bust-chest girth, buttock girth, chest-to-hip ratio (CHR), forearm girth,
lower limb (“leg”) length-to-height ratio (LHR), shoulder-to-hip ratio (SHR), thigh girth, upper arm girth, waist
girth, waist-to-chest ratio (WCR), and waist-to-hip ratio (WHR). An aggregate indicator of upper body size was
calculated by averaging z-standardized shoulder width, bust-chest girth, and upper arm g irth104. Weight (in kg)
was measured as part of the first body scanning process with the integrated SECA 635 scale (SECA, Hamburg,
Germany). Body height (in cm) was measured twice using a stadiometer while participants stood barefoot, and
the two values were averaged (ICC = 0.996). Body-mass index (BMI) was calculated from average weight and
height measures (kg/cm2). Upper body and handgrip strength were measured using a hand dynamometer (Sae-
han SH5001). Each measurement was taken three times, starting with handgrip strength, for which participants
were asked to use their dominant hand (88.2% used their right). As i n105, upper body strength was measured by
having participants hold the dynamometer in front of their chest with both hands and press both handles toward
the middle as strongly as possible. A composite strength measure was formed by averaging the maximum values
for each of the three measures of handgrip and upper body strength (ICCs: 0.81 and 0.64, respectively).
Attractiveness and dominance ratings. In exchange for course credit, 120 men (mean age = 19.82,
SD = 2.71 years) and 120 women (mean age = 19.90, SD = 3.80 years) participated in a rating study on short- and
long-term attractiveness as well as social and physical dominance at the Pennsylvania State University. All raters
were at least 18 years old. Raters were equipped with Sennheiser HD 280 Professional Headphones and seated
at private workstations. Raters provided demographic data on age, gender, sexual orientation, and relationship
status. To control for the influence of semantic content, we also asked raters to indicate their German language
comprehension (“How well do you understand German?”) on a 7-point Likert scale from 0 (“Not at All”) to 6
(“Fluent”). Below, we report results with all participants, but excluding raters score 2 or higher (n = 26) does not
change results. Raters were then randomly assigned to one of four rating experiments, each asking for percep-
tions of either short-term attractiveness, long-term attractiveness, social dominance, or physical dominance
of 160 randomly assigned voice files (for specific items see Appendix A). The voice file pool contained 320
voice samples that were taken from the 160 former targets before and after the competitive setting95. Raters
always rated both files of a target, but both recordings of the same individual were separated by at least ten
other voice samples. However, only ratings of the recordings before the competition were used in the present
study. To ensure that each file was rated 15 times by each sex, a file was removed from the pool of remaining
files to be rated once this criterion was met. The only exception was long-term attractiveness, where one male
rater dropped out because of technical issues. Because correlations between male and female ratings were high
(all rs > 0.70, ps < 0.001), and intraclass correlations within each rating condition were at least satisfactory (all
ICCs > 0.76, ps < 0.001), mean scores were calculated.
Results
For tests of directed hypothesis one-tailed tests were used, and for exploratory tests two-tailed tests were used.
Analyses were conducted using R 106.
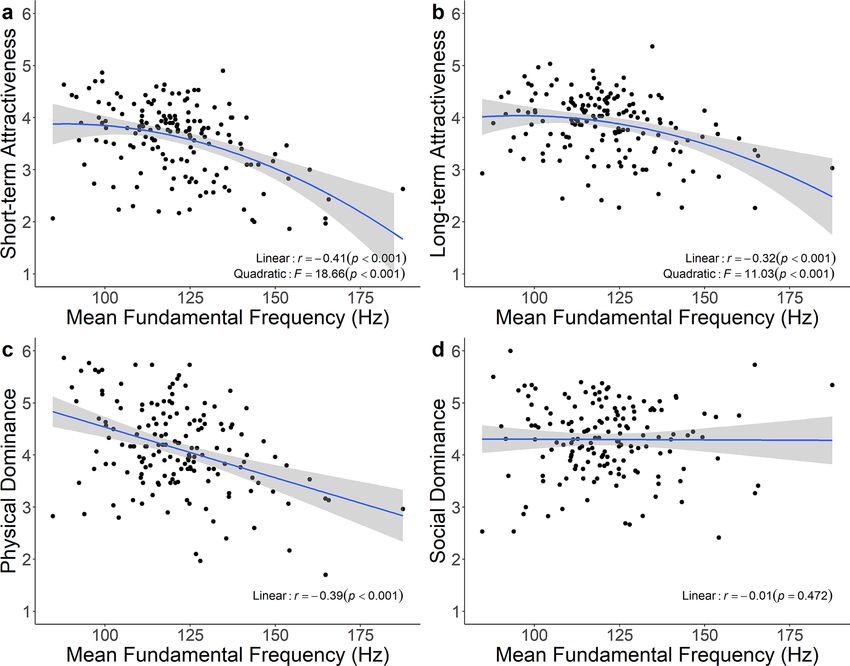
Perceptions of Attractiveness and Dominance. Attractiveness H1) Predictions on negative linear and
negative quadratic relationships between attractiveness ratings and mean fo were supported. We found that fo
negatively linearly predicted both short-term and long-term attractiveness. Furthermore, we found significant
negatively quadratic (inverted U-shaped) relationships between fo and both short-term (Fig. 1a) and long-term
attractiveness (Fig. 1b). Comparisons of linear and curvilinear models showed that the relationship between fo
and short-term attractiveness was significantly better described by the curvilinear model (F2,157 = 4.38, p = 0.038),
while there was no significant difference between models for long-term attractiveness (F2,157 = 3.76, p = 0.054).
H2) Predictions of negative linear and negative quadratic relationships between attractiveness ratings and Pf
were only partially supported. We found no significant linear relationships between Pf and either short-term or
long-term attractiveness. While the non-linear relationship of Pf and short-term attractiveness was not significant
(Fig. 2a), a significant negative quadratic relationship between Pf and long-term attractiveness emerged (Fig. 2b).
H3) The prediction of a stronger relationship between mean fo and short-term, compared to long-term attrac-
tiveness ratings was supported. Although both attractiveness ratings were highly correlated (r = 0.82, p < 0.001),
the relationship between fo and short-term attractiveness was significantly stronger (z = − 2.06, p = 0.020) when
comparing dependent correlation c oefficients108.
Scientific Reports | (2020) 10:21296 | https://doi.org/10.1038/s41598-020-77940-z 5
Vol.:(0123456789)www.nature.com/scientificreports/
Figure 1. Relationships between male fundamental frequency (fo) and perceptions. We observed negative
curvilinear relationships between fo and (a) short-term attractiveness and (b) long-term attractiveness, (c) a
negative linear relationship with physical dominance ratings, and (d) a non-significant relationship with social
dominance ratings. All panels were plotted using the “ggplot2” package107.
H4) The prediction of a stronger relationship between Pf and short-term, compared to long-term attractive-
ness ratings was supported; the relationship between Pf and short-term attractiveness was significantly stronger
(z = − 2.00, p = 0.023) when comparing dependent correlation coefficients.
Dominance H5) The prediction of a negative relationship between dominance ratings and mean fo was par-
tially supported: fo negatively predicted physical dominance (Fig. 1c), but not social dominance ratings (Fig. 1d).
H6) The prediction of a negative relationship between dominance ratings and Pf was supported. Pf negatively
predicted perceptions of both physical (Fig. 2c) and social (Fig. 2d) dominance ratings.
Independent Predictors H7) The prediction that mean fo and Pf are independent predictors of attractiveness
ratings was partially supported. When fo and Pf were included in a multiple regression (F2,157 = 16.78, p < 0.001,
R2 = 0.17), fo negatively predicted short-term attractiveness (β = − 0.40, p < 0.001), but Pf did not (β = − 0.08,
p = 0.132). Similarly, fo negatively predicted long-term attractiveness (β = − 0.32, p < 0.001) in a multiple regres-
sion (F2,157 = 8.94, p < 0.001, R2 = 0.09), but Pf did not (β = 0.01, p = 0.471). Because the curvilinear relationship
between long-term attractiveness and Pf was significant, we investigated whether the linear term of fo and the
quadratic term of Pf were independent predictors of long-term attractiveness. Indeed, adding the quadratic term
of Pf explained significantly more variance in long-term attractiveness ratings (F2,157 = 3.15, p = 0.045), with both
predictors remaining significant. H8) The prediction that mean fo and Pf are independent predictors of domi-
nance ratings was partially supported. Multiple regressions with fo and Pf as predictors (F2,157 = 31.73, p < 0.001,
R2 = 0.28) showed that both independently predicted physical dominance (β = − 0.35, p < 0.001 for fo; β = − 0.37,
p < 0.001 for Pf). For social dominance (F2,157 = 5.12, p = 0.007, R2 = 0.05), Pf was a significant predictor (β = − 0.25,
p < 0.001), but fo was not (β = 0.02, p = 0.391).
Indirect measures of mate quality and formidability. Testosterone, cortisol and fo Testosterone levels
were not significantly related to fo (r = − 0.07, p = 0.18). However, cortisol and testosterone interacted in predict-
ing fo (β = 0.16, p = 0.024) (Fig. 3a). While these results do not support H9) a negative relationship between mean
fo and testosterone, they supported H10) a negative relationship between mean fo and testosterone, which is
attenuated by high baseline cortisol.
Body Morphology and Pf A significant relationship between Pf and body height was found (r = − 0.13,
p = 0.046), supporting H11).
Scientific Reports | (2020) 10:21296 | https://doi.org/10.1038/s41598-020-77940-z 6
Vol:.(1234567890)www.nature.com/scientificreports/
Figure 2. Relationships between male formant position (Pf) and perceptions. We observed negative curvilinear
relationships between Pf and (a) short-term attractiveness and (b) long-term attractiveness, (c) a negative linear
relationship with physical dominance ratings, and (d) social dominance ratings. All panels were plotted using
the “ggplot2” package107.
Exploratory analyses. Strength and Pf Additional exploratory analyses showed significant negative rela-
tionships between Pf and strength (r = − 0.25, p = 0.002). Further, Pf was significantly correlated with multiple
body morphology measures related to volume and mass (Table 2).
Perturbation measures, vocal perception and target parameters Pearson correlations showed significant nega-
tive relationships between shimmer and both social (r = − 0.31, p < 0.001) and physical dominance (r = − 0.31,
p < 0.001). No significant relationships were found between shimmer and short-term (r = − 0.14, p = 0.076) or
long-term attractiveness (r = − 0.12, p = 0.122). Jitter showed no significant relationship to any of the four ratings
(all rs 0.16). Moreover, the only significant relationship between perturbation measures and any
of the target parameters was a significant negative correlation between shimmer and baseline cortisol (r = − 0.21,
p = 0.006). Multiple regressions with fo, Pf, jitter and shimmer as predictors and all ratings as outcomes can be
found in Tables S1–S4.
Mediation models In this analysis (model 7)111, cortisol level was recoded into two categories (median split),
and their interaction term was computed by multiplying testosterone levels with dichotomized cortisol category.
In this model, we found that testosterone levels (β = − 0.09; p = 0.321), cortisol category (β = 0.07; p = 0.367) and
their interaction term (β = 0.135; p = 0.119) did not predict fo. Adjusting for Pf (β = − 0.39; p < 0.001), testosterone
(β = 0.15; p = 0.023) and fo (β = − 0.34; p < 0.001) significantly predicted physical dominance ratings. The indirect
effect of testosterone on dominance ratings via fo was not significant (β = 0.06; p = 0.344), and no significant
indirect effect was observed among men with lower cortisol (β = 0.04; p = 0.227), or men with higher cortisol
levels (β = 0.02; p = 0.832).
We ran two additional mediation models: (1) fo and Pf were entered as mediators between height and physical
dominance ratings, (2) fo and Pf were entered as mediators between physical strength and dominance ratings.
A composite measure of physical size was extracted from a factor analysis (Fig. 4d) on the following body mor-
phology measures that significantly correlated with Pf (Table 2): height, weight, body volume, bust-chest girth,
buttock girth, forearm girth, physical strength, thigh girth, upper body size, upper arm girth, and waist girth. In
model 1, fo and Pf were entered as mediators between height and physical dominance ratings (Fig. 4a). Neither
fo nor Pf was a significant mediator. In model 2, we found evidence that Pf mediated the relationship between
physical strength condition and physical dominance ratings (Fig. 4b).
Scientific Reports | (2020) 10:21296 | https://doi.org/10.1038/s41598-020-77940-z 7
Vol.:(0123456789)www.nature.com/scientificreports/
Figure 3. Negative interaction between testosterone and cortisol on male fundamental frequency (fo). (a) A
combination of higher testosterone and lower cortisol levels predict lower male fo in this study. (b) A meta-
analysis on the interaction effects across studies, using a random-effects model yielded a significant overall
effect. Follow-up meta-analyses on simple slopes of (c) lower cortisol levels yielded a significant negative
relationship between testosterone and fo, and (d) higher cortisol levels yielded null results. Panel b was plotted
via the “rsm” package109, and meta-analyses were conducted via the “metaphor” package110.
Variable M SD r 95% CI
BMI 23.98 3.83 − .23*** [− .37, − .08]
Body volume 79.88 14.03 − .27*** [− .41, − .12]
Bust-chest girth 101.67 8.81 − .29*** [− .43, − .14]
Buttock girth 100.18 7.25 − .26*** [− .40, − .11]
Forearm girth 27.00 1.93 − .28*** [− .42, − .13]
Physical strength 48.40 7.99 − .25** [− .39, − .09]
Thigh girth 57.58 4.97 − .22** [− .37, − .07]
Upper body size 56.96 4.13 − .31*** [− .44, − .16]
Upper arm girth 30.20 2.67 − .25** [− .39, − .09]
Waist girth 84.63 9.86 − .24** [− .39, − .09]
Weight 78.68 13.96 − .27*** [− .41, − .12]
Chest-to-hip ratio (CHR) 1.02 0.05 − .13 [− .28, .02]
Waist-to-chest ratio (WCR) 1.21 0.07 .03 [− .13, .18]
Waist-to-hip ratio (WHR) 0.84 0.05 − .15 [− .30, .00]
Leg length-to-height ratio (LHR) 0.40 0.01 .12 [− .03, .27]
Shoulder-to-hip ratio (SHR) 0.39 0.02 .08 [− .08, .23]
Table 2. Means, standard deviations, and correlations of body morphology measures with Pf. M and SD are
used to represent mean and standard deviation. Values in square brackets indicate the confidence interval for
each correlation. ** indicates p < .01; *** indicates p < .001.
Scientific Reports | (2020) 10:21296 | https://doi.org/10.1038/s41598-020-77940-z 8
Vol:.(1234567890)www.nature.com/scientificreports/
Figure 4. Male fundamental frequency (fo) and formant position (Pf) as mediators of vocalizers’ condition
and perceivers’ ratings. (a) Although height predicted physical dominance ratings, fo and Pf did not mediate
this relationship. (b) Pf, but not fo, significantly mediated the relationship between composite size and physical
dominance ratings. (c) Although fo was not found to be a significant mediator between height and physical
dominance ratings in the present study, a meta-analysis using a random-effects model indicated a significant
mediating effect, with fo mediating 44% of the relationship between height and physical dominance. Proportion
mediated lower than 0 indicates the suppression effect of a mediating variable. In addition, the current study
used mean dominance ratings as the primary unit of analyses for calculating proportion mediated, whereas
Aung et al., Study 1 (n = 8,103 observations) and Study 2 (n = 6,586 observations) used individual ratings. (d)
Using the “nFactors” p ackage112 and rotated factors with Varimax method using the “psych” p ackage113, we
reduced the set of size related measures into one dimensional factor (n = 1), which we labelled “composite size”,
via principal axis factoring analysis. ***p < .001.
Meta-analyses We combined results of the present study with prior r esults31 in a meta-analysis to assess the
strength of the mediating effect of fo on the relationship between height and perceptions of physical dominance.
We found a significant overall mediating effect of fo, independent of Pf (Fig. 4c); fo mediated about 44% the rela-
tionship between height and physical dominance ratings.
We also conducted a meta-analysis of the interaction of testosterone and cortisol in predicting fo. For this anal-
ysis, the t-value and degrees of freedom (df) of the overall interaction effect were transformed into a correlation114.
The effect of the testosterone and cortisol interaction on male fo (k = 3, n = 279) was significant: r = 0.23, p = 0.001,
95% CI [0.12, 0.34] (Fig. 3b). In follow-up analyses, the relationship between testosterone and fo was significant
in men with low cortisol levels (Fig. 3c), but not in those with high cortisol levels (Fig. 3d).
Finally, Fig. 5 provides a lens model115 overview of the key relations between perceptions, vocal cues and
target parameters found in this study.
Discussion
We investigated the role of vocal parameters in perceptions of male attractiveness and found that fo was the
strongest predictor of short- and long-term attractiveness among the vocal parameters measured (Pf, shimmer,
and jitter). Consistent with previous s tudies11,64, the relationship between fo and male vocal attractiveness was
both negatively linear and negatively curvilinear, the latter suggesting that women’s voice preferences may reflect
a tradeoff between the potential genetic or other benefits versus the potential costs of mating with masculine
males6. Such costs may include lower investment and perhaps risk of interpersonal violence. Low male fo has
previously been linked to sexual infidelity42,88,89,116, and several lines of evidence suggest that phenotypic mas-
culinity—and vocal masculinity in particular—indicate threat potential not only to same-sex competitors but
also to potential mates. For example, images of male-on-female violence disrupted U.S. women’s preferences for
both masculine voices and f aces117, and Colombian women with perceptions of greater local domestic violence
Scientific Reports | (2020) 10:21296 | https://doi.org/10.1038/s41598-020-77940-z 9
Vol.:(0123456789)www.nature.com/scientificreports/
Figure 5. Lens model overview of the study results. Connections indicate significant relations (p < .05).
preferred less masculine male f aces118. In another study, Filipino women who were younger and rated themselves
as less attractive tended to prefer feminized male fo, again suggesting that women’s fo preferences may in part
reflect their own perceived vulnerability62. In our data, fo was a stronger predictor of short-term than long-term
attractiveness, once again supporting the notion of a mate choice trade-off in which putative indicators of genetic
fitness are prioritized in short-term contexts, and expected investment and fidelity are prioritized in long-term
contexts90.
Although Pf predicted strength and body morphology in our study and predicted ratings of attractiveness
in some prior s tudies13,21, it did not predict attractiveness in another large s ample5 and was unrelated to short-
term attractiveness and only weakly negatively curvilinearly linked to long-term attractiveness in the present
study. These lines of evidence suggest that the information provided by formant frequencies may be less relevant
to mate quality than that provided by fo. By contrast, shimmer negatively predicted both short- and long-term
attractiveness ratings. Shimmer is utilized to assess vocal quality in clinical contexts, such that pathological
voices show higher shimmer levels than those of healthy i ndividuals119–121; however, a composite of shimmer and
harmonics-to-noise ratio (which were highly correlated) showed no relationship to dominance or attractiveness
perception in a recent s tudy5. These divergent findings may be explained by the fact that the latter study used
voice samples in which male individuals read a standardized voice passage, while our study used more natural
but less standardized stimuli that might have been influenced more strongly by the speaker’s affective state.
Importantly, a Fisherian mate choice model via runaway sexual selection has also been suggested as a pos-
sible driver favoring low male fo14,122. A Fisherian model would suggest that female choice primarily drives and
exaggerates the evolution of male traits; hence, the model predicts that females prefer males with the lowest fo.
However, evidence from the current study and previous studies15,62,65 (suggests a general preference for lower fo
by women, but also a relatively stronger negative linear relationship between fo and dominance perceptions by
men across s tudies29.
While fo predicted both short- and long-term attractiveness, it predicted physical dominance but not social
dominance, in line with previous s tudies13,123. Pf and shimmer were linked to both social and physical dominance
ratings. A possible explanation for this pattern of results is that social dominance is influenced less by threat
potential and more by other qualities, such as competence, communication and cooperation skills, or leadership
qualities. These attributes might be more strongly associated with Pf and shimmer than with fo.
The other aim of this study was to explore whether attention to vocal cues is adaptive by investigating the
information content of acoustic parameters. We replicated a negative relationship between Pf and height33 and
found that Pf negatively predicted strength and several body morphology measures. Men with lower Pf were taller,
stronger, and had larger bodies in general. Further, our mediation analysis indicated that Pf, independently of fo,
mediated the relationship between a composite measure of body size and physical dominance ratings.
Importantly, baseline cortisol and testosterone levels interacted in predicting fo, such that testosterone lev-
els more strongly negatively predicted fo as cortisol levels decreased across participants. When we entered the
interaction term between testosterone and median-split cortisol levels into our exploratory moderated medi-
ation analyses, the interaction effect became non-significant, likely due to reduced statistical power124 from
dichotomizing a continuous variable (cortisol). Nevertheless, the overall interaction between testosterone and
cortisol in predicting male fo was confirmed in a meta-analysis (Fig. 3b). Male fo was negatively correlated with
Scientific Reports | (2020) 10:21296 | https://doi.org/10.1038/s41598-020-77940-z 10
Vol:.(1234567890)www.nature.com/scientificreports/
testosterone when cortisol was low, whereas no significant relationship was observed between male fo and tes-
tosterone when cortisol was high (Fig. 3c). These patterns of relationships may help clarify why dose-dependent
effects of androgen levels on the intensity of elaborate male traits are sometimes u ndetected125, and why fo is
only weakly correlated with testosterone when cortisol is not considered. Across a variety of species, testosterone
and cortisol are linked to measures of physical condition, including disease, stress, and d iet126. The interaction
between testosterone and cortisol, in particular, has been tied to immune function in b irds127, but the functional
and behavioral correlates of this hormonal interaction in humans are not yet c lear36,128, and most studies are
arguably underpowered. Further, a recent meta-analysis found only modest support for an interactive relation-
ship between testosterone and cortisol in predicting status-relevant behavior (e.g., dominance & risk taking) and
suggested that this association could be driven by publication bias and flexibility in data a nalysis129,130. Although
only one paper5 besides the current one has reported the specific interaction effect of testosterone and cortisol
on male fo, the meta-analysis reported here suggests that the interaction is robust.
There is widespread a greement5,11,27,40,46 that low male fo evolved to exaggerate apparent size by leveraging a
predisposition to perceive low frequencies as emanating from large sound sources. Phylogenetic reconstruction
suggests that relatively male fo evolved in the common ancestor of the catarrhine primates after their divergence
from platyrrhines approximately 43.5mya5. Given the weak correspondence between fo and body size, some
have argued that fo is purely deceptive and is not an honest indicator of physical d ominance27,28,131. Others have
suggested that fo may reliably correlate with other salient speaker characteristics such as status, threat, and
dominance, and that these dimensions may overlap with, and hence intrude onto impressions of, s ize46. Our
results better comport with the latter possibility. Indeed, relatively low male fo tends to be lost in primate species
in which male-male mating competition is reduced, suggesting that there are costs associated with low fo that
cause this trait to be selected against when compensatory benefits are absent.
Deference to males with low fo is demonstrably costly in humans in terms of social status, mates, and repro-
duction, and thus attention to fo would seemingly be selected against if fo did not provide valid information
about male c ondition30. However, this does not mean that fo is cheat-proof, or that the assessment of condition
or formidability from fo is largely accurate. Honest signals are often corrupted into conventional signals where
cheating is common because the assessment of the signal itself is costly to the receiver132. Although we did not
find support for the cortisol-moderated mediation role of fo between testosterone levels and physical dominance
ratings in the present sample, this may be explained by reduced statistical power due to dichotomized cortisol
levels and reduced sample sizes for testing two separate indirect effects. Indeed, we found a strong meta-analytic
support for an overall interaction between testosterone and cortisol in predicting male fo, suggesting that fo
conveys underlying endocrine state, if imprecisely, and lower male fo has consistently been shown to predict
perceptions of physical dominance across multiple studies. Likewise, a recent s tudy31 reported that fo mediated
the relationship between developmental condition (measured via height) and physical dominance ratings in two
separate samples with different types of vocal stimuli. Although we did not find that fo significantly mediated
the relationship between height and physical dominance ratings in our data, our meta-analysis suggests that fo
mediates about 44% of the relationship between height and physical dominance ratings. Collectively, our find-
ings support the hypothesis that, while the correlation between fo and underlying quality is imperfect, fo might
be utilized as one of many cues for assessing competitors and potential m ates29 because it communicates the
quality of the signaler significantly better than c hance132,133.
Shimmer also negatively predicted social and physical dominance ratings, as well as lower cortisol levels. The
latter finding is consistent with prior evidence that shimmer is reduced when stress is induced experimentally
or when the speaker is under high tension134. However, the other perturbation measure, jitter, showed no such
associations. Future research should continue to explore the relevance of jitter and shimmer to human sexual
selection (see also), as they have been shown to be associated with pathological voice q uality120 and body shape
in men41 and might therefore be relevant in contexts of sexual selection.
One limitation with our study is that we tested only hypotheses associated with receiver-independent costs
and did not consider receiver-dependent costs associated with attention to male fo. Some135,136 have suggested
that additional mechanisms that incorporate receiver-dependent costs are required to ensure signal honesty.
For example, under a mating-motive priming condition, male voices with low fo enhanced recognition for men
with high threat p otential135 and elicited aggressive cognitions and intent in men who perceived themselves to
be more dominant and stronger136. Future studies should investigate the extent to which receiver-dependent and
independent costs are needed in ensuring the signal honesty of low fo in cross-cultural contexts.
Following suggestions by Lakens137, we used one-sided significance tests for preregistered directional hypoth-
eses. The only result influenced by this decision is the relation between Pf and height, which would be non-
significant using a two-sided test. However, we note that meta-analytic fi ndings33 suggest a robust link between
Pf and height, and the lack of a significant relation in this particular study is likely due to a lack of statistical
power. Thus, also our conclusions remain highly similar when two-sided tests are used.
Conclusion
Vocal parameters were linked to hormone levels, as well as body morphology and physical strength, and appear
to be used for judgements relevant to intrasexual competition and intersexual mate choice. The present study
thus provides evidence that natural interindividual variation in men’s vocal parameters influences judgements
of attractiveness and dominance because these parameters provide valid information about speakers’ underly-
ing condition.
Scientific Reports | (2020) 10:21296 | https://doi.org/10.1038/s41598-020-77940-z 11
Vol.:(0123456789)www.nature.com/scientificreports/
Appendix A
Demographic Questions for Raters
What is your sex? (Female/Male)
How old are you? (text box)
Relationship status: (Single, Dating, Cohabiting/Married)
Which best describes your sexual attractions?
“I am attracted…”
equally to males and
(only to females mostly to females mostly to males only to males)
females
How well do you understand German? (7-point Likert Scale: 0 Not at All - 6 Fluent)
Voice Rating Questions
1. Short-term attractiveness: How attractive does the speaker sound for a short-term,
uncommitted romantic relationship?
a. 7-point Likert Scale (-3 very unattractive - 3+ very attractive)
2. Long-term attractiveness: How attractive does the speaker sound for a long-term,
committed romantic relationship?
a. 7-point Likert Scale (-3 very unattractive - 3+ very attractive)
3. Social dominance: How respected does the speaker sound?
a. 7-point Likert Scale (-3 very unrespected - 3+ very respected)
4. Physical dominance: How likely would the speaker win a physical fight against an average
college student?
a. 7-point Likert Scale (-3 very unlikely - 3+ very likely)
Received: 21 February 2020; Accepted: 18 November 2020
References
1. Cade, W. H. & Cade, E. S. Male mating success, calling and searching behaviour at high and low densities in the field cricket
Gryllus integer. Anim. Behav. 43, 49–56 (1992).
2. Fischer, J., Kitchen, D. M., Seyfarth, R. M. & Cheney, D. L. Baboon loud calls advertise male quality: acoustic features and their
relation to rank, age, and exhaustion. Behav. Ecol. Sociobiol. 56, 140–148 (2004).
3. Mathevon, N., Koralek, A., Weldele, M., Glickman, S. E. & Theunissen, F. E. What the hyena’s laugh tells: Sex, age, dominance
and individual signature in the giggling call of Crocuta crocuta. BMC Ecol. 10, 9 (2010).
4. Mitani, J. C. Sexual selection and adult male orangutan long calls. Anim. Behav. 33, 272–283 (1985).
5. Puts, D. A. et al. Sexual selection on male vocal fundamental frequency in humans and other anthropoids. Proc. R. Soc. B 283,
20152830 (2016).
6. Puts, D. A., Apicella, C. L. & Cárdenas, R. A. Masculine voices signal men’s threat potential in forager and industrial societies.
Proc. R. Soc. B Biol. Sci. 279, 601–609 (2012).
7. Ptacek, P. H. & Sander, E. K. Age recognition from voice. J. Speech Hear. Res. 9, 273–277 (1966).
8. Rezlescu, C. et al. Dominant voices and attractive faces: the contribution of visual and auditory information to integrated person
impressions. J. Nonverbal Behav. 39, 355–370 (2015).
9. Sell, A. et al. Adaptations in humans for assessing physical strength from the voice. Proc. R. Soc. B Biol. Sci. 277, 3509–3518
(2010).
10. Jünger, J. et al. Do women’s preferences for masculine voices shift across the ovulatory cycle?. Horm. Behav. 106, 122–134 (2018).
11. Puts, D. A., Jones, B. C. & DeBruine, L. M. Sexual selection on human faces and voices. J. Sex Res. 49, 227–243 (2012).
12. Cartei, V., Bond, R. & Reby, D. What makes a voice masculine: physiological and acoustical correlates of women’s ratings of
men’s vocal masculinity. Horm. Behav. 66, 569–576 (2014).
13. Hodges-Simeon, C. R., Gaulin, S. J. C. & Puts, D. A. Different vocal parameters predict perceptions of dominance and attractive-
ness. Hum. Nat. 21, 406–427 (2010).
Scientific Reports | (2020) 10:21296 | https://doi.org/10.1038/s41598-020-77940-z 12
Vol:.(1234567890)www.nature.com/scientificreports/
14. Puts, D. A. Mating context and menstrual phase affect women’s preferences for male voice pitch. Evol. Hum. Behav. 26, 388–397
(2005).
15. Rosenfield, K. A., Sorokowska, A., Sorokowski, P. & Puts, D. A. Sexual selection for low male voice pitch among Amazonian
forager-horticulturists. Evol. Hum. Behav. 41, 3–11 (2019).
16. Kordsmeyer, T. L., Hunt, J., Puts, D. A., Ostner, J. & Penke, L. The relative importance of intra- and intersexual selection on
human male sexually dimorphic traits. Evol. Hum. Behav. 39, 424–436 (2018).
17. Apicella, C. L., Feinberg, D. R. & Marlowe, F. W. Voice pitch predicts reproductive success in male hunter-gatherers. Biol. Lett.
3, 682–684 (2007).
18. Smith, K. M., Olkhov, Y. M., Puts, D. A. & Apicella, C. L. Hadza men with lower voice pitch have a better hunting reputation.
Evol. Psychol. 15, 1474704917740466 (2017).
19. Atkinson, J. et al. Voice and handgrip strength predict reproductive success in a group of indigenous African females. PLoS ONE
7, e41811 (2012).
20. Puts, D. A., Hodges, C. R., Cárdenas, R. A. & Gaulin, S. J. C. Men’s voices as dominance signals: vocal fundamental and formant
frequencies influence dominance attributions among men. Evol. Hum. Behav. 28, 340–344 (2007).
21. Hodges-Simeon, C. R., Gaulin, S. J. C. & Puts, D. A. Voice correlates of mating success in men: examining “contests” versus
“mate choice” modes of sexual selection. Arch. Sex. Behav. 40, 551–557 (2011).
22. Zahavi, A. Mate selection—a selection for a handicap. J. Theor. Biol. 53, 205–214 (1975).
23. Grafen, A. Biological signals as handicaps. J. Theor. Biol. 144, 517–546 (1990).
24. Higham, J. P. How does honest costly signaling work?. Behav. Ecol. 25, 8–11 (2014).
25. Penn, D. J. & Számadó, S. The handicap principle: how an erroneous hypothesis became a scientific principle. Biol. Rev. 95,
267–290 (2020).
26. Reid, S. A., Zhang, J., Anderson, G. L. & Keblusek, L. Costly signaling in human communication. in The Handbook of Com-
munication Science and Biology (eds. Floyd, K. & Weber, R.) 50–62 (Routledge, 2020).
27. Armstrong, M. M., Lee, A. J. & Feinberg, D. R. A house of cards: bias in perception of body size mediates the relationship between
voice pitch and perceptions of dominance. Anim. Behav. 147, 43–51 (2019).
28. Feinberg, D. R., Jones, B. C. & Armstrong, M. M. No evidence that men’s voice pitch signals formidability. Trends Ecol. Evol. 34,
190–192 (2019).
29. Aung, T. & Puts, D. Voice pitch: a window into the communication of social power. Curr. Opin. Psychol. 33, 154–161 (2019).
30. Puts, D. A. & Aung, T. Does men’s voice pitch signal formidability? A reply to feinberg. Trends Ecol. Evol. 34, 189–190 (2019).
31. Aung, T., Rosenfield, K. A. & Puts, D. Male voice pitch mediates the relationship between objective and perceived formidability.
Evol. Hum. Behav. (2020).
32. Han, C. et al. No clear evidence for correlations between handgrip strength and sexually dimorphic acoustic properties of voices.
Am. J. Hum. Biol. 0, e23178.
33. Pisanski, K. et al. Vocal indicators of body size in men and women: a meta-analysis. Anim. Behav. 95, 89–99 (2014).
34. Dabbs, J. M. & Mallinger, A. High testosterone levels predict low voice pitchamong men. Personal. Individ. Differ. 27, 801–804
(1999).
35. Evans, S., Neave, N., Wakelin, D. & Hamilton, C. The relationship between testosterone and vocal frequencies in human males.
Physiol. Behav. 93, 783–788 (2008).
36. Rantala, M. J. et al. Evidence for the stress-linked immunocompetence handicap hypothesis in humans. Nat. Commun. 3, 694
(2012).
37. Arnocky, S., Hodges-Simeon, C. R., Ouellette, D. & Albert, G. Do men with more masculine voices have better immunocom-
petence?. Evol. Hum. Behav. 39, 602–610 (2018).
38. Albert, G., Arnocky, S., Puts, D. A. & Hodges-Simeon, C. R. Can listeners assess men’s self-reported health from their voice?
Evol. Hum. Behav. (2020).
39. Fitch, W. T. Vocal tract length and formant frequency dispersion correlate with body size in rhesus macaques. J. Acoust. Soc.
Am. 102, 1213–1222 (1997).
40. Fitch, W. T. The evolution of speech: a comparative review. Trends Cogn. Sci. 4, 258–267 (2000).
41. Pisanski, K. et al. Voice parameters predict sex-specific body morphology in men and women. Anim. Behav. 112, 13–22 (2016).
42. Schild, C., Stern, J. & Zettler, I. Linking men’s voice pitch to actual and perceived trustworthiness across domains. Behav. Ecol.
31, 164–175 (2019).
43. Collins, S. A. & Missing, C. Vocal and visual attractiveness are related in women. Anim. Behav. 65, 997–1004 (2003).
44. Raine, J., Pisanski, K., Bond, R., Simner, J. & Reby, D. Human roars communicate upper-body strength more effectively than do
screams or aggressive and distressed speech. PLoS ONE 14, e0213034 (2019).
45. Raine, J., Pisanski, K., Oleszkiewicz, A., Simner, J. & Reby, D. Human listeners can accurately judge strength and height relative
to self from aggressive roars and speech. iScience 4, 273–280 (2018).
46. Rendall, D., Vokey, J. R. & Nemeth, C. Lifting the curtain on the Wizard of Oz: biased voice-based impressions of speaker size.
J. Exp. Psychol. Hum. Percept. Perform. 33, 1208–1219 (2007).
47. Šebesta, P. et al. Voices of Africa: acoustic predictors of human male vocal attractiveness. Anim. Behav. 127, 205–211 (2017).
48. Šebesta, P., Třebický, V., Fialová, J. & Havlíček, J. Roar of a champion: loudness and voice pitch predict perceived fighting ability
but not success in mma fighters. Front. Psychol. 10, 859 (2019).
49. Simmons, L. W., Peters, M. & Rhodes, G. Low pitched voices are perceived as masculine and attractive but do they predict semen
quality in men?. PLoS ONE 6, e29271 (2011).
50. Valentova, J. V. et al. Vocal parameters of speech and singing covary and are related to vocal attractiveness, body measures, and
sociosexuality: a cross-cultural study. Front. Psychol. 10, 2029 (2019).
51. Feinberg, D. R., DeBruine, L. M., Jones, B. C. & Perrett, D. I. The role of femininity and averageness of voice pitch in aesthetic
judgments of women’s voices. Perception 37, 615–623 (2008).
52. Babel, M., McGuire, G. & King, J. Towards a more nuanced view of vocal attractiveness. PLoS ONE 9, e88616 (2014).
53. Gregory, S. W., Dagan, K. & Webster, S. Evaluating the relation of vocal accommodation in conversation partners’ fundamental
frequencies to perceptions of communication quality. J. Nonverbal Behav. 21, 23–43 (1997).
54. Knowles, K. K. & Little, A. C. Vocal fundamental and formant frequencies affect perceptions of speaker cooperativeness. Q. J.
Exp. Psychol. 69, 1657–1675 (2016).
55. Michalsky, J. & Schoormann, H. Pitch convergence as an effect of perceived attractiveness and likability. in Interspeech 2017
2253–2256 (ISCA, 2017).
56. Pisanski, K. & Rendall, D. The prioritization of voice fundamental frequency or formants in listeners’ assessments of speaker
size, masculinity, and attractiveness. J. Acoust. Soc. Am. 129, 2201–2212 (2011).
57. Pisanski, K., Mishra, S. & Rendall, D. The evolved psychology of voice: evaluating interrelationships in listeners’ assessments of
the size, masculinity, and attractiveness of unseen speakers. Evol. Hum. Behav. 33, 509–519 (2012).
58. Sorokowski, P. et al. Voice of authority: professionals lower their vocal frequencies when giving expert advice. J. Nonverbal Behav.
43, 257–269 (2019).
59. Valentová, J., Roberts, S. C. & Havlíček, J. Preferences for facial and vocal masculinity in homosexual men: the role of relation-
ship status, sexual restrictiveness, and self-perceived masculinity. Perception 42, 187–197 (2013).
Scientific Reports | (2020) 10:21296 | https://doi.org/10.1038/s41598-020-77940-z 13
Vol.:(0123456789)You can also read