The formation of araneiforms by carbon dioxide venting and vigorous sublimation dynamics under martian atmospheric pressure - Nature
←
→
Page content transcription
If your browser does not render page correctly, please read the page content below
www.nature.com/scientificreports
OPEN The formation of araneiforms
by carbon dioxide venting
and vigorous sublimation dynamics
under martian atmospheric
pressure
1,5* 2,3
Lauren Mc Keown , J. N. McElwaine , M. C. Bourke1, M. E. Sylvest 4
& M. R. Patel 4
The local redistribution of granular material by sublimation of the southern seasonal CO2 ice deposit is
one of the most active surface shaping processes on Mars today. This unique geomorphic mechanism is
hypothesised to be the cause of the dendritic, branching, spider-like araneiform terrain and associated
fans and spots—features which are native to Mars and have no Earth analogues. However, there is
a paucity of empirical data to test the validity of this hypothesis. Additionally, it is unclear whether
some araneiform patterns began as radial and then grew outward, or whether troughs connected at
mutual centres over time. Here we present the results of a suite of laboratory experiments undertaken
to investigate if the interaction between a sublimating CO2 ice overburden containing central vents
and a porous, mobile regolith will mobilise grains from beneath the ice in the form of a plume to
generate araneiform patterns. We quantify the branching and area of the dendritic features that form.
We provide the first observations of plume activity via CO2 sublimation and consequent erosion to
form araneiform features. We show that CO2 sublimation can be a highly efficient agent of sediment
transport under present day Martian atmospheric pressure and that morphometry is governed by the
Shields parameter.
The Martian surface is host to a variety of features which have no Earth analogs and are all active in some capac-
ity today. These include the ephemeral sand furrows1 which seasonally scour the surface of Martian dunes, only
to be later erased by aeolian activity, the enduring and growing dendritic troughs of the southern mid-to-high
latitudes2 and the ‘spider-like’ araneiform terrain of the south polar cryptic r egion3 from which seasonal fans
and spots frequently e manate4. All of these active geomorphological features exhibit dendritic patterns. These
patterns are fractal, resemble tree branches and are found on Earth in systems that are engendered by physical
gradients, such as river networks, fork lightning strikes and even nerve endings in the human brain.
On Mars, dendritic patterns are emblematic of exotic geomorphological processes. These processes are driven
by a cycle which does not occur on Earth; namely the seasonal phase change of carbon dioxide between solid and
gas. The Martian atmosphere comprises over 95% CO25, at least a quarter of which freezes each y ear6. As winter
comes and temperatures decrease, a dry ice layer is deposited on the Martian surface6 ranging in thicknesses of
nearly a metre at the poles, to a few millimetres further towards the e quator7,8. The average atmospheric pres-
sure on Mars is very low at 6 mbar, below the triple point and so as this ice heats in spring, it sublimates; that is,
it directly converts from solid to gas. The basal sublimation of the seasonal cap is now recognised as a cardinal
geomorphological agent responsible for reworking the surface of Mars t oday9, in particular forming araneiforms,
which are unlike any surface feature seen on Earth.
Araneiforms (Fig. 1), frequently dubbed “spiders”, are characterised by a central depression from which radial
tortuous troughs appear to e manate3. These negative topography radial troughs become shallower further away
from the central depression and have dendritic and tortuous network patterns. In spring, araneiforms are fre-
quently accompanied by relatively low albedo fans and spots (Fig.1c,d)3,9,10 which appear on top of the seasonal
1
Trinity College Dublin, College Green, Dublin 2, Ireland. 2Durham University, Durham DH1, UK. 3Planetary Science
Institute, 1700 E Fort Lowell Rd, Tucson, AZ 85719, USA. 4The Open University, Walton Hall, Milton Keynes MK7
6AA, United Kingdom. 5Present address: The Open University, Walton Hall, Milton Keynes MK7 6AA, United
Kingdom. *email: Lauren.McKeown@open.ac.uk
Scientific Reports | (2021) 11:6445 | https://doi.org/10.1038/s41598-021-82763-7 1
Vol.:(0123456789)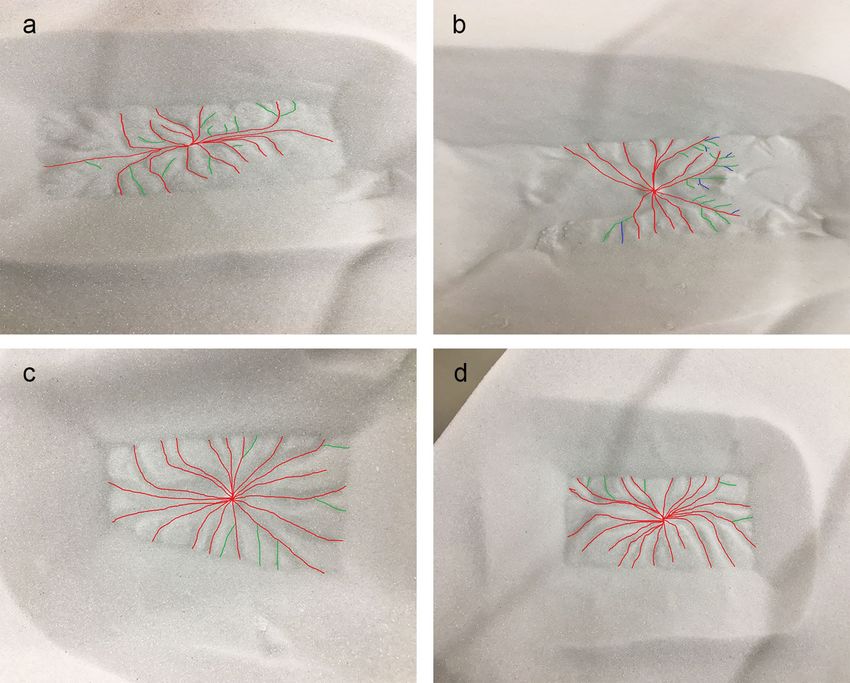
www.nature.com/scientificreports/
Figure 1. Zoomed and corresponding context images of a variety of araneiform morphologies (a, b) HiRISE
image ESP_011486_0980 shows ‘Starburst araneiforms’ which are huge features. Central lat = −81.8◦, Central
lon = 76.17◦, Ls = 187.3◦. (c, d) HiRISE image ESP_011491_0985 shows seasonal dark albedo fans and
spots. Central lat = −81.2◦, Central lon = 296.04◦, Ls = 187.5◦. (e, f) shows ‘fat spiders’ in HiRISE image
ESP_014282_0930. (g, h) shows close ups of ‘classic’ spiders in the same image as (e, f) only a different location
within the site. Central lat=−87.02◦, Central lon = 86.57◦, Ls = 320.5◦. HiRISE image credit: NASA/JPL/
University of Arizona.
CO2 ice layer that covers them. Araneiforms are observed mainly on the Cryptic Terrain of the South Polar
Layered Deposits (SPLD)3 and upon neighbouring crater b lankets11,12. They usually occur in groups, sometimes
packed densely enough to o verlap3 and are generally found on low surface s lopes13. While the central depression
of a single araneiform is typically ∼ 50 m across, the entire feature including its troughs spans from tens of metres
to up to 1 km across3,13. A survey of araneiforms at the Inca City and Manhattan regions of the SPLD allowed a
sub-classification of these features according to m orphometry13. This classification identified araneiforms based
on whether their patterns were radial or not, on the scale of channels relative to the central depression and on
the tortuosity of the channels. “Fat spiders” (Fig. 1e,f) consist of wide central depressions with respect to radial
troughs13 and are generally smaller. These spiders measure ∼ 50m across with 30–40 m of that spanning their
centres. “Thin spiders” (Fig. 1g,h) have large, rough centres with long, thin troughs radiating outwards and
generally cover more area (∼ 100m across). “Lace terrain” describes dense networks of channels similar in size
where a singular radial spider morphology cannot be distinguished13 and “starburst” araneiforms (Fig. 1a,b) are
highly dendritic with thousands of branches, and can extend up to 1km in diameter. These are all distinct species
which are each located in different regions14.
Araneiforms have been attributed to the erodability of the surface material of the SPLD which is estimated
to contain silt-sized particles 50–200 µm in diameter15,16. The discovery that the fans and spots were appearing
in a ‘Cryptic Terrain’, or region which remains at the same brightness temperature as CO2 ice9 in spring despite
a decreasing albedo, led Kieffer to propose that the seasonal fans and spots were not exposed terrain as previ-
ously thought17, but in fact excavated sub-ice material transported on top of the ice by confined gas beneath the
seasonal CO2 layer. Invoking the Solid State Greenhouse Effect18, whereby broad spectrum radiation infiltrates
translucent ice to reach the subsurface, the model asserts that in spring, solar radiation penetrates the seasonal
translucent slab ice and heats the regolith beneath it. Thermal radiation cannot escape through the ice overburden
because it is opaque at thermal infrared wavelengths and so the ice will sublimate from the base. As pressure
increases, at some point the ice will rupture and form a vent. Gas will escape through this vent, drawing with it
Scientific Reports | (2021) 11:6445 | https://doi.org/10.1038/s41598-021-82763-7 2
Vol:.(1234567890)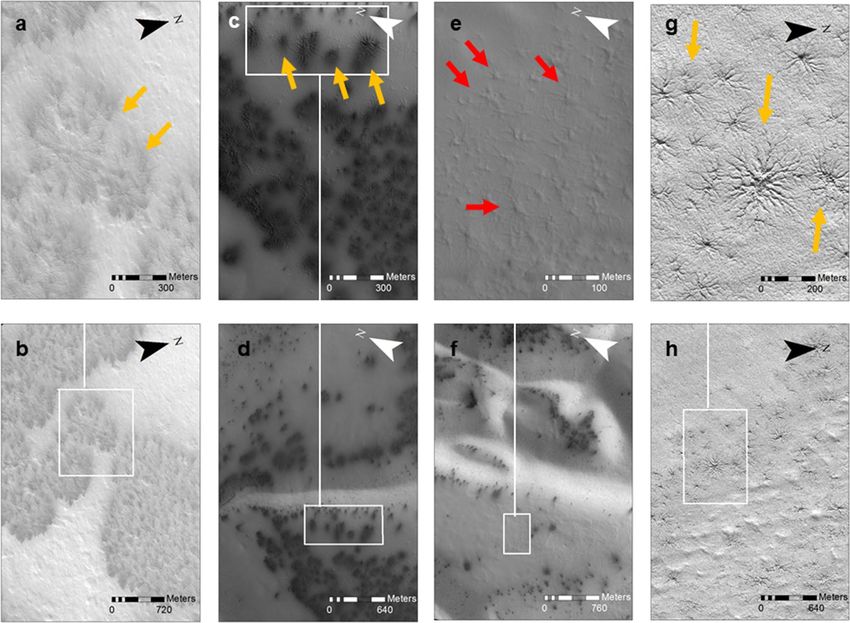
www.nature.com/scientificreports/
unconsolidated fines from beneath the ice in the form of a plume, and depositing the material as relatively low
albedo fans and spots. A combined effort by P iqueux3 who identified and described spiders, and Kieffer, who
developed a formation hypothesis, linked araneiform formation with the seasonal appearance of fans and spots.
Their dendritic negative topography patterns are thought to be eroded by pressurised escaping CO2 gas3,9. That
the seasonal CO2 deposit anneals annually into translucent slab ice has been confirmed by Mars Express Omega
observations19 and it has been calculated that 75% of incident solar radiation will reach the regolith beneath the
ice overburden20. However, although laboratory experiments have generated araneiform patterns on thin films
of sand using a Hele-Shaw cell21, particles entrained in jets under Martian conditions have been successfully
modelled22 and dust ejecta have been observed from within irradiated CO2 ice23, a CO2 venting process has never
been observed to form araneiforms.
Many other open questions remain surrounding araneiforms and their proposed formation mechanism.
Firstly, the seasonal appearance of fans and spots is to date the only notable activity associated with araneiforms.
Additionally, despite observational campaigns to capture stereographic images of plumes13,22, a plume in action
has not yet been observed. This is either because the plumes are shallow, optically thin, or their activity has not
coincided with HiRISE flybys. While the troughs are thought to marginally widen and deepen a nnually13, the
Mars Reconnaissance Orbiter High Resolution Imaging Experiment (HiRISE) which has a resolution of 50 cm24,
has not been able to detect changes in the a raneiforms2 over the last 7 years of monitoring. Moreover, the large
developed araneiforms of the SPLD have not yet been observed to form in the present day. This either means that
these araneiforms are growing at a very slow rate and this change has simply not been observed yet, or present
day atmospheric conditions and/or sediment consolidation are not conducive to erosion of the substrate.
However, due to the vast volume of material (on the order of 103 m3)13 that would need to be eroded in one
process and hence the requirement of an extremely high energy budget, it is assumed that these patterns required
multiple erosional events to form. On this premise, estimates have been made to date the age of araneiforms to
1 × 10³–1 × 10⁴ Mars years (MY)2,25. The most recent effort at dating araneiforms was based on the idea that
dendritic trough growth might showcase the initial stages of araneiform development. Dendritic troughs are
a recent class of negative topography, dendritic feature exclusive to the Martian southern hemisphere and are
generally found on dune b oundaries2. They endure seasonally and have been observed to extend and merge
over the last 5 MY2. However, how gradually growing troughs would eventually develop into the large, currently
apparently inactive araneiforms has not been fully delineated. It is likely that the substrate at dune boundaries is
more erosive in the present day, as suggested by P ortyankina2. However, there are many other variables that may
influence araneiform development; for example grain size, sediment consolidation, ice thickness, vent spacing
and size and how current atmospheric conditions balance with these factors to result in sufficient erosion of
the substrate. It is possible that araneiforms did develop over time via a connection of tributaries as a central
depression may continually provide a point of weakness for the ice to rupture14. However, this does not explain
why new troughs have not yet been observed to form within an existing radial araneiform in the present day.
Whether the araneiforms of the SPLD were formed through connecting tributary systems over many years, or
whether they are relic features formed in different climatic period(s), remains uncertain. Insights have been
given through our prior experiments indicating that grain size and vent separation can influence cryoventing
and subsequent p atterns26, as well as through observations of clustering araneiform sub-types on Mars suggest-
ing grain size and sediment consolidation may play a role in morphology t ype14. However what factors govern
the differing araneiform morphologies, their varying levels of branching or the extent of the areas they cover
have not been fully elucidated.
Empirical observations are imperative to answering these open questions surrounding araneiforms,
though there have been few experiments undertaken to explore CO2 sublimation under Martian atmospheric
conditions23,26–28. Our previous e xperiments26 indicated that CO2 gas velocity controlled furrow network pattern
and that dendritic morphologies scaled positively with greater vent spacing26. We hypothesise that just as furrow
formation is governed by high gas velocities, araneiform formation will be too. Suppose a series of vents forms
and for a particular vent all the gas from within an area A escapes through that vent. If the sublimation rate
under the ice is roughly constant and equal to q then the total volume flux though a vent will be Aq giving rise to
gas velocities into the vent of U = Aq/a where a is the cross-sectional area of the vent. Since A will increase as
the separation between the vents increases the gas velocities will also increase. The ability of a gas flow to move
a grain is given by the Shields parameter
ρg U 2
S=
, (1)
ρs − ρg Dg
where g is gravity, D the grain diameter, ρs the grain density, ρg the gas density. (This is in the case of high particle
Reynolds number though the conclusions are the same for low particle Reynolds number). When S is above a
critical value grains can be mobilised, thus as A increases, hence U, more grains will be moved but as the particle
diameter D increases fewer grains will move. We hypothesise based on our previous experiments that the more
mobile grains are the more branched the pattern is likely to be.
Methods
In order to test the hypothesis that radial dendritic araneiform morphologies can form via basal sublimation
of CO2 and consequent plumes, and to answer some of the open ended questions surrounding the physical
constraints on araneiform formation, experiments involving the placement of CO2 blocks containing central
vents on granular surfaces were performed under Martian pressure. We herein refer to this type of experiment
as phase 1. As in our previous Earth-based experiments which explored furrow f ormation26, the basal heating of
Scientific Reports | (2021) 11:6445 | https://doi.org/10.1038/s41598-021-82763-7 3
Vol.:(0123456789)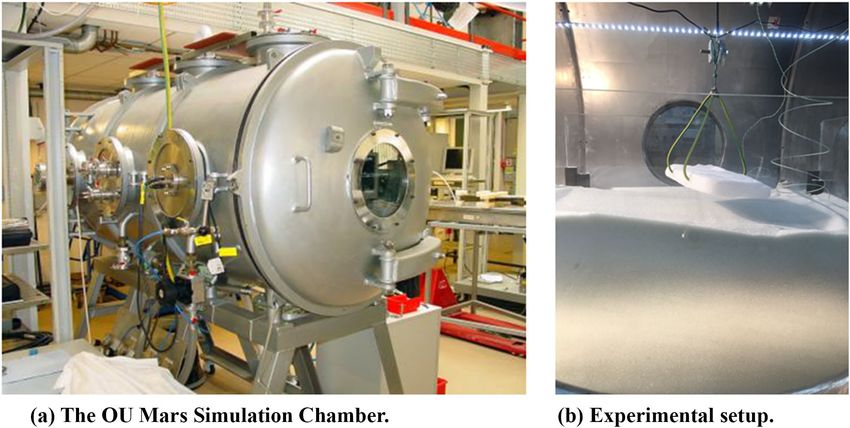
www.nature.com/scientificreports/

                                            Figure 2.  Experimental setup. (a) shows the Mars Simulation Chamber which is capable of simulating Martian
                                            atmospheric parameters. Image credit: The Open University. (b) shows a CO2 block suspended above a granular
                                            bed with a claw which is slotted into its sides.

                                           CO2 ice was modelled by exploiting an effect similar to the Leidenfrost Effect29, as in the work of Diniega et al.30.
                                           This is an effect that occurs when a substance (in our case solid CO2), in contact with a surface far hotter than
                                           its boiling or sublimation point, will generate a cushion of high pressure vapour. The gas pressure of this vapour
                                           layer exceeds the pressure exerted by the weight of the CO2 ice, allowing it to levitate. The point at which solar
                                           radiation heats the substrate beneath seasonal ice on Mars enough that it will cause the ice to sublimate from its
                                           base can hence be approximated, albeit on a much smaller scale and with different levels of energy.
                                               In order to study the influence of grain size and vent diameter as well as vent separation on feature morpho-
                                           metry, the area araneiforms cover and the level of branching, Digital Elevation Models (DEMs) of the surface
                                           features were generated by Structure from Motion (SfM)31. Feature dimensions were measured in ArcMap 10.4
                                           and these data were analysed using Matlab R2018a.
                                               The efficiency of CO2 sublimation as an agent of sediment transport under Martian pressure was investigated
                                           by calculating sublimation mass flux of CO2 and estimating sediment displacement per volume of subsurface
                                           CO2. We herein refer to experiments of this nature as phase 2.

                                            Experimental setup. The Mars Simulation Chamber (Fig. 2a) at the Open University is capable of recreat-
                                            ing atmospheric parameters characteristic of the Martian environment. The chamber measures 0.9 m in diam-
                                            eter and 1.8 m in length and can depress internal pressure to < 6 mbar in less than 5 minutes. A glass aquarium
                                            was deployed on a flat track within the chamber and two Logitech webcams were positioned at both a nadir
                                            and side view of the tank. In each experimental trial, the tank was filled up to a height of ∼ 25cm with Guyson
                                            Honite glass spheres of distinct grain size ranges. These were chosen due to their unimodal nature which is help-
                                            ful when developing numerical models. For phase 1 experiments, manufacturing dispersion grain size ranges
                                            chosen were 160–212 µm, 150–250 µm, 250–425 µm and 425–600 µm. For phase 2 experiments, the smaller
                                            two grain size ranges were used. The smaller grain sizes were used to explore the maximum efficiency of CO2
                                            sublimation for dust sized particulate matter. A thermocouple was placed within the bed while one was placed
                                            outside of it in each case in order to monitor temperature. However this was only indicative of temperature away
                                            from the block in real time. Utilising data from extra pilot experiments we performed of thermal gradient meas-
                                            urements beneath the block, we report that initial bed temperature beneath the block was between 16 and 18 ◦ C
                                            and temperature decreased exponentially over time to 0 ◦ C in just under an hour. Pressure within the chamber
                                            was monitored carefully in real time with a pressure gauge.
                                                In order to establish scale in the DEMs, coded targets were printed and attached to plastic poles so that they
                                            could be seen at different heights above the sand bed. This was to avoid wide uncertainties in calculation of the
                                            z-plane in the 3D model. Their positions in x, y and z were measured with a metal ruler and to improve accuracy,
                                            photographs were taken of their positions relative to the mm markings on the ruler. The photos were zoomed
                                            so that sub-mm position accuracy could be achieved. A pyramid-shaped claw was developed and attached to an
                                            external pulley (Fig. 2b). The pulley was given enough slack so that the claw would just touch the bed surface
                                            upon lowering and would be well above the bed when retracted. This was to allow control over timing of block
                                            contact with the bed surface and also to ensure the block could be held in place so it would not burrow and erase
                                            surface microtopography.

          Scientific Reports |   (2021) 11:6445 |                https://doi.org/10.1038/s41598-021-82763-7                                                   4

Vol:.(1234567890)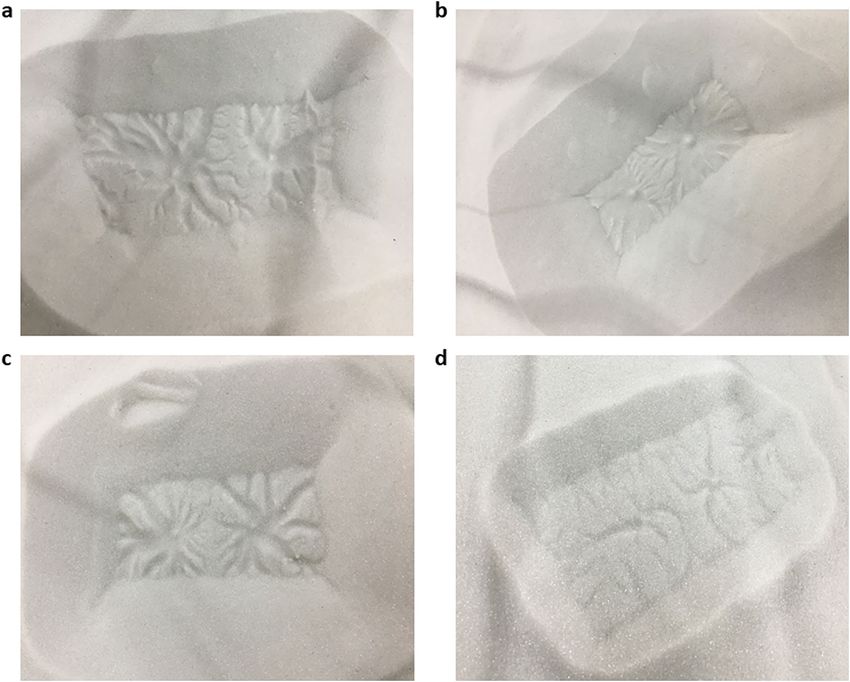
www.nature.com/scientificreports/

                                  Experimental protocol. For each experiment, the glass spheres were levelled using a spirit level and
                                 smoothed with a metal ruler. Two holes were drilled on one of the longest sides of a CO2 ice block and one was
                                 drilled on the opposite side so that the claw could be slotted into the block. The holes were drilled close to the
                                 bottom of the block so that the claw would not sear through the block fully and hence detach the block prema-
                                 turely while the experiment was taking place. For phase 1 experiments, holes were created at the centres of the
                                 blocks by drilling through fully with different sized drillbits. To investigate the effect of vent dimension and spac-
                                 ing on araneiform morphometry, three scenarios were explored: a central hole measuring 5 mm in diameter, a
                                 central hole measuring 3 mm in diameter and two holes along the long axis of the block and at the centre of the
                                 short axis, measuring 3 mm in diameter and 60 mm apart. In phase 2 experiments, only holes at the sides of the
                                 block were generated in order to insert the claw. All experiments were performed in duplicate.
                                     In each case, the block was weighed using a digital scales and its dimensions were measured with a metal ruler.
                                 The time of measurement was noted. The claw was slotted into the block and the block was suspended from the
                                 pulley above the bed surface (Fig. 2b). The chamber was sealed, depressurised and when ambient pressure reached
                                 6 mbar, the block was gently lowered onto the surface using the pulley. The time between block measurement and
                                 contact with the granular surface exceeded no more than ∼ 5 min for each experiment. Our measured rates of
                                 CO2 sublimation under Mars and Earth pressures were averaged to account for the amount of CO2 that was likely
                                 to have sublimated during chamber depressurisation. This was subtracted from the measured mass in each case
                                 to estimate block mass upon surface contact. The chamber pressure was monitored so that it did not drastically
                                 deviate from average Martian atmospheric surface pressure. The chamber is difficult to maintain at an exact low
                                 pressure for these types of experiments however because the pumping rate needs to match volatile evolution in
                                 order to remain constant and so this fluctuated, but did not deviate by more than 3 mbar in any case. In phase
                                 1 experiments, the block was lowered so that it was sitting on the bed surface, but also held in place by tension
                                 in the pulley. The block was allowed to sublimate for ∼ 5 min and was then raised very carefully above the bed
                                 surface. This was to avoid the block detaching and burrowing, hence erasing surface topography generated by the
                                 venting process, and also to avoid spilling granular material from the top of the block on to the surface feature
                                 generated. This proved particularly precarious for the finest grain sizes of 160–212 µm as the block transported
                                 material most rapidly for finer grain sizes.
                                     For phase 2 experiments, the block was lowered and the pulley was left slack to allow the block to detach
                                 from the claw as it sublimated and burrowed within the granular bed. Once detached, the claw was raised while
                                 burrowing continued. Once sublimation had ceased (i.e. the bed was observed to be still and no granular ejecta
                                 were observed), the chamber was repressurised and the bed surface was imaged at many overlapping positions
                                 to collect data for DEM production.

                                  Digital elevation model development. Both the araneiform features and volume change resulting from
                                  burrowing were modelled in three dimensions by SfM using Agisoft Photoscan. SfM is a technique for recon-
                                  structing three dimensional structures from a series of two dimensional images. Agisoft Photoscan is commer-
                                  cially available software which can photogrammetrically process digital images to create a 3D reference frame.
                                  Each feature produced was imaged at many overlapping positions. For ground control, coded markers were
                                  placed within the scene. Agisoft Photoscan finds the exact centre of coded markers enabling the production of
                                  highly accurate DEMs and the accurate measurement of features in the scene. Agisoft recommend that three or
                                  more scale bars are optimal. Therefore, a local coordinate system composed of seven coded markers at known
                                  distances and heights apart from one another, was used to establish scale. Black and white circular 12-bit coded
                                  markers 30 mm in diameter were printed on paper and fixed upon plastic poles which were stuck securely to
                                  the container floor with silicone. The (x, y, z) coordinates of the marker centres were carefully measured with a
                                  metal ruler and photographs of their positions were taken. The photographs were zoomed and accurate positions
                                  were noted. These were later entered in Agisoft Photoscan to develop scale bars for reference within the models.
                                  Their coordinates (in metres) were: (0.016, 0.014, 0.2745), (0.0455, 0.013, 0.2595), (0.343, 0.013, 0.2585). (0.3685,
                                  0.0145, 0.2775), (0.3695, 0.5465, 0.258), (0.3685, 0.5710, 0.2725), (0.0135, 0.5425, 0.26), (0.013, 0.5705, 0.298)
                                  and these have accuracy < 1 mm. The targets were close enough to the bed centre so that they could be seen
                                  in multiple overlapping images. Constancy of target position was assured by the remote nature of the labora-
                                  tory—external vibrations were minimised and the aquarium containing sediment was heavy enough that it was
                                  extremely difficult to move within the chamber.
                                      The images were captured with an iPhone 6s 12 megapixel camera. Images were taken at a maximum distance
                                  of < 1 m from the bed surface and minimum distance of ∼ 0.1 m at a variety of angles with respect to the image
                                  subject in each case. Camera positions were not recorded, as Agisoft Photoscan can compute accurate estimates
                                  and ‘Location Services’ were disabled in order not to interfere with position interpolation in the model. The focal
                                  length on the camera and aperture were fixed at 4.15 mm and f2.2 respectively and otherwise, the camera was
                                  not calibrated. Between 30 and 70 images were captured for each experiment depending on the level of detail to
                                  be recorded. The images were then aligned and referenced in Agisoft Photoscan, to build a point cloud, mesh
                                  and (after extraneous dense cloud data were removed), generate a DEM and corresponding orthophoto of each
                                  feature. The dimensions of each feature were then measured in ArcMap 10.4, using the DEM and orthophoto.
                                      The depth, width and area of araneiform features and their morphological characteristics produced on each
                                  bed surface were recorded using polygonal mapping in ArcMap 10.4. Width was calculated using the ‘Measure’
                                  tool and taking the average of five cross-sections across a similar region. Depth was calculated using the ‘Inter-
                                  polate Line’ tool, identifying the difference between the highest and lowest point on each side of the resultant
                                  plot and averaging these, then taking an average of five of these cross-sections across a similar region. Area rather
                                  than volume was measured as most of the araneiforms were sub-DEM resolution in depth and approximating
                                  would introduce considerable error. The area of the flat pit floor in each case was determined by zooming in to

Scientific Reports |   (2021) 11:6445 |                https://doi.org/10.1038/s41598-021-82763-7                                                    5

                                                                                                                                                Vol.:(0123456789)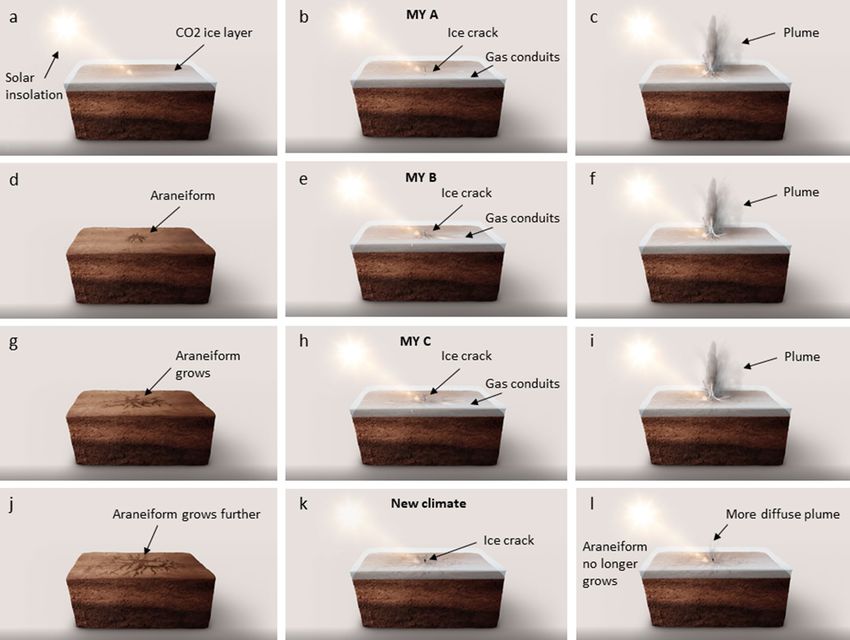
www.nature.com/scientificreports/
Figure 3. Araneiform morphometry. (a) Shows a decrease in the level of branching with grain size. Level of
branching varies for finer grain sizes while for coarser grains of 450–600 µm, is consistent. (b) Shows a decrease
in area covered by araneiforms with grain size.
optimal pixel resolution on the orthophoto overlain above the DEM and using the free-hand polygon tool to
mark the line where the inner slope of levées ended and the flat pit floor began. The pit floor is defined as the
reasonably flat area directly below where the incident block was for which the perimeter is identified as the line
between where the inner levée slope ended at 1 pixel resolution. Levées are defined as the positive relief material
surrounding the pit which was excavated and pushed to the sides of the block during sublimation. The area of
the space between araneiform networks was determined by zooming in to optimal pixel resolution and mapping
the outer edge of each araneiform leg which was identified as where a region of low albedo (negative topography)
ended and high albedo (positive relief) began. This total area was differenced from the total pit floor area to get
the area covered by araneiform patterns. This was then expressed as a percentage of pit floor area.
The error bars seen in Fig. 3 were calculated considering the factors that contributed to measurement uncer-
tainty. Firstly there are errors due to imprecision in construction and measurement of our calibration targets.
The construction of the objects was much more accurate than the measurement of their locations which we esti-
mate as better than 1mm. Additionally, some of the targets were covered with sediment during the sublimation
process making it difficult to pinpoint their exact centres. Though estimated to be minimal, external vibrational
disturbances cannot be entirely accounted for. Additionally, despite zooming to one pixel to take our vertical
and horizontal measurements, operator error may have occurred. Having tested our approach by making repeat
measurements, we estimate the contribution of this error to be ± 3 pixels in each case, or ± 9 pixels for each
dimension squared. In considering all of these errors, an estimate of 10 pixels was used to cover uncertainty
when calculating the area covered by araneiforms. This was propagated in the formula for percentage area using
standard error propagation.
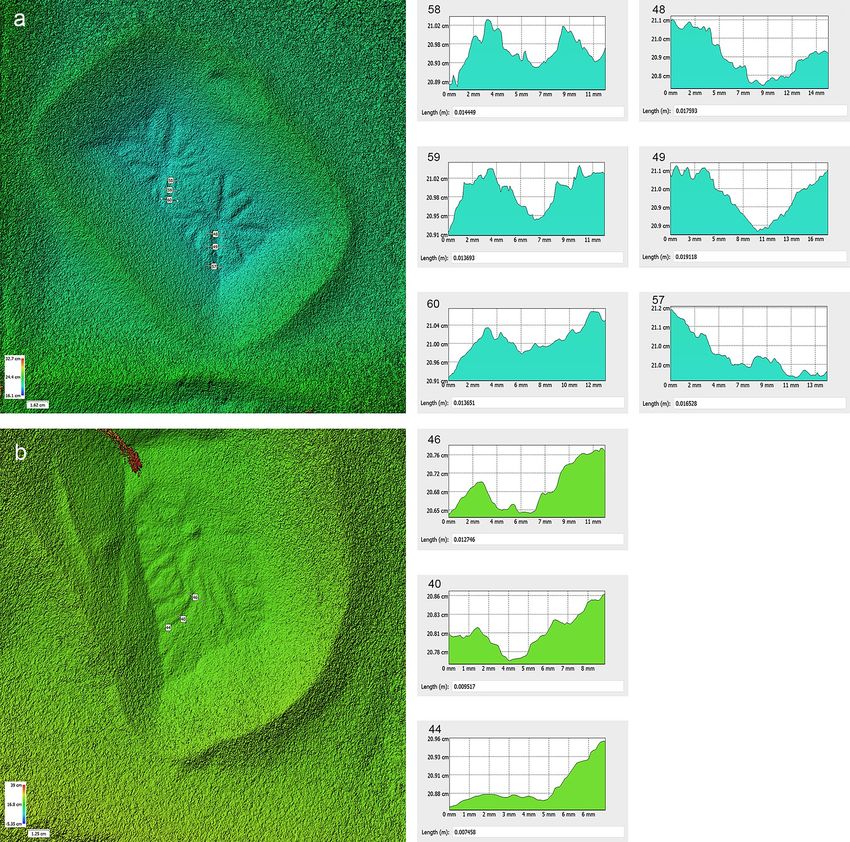
The level of branching of araneiforms (Fig. 4) was determined by counting the amount of ‘junctions’ on each
araneiform. A junction is defined using the Strahler Stream Order m ethod32, (where all streams begin as order
1 (red)) as either an order 1 stream meeting an order 2 stream (green), or an order 2 stream meeting an order 3
stream (blue). Any araneiforms which were partially covered by sediment which fell from the suspended block
after sublimation were not analysed in this way and were not included on the plots in Fig. 3 for consistency. An
uncertainty of two branches was used in each case as though care was taken, operator error may have mistaken
image artefacts for very small branches.
For phase 2 experiments, sediment volume displacement was estimated. Differencing before and after DEMs
was not possible due to the high albedo of the granular surface which is difficult to capture as a 3D model when
flat. Additionally, due to bright regions on the relatively gentle slopes left after the block had burrowed, DEMs
contained holes in some places. Thus, generating a planar surface in ArcMap 10.4 under which to interpolate
volume would reduce the accuracy of our volume calculations.
Instead, because the surface was smoothed and levelled prior to each experiment, the initial height of the
levelled glass spheres in the container was noted. The initial volume was calculated as width × length × height of
the bed in each case. In all four cases, dips in the bed were visible. Regions of similar depth were identified and
the average depth for each region was noted by interpolating a line across the dip and subtracting the average
maximum depth from the original height of the unperturbed bed. A polygon tool was then used to mark the outer
edges of these individual regions and the area they covered was calculated. These areas were then multiplied by
average depth and summed together in order to get an estimate of the volume displaced during the burrowing
process. In cases where the moving block had increased the sediment height in locations, the difference between
the original bed height and new height were multiplied by area. This method, while approximate, avoided
Scientific Reports | (2021) 11:6445 | https://doi.org/10.1038/s41598-021-82763-7 6
Vol:.(1234567890)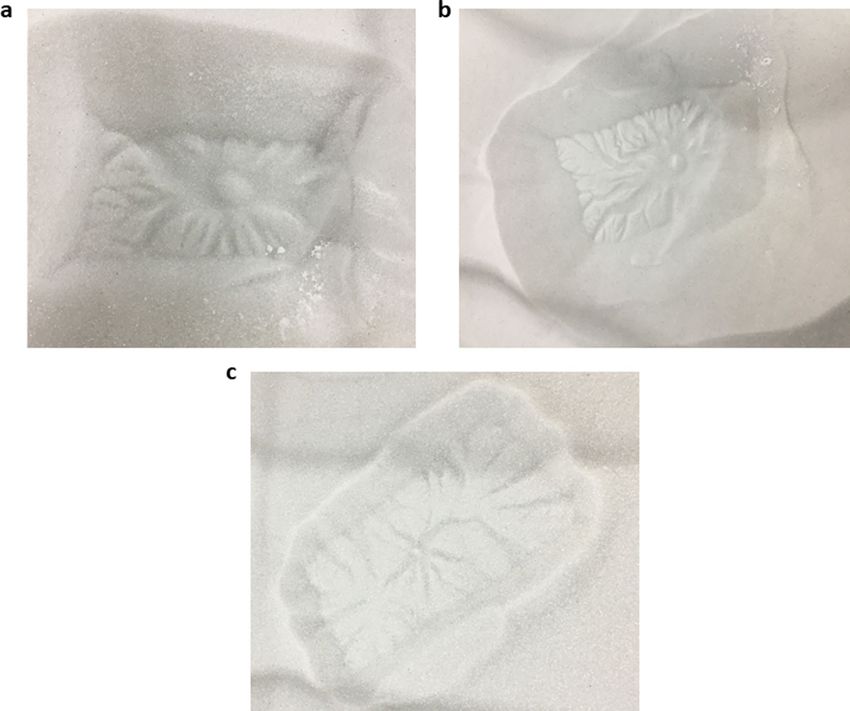
www.nature.com/scientificreports/
Figure 4. Level of branching and vent diameter. Red shows first order branches, green shows second order and
blue shows third order. Each joining of a colour represents a ‘junction’. (a) Shows an araneiform formed with a
3 mm vent on 250–425 µm grains. 12 junctions are counted. (b) Shows an araneiform formed with a 3 mm vent
on 160–212 µm grains. 22 junctions are counted. (c) Shows an araneiform formed with a 5 mm vent on 160–
212 µm grains. Six junctions are counted. (d) Shows an araneiform formed with a 5 mm vent on 250–425 µm
grains. Five junctions are counted. Level of branching increases (1) when smaller central vents were used and (2)
with smaller grain sizes. A more diffuse, steady plume was observed for 5 mm vents while a high velocity, higher
plume was observed for 3 mm vents.
incorporating bright regions with holes into volume calculations which could introduce order of magnitude
uncertainties into our volume estimates.
Sublimation mass flux was calculated by measuring the mass of the CO2 block before and after sublimation
and burrowing. Activity due to burrowing was taken as complete once no movement was observed within the
bed. If any CO2 ice remained within the bed post-burrowing, this ice was removed and weighed. Sublimation
time was taken as the time between block contact with the surface and the time activity was observed to cease.
This time was recorded via webcam. Sublimation mass flux could then be found by dividing mass difference by
sublimation time.
Results and discussion
Phase 1: Araneiform formation. Features analogous in morphology (though orders of magnitude lesser
in scale) to araneiforms formed following each experimental trial (Figs. 4, 5, 6). On Mars, araneiforms are
between ∼ 10m and 1km in total extent while our experimental chamber and ice supply limited physical mod-
elling of araneiforms to the cm scale. Numerical modelling will be required to extrapolate the processes observed
in the laboratory to the Martian scale. Excluding the vast difference in scale however and considering morphol-
ogy only, we used the classification for araneiforms provided by Hansen13 to identify the features and to subclas-
sify them. Each feature had negative topography, had a central depression and troughs which were dendritic and
tortuous, especially for finer grain sizes. Troughs decreased in depth with distance from the central depression
Scientific Reports | (2021) 11:6445 | https://doi.org/10.1038/s41598-021-82763-7 7
Vol.:(0123456789)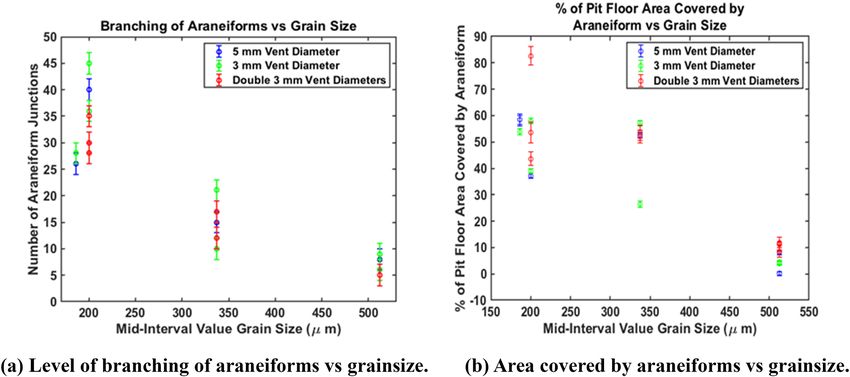
www.nature.com/scientificreports/

                                            Figure 5.  Double araneiforms. Double araneiforms formed on beds of grain sizes ranging from 150 to 600 µm
                                            when two 3 mm vents were created at the centre of the incident block, 6 cm apart. (a) Shows double araneiforms
                                            on 150–250 µm grains. (b) Shows double araneiforms on 150–250 µm grains. (c) Shows double araneiforms on
                                            250–425 µm grains. (d) Shows double araneiforms on 450–600 µm grains. Sublimation was highly vigorous for
                                            the 160–212 µm experiments, particularly with two central vents. This caused rapid sediment transport back on
                                            top of the block and pit and hence surface features were concealed by this burying effect.

                                            (Fig. 7), similar to the Martian forms. In the majority of cases the troughs were radially organised, barring the
                                            instances where they appeared to interlink and overlap in a more disorganised ‘lace’ morphology. All radial
                                            dendritic patterns formed in one instance and did not require multiple events of trough connection towards a
                                            common centre. As the block was uniform in each case, the gas flowed beneath the block to the central vent.

                                            Plume observations. Plumes of CO2 ejecta entraining sediment were observed in each case (Video 1). These
                                            are the first observations of plumes depositing material on top of ice and consequently eroding radial aranei-
                                            form structures. These types of plumes; driven by momentum but denser than the ambient fluid are known in
                                            the fluid dynamic community as fountains. Unlike on Mars where winds are thought to frequently redistribute
                                            the jetted subsurface material in fan shapes away from the centre of the araneiform, the material carried within
                                            the plume either fell down onto the surrounding bed or directly back down through the vent. The latter process
                                            formed a central raised spot within the central depression. Plume height was simply observed and not measured
                                            because in some cases, the plume height was limited by the height of the chamber but differences according to
                                            (1) vent diameter and (2) grain size, could be quantitatively observed. Vent diameter affected plume height sig-
                                            nificantly, with ejecta from plumes emanating from 3 mm diameter vents reaching the chamber ceiling (∼ 0.6m
                                            above the bed surface) in many cases at high velocity relative to plumes from 5 mm vents, while 5 mm vent
                                            plumes were more diffuse, with grains only reaching the top of the claw (∼ 0.15m above the bed surface).
                                            This is to be expected since as we showed earlier the velocity in the vent will be U = Aq/a, so if the vent radius
                                            decreases from 5 to 3 mm the velocities will increase by (5/3)2 and the height of the resulting granular plume by

          Scientific Reports |   (2021) 11:6445 |                https://doi.org/10.1038/s41598-021-82763-7                                                 8

Vol:.(1234567890)
www.nature.com/scientificreports/
Figure 6. Area covered by araneiform with grain size. (a) Shows araneiform formed with a 5 mm vent
on 160–212 µm grains. (b) Shows araneiform formed with a 5 mm vent on 150–250 µm grains. (c) Shows
araneiform formed with a 5 mm vent on 425–600 µm grains. The area the araneiforms cover appears to increase
with smaller grain sizes.
(5/3)4 ≈ 8, since h ≈ gU 2 /2. The larger grains do not reach the gas velocity in the vent and the plume heights
are therefore less.
The effect of grain size on araneiform morphometry. The effect of grain size on the level of branching of the
araneiforms is seen in Fig. 3a. Points where fallen sediment covers part of the araneiform are not included in the
plot. The level of branching of araneiforms decreases with increasing grain size. In addition, araneiform legs were
observed to be more sinuous for finer grain sizes. Outlying points for 150–250 µm are probably due to erasure
of part of the eroded pit surface by infalling sediment from levées and from grains from the top of the lifted
ice block. As in Table 1, the difference between the widest and thinnest leg of the araneiform became less with
increasing grain size also. This is to be expected since for the same flow velocity, the Shields parameter (Eq. 1)
is smaller for larger diameter grains; thus they will erode less. Most notable is the difference in morphometry
between all other grain sizes and our coarsest grain sizes of 425–600 µm which show very low levels of branch-
ing. This dependence on mean grain size or sorting may help to explain the distinction between the location of
furrows and dendritic troughs and the dendritic araneiform terrain and indeed, other environmental conditions
on Mars. Furrows can have a range of morphologies including linear and sinuous, are very shallow33 and are
only found on dune slopes and sandy patches in interdune regions. An upper limit of the grain size distribution
on Martian dunes was recently provided by the Curiosity rover expedition to the Bagnold dune field on Mars
from < 150 µm to 1 mm34. Dendritic troughs are found on interdune material which is believed to be finer
and less consolidated, while grains in the SPLD were found to range from 50 to 200 µm15. Since SPLD grains
are in general, finer than those on dune slopes and yet erosion to the degree observed for furrows has not been
Scientific Reports | (2021) 11:6445 | https://doi.org/10.1038/s41598-021-82763-7 9
Vol.:(0123456789)www.nature.com/scientificreports/
Figure 7. Examples of DEMs created in the laboratory with cross-sections showing depth of troughs decrease
away from araneiform centre, as on Mars. (a) Shows double araneiforms on 250–425 µm grains. (b) Shows
an araneiform on 150–250 µm grains. Graphs show decrease in trough depth further away from the central
pit. Sample depths were calculated by averaging the heights of the inversion points at each side of the trough
and taking away the minimum point, using linear transects to calculate depth in Agisoft Metashape. Transect
numbers are arbitrary. (a) Transect 58 was 0.102 cm deep, transect 59 was 0.0859 cm deep, transect 60 was
0.07 cm deep. Transect 48 was 0.189 cm deep, transect 49 was 0.123 cm deep, transect 57 was 0.06 cm deep. (b)
Transect 46 was 0.071 cm deep, transect 40 was 0.041 cm deep, transect 44 was 0.025 cm deep.
observed in these regions, it is likely that other environmental factors contribute to lack of erosion, such as sedi-
ment consolidation.
The effect of grain size on the area covered by araneiforms is seen in Figs. 3b and 6. Finer grains are more
mobile and hence the imprint of many CO2 subsurface gas conduits are visible on the resultant araneiform
(Fig. 6b). There appears to be a cut off point at 425–600 µm where while the radial patterns are detectable, these
are shallow and have very low levels of branching (Fig. 6c). Araneiform development will of course vary with the
vast scale differences between the laboratory setting and the SPLD on Mars and with other external factors such
as ice grain size and thickness. However, while vent separation was kept relatively consistent between different
grain size trials, we report that the extent to which the radial troughs of araneiforms reach (acknowledging edge
effects introduced by the small block size from the sides of the block) is dependent on grain size.
Scientific Reports | (2021) 11:6445 | https://doi.org/10.1038/s41598-021-82763-7 10
Vol:.(1234567890)www.nature.com/scientificreports/
Vent Width Pit floor Widest Thinnest DEM Orthophoto RMS Model Number
Block area Block diameter Grain size centre area Araneiform trough trough resolution resolution uncertainty of
(cm 2 ) mass (g) (mm) (µm) (cm) (cm 2 ) area (cm 2 ) % Area (cm) (cm) (mm/pix) (mm/pix) (m) junctions
241.5 820 5 425–600 2.69 176.07 14.37 8.16 0.7 0.5 0.619 0.155 0.01 8
234 760 Double 425–600 1.36 78.4 9.07 11.57 0.74 0.46 0.76 0.19 0.002 5
234 760 Double 425–600 1.82 71.38 8.04 11.26 0.72 0.42 0.76 0.19 0.002 5
230 750 3 425–600 1.33 162.23 7.08 4.36 0.8 0.39 0.533 0.133 0.002 9
224.3 750 Double 425–600 1.23 69.46 5.96 8.58 0.91 0.45 0.636 0.159 0.003 5
224.3 750 Double 425–600 1.13 81.23 9.63 11.86 1.17 0.48 0.636 0.159 0.0034 5
209 550 5 425–600 1.13 182.3 19.66 0.11 0.91 0.33 0.524 0.131 0.0037 6
207 710 3 425–600 1.42 168 6.64 3.95 0.64 0.264 0.621 0.115 0.0022 6
214.5 690 5 250–425 5.3 118.7 62.36 52.54 1.02 0.3 0.707 0.117 0.0044 15
240 850 3 250–425 7.4 109.1 28.8 26.4 0.54 0.14 0.497 0.122 0.0042 21
240 830 3 250–425 4.7 134 76.55 57.13 1.77 0.475 0.533 0.133 0.008 10
246 830 Double 250–425 2.9 39.84 21.3 53.46 1.1 0.467 0.414 0.104 0.0058 12
246 830 Double 250–425 2.92 46.55 24.2 51.99 1.07 0.55 0.414 0.104 0.0058 17
203.5 620 5 160–212 6.44 80.4 46.87 58.3 2.04 0.378 0.477 0.119 0.0021 26
203.5 615 5 160–212 7.2 80.4 46.87 58.3 0.95 0.32 0.614 0.154 0.002 28
203.5 600 3 160–212 5.87 100.28 54 53.85 0.91 0.284 0.489 0.112 0.0023 28
224.3 680 5 150–250 4.3 124.42 46.14 37.08 1.44 0.24 0.444 0.111 0.0099 40
240 745 5 150–250 2.93 47 5.1 10.85 0.82 0.12 1.4 0.138 0.0159 28
246 830 Double 150–250 4.7 49.37 40.81 82.66 1.38 0.263 0.524 0.131 0.0044 28
246 830 Double 150–250 4.4 31.05 23.5 75.68 2.02 0.136 0.524 0.131 0.0045 17
224.3 670 Double 150–250 4.1 45.52 24.4 53.6 1.27 0.367 0.629 0.157 0.0022 35
224.3 670 Double 150–250 3.67 66.21 28.87 43.6 1.1 0.387 0.629 0.157 0.0022 30
224.3 790 3 150–250 4.32 127.15 49.46 38.9 1.58 0.575 0.46 0.115 0.0025 36
224.3 750 3 150–250 6.1 120.22 69.66 57.94 1.3 0.3 0.403 0.101 0.0068 45
Table 1. Summary of measured and controlled parameters.
The effect of vent diameter on araneiform morphometry. The effect of vent diameter on the level of branching
and feature morphometry is subtle for our range of grain sizes. We attribute this to not having wide enough
blocks to explore the natural course of araneiform troughs which in some cases are curtailed by vents at the edges
of the blocks. However, in the cases where 5 mm vents were used, troughs reach the edge of where the block
was placed and the central depressions are noticeably wide in comparison to the length of araneiform troughs
(Fig. 4). Additionally, the level of branching for the finest three grain size ranges was generally higher when a
smaller 3 mm vent was used.
Because vents were acting at both the sides of the block and at the location of the central hole, in all cases,
short, linear or sinuous furrows also formed at the sides of the block as in26. This was expected as vents would
form at regions where there was a slight gap between the block and the granular surface. In many cases, the
araneiform troughs stopped at the location where the edge of the block was, suggesting that in these instances,
troughs would extend further had there been more distance to the next vent. Double araneiforms formed when
3 mm vents were acting 60 mm apart (Fig. 5). However, no conclusion can be drawn on the influence of vent
separation on araneiform morphometry as our CO2 samples were so small. Vent separation in our cases ranged
only from 50 to 105 mm. A deeper insight to the effect of vent separation on araneiform morphologies could be
achieved by using larger slabs of CO2.
Our initial results indicate that there may be a feedback between vent diameter and araneiform morphometry.
If their starting radial patterns formed in one venting episode, ‘fat spiders’ may have formed by wider vents or
close vent separation, whereas the more dendritic ‘thin spiders’ with small central depressions could have formed
by the action of small vents or wide vent spacing. Additionally, given the sharp difference in morphometry with
grain size and the fact that the distinct Martian araneiform morphologies tend to cluster in separate regions, it
is possible that different levels of regolith consolidation or grain size may influence the different morphologies.
Phase 2: CO2 sublimation efficiency. When a CO2 block was allowed to sublimate on beds of 160–
212 µm and 150–250 µm, a vigorous rapid sublimation process was observed (Video 2). In each experiment, the
block spun and was highly mobile within the container via sublimating gas exerting pressure on surrounding
grains. In each case, the mobility of the block was limited by the floor or walls of the container and it is thought
that the block would have continued on its course if not obstructed. Rapid sublimation continued until the tem-
perature of the granular bed reached ∼ −30 ◦C. Sediment was transported as high as the chamber roof (∼ 0.6 m
above the bed surface) and so we report a lower limit of how high sediment can be transported via this process.
If heat flux was purely through solid contacts and radiation there would be little difference between sublima-
tion mass fluxes under Martian and Terrestrial atmospheric conditions for the sand temperatures. However,
Scientific Reports | (2021) 11:6445 | https://doi.org/10.1038/s41598-021-82763-7 11
Vol.:(0123456789)www.nature.com/scientificreports/
Figure 8. Araneiform development hypothesis suggesting araneiforms formed in a paleoclimate and their
activity today is not growing existing radial araneiforms. (a–d) Show initial araneiform development as
suggested by Kieffer and P iqueux3, 9. (e–j) However we suggest that a radial structure develops initially and
grows each MY during this paleoclimate which is conducive to more energetic cryoventing. (k, l) Show the
present day Martian climate where fans and spots still reappear, however we suggest the terrain is not eroded
and fans and spots are recycled dust transported by a much more diffuse plume than in (c, f, i). Source:
Collaboration between Wax Visuals and LEM. Wax visuals created the artistic representation of the araneiform
development hypothesis.
under Martian conditions since the pressure is more than 100 times lower the same mass flux will give rise to
a volume flux that is 100 times larger and thus velocities that are 100 times larger. This will massively increase
the erosional capacity of the flow since this scales as U 2. In addition the flow is more likely to be turbulent and
have a higher turbulence intensity thus increasing heat transport. Thus we do also expect a higher sublimation
mass flux of CO2 under Martian atmospheric pressure since this is set by the heat transport. In one experiment
the mass flux increased by a factor of 16. In each case, sediment was transported out from the container to the
surroundings of the chamber. As outlined in “Methods”, the percentage volume of material transported out of
the container was calculated in each case. This ranged from 6 to 16% of material ejected from the confinement
of the container resulting in ∼ 8–27% of material excavated by CO2 sublimation per kg of CO2.
Extrapolating these values to the amount of CO2 required to mobilise a 1000 m 313 volume araneiform on
Mars is not informative as the situation involved in the subsurface heating of regolith beneath an ice overbur-
den is vastly different to a buried CO2 ice block. The former is a gradual process and not all faces of the CO2
layer would be exposed to warm regolith. Additionally, the scaling differences in sediment ejecta distances are
significant, as well as the differences in T compared to Mars. The extreme difference in ice mass and thickness
will introduce factors which affect sublimation efficiency, as well as differences due to lower gravity on Mars.
A detailed numerical model will be required to exploit the data reported here in order to further understand
the vast scale of the araneiforms of the SPLD on Mars. Modelling will provide a better understanding of the
energy budget to erode these large-scale patterns in few instances under a different climate. However, we have
provided a first step in empirically investigating the efficiency of sublimating CO2 ice as an agent of the transport
of granular material. Both the qualitative (observational) and quantitative data may be drawn upon in order to
test, refine and develop models of CO2 sublimation under Martian conditions; for example, ejecta volumes per
Scientific Reports | (2021) 11:6445 | https://doi.org/10.1038/s41598-021-82763-7 12
Vol:.(1234567890)www.nature.com/scientificreports/
mass CO2 may elucidate whether the Recurring Diffusive Flows (RDFs) recently observed surrounding linear
dune gullies35, are darker albedo subsurface material ejected laterally via sublimation as CO2 blocks slide down
dune slopes and bury at their termini.
Nonetheless, we have shown that radial araneiform patterns in the laboratory can begin in one venting event.
From our observations that on the lab scale at least, araneiforms can begin as one radial structure, and erosion
efficiency appears to depend on grain size and vent width, we hypothesise that it may be possible for Martian ara-
neiforms to begin their lifetime as a radial pattern which eventually grew outward by successive events, perhaps
in a climate more conducive to more energetic sublimation with more intense insolation/higher temperatures
(Fig. 8a–d) during the planets changes in obliquity, or when regolith was less consolidated. If the radial patterns
of Martian araneiforms did indeed form in a past climate, it is possible that that a smaller scale radial pattern
was carved and troughs eventually widened, lengthened and deepened over time to form the giant structures
visible on Mars today (Fig. 8g,h). As previous authors have suggested22, it is possible that the existing topography
provided by the araneiforms causes points of weakness (Fig. 8d) whereby overlying ice is more likely to crack
seasonally. However, the underlying material may be too consolidated to be eroded further today or present day
climate conditions are not conducive to the energy required to erode coarser or more consolidated granular
material. It is plausible that the dark fans and spots which appear annually in similar locations are therefore
recycled dust which deposits in autumn and settles into the negative topography of the araneiforms. Only 7 MY
have been monitored by HiRISE and limited temporal studies have been c onducted2. The upcoming extended
Planet Four: Terrains2,11,12 campaign results, along with extensive numerical modelling and comparison with
predicted past climatic conditions from Global Climate Models are opportunities for further insights on whether
this is the case, or whether the araneiform troughs continue to grow over time.
Conclusion
We have reported the first physical observations of (1) araneiform formation and (2) plume activity and have
reconciled feature with process on the laboratory scale. We show that sublimation rates under Martian pressure
can be an order of magnitude larger than those on Earth due to enhanced turbulent heat transport. We find
that the area covered by araneiforms on the laboratory scale decreases with increasing grain size suggesting that
regions of different regolith consolidation or grain size on Mars might constrain the varied araneiform morpho-
metries. We report that the level of branching of araneiforms increases with (1) decreasing grain size and (2)
smaller vents, lending further credence to the proposal that this is governed by the Shields parameter. We find
that wider centres result from wider vents and that shorter, more consistent width troughs are formed on coarser
grain sizes, suggesting that perhaps the ‘fat’ spider morphologies are generated at lower Shields parameters and
that classic, ‘thin’ spiders form with smaller vents or finer grains at higher Shields parameters. We show that
radial dendritic araneiform patterns can form in one venting process and at this scale, do not require multiple
events to cause singular dendritic structures to connect at a central point. We offer an alternative hypothesis that
radial araneiform patterns developed in one or few instances in a past climate and that perhaps trough dimen-
sions grew over multiple MY. We suggest rigorous temporal surveys of araneiforms over multiple MY will shed
light on whether dust ejecta originate from the troughs or are merely seasonal dust deposits which are recycled
annually in this unique geomorphic process which is unlike any on Earth.
Received: 26 July 2018; Accepted: 18 January 2021
References
1. Bourke, M. C. & Cranford, A. Seasonal furrow formation on Mars polar dunes, vol. 1623. in Fifth International Conference on Mars
Polar Science and Exploration, LPI Contributions, 6059 (2011).
2. Portyankina, G., Hansen, C. J. & Aye, K.-M. Present-day erosion of Martian polar terrain by the seasonal CO 2 jets. Icarus 282,
93–103 (2017).
3. Piqueux, S., Byrne, S. & Richardson, M. I. Sublimation of Mars’s southern seasonal CO 2 ice cap and the formation of spiders. J.
Geophys. Res. (Planets) 108, E8 (2003).
4. Thomas, N., Hansen, C. J., Portyankina, G. & Russell, P. S. HiRISE observations of gas sublimation-driven activity in Mars’s southern
polar regions: II. Surficial deposits and their origins. Icarus 205, 296–310 (2010).
5. Nier, A. O. & McElroy, M. B. Composition and structure of Mars’ upper atmosphere: Results from the neutral mass spectrometers
on Viking 1 and 2. J. Geophys. Res. 82, 4341–4349 (1977).
6. Leighton, R. B. & Murray, B. C. Behavior of carbon dioxide and other volatiles on Mars. Science 153, 136–144 (1966).
7. Smith, D. E., Zuber, M. T., Neumann, G. A. Seasonal variations of snow depth on Mars. Science 294, 2141–2146. https://doi.
org/10.1126/science.1066556. (2001).
8. Aharonson, O. et al. Depth, distribution, and density of CO 2 deposition on Mars. J. Geophys. Res. (Planets) 109, E05004 (2004).
9. Kieffer, H. H., Christensen, P. R. & Titus, T. N. CO 2 jets formed by sublimation beneath translucent slab ice in Mars’ seasonal south
polar ice cap. Nature 442, 793–796 (2006).
10. Malin, M. C. & Edgett, K. S. Mars Global Surveyor Mars Orbiter Camera: Interplanetary cruise through primary mission. J. Geo-
phys. Res. Planets 106, 23429–23570 (2001).
11. Schwamb, M. E. et al. Planet Four: Terrains—Discovery of araneiforms outside of the South Polar layered deposits. Icarus 308,
148–187 (2018). (1708.07858).
12. Hansen, C. J., Schwamb, M. E., Portyankina, G. & Aye, K.-M. Planet Four: Terrains—Araneiform in the South Polar Region of
Mars. in Lunar and Planetary Science Conference, vol. 48 of Lunar and Planetary Science Conference, 2812 (2017).
13. Hansen, C. J. et al. HiRISE observations of gas sublimation-driven activity in Mars’ southern polar regions: I. Erosion of the surface.
Icarus 205, 283–295 (2010).
14. Hao, J., Michael, G. G., Adeli, S. & Jaumann, R. Araneiform terrain formation in Angustus Labyrinthus, Mars. Icarus 317, 479–490
(2019).
Scientific Reports | (2021) 11:6445 | https://doi.org/10.1038/s41598-021-82763-7 13
Vol.:(0123456789)www.nature.com/scientificreports/
15. Paige, D. A., Bachman, J. E. & Keegan, K. D. Thermal and albedo mapping of the polar regions of Mars using Viking thermal
mapper observations: 1. North polar region. J. Geophys. Res. 99, 25959–25991 (1994).
16. Paige, D. A. & Keegan, K. D. Thermal and albedo mapping of the polar regions of Mars using Viking thermal mapper observations:
2. South polar region. J. Geophys. Res. 99, 25993–26013 (1994).
17. Kossacki, K. J. & Leliwa-Kopystyński, J. Non-uniform seasonal defrosting of subpolar dune field on Mars. Icarus 168, 201–204
(2004).
18. Matson, D. L. & Brown, R. H. Solid-state greenhouse and their implications for icy satellites. Icarus 77, 67–81 (1989).
19. Langevin, Y. et al. Evolution of the seasonal caps of Mars observed by OMEGA on Mars express. In Seventh International Confer-
ence on Mars, vol. 1353 of LPI Contributions, 3246 (2007).
20. Kieffer, H. H. Cold jets in the martian polar caps. J. Geophys. Res. Planets. 112. https://doi.org/10.1029/2006JE002816 (2007).
21. de Villiers, S. et al. Formation of Martian araneiforms by gas-driven erosion of granular material. Geophys. Res. Lett. 39, L13204
(2012).
22. Thomas, N., Portyankina, G., Hansen, C. J. & Pommerol, A. HiRISE observations of gas sublimation-driven activity in Mars’s
southern polar regions: IV. Fluid dynamics models of CO 2 jets. Icarus 212, 66–85 (2011).
23. Kaufmann, E. & Hagermann, A. Experimental investigation of insolation-driven dust ejection from Mars’ CO 2 ice caps. Icarus
282, 118–126 (2017).
24. McEwen, A. S. et al. Mars Reconnaissance Orbiter’s High Resolution Imaging Science Experiment (HiRISE). J. Geophys. Res. Planets
112, E05S02 (2007).
25. Piqueux, S. & Christensen, P. R. North and south subice gas flow and venting of the seasonal caps of Mars: A major geomorpho-
logical agent. J. Geophys. Res. Planets 113, E06005 (2008).
26. Mc Keown, L. E., Bourke, M. C. & McElwaine, J. N. Experiments on sublimating carbon dioxide ice and implications for contem-
porary surface processes on Mars. Sci. Rep. 7, 14181 (2017).
27. Sylvest, M. E., Conway, S. J., Patel, M. R., Dixon, J. C. & Barnes, A. Mass wasting triggered by seasonal CO 2 sublimation under
Martian atmospheric conditions: Laboratory experiments. Geophys. Res. Lett. 43, 12 (2016).
28. Sylvest, M. E. et al.CO2 sublimation in martian gullies: Laboratory experiments at varied slope angle and regolith grain sizes. Geol.
Soci. Lond. Spec. Publ. 467, 343–371. https://doi.org/10.1144/SP467.11 (2018).
29. Leidenfrost, J. G. On the fixation of water in diverse fire. Int. J. Heat Mass Transfer 9, 1153–1166 (1966).
30. Diniega, S. et al. A new dry hypothesis for the formation of Martian linear gullies. Icarus 225, 526–537 (2013).
31. Westoby, M., Brasington, J., Glasser, N., Hambrey, M. & Reynolds, J. ‘Structure-from-Motion photogrammetry: A low-cost, effec-
tive tool for geoscience applications. Geomorphology 179, 300–314 (2012).
32. Strahler, A. N. Hypsometric (area-altitude) analysis of erosional topography. GSA Bull. 63, 1117 (1952).
33. Bourke, M. C. The formation of sand furrows by cryo-venting on Martian dunes. Lunar Planet. Sci Conf. 44, 2919 (2013).
34. Bridges, N. T. et al. Investigation of the Bagnold dunes by the Curiosity rover: Overview of initial results from the first study of an
active dune field on another planet. Lunar Planet. Sci. Conf. 47, 2298 (2016).
35. Pasquon, K., Gargani, J., Massé, M. & Conway, S. J. Present-day formation and seasonal evolution of linear dune gullies on Mars.
Icarus 274, 195–210 (2016).
Acknowledgements
Europlanet 2024 RI has received funding from the European Union’s Horizon 2020 research and innovation
programme under Grant agreement 871149-EPN-2024-RI (17-EPN3-069). L.E.M.’s contribution was funded
by the Irish Research Council (project 204432, award 13626). J.N.M’s contribution was funded by the NASA
Mars Fundamental Research Program (award NNX14AO21G). M.C.B’s contribution was supported in part by
EU FP7 CIG 618892. M.R.P. acknowledges support from the UK Space Agency under Grant ST/R003025/1. We
thank the anonymous reviewers for dedicating their time to help us to enhance this paper.
Author contributions
L.E.M., M.C.B. and J.N.M. developed the research aims, objectives and methodology involved in the experi-
ments. L.E.M. carried out the experiments with extensive input from M.E.S and M.R.P. M.E.S. conceived the
idea and constructed the pulley used to lower the CO2 blocks. M.E.S. and M.R.P. led chamber operation and
maintenance. J.N.M. contributed the discussion of the mathematics surrounding the Shields Parameter and its
influence on araneiform morphometry. Table 1, all figures and the plots in Fig. 3 were developed by L.E.M. The
authors acknowledge Wax Visuals for their artistic rendering of Fig. 8. DEM production and analysis of aranei-
form morphometry was carried out by L.E.M. with significant input from M.C.B. L.E.M. led the writing of this
manuscript with input from all authors.
Competing interests
The authors declare no competing interests.
Additional information
Supplementary Information The online version contains supplementary material available at https://doi.
org/10.1038/s41598-021-82763-7.
Correspondence and requests for materials should be addressed to L.M.K.
Reprints and permissions information is available at www.nature.com/reprints.
Publisher’s note Springer Nature remains neutral with regard to jurisdictional claims in published maps and
institutional affiliations.
Scientific Reports | (2021) 11:6445 | https://doi.org/10.1038/s41598-021-82763-7 14
Vol:.(1234567890)You can also read