STATE OF ECOMMERCE REPORT - Neto
←
→
Page content transcription
If your browser does not render page correctly, please read the page content below
Home

 Introduction

Year in Review

Performance
 by Vertical

  Payments

                 STATE OF
                 ECOMMERCE
Marketplaces

                 REPORT
                       2018
  Shipping

  Search &
  Marketing

                              1
Home
     Home

                 CONTENTS
 Introduction               INTRODUCTION________________________________ 3

                            YEAR IN REVIEW_______________________________ 5
Year in Review

Performance
                            PERFORMANCE BY VERTICAL___________________9
 by Vertical

                            PAYMENTS____________________________________23
  Payments

                            MARKETPLACES______________________________29
Marketplaces

                            SHIPPING__________________________________ 32
  Shipping

                            SEARCH & MARKETING_______________________ 37

  Search &
  Marketing
                            ECOMMERCE PREDICTIONS 2019______________ 43
                                                                              2
Home
                   INTRODUCTION
                   With healthy growth across the board for online retail in
                   2017-18, this year has been the one where ecommerce has
                   cemented its footing as the future of retail. But it hasn’t been
 Introduction
    Introduction   without excitement.

                   It was the year Amazon launched into Australia and we had
                   front row seats to the ensuing competitive plays put up by
Year in Review     the likes of eBay, Catch and Kogan, resulting in the bar for
                   retail being pushed to new highs through innovation and the
                   improvement of both the merchant and consumer experience.

Performance
                   We experienced a healthy bout of nostalgia upon learning
 by Vertical       that the magical fantasy world of our childhoods, Toys R
                   Us, was shutting forever. The imminent closure of Australian
                   luxury handbag retailer, Oroton, was saved at the final hour
                   by a takeover bid from a major shareholder, and 37 year-
  Payments         old iconic footwear brand, Diana Ferrari, closed all of their
                   17 bricks and mortar stores (albeit to focus on their online
                   channels).

Marketplaces

  Shipping
                   It’s also been the year that a number of other bricks and
                   mortar retailers, including Spanish fast fashion brand Zara,
                   have launched online arms to boost falling in-store sales.

                   But amidst the tumult, ecommerce has emerged as the leader,
                   forging ahead stronger than ever.

                   Regardless of their size, we’re seeing most
                                                                                      “
  Search &         Australian retailers adapt to the evolving
  Marketing
                   shopping preferences of consumers.

                                                                                          3
The online shopping industry in Australia is now worth
                 $23 billion and is growing at a much more rapid rate than
                 traditional retail. In fact $1 in every $20 is now spent online,
   Home          where there’s no need to battle traffic, car parks, and heaven
                 forbid—other people. Instead, shoppers are choosing to
                 purchase from the comfort of their own homes, or on the go,
                 24 hours a day.
 Introduction
Introduction
                 Consumers are seeking convenience, low prices and
                 personalised experiences all the way from first touch through
                 to delivery and after-sales service. Consistency and high
                 quality experiences are now expected regardless of channel
Year in Review
                 or device, whether the interaction is via a website, online
                 marketplace, social media, bricks and mortar store, phone, or
                 email. In fact by 2020 it’s estimated that shoppers will value
                 experience over price.
Performance
 by Vertical
                 Retailers and wholesalers of all sizes are having to actively
                 adapt to these changing consumer preferences and
                 behaviours. But this year, it’s no longer about multi-channel,
  Payments
                 or even omni-channel retail; the onus is on unifying your
                 commerce in order to gain a single view of the customer and
                 a single view of the order.

                 With our merchants processing billions through the
Marketplaces     Neto platform in the past year alone, we looked at the
                 transformation of ecommerce over 2017-18 to bring you data,
                 insights and trends from thousands of merchants representing
                 a range of verticals and business-sizes, as well as data from
  Shipping
                 a selection of our leading industry partners including eBay,
                 Google, PayPal, Sendle, and SmartrMail.

  Search &       Ryan Murtagh, Neto CEO
  Marketing

                                                                                    4
Home

 Introduction                 YEAR IN REVIEW
 Year
Year    in Review
     in Review

Performance
 by Vertical

  Payments

Marketplaces

  Shipping

  Search &
  Marketing

Molten Store, Neto Merchant                    5
Ecommerce Snapshot 2017/18
                  Fashion first for online retail
    Home
                  Performance across all verticals was strong this year, with total    Fastest growing       Biggest spenders
                                                                                       vertical
                                                                                                             Food &
                  sales for Neto merchants across all categories increasing by

                                                                                       Fashion
                  30%, on average. The future of Fashion seems all sewn up with

 Introduction
                  this category boasting the highest growth in sales across the
                  board, increasing by 57% year-on-year. Homewares was the                                   Alcohol
                                                                                                             $168
                  second fastest growing industry by total sales (55%) followed
                  by Motor Parts (49%). We also measured average monthly
                  sales, which grew by an average of 13% year-on-year across all
Year
 Year in Review
      in Review   verticals, increasing the most for Homewares.

                        SALES GROWTH BY VERTICAL (YOY)
 Performance                                                                               Busiest month        Quietest month
                                                                    57%

                                                                                            Nov                  July
  by Vertical                     Fashion

                              Homewares                            55%
                              Motor Parts                      49%
  Payments
                          Health & Beauty                37%
                           Pets & Animals               35%
                      Sports & Recreation           28%
 Marketplaces                                                                                                Average
                                   Gifting        23%                                                        basket size
                        Electronics & HiFi       22%                             Average increase in YoY
                                                                                                     Sales
                                                                                                             $130
   Shipping               Toys & Hobbies

                        Tools & Hardware

                                             14%
                                                 21%
                                                19%                              30       %
                          Food & Alcohol

  Search &                     -26%           Supplements & Nutrition                                          5%
  Marketing                                                                                                    YoY

                                                                                                                                 6
In terms of how much consumers are spending in each
transaction across all verticals, it’s $5 more than last year, at
AVERAGE MONTHLY SALES $130 per transaction. Average basket size was the highest
Home GROWTH BY VERTICAL (YOY) for Food and Alcohol, where shoppers spent an average
of $168 per transaction. Tools and Hardware came a close
second with retailers bringing in an average of $162 in each
Homewares 54% transaction, and Supplements and Nutrition had the lowest
Introduction basket size at a still-considerable $89.
Fashion 41%
The verticals that experienced the greatest growth in
Health & Beauty 19% spending were Homewares, which climbed 25% year-on-
Gifting 15% year, and Electronics and Hi-Fi (18%).
Year
Year in Review
in Review
Food & Alcohol 13% The busiest time of year for merchants was November—the
beginning of the holiday season—where they brought in
Tools & Hardware 12% around $7,000 in additional sales. Interestingly, December
Performance
was less busy than May for a number of our verticals,
by Vertical Motor Parts 9% indicating that many consumers have their Christmas
shopping done and dusted well before crunch time.
Electronics & Hi-Fi 6%
Unsurprisingly, July was the quietest month of the year,
Payments
Toys & Hobbies 3% with retailers experiencing a dip in sales after solid end of
financial year sales in June.
Pets & Animals 2.6%
-6% Sports & Recreation AVERAGE BASKET SIZE BY VERTICAL
Marketplaces
Supplements $162 $168
-45% & Nutrition $138 $143 $145
$113 $113 $114 $116 $117 $120
Shipping $89
Average increase
Search &
13%
itio s
ion
Be lth &
im &
& H ics
bb &
g
res
ati &
rts
rd ls &
co &
Marketing
utr ent
n
ty
als
i
ies
on
re
l
ftin
i-F
ho
An ets
Ho oys
cre rts
Al od
Pa
on
wa
sh
wa
au
Ha Too
& Nplem
a
Re po
Gi
Fo
P
T
ctr
Fa
tor
He
me
S
Ele
Mo
7
Ho
p
Su
MERCHANTS BY LOCATION
                  The geographic spread of merchants roughly corresponds to the
    Home          population distribution of Australia, with 87% of merchants based on
                  the East coast of Australia.

 Introduction

Year
 Year in Review
      in Review

 Performance
  by Vertical

  Payments                                                               87         %

 Marketplaces

   Shipping

  Search &
  Marketing

                                                                                         8
Home

 Introduction

Year in Review

Performance
  Performance
      Industries
 by by
    Vertical
       Vertical

  Payments

Marketplaces

                               PERFORMANCE
  Shipping
                               BY VERTICAL
  Search &
  Marketing

Edible Blooms, Neto Merchant                 9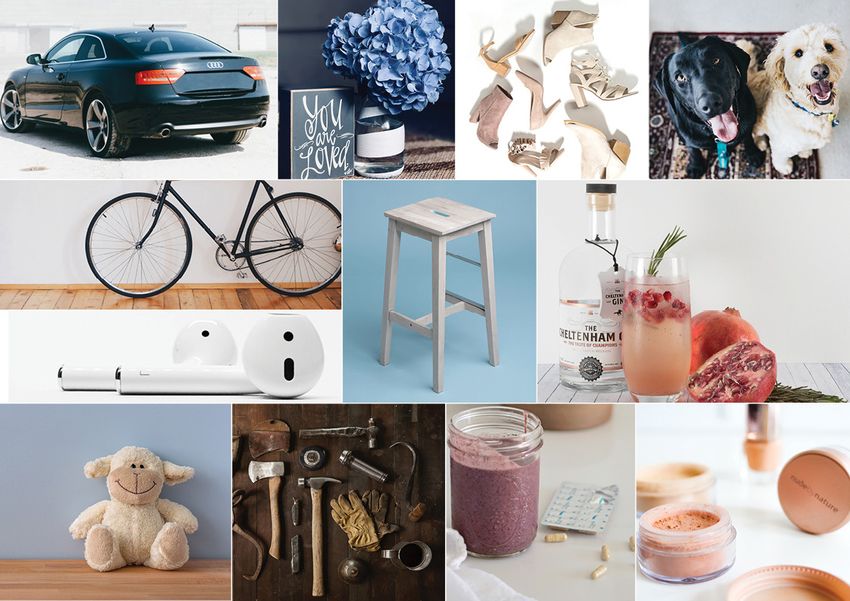
Motor Parts    Gifting               Fashion          Pets & Animals

   Home

 Introduction

                                                                                               Food & Alcohol
Year in Review

 Performance
Performance
  Industries
  byVertical
     Vertical
 by
                                  Sports & Recreation
                 Electronics
  Payments
                 and Hi-Fi

                                                        Homewares
Marketplaces
                 Toys & Hobbies                                                     Health &
                                                                                    Beauty

  Shipping

  Search &
  Marketing

                                                                    Supplements &
                                         Tools & Hardware           Nutrition                              10
ELECTRONICS AND HI-FI
Charging ahead with smarter devices
Home
Worth a massive $3 billion in Australia, the online Electronics This shift indicates that consumers are spending more in
and Hi-Fi market continues to charge ahead. With the each transaction, despite paying lower prices for products
average Australian household now home to 17.1 connected as a result of widespread discounting. Part and parcel of
Introduction
devices, growth in this category is driven by rising demand today’s electronics industry, heavy price competition and
for personal devices like smartphones, tablets, and laptops, rising overheads have prompted many traditional retailers
as well as advanced IoT connected devices touted to improve to transfer their businesses to online, where margins are
our lives, like Google Home and Alexa, smart TVs and smart better and the audience is larger. A number have also found
Year in Review refrigerators. Coupled with the falling prices of electronic success moving to a hybrid omni-channel model. One such
goods, being connected is now cheaper, easier and cooler example is one of the biggest players in this category, JB Hi
than ever before, representing significant opportunities for Fi, who reported 32% growth of their online channels in 2017,
retailers in this category. compared to just 9.4% growth overall.
Performance
Performance
Industries
byVertical
by Vertical
November brought in the highest monthly sales for our
Total sales for Neto merchants in this category grew 22% year-
merchants, 15% higher than in the quietest month, which
on-year. Basket size for electronics purchases was $116, with
was July. This effect could be a result of pre-Christmas
year-on-year growth at 18%, the second highest category for
promotions, gift buying, and also a number of online sales
Payments growth after Homewares (25%).
events that run in November, like Click Frenzy, which is
renowned for bottom-dollar bargains on electronics like
OLED TVs.
Marketplaces
Sales growth Devices/household Average Monthly Value of the market
22 %
17 $3b
basket size sales growth
Shipping
$116 6%
Search & 18%
Marketing YoY
11FASHION
Online is the new black for fashion retailers
Home
Finishing out the year as our top performing category by Single’s Day and the weekend of Black Friday-Cyber Monday
sales growth, Fashion had another strong year, increasing total all occur in November, driving the number of sales to almost
sales by an average of 57%. Average monthly sales for fashion double that of the quietest month, July, and slightly higher
Introduction
also grew an impressive 41%, the second highest growth for than December. Spending was the lowest at the beginning
all categories and double that of the industry average, behind of the year, when shoppers are financially hungover from the
Homewares at 55%. festive season, spending $20 less in each transaction.
Year in Review Average basket size for fashion retailers was $113, with a small Over the last year, we’ve seen a number of bricks and mortar
year-on-year increase of 7%. The rise may be the outcome fashion retailers like Zara set up shop online, but we’ve also
of successful cross-sell and up-sell strategies; an extra pair of seen a similar trend in the other direction—pure-play online
earrings or a bag at checkout. On the other hand the change retailers are foraying into the physical world with markets
Performance
Performance
Industries
could be customers trying to get more bang for their shipping and pop up shops. Retailers in this vertical will succeed with
byVertical
Vertical
by buck—if they’re paying for shipping at all, that is. Smart sellers the help of a unified platform that allows them to move
are finding the sweet spot that incentivises shoppers to seamlessly between channels.
cross the threshold and spend more to secure free shipping,
whether that’s $50, $100 or $150.
Payments
16% of fashion purchases were made through pay later, with Sales growth Monthly
57
sales growth
%
41
services like Afterpay, ZipPay, and ZipMoney coming to the
rescue for those last-minute wardrobe meltdowns. Combined
with speedy delivery (2 hours in some metro regions) and free
%
Marketplaces
and easy returns, pay later purchases for the weekend ahead
come with zero risk.
Average
basket size
$113
Shipping
The fashion industry is subject to a variety of market forces:
advancements in technology, logistics and inventory, concerns
about fast fashion and sustainability, and seasonal changes
and sales events—the latter of which causes sales to fluctuate
substantially over the year. The most pronounced effect
Search &
Marketing
of this can be seen in November—the month of the online 7%
shopping events and pre-Christmas sales. Click Frenzy, YoY
12FOOD AND ALCOHOL Highest average Sales growth
14 %
basket size
No. 1 for credit card transactions
$168
Home
Food and Alcohol retailers achieved solid growth this year—
increasing sales by 14% year-on-year. A slight lift (2.4%) was also
seen in order value over the year, with $168 on average spent per
Introduction
transaction; the highest of all the verticals. With the offline market
for alcohol dominated by large franchises like Dan Murphys and
Woolworth’s owned BWS, ecommerce has opened up the market
Year in Review
to many smaller boutique retailers, selling specialty food and
alcohol products and non-perishable groceries.
Monthly
sales growth #1 for credit
13 % card transactions
72%
It’s not surprising that we see the greatest number of sales for this
vertical in November and December, coinciding with Christmas
Performance
Performance
Industries and end-of-year festivities where a bottle of wine or hamper is a
byVertical
by Vertical
go-to gift. Average basket size also increases during these months
to $175, with the generosity of the holiday spirit encouraging
shoppers to open their hearts and purses. This category brought
in the highest proportion of credit card purchases—72% of all food
Payments
and alcohol purchases were made on credit, with 26% on PayPal,
and just 2% via pay later.
HOW ARE CUSTOMERS PAYING?
26+72+2A
Demand for premium liquor and increasing diversity of dietary
Marketplaces and allergen requirements is driving growth of the food and
alcohol vertical. Gluten free, dairy free, organic, vegan, FODMAPS;
they all come with a loyal following in search of high quality Pay later:
Credit 2%
products to meet their unique needs, and they are ready to spend. card: 72%
Shipping Retailers in this category will succeed by identifying and cultivating
brand advocates and building a community around their products.
PayPal: 26%
Search &
Marketing
13Average Sales growth GIFTING
23 %
basket size Spending soars a lovely 20% in February
$120
Home
It’s becoming more commonplace, more acceptable and more
convenient to buy gifts online. But it’s not just those on the
receiving end who are enjoying the fruits of the gifts; retailers
8%
Introduction
are too with a 23% increase in year-on-year sales which is a
gift in-itself!
YoY
20
This industry is seasonally affected by celebration days like Mother’s
Year in Review
Monthly
sales growth % Day, Father’s Day, and of course Valentine’s Day, where spending
15
soared to a lovely $148, $29 above the average for the year.
% Increase in spending Christmas is another busy period, where average monthly sales
are quadruple that of January. Gift givers don’t skimp at Christmas
in February
Performance
Performance
Industries either; average basket size for this month was also well above the
byVertical
by Vertical
$120 average—a merry $137.
Gifts tend to be those types of purchases that sneak up on us—a
gift for Jim at work who’s leaving, Jennifer who’s having a baby,
Payments
and oops, that’s right Father’s day is next weekend! That’s why gifts
tend to get put on the plastic, with this being our second highest
HOW ARE CUSTOMERS PAYING? category for credit card spending—69% of all transactions were
charged to credit, compared to just 26% for PayPal. Buying gifts
26+69+5A
Marketplaces online is a luxury with choice, convenience, and speedy postage
helping consumers across the country celebrate those special
Pay later: moments. Many merchants now offer same-day service and the
5% ability to elect a delivery window, which is particularly useful for
Shipping
Credit delivering fresh/perishable goods like flowers and edibles.
card: 69%
Transaction value is slightly down this year; there was small
PayPal: 26% decrease in basket size of 8%, which could be symptomatic of the
increasing competitiveness of the industry pushing prices down.
Search &
Marketing
14HEALTH AND BEAUTY Average Sales growth
37 %
Can you put a price on health and beauty? basket size
$113
Home Yes, $113.
Consumers are becoming more confident buying shampoos,
conditioners and the like online, bundling such purchases into a
single transaction to avoid visiting the shops, as seen in strong
Introduction
year-on-year growth in terms of both total sales (37%) and average
monthly sales (19%). Average basket size remained steady at $113.
Pay later is also impacting this vertical with 6% of transactions Monthly High ROI
made using services like Afterpay and ZipPay. The remainder of sales growth
EMAIL
Year in Review
19 %
transactions were through PayPal (38%) and Credit Cards (56%).
MARKETING
The number of health and beauty purchases peaked in November,
Performance
Performance
perhaps in preparation for the social season; however the very next
Industries
byVertical
by Vertical month, December, was the quietest month of the year, a time when
shoppers may need to allocate funds elsewhere.
Email marketing is a valuable channel for merchants in this
Payments vertical, bringing in the highest average sales per subscriber
(17.8) of all verticals, according to leaders in ecommerce email
marketing, SmartrMail. To take advantage of this trend, having an HOW ARE CUSTOMERS PAYING?
advanced platform with the capability to send tailored product
38+56+6A
Marketplaces recommendations and abandoned cart recovery emails based
on ecommerce data is a must. Similarly, investing in social media Pay later:
advertising and utilising beauty influencers will help reach a new 6%
audience of customers that will deliver high ROI. Credit
Shipping card: 56%
PayPal: 38%
Search &
Marketing TAKE YOUR EMAIL MARKETING FURTHER
Download the free Ecommerce Email Marketing guide.
15HOMEWARES
Furnishing our homes from the comfort of our... homes
Home
The value of the Homewares market in Australia currently sits design, research, and order a whole new living room from the
at $1 billion and is booming, as our top performing vertical comfort of your own… living room.
for 2017/18. Homewares had the strongest year-on-year
Introduction
growth of all verticals in terms of average monthly sales—up This sector is prone to fluctuations in discretionary income
54% from 2016/17. Total sales has also grown by 55%, two as it’s a luxury to be able to replace home items, and the
percentage points behind the leader, Fashion (57%). industry has been disrupted by new entrants in recent years,
like ‘mattress in a box’ brand, Koala. This revolutionary
Year in Review Our homes are an extension of ourselves. Just as we use mattress-buying experience with free delivery, trial, and
fashion as a way to express who we are to the outside world, returns has driven prices down and put the onus on the
the way we decorate our homes—the linen we buy, the art we retailer to deliver value.
hang, the colour of our couch, and the crockery we eat from
Performance
Performance are all carefully choreographed to show who we are to our The industry has also seen strong growth in terms of basket
Industries
byVertical
by Vertical size, up 25% to $150 year-on-year, indicating a willingness
friends, families and visitors.
to spend more online, whether the extra dollars are going
Cheaper homewares stores like Ikea have made creating towards a higher-ticket item, or by bundling additional
a beautiful home accessible to the mainstream, as has the products into a single order.
Payments
abundance of ecommerce stores that make it even easier to
Sales growth
#1 Average Value of the market
55 %
$1b
Marketplaces
basket size
$138
Highest increase in
monthly sales
Shipping
54 %
Search &
25%
Marketing YoY
16Sales growth MOTOR PARTS
49 % Fueled by better choice and fast, cheap and
Home reliable delivery.
Currently valued at $484 million in Australia, the Motor Parts vertical is
enjoying accelerated growth. Total sales for Neto merchants grew a record
Average
40% year-on-year, and in terms of average monthly sales, our merchants saw a
Introduction basket size
$145
9% increase. The value of transactions grew simultaneously, simultaneously, up
5% year-on-year, with average basket size sitting at a healthy $148.
An industry that was traditionally dominated by bricks and mortar stores like
Year in Review Autobarn and SuperCheap Auto, the ecommerce market is claiming significant
market share due to a number of key factors.
5%
YoY Products sold in this vertical include any car, motorcycle or scooter parts or
Performance
Performance accessories that are either replacements for or enhancements to a vehicle.
Industries
byVertical
Vertical
by When shopping online, filtering and finding a part that fits exact specifications
for car make, model, year or variant is much easier than searching in a store.
Highest vertical
And with less overheads and limits on space, online sellers are able to sell a
for Paypal
72
wider range of parts for a wider range of cars, but must be careful to control
Payments
% inventory.
As with the other verticals, online sales for motor parts are fueled by
fast, cheap and reliable delivery, and increasing consumer confidence
Marketplaces in spending online. One important way to build confidence is by offering a
selection of payment methods at checkout so the customer can choose
their preferred option. Offering PayPal—which processed the majority (72%)
of motor parts transactions—is vital. Just 5% of transactions went through
Shipping pay later.
Search &
9
Monthly
% Unlike the other verticals where November was the busiest month, average
sales were the highest for Motor Parts merchants in August and the lowest in
December, indicating that consumers avoid fixing or upgrading vehicles late in
Marketing sales growth the year when cash is required elsewhere.
17PETS AND ANIMALS
35% increase in sales cements our
Home furry friends’ place in the family.
The Pets and Animals category sells a range of pet products to be taken lightly. As the highest users of pay later, it appears
and accessories, food, health products, and treats. Australia that pet owners will buy even when money’s not readily
has one of the highest rates of pet ownership in the world available, with 18% of purchases being made through pay later.
Introduction
with 62% of households owning a pet, and the number is
rising along with sales for online merchants in the industry, The challenges for merchants in this category lie in
which jumped by 35% year-on-year. differentiating from other stores and also fostering loyal
relationships with pet owners. Email marketing statistics
Year in Review Pets are no longer ‘just a pet’ they are a member of the family, show that pet owners typically purchase three times through
which is driving widespread demand for products to enhance email channels, therefore engaging them early on with clever
our pets’ lives. Owners are looking for higher quality products marketing is key. Social media is also a valuable promotional
too; nothing less than the best for Rex. Plus, it’s much more channel for pet merchants, if the growing number of pet
Performance
Performance convenient to have bulky food packages delivered than to lug Instagram accounts and the rise of the ‘pet influencer’ is
Industries
byVertical
by Vertical
them home from the store. anything to go by.
Although as a collective we spend a lot on our furry friends, Peak sales in this category occurred in November and
there’s been little change in the amount we’re spending December; because pets deserve Christmas presents too!
Payments
in each transaction with average basket size remaining
remaining a fairly steady $114. But getting a pet isn’t a decision
Marketplaces
#1 1 in 3
Sales growth Average Busiest month
35 % Nov
basket size
Shipping
for pay later
$114 Households own
a pet
Search &
Marketing
18SPORTS AND RECREATION
A healthy climb in sales
Home
The Sports and Recreation vertical covers any exercise, On the other side of the checkout, merchants are working
sporting and fitness equipment, apparel and accessories, as to decrease the risk of purchasing bigger ticket items, like
well as camping and fishing goods. Worth $449 million in a mountain bike, by creating pseudo-tangible experiences
Introduction
Australia, and growing by 28% in terms of year-on-year sales, through video and tech, building up reviews, and offering
there are a number of key factors contributing to the success free and easy returns.
of this industry.
The amount consumers are spending in online transactions for
Year in Review Australians are becoming more conscious of and proactive sports and recreation climbed slightly to $145 (up 2.7% year-
about health and fitness. Over the last few years there’s on-year). Another heavy vertical for pay later transactions
been a range of government initiatives to promote active (14%), it seems that when Aussies get motivated to improve
lifestyles, camping, and recreational fishing. In addition, fitness or take up a new sport, we don’t want to wait. PayPal
Performance
Performance
Industries more competitive prices and budget options for camping and credit card transactions were fairly comparable at 46%
byVertical
by Vertical
equipment has made this a cheaper holiday alternative for and 40% respectively. November and December were the
many families. The proliferation of health and #fitspo bloggers months that brought in the highest sales for merchants; the
and influencers on social media have also had a massive warmer weather, holidays, and Christmas is prime-time to sell
impact on both cultural and consumer trends. bikes and cricket sets.
Payments
#fitspo
Dec
Marketplaces
Sales growth High use of Average
28 % pay later basket size
Shipping
14 % $143 Busiest month
Search &
Marketing
19SUPPLEMENTS AND NUTRITION
Home
Growth slows with increasing regulation #health
The online Supplements and Nutrition industry is currently Challenges merchants in this vertical face include increasing
worth over $149 million and includes vitamins, herbs and regulation of products, limitations around advertising,
other natural medicines, weight-loss products and sports and competition from supermarkets and pharmacies who
Introduction
and nutrition products like protein powders or nutritional have the ability to offer lower price points and discounted
supplements. This vertical experienced slow growth figures products, which all contribute to the slowed performance of
in terms of sales in 2017/18, and brought in an average basket the industry this year.
size of $89 per transaction.
Year in Review The quietest months in terms of sales were December and
A number of factors are impacting the performance of June. The former, a month of celebration and indulgence
this vertical. One is the increasing health consciousness of where attention to health is conspicuously absent, and
Australians—both young and old. The emphasis is now on the latter, a time when Aussies are in the depth of winter,
Performance
Performance being strong, fit and healthy, rather than just thin, and characterised by the desire for warm, hearty meals, woolly
Industries
byVertical
Vertical health seekers are looking to supplements to support their
by jumpers, and a more relaxed attitude towards exercise.
endeavours. Coinciding with this trend is the explosion of August—the other side of winter—was the busiest month
the number of health and fitness bloggers and Instagram of the year for supplements and nutrition merchants, and
influencers (both male and female) promoting a healthy January was also a good month for sales, as can be
Payments
lifestyle aided by vitamin and supplement products. expected after the holidays and New Year’s Resolutions.
Similarly, the older generations are becoming more aware
of the benefits of natural medicine to aid in everything from
76
osteoporosis to heart disease. HOW ARE CUSTOMERS PAYING?
Marketplaces
$149m
Average
basket size Credit
$89
Shipping card: 20%
Value of the market
Search &
Marketing
+204A
PayPal:
76% Pay later:
4%
20Monthly TOOLS & HARDWARE
sales growth
Hammering home the sales
12 %
Home
Average Tools and Hardware reported another year of steady performance
basket size with total sales growing 19% year-on-year, and average monthly
Introduction
$162 sales growing by 12%. Tool and hardware purchases tend to be
larger, more expensive items, and accordingly the average basket
size of $162 was the second highest of all the verticals. Basket size
remained fairly steady over the year.
Sales growth This industry has the lowest value of transactions through pay
19
Year in Review
% later services (2%), which could be indicative of a couple of things
a) there are fewer merchants in this vertical providing pay later
services, or b) our tradies, home handy-men and DIY-ers are dollar-
Performance
Performance
Industries conscious individuals, preferring to pay upfront (or via credit card).
byVertical
by Vertical
Credit card transactions represented 33% of payments, and PayPal
accounted for 65%.
Regardless, there are significant savings to be gained from
Payments
Marketplaces
65
HOW ARE CUSTOMERS PAYING?
Credit
purchasing online, and this along with a rise in discretionary income
has made the funding of home-improvement projects possible, and
popular—thanks to television shows like Renovation Rescue and
The Block.
November was the busiest month for sales in Tools and Hardware,
Shipping
Search &
Marketing
+332A
PayPal: 65%
card: 33%
Pay later: 2%
bringing in almost double that of the quietest month, which was
July. December sales came a close second, suggesting that DIY-
ers gear up for big holiday projects during this time, and that drills,
toolkits and whipper snippers are still winning presents for those so
inclined.
21TOYS AND HOBBIES Average Sales growth
21 %
basket size
Game on for toy retailers
$117
Home
The Toys and Hobbies industry, consisting of a range of traditional
games and toys, electronic toys, arts and craft products, and
hobby equipment is currently worth $942 million in Australia, with
Introduction
ecommerce representing $70 million of that.
2018 was the year that industry stalwart Toys R Us announced
they would close the doors to their 1600 stores around the Monthly Value of the market
$70m
Year in Review world, and industry growth slowed to just 1.4%. The outlook for sales growth
3 %
ecommerce merchants is positive however, with total sales
for Neto merchants growing by a healthy 21%, and basket size
coming in at $117.
Performance
Performance
Industries
byVertical
Vertical
by Although traditional toys are facing tough competition against new
electronic toys and games, we’re seeing the return of the good
ol’ fashioned board game with family favourites Monopoly and
Scrabble outselling their digital equivalents and a string of newer
Payments
Marketplaces
board games gaining traction. The board game market is expected
to reach $12 billion by 2023.
In a market dominated by tough competition, maintaining a
good reputation, obtaining positive reviews and building a strong
presence on social media is key, as well as having the ability to
meet demand through stock control—not being able to deliver on
promises to parents or children is something to avoid at all costs!
57+367A
HOW ARE CUSTOMERS PAYING?
PayPal:
57%
Credit
card: 36%
Shipping
Pay later: 7%
Search &
Marketing
22Home
Introduction PAYMENTS
Year in Review
Performance
by Vertical
Payments
Payments
Marketplaces
Shipping
Search &
Marketing
Edible Blooms, Neto Merchant 23Home
Introduction
A Wealth of Payment Options
As reports of large-scale hackings become a regular occurrence,
and concerns over security and privacy reach new highs, offering
secure and flexible ways to pay is no longer just a nicety, it’s a
necessity. At the same time, shoppers’ expectations with respect
to how quick and easy making a purchase online should be are
only getting higher. PayPal reported that 43% of mobile shoppers
54+39+7A
HOW ARE CUSTOMERS PAYING?
PayPal:
Credit
card: 39%
will abandon a purchase if it’s too difficult or took too long and 54%
30% get annoyed when a site is not mobile optimised.
Year in Review Most retailers offer a combination of credit card, PayPal and pay Pay later: 7%
later payment options with the majority of payments coming
through PayPal.
Performance PayPal offers shoppers a convenient way to pay online and
by Vertical
remains a favourite due to its ease of use and reputation for
being safe and secure. Over half (54%) of all purchases were
transacted via PayPal this year, down from 73% in 2017. However,
total transaction volume increased by 19%. The verticals that
Payments
Payments transacted the most through PayPal relative to other payment
methods were Supplements and Nutrition (76%) and Electronics
and Hi-Fi (67%).
Marketplaces
Pay later Highest users of PayPal
YoY growth
Supplements
Shipping
122 % & Nutrition
Search &
Marketing
24Credit card transactions (which also include debit cards) accounted for 39% of KEY TAKEAWAY
online transactions, a figure that is up 17% from the previous year, stealing away
a slice of PayPal’s pie and highlighting an increasing confidence using credit Always offer multiple payment
Home cards online. Paying via credit card was most popular in Food and Alcohol, with options and make it as easy as
2 in 3 purchases made via plastic (the digital version). possible for shoppers to navigate
and checkout on your site. Ensure
Pay later performed exceptionally well, doubling in share of spend from 2017
your payment gateway has fraud
to 7% and the value of transactions through services like Afterpay, ZipPay and
Introduction protection and is seamlessly
ZipMoney increasing by 122%. Pets and Animals earned the greatest share of
integrated with your website,
pay later transactions (18%), comparative to credit card and PayPal.
and look for a retail platform that
is PCI compliant.
Year in Review
POPULARITY OF PAYMENT METHOD BY VERTICAL
Performance
Electronics & Hi-Fi 67% 30% 3%
by Vertical
Fashion 40% 45% 15%
Food & Alcohol 26% 72% 2%
Gifting 26% 69% 5%
Payments
Payments
Health & Beauty 38% 56% 6%
Homewares 50% 44% 6%
Marketplaces
Motor Parts 72% 23% 5%
Pets & Animals 49% 33% 18%
Sports & Recreation 46% 40% 14%
Shipping Supplements
& Nutrition
76% 20% 4%
Tools & Hardware 65% 33% 2%
Toys & Hobbies 57% 36% 7%
Search &
Marketing
PayPal Credit Card Pay Later
25Home
Introduction
Mobile Commerce
(mCommerce)
1BuyINonline
8 everyday
There’s no denying that Australian consumers love their
Year in Review smartphones. The PayPal 2018 mCommerce Index revealed
that the number of Australian smartphone users making
purchases and payments on mobile devices remains at an
all time high of 72%. In fact, 37% of Australians now prefer
Performance to make payments or purchases with their mobile, a figure
72%
by Vertical which jumps to 46% for Australians aged between 18-34.
With nearly one-in-eight consumers (12%) now shopping
via mobile on a daily basis, there has been a rise in the
Payments
Payments number of everyday mobile purchases like Food and Drink
Buy from their
and Groceries and Travel. Bill Payments (64%), Clothing and smartphones
Accessories (51%) and Tickets (48%) remain the top three
categories for mCommerce purchases, with Clothing and
Marketplaces
Shipping
Accessories seeing a 5% increase compared to 2017.
There has been a rise in the number of
everyday mobile purchases like Food &
Drink, Groceries and Travel.
“
Search &
Marketing
26mCommerce Drivers MCOMMERCE PURCHASING BY CATEGORY
and Barriers
Home
When it comes to consumer drivers of 64%
Bill Payments 70%
mCommerce, Australians said convenience 74%
(32%), ease of use (23%) and more Clothing & 46%
51%
Accessories 43%
shopping options (22%) were the key
48%
Introduction
reasons behind making more mobile Tickets 51%
53%
payments in 2018. Yet with close to half 45%
Food & Drink 39%
of Australian consumers (47%) annoyed 37%
when sites don’t work on their mobile, it’s 40%
Travel 39%
Year in Review not surprising that 43% of consumers have 38%
abandoned a purchase because it was too Transport
30%
34%
difficult or took too long and a further 30% 28%
have abandoned a purchase because the Grocery 25% 2018
16%
Performance experience wasn’t mobile optimised. 24%
2017
by Vertical Health & Beauty 24%
19% 2016
22%
Subscriptions 21%
22%
Electronics & 22%
WHY MOBILE PAYMENTS?
8%
26%
Payments
Payments Computing 29%
Convenience 32% Toys & Games
19%
19%
21%
Ease of use Increase on
23%
Books & 19% Food and Drink
More shopping options 22% Magazines
20%
29%
Marketplaces 16%
Home & Garden 15%
17%
Shipping
OPTIMISE OR SAY GOODBYE
Fuel
Gambling/
11%
15%
15%
5%
Increase on
17%
Betting Clothing and
Why purchases are abandoned: 11%
Accessories
43% 30%
14%
Online Gaming 11%
12%
12%
Charity 11%
17%
Search & Too difficult or Not mobile
Marketing 11%
takes too long optimised Sporting Goods
11%
27Social Commerce SOCIAL COMMERCE ADOPTION
13% 19%
Home From the launch of Facebook in 2004, to the introduction
of Instagram’s shoppable posts fourteen years later, the
role of social media has evolved significantly. 2018 has
seen consumer adoption of social commerce continue to
Of business sell Of consumers
grow, with close to one-in-five Australian consumers (19%)
Introduction via social media purchase via
making a purchase via social media in the last six months
social media
(compared to 11% in 2017). Of those who shop via social
media, Facebook remains the top destination (81%) followed
by Instagram (25%) and Snapchat (9%).
Year in Review
Currently 13% of Australian businesses sell via social media,
with another 22% planning to sell via social media within SOCIAL COMMERCE SHOPPERS
the next six months. BY CHANNEL
Performance
81%
by Vertical In addition to direct purchases, social media is becoming an
important product discovery tool for Australian consumers.
Twenty-two per cent of Australians said they’ve purchased
an item through an online store after seeing it on social
25%
Payments
Payments
Marketplaces
Social media is becoming
an important product
discovery tool for
“
media, this jumps to 31% for Australians aged 18-34.
9%
6%
Despite growth in social commerce, Australians are still
Shipping
Australian consumers. uncertain about buying from social media platforms. More
than a third (36%) of consumers don’t trust the process of
buying via social media and 38% are concerned about the
safety of their financial information.
Search &
Marketing
28Home
Introduction
MARKETPLACES
Year in Review
Performance
by Vertical
Payments
Marketplaces
Marketplaces
Shipping
Search &
Marketing
Hooked Online, Neto Merchant 29In the Market for New Customers?
Home Shoppers expect a seamless, multi-faceted and personalised Prior to the launch of Amazon in Australia, we conducted
experience from retailers that delivers value and convenience a survey of all Neto merchants to understand how
regardless of the channel they are shopping on, which is marketplaces like Amazon, eBay and Catch fit into our
increasingly an online marketplace. retailers’ business strategies and one of the standout findings
Introduction was that over half of total sales came through marketplaces.
Online marketplaces like eBay, Amazon and Catch offer
goods for sale from third party sellers via their platform, and Although the figure isn’t as high for all merchants across
selling through such marketplaces is now becoming a core all verticals, marketplaces are an important place to find
part of many retailers’ strategies; a tool to both build brand customers nonetheless. In a pre-Christmas survey we
Year in Review
exposure and reach new customers. conducted with our merchants, 60% said that marketplaces
were an important complementary sales channel to bring in
Neto transactional data shows that one third of total online sales over the holidays. Whether marketplaces are a primary
sales value comes through online marketplaces; like eBay, sales channel, or secondary to ecommerce or in-store, it’s
Performance Amazon and Catch; however for a number of our customers clear that they earn their keep year-round.
by Vertical
these figures are much higher.
Payments
MARKETPLACES VS ECOMMERCE WHY SELL IN MARKETPLACES?
When we asked respondents for what reasons they
33% 67%
wanted to sell in marketplaces, this is what they told us:
To bring in new customers
Marketplaces
Marketplaces
To increase sales
To build brand awareness
Exposure to new markets
They’re an important way to gain new
Shipping
Search &
customers. We’re in a niche industry so mass
market advertising isn’t practical. Sites like
eBay put our products in front of people who
might not have found us online.
“ Business expansion
“Marketplaces are key to our business growth -
they allow us to sell to a broader audience without
the huge marketing budgets to direct traffic onto
our website.”
Marketing
30175M
Global customers
Home
Opening Up New Channels
90%
Introduction
With an almost 19 year heritage in Australia, 40,000
Australian sellers and more than 11-million Australians Of items sold are
Year in Review visiting the platform each month – eBay is Australia’s largest brand new
marketplace and favourite shopping destination.
Offering convenience and the lowest prices across an
96%
Performance unrivalled range of products, eBay gives shoppers access
by Vertical
to more than 1 billion listings across eBay’s 190 global
marketplaces.
Of SMB sellers export
eBay continues to innovate to adapt to the changing retail to other countries
Payments landscape. When Australians said that free delivery was
“
the most important factor when shopping online, eBay
introduced membership program eBay Plus, which offers
customers free delivery and returns, as well as exclusive
Marketplaces
Marketplaces access to special deals, and dedicated customer service.
75%
‘Free delivery’ was the
How eBay buyers shop: most important factor
Shipping
Search &
Marketing
60%
vs 40% Half the country
is on eBay.
31Home
Introduction
Year in Review
Performance
by Vertical
Payments
Marketplaces
Shipping
Shipping SHIPPING
Search &
Marketing
Bambella Designs, Neto Merchant 32Signed, Sealed, Delivered
Delivering to every corner of Australia is cheaper, faster
Home
and more reliable than ever before. Technology has come
a long way, now allowing merchants to track an item
from when it leaves your warehouse until it is safe in your
customer’s hands. Similarly, with the right software, you
Introduction
can have visibility over your inventory from the moment
it enters your warehouse, throughout the entire fulfilment
process, and even in the event that the item is returned.
Year in Review As a result of this, merchants are providing a better and
more consistent customer experience, which is in turn
increasing the trust consumers have in shipping. This nicely
coincides with the rise in online purchases we’ve seen
Performance this year; Neto data shows a 49.2% increase in shipping
by Vertical
consignments compared to 2016/17.
When looking at what merchants are shipping, ‘small’ items
are the most common parcel size posted. 66% of parcels
Payments
weigh 0-2kg, 19% 2-5kg, and just 2% are over 25kg.
Size of Proportion of
Marketplaces
Consignment (KG) Parcels Shipped
0-2 Kg 66%
2-5 Kg 19%
Shipping
Shipping
5-10 Kg 7%
10-25 Kg 7%
Search &
Marketing 25 Kg+ 2%
33November is the busiest month for shipping, when 9.6% of the year’s deliveries are made, followed by December, when a
further 9.5% of parcels were shipped. Corresponding to the dip in sales, July was the quietest month with the lowest
number of parcels shipped (7.0%).
Home
10%
9%
Introduction
8%
7%
6%
Year in Review
Jul-17 Aug-17 Sep-17 Oct-17 Nov-17 Dec-17 Jan-18 Feb-18 Mar-18 Apr-18 May-18 Jun-18
Performance The most popular courier is Australia Post eParcel—taking care of 75% of all consignments, followed by Couriers (13%). Sendle
by Vertical
experienced the greatest year-on-year growth in terms of usage, growing by a staggering 144%.
Payments NO. OF CONSIGNMENTS BY NO. OF CONSIGNMENTS BY
SHIPPING CARRIER CARRIER - YOY GROWTH
75
Australia Post Courier (e.g. Fastway
and Couriers Please)
Marketplaces (incl. StarTrack) Sendle 144%
75% 13%
Startrack 58%
Shipping
Shipping Auspost 57%
All others
Fastway 33%
11%
A 1 11 13 +
All others 21%
Search & Sendle
Marketing
1%
34Home
Where in the World Are We Shipping?
As internet access continues to improve, and the Australian Here in Australia retailers are in prime position to make
Introduction
dollar falls relative to the greenback, ecommerce retailers are the most of the opportunity, with international timeframes
increasingly tapping into lucrative new international markets. shrinking, shipping costs becoming ever more competitive,
and a new generation of buyers with great global taste.
While the US and New Zealand continue as areas of high Access to consumers in new overseas markets is no longer
Year in Review demand for Australian online retailers, rapid growth across blocked by the barriers it once was.
Asia Pacific has opened up new market opportunities.
China and India have almost tripled their share of the global For Sendle merchants shipping internationally, New Zealand
economy within the last two decades due to the rise of and the US continue to grow steadily. Merchants are also
Performance the new middle class with access to high-speed internet, shipping to customers as far as Sri Lanka, Norway and
by Vertical
international payment gateways, and money to burn on Puerto Rico.
desirable, high quality Aussie brands.
Payments
TOP 20 COUNTRIES FOR
INTERNATIONAL DELIVERIES
10 1. New Zealand 11. Israel
4
14
Marketplaces 17
3 12
19
2. United States 12. Netherlands
6
5
16 of America 13. China
2 18
15
8 3. United Kingdom 14. Sweden
11 13
20 4. Canada 15. Italy
Shipping
Shipping 5. Germany 16. Switzerland
7 6. France 17. Ireland
7. Singapore 18. Spain
8. Japan 19. Denmark
Search & 1 9. Hong Kong 20. Taiwan
Marketing 10. Norway
35Here at home, for domestic parcel pickups within Australia, For domestic parcel deliveries within Australia, Sendle
Sendle found that retailers from NSW and Victoria were found that those from NSW were the biggest shoppers,
nearly at parity, at 36% and 33% respectively, with these followed by the Victorians and Queenslanders. Folks in
Home figures growing steadily for both states. WA (8%) are slowly catching up as they tap into the web of
entrepreneurial small businesses selling around Australia.
Introduction
36+22+31335A 35+22+53278A
PARCEL PICK UPS BY STATE PARCEL DELIVERIES BY STATE
Year in Review WA 5 % WA 8 %
NT 0% NT 0%
NSW NSW
Performance
by Vertical 36% VIC 35%
VIC 27%
33%
Payments
Marketplaces
TAS 1% TAS 3%
SA 3% QLD 22% SA 5% QLD 22%
Shipping
Shipping
Most parcel pickups: Biggest online
NSW & VIC shoppers: NSW
Search &
Marketing
36Home
Introduction
Year in Review
Performance
by Vertical
Payments
SEARCH &
Marketplaces
Shipping
MARKETING
Search
Search & &
Marketing
Marketing
Wholesale Wedding Superstore, Neto Merchant 37Looking to the Future
Home Building and maintaining your online store is only half
the battle in ecommerce. The other side of it is all
about attracting shoppers to your site or to listings on
marketplaces and converting them into a sale. That’s why
Introduction it’s critical to understand not just your consumer, but
consumer behaviour more broadly, so that you can invest
your marketing budget where it counts. What do consumers
want? How are they searching? What types of marketing
resonates? How do you keep them coming back for more?
Year in Review
We spoke to Google and SmartrMail to get the latest data,
insights and trends in search and email marketing.
Performance
by Vertical
Payments
Marketplaces
Shipping
Search &
Search &
Marketing
Marketing
38REMEMBER ME?
Consumers want consistent, personalised relationships
with brands and retailers.
Home
43% 58%
Search is Changing Expect to be able to Favour companies
Introduction pick up where they left whose mobile sites or
Consumers have the world of information at their
off after abandoning apps remember who
fingertips to find the best products, find the best prices,
a purchase. they are.
and have them delivered now. Google’s data shows just
how search is changing and what retailers need to do to
Year in Review meet these expectations.
RELEVANCY IS KEY
Consumers want relevant, accurate and up-to-date
answers.
Performance CONSUMERS ARE DEMANDING
74%
by Vertical Look for the most relevant information
regardless of the company.
80% increase in mobile searches for Have purchased from a company/brand
Payments
the term ‘best’ in the past two years
53% other than the one they intended to
because information was more relevant.
2x increase in 2x increase
“Top or best in same day
Marketplaces brands” mobile shipping
searches searches PICK UP OR DELIVERY
SHOPPERS VS Offer
BUSINESSES
Shipping
85%+ increase in mobile searches for
“Where to buy (product)”
Expect (or plan to)
Search &
Specified time
slot for deliveries 50% 28%
Search & 3x increase in
Marketing 3x increase
68% 38%
Marketing
in “Near me” “Open now” Click and
searches searches Collect
39EMAIL ENGAGEMENT BY CATEGORY
Home 16% Open Rate
Auto Stores
Email Continues to Deliver
16%
17 CTR
13% Average No. Sales
Beauty Stores per Subscriber
Email marketing consistently generates the highest return 11%
18
Introduction on investment (ROI) of any marketing channel, and
18%
ecommerce stores are no exemption to this. For every $1 Electronics 18%
spent on email marketing, stores sending with SmartrMail Stores 4
see an average ROI of $44. 21%
Year in Review Fashion Stores 17%
5
OVERALL EMAIL ENGAGEMENT General
10%
17%
HIGHEST
AVERAGE
5 SALES
Performance
by Vertical
17% Average
Open Rate 15% Average Click
Through Rate Health
14%
16%
Beauty
& Fitness 5
19%
Stores selling ‘general’ merchandise (often without any Other 18% MOST
focus in terms of product selection) see the lowest levels 9 ENGAGED
Payments Fashion
of engagement with email marketing in comparison to 18%
categories like Fashion and Outdoors. Prevalence of ‘general’ Outdoors 19%
$13
stores is high on the SmartrMail due to their advanced
13%
product recommendation capabilities and many see much Pet 10%
Marketplaces
greater levels of engagement than the industry average for 4
the category. 15%
Toys 18%
1
As for the best performing categories, fashion ecommerce
Shipping
Search &
Search &
Marketing
Marketing
retailers have the best average open rate and very high
CTRs, however when it comes to the average number of
sales per subscriber, they fall short of beauty and cosmetic,
automotive, and outdoor equipment stores. These categories
experience the highest sales volumes relative to their
This data reinforces something we’ve known about
ecommerce and email marketing for a long time: the
stores that perform the best tend to be those that
have found a product niche and have
“
number of subscribers. capitalised on it.
40These numbers are not surprising. Welcome emails have by
far the greatest open rate as people expect to receive and
ENGAGEMENT BY TYPE OF EMAIL often go looking for them after signing up to a mailing list,
Home especially if they were promised a special offer. However
Open Rate CTR Average Revenue these emails also have the lowest CTR.
per Email
In terms of average revenue per email, abandoned cart
12% emails are a clear outlier. This is because they are only sent
Introduction General Email
20%
Newsletters to people who are highly likely to convert seeing as they
$0.06
have already made it all the way to the checkout.
25%
Welcome Emails 9%
$0.11
Although product recommendation and triggered emails
Year in Review are not that different to the open rate of manually-sent email
15% newsletters, the amount of revenue they generate is much
Abandoned
21%
Cart Recovery higher. This is most likely because of the products in these
$27.12
emails being much more tailored to the recipient compared
Performance 12%
by Vertical
Product to generic, manual emails.
Recommendation 18%
Emails $0.52
12%
Triggered Emails 13% ABANDONED CARTS EMAILS
Payments $0.49
STORES
SENDING THEM VS STORES NOT
SENDING THEM
Best performing emails
6.8 4.5
Marketplaces
1. Abandoned cart recovery
Shipping
2. Product recommendation emails
3. Triggered emails
Sending highly targeted emails
“ Average no. sales
per subscriber
Average no. sales
per subscriber
“Abandoned carts emails are crucial
has a much bigger impact on when it comes to generating more
Search &
Search &
the bottom line. sales for your ecommerce store.”
Marketing
Marketing
41The biggest question with email
marketing is always 'what's the best
OPEN RATE
Home
day to send my emails?'.
And it's an important one, because getting it 20%
right can mean the difference between your
emails being opened or not, and hence making a 15%
Introduction
sale... or not.
10%
If you were to do a quick search on Google, no
doubt you'll find a number of studies showing
5%
Year in Review that Tuesday is the best day to hit send, but
SmartrMail's analysis of 36 million emails reveals
that actually, weekends now have the advantage.
Sunday Monday Tuesday Wednesday Thursday Friday Saturday
Performance Sundays were found to have the highest average
by Vertical
open rate at 19.79%, with Saturday close behind
at 19.56%, compared to 18.78% for Tuesdays. CTR
was also higher for weekends than Tuesdays, CLICK THROUGH RATE
with Saturday bringing in slightly more clicks
Payments
4%
(3.38%) than Tuesdays (3.31%).
3%
Marketplaces
2%
Shipping
1%
Search & Sunday Monday Tuesday Wednesday Thursday Friday Saturday
Search &
Marketing
Marketing
42Home
WHERE TO
FOR 2019?
Introduction
Year in Review WITH CEO, RYAN MURTAGH
As online retail continues to grow and evolve, retailers
must adapt to the changing needs of the consumer and
Performance ecommerce landscape in order to remain competitive.
by Vertical
So with 2017/18 behind us, let’s take a look at what the
coming year could bring.
Payments
Marketplaces
Shipping
Search &
Marketing
43These are my predictions:
Home 1. The rise of marketplaces will continue Chat bots will be another technology that finally finds its place,
Amazon and eBay will continue to fight it out for marketplace relieving customer service agents from performing grunt work
dominance in Australia, but it’s consumers who will be the such as order status updates or retrieving shipping tracking
ultimate winners with new innovations, world-class service, numbers. This type of artificial intelligence and machine
Introduction and low prices the prizes. Utilisation of third-party delivered learning won’t take away jobs like some media outlets might
inventory and logistics for Amazon (including Fulfilment by have you believe; instead it will empower SMBs to shift their
Amazon) will increase as retailers look to take advantage limited resources to strategic growth activity.
of their growing loyal customer base and find efficiencies
in servicing this market. In terms of attracting consumers to 4. Voice commerce: we’re all ears
Year in Review
buy on marketplaces, we will see new channels like Voice I’ve mentioned voice commerce a couple of times now, but
Commerce powered by Amazon Alexa begin to really gain it deserves its own dedicated prediction as it will become a
traction. priority for retailers in 2019. According to eMarketer, people
using voice assistants will grow to 76.5 million in 2019 and
Performance
by Vertical 2. Automation won’t just save time retailers will need to optimise their product catalogues to tap
Automation of inventory and fulfilment across sales channels into this growing market. Leveraging marketplaces such as
will become increasingly important, especially with the rise Amazon and eBay as a means to being found through voice
of marketplaces and new ways of buying like social and channels is a key way for retailers to take advantage of this
Payments voice commerce. Efforts to manually manage operations opportunity.
across ecommerce, marketplaces and physical channels will
become near-futile, and businesses that look to automation 5. Unique, personalised experiences will win over
will be the ones that survive in an ever-increasing competitive discounting
environment. Retailers that focus their attention on building a unique brand
Marketplaces
experience that is channel agnostic and aligned to their
3. AI, AR and Chat Bots will secure their place in retail customer values will win out against those that focus on short
We’ve been hearing about Augmented Reality (AR) for some term strategies such as discounting or product diversification.
Shipping time now, but we’ve been yet to see this filter down into the
mainstream in any valuable way. In 2019, AR that has practical Personalised shopping experiences will become the norm
applications will start to make inroads both in-store and in for SMB ecommerce stores. With the integration of machine
home. Think magic mirrors and apps that empower you to learning and AI, a growing list of low-cost solutions are now
experience a product without leaving the house—the ultimate readily available for small retailers to adopt, empowering them
Search & to compete with the likes of Amazon and eBay on this front.
Marketing try before you buy.
44You can also read