STUDENT HOUSING YEAR-END REPORT - FourPoint Investments

Page created by Ronald Waters
 
CONTINUE READING
STUDENT HOUSING YEAR-END REPORT - FourPoint Investments
2
    STUDENT HOUSING
0   YEAR-END
1   REPORT
9
STUDENT HOUSING YEAR-END REPORT - FourPoint Investments
Copyright Notice

This presentation is protected by U.S. and
International copyright laws. Reproduction
and distribution of the presentation without
written permission of the sponsor is
prohibited.

©2020 FourPoint Investment Sales Partners

Chris Epp                                              Chris Bancroft               Meredith McGrath
Direct – 512-649-3400                                  Direct – 512-649-2400        Direct – 512-649-4100
Mobile – 214-448-3285                                  Mobile – 512-705-0212        Mobile – 713-737-5430
cepp@fourpointinv.com                                  cbancroft@fourpointinv.com   mmcgrath@fourpointinv.com

                                                                                         !

Craig Miller                                           Matthew Chase                Address
Direct – 512-649-3020                                  Direct – 512-649-2386        1515 S. Capital of Texas Hwy, Ste. 405
Mobile – 325-423-0244                                  Mobile – 214-215-6232        Austin, Texas 78746
cmiller@fourpointinv.com                               mchase@fourpointinv.com      Main – 512-649-7300
                                                                                    Fax – 512-649-8300
                                                                                                          Cover Photo
                                                                                                          Property: Rise at Riverfront Crossings
                                                                                                          Developer: CA Ventures
Credits: Graphic Design: Naomi Bludworth; Analytical: Craig Miller, Matthew                               University: University of Iowa
Chase, Meredith McGrath, Holden Penn; Editorial: Sarah Foronda                                            Photo: LCP 360
STUDENT HOUSING YEAR-END REPORT - FourPoint Investments
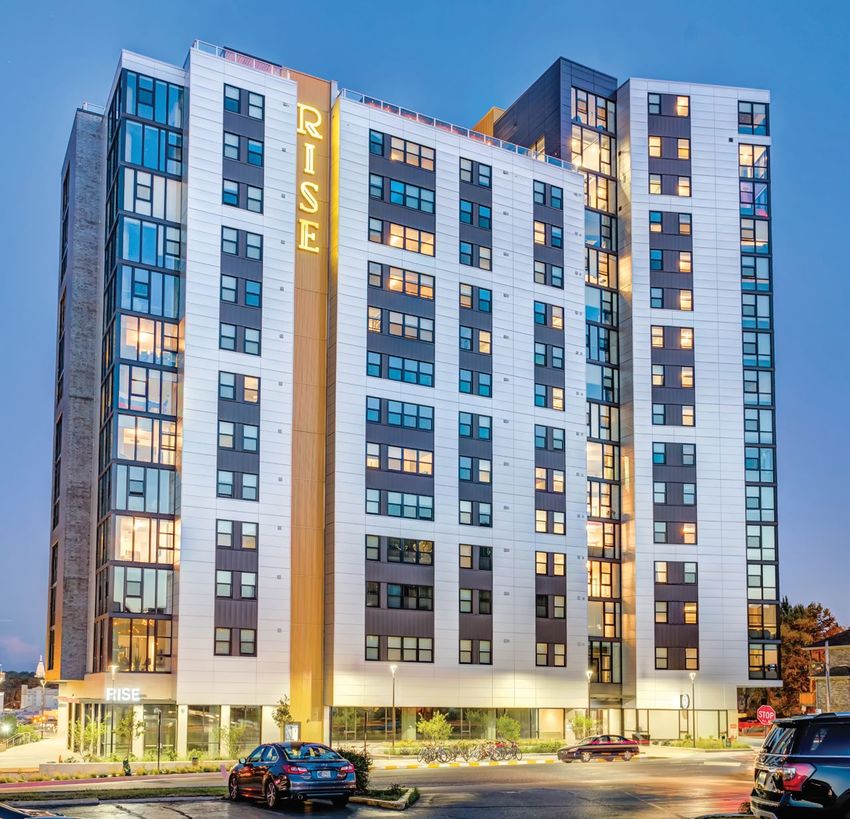
Greetings from FourPoint Investment Sales Partners, and thank
                                                             you for taking time to read our 2019 Student Housing Year-End
                                                             Report. As FourPoint continues to grow and evolve, we have
                                                             a lot to celebrate!

                                                             • Our legacy as the #1 ranked privately-owned investment
                                                               sales platform focused on the national student housing
                                                               industry.

                                                             • Our rapidly expanding capital markets platform.

                                                             • Our record of consistently executing over $1 billion in sales,
                                                               year after year.

                                                             We founded FourPoint with the intent to give you the best of
                                                             both worlds: big-firm experience and scale, with the kind of
                                                             personalized, hands-on attention that only a boutique firm
                                                             like ours can offer. This approach allows us an unparalleled
                                                             perspective into future trends on both a micro and macro level.

                                                             Our annual Student Housing Year-End Report is by far the most
                                                             comprehensive aggregation of data across the industry and
                                                             is widely cited and relied upon for its exhaustive content and
                                                             accuracy.

                                                             On behalf of FourPoint Investment Sales Partners, we would like
                                                             to thank all of our clients, buyers, friends, and colleagues for
                                                             your contributions to this report. We hope you find the enclosed
                                                             information valuable and informative in your course of business.

                                                             We are proud to present our 2019 Student Housing Year-End
                                                             Report, and we invite you to contact us to discuss.

© 2020 FourPoint Investment Sales Partners. All Rights Reserved.             FOURPOINT 2019 STUDENT HOUSING YEAR-END REPORT     |   3
STUDENT HOUSING YEAR-END REPORT - FourPoint Investments
2019 YEAR- END OVERVIEW

Sales Volume                                                                                       Debt Overview
Total transaction volume in 2019 was $6.17B which marked                                           In 2019, agency lending origination volume made up 71%
a 40% decrease from the record-setting volume of the prior                                         of the total originations in student housing - $4.4B of the
three years. This year’s significant decrease is attributed to                                     $6.17B total. As the GSE financing options remain attractive,
one factor – the lack of meaningful portfolio transaction vol-                                     CMBS student housing volume continues to decrease. CMBS
ume. In 2019 there were only four portfolio transactions to-                                       originations comprised only 3% of the 2019 originations, with
taling $780M, versus 2016-2018 when an average of $4.65B                                           Life Companies, Banks, and Debt Funds making up the balance
in portfolio sales were recorded each year.                                                        of other lending sources.

Cap Rates                                                                                          Development Activity
For the sixth consecutive year the average cap rate for student                                    In 2019 and 2020, 189 new properties totaling in excess of
housing transactions has compressed, hitting a new record low                                      94,000 beds will be delivered in student markets across the
of 5.58%. This continued compression further demonstrates                                          United States. Despite rising construction costs, interest rate
that student housing has reached a wide level of acceptance                                        volatility, and the oversupply of some of the most well-known
in the investment community. Once considered a much riskier                                        college markets, the development activity remains strong.
asset class than conventional multifamily, the most recent                                         Developments favoring high-density, pedestrian to campus
data illustrates the spread between student housing and                                            locations, continue to be the trend seen among the majority of
conventional multifamily cap rates has reached an all-time                                         new deliveries over the past year. Barring any major changes
low.                                                                                               to the macroeconomic environment, development activity is
                                                                                                   expected to remain consistent with the levels seen over the
Current Buyer and Seller Profiles                                                                  past three years.
Foreign capital investment in student housing development
reemerged in 2019. Operator/Fund Joint Venture buyers
dominated the total transactions in 2019, purchasing 34%,
followed closely by Foreign Capital buyers at 31%. Developers
dominated the seller profile in 2019, accounting for 53% of the
total sales. Operator/Fund Joint Ventures accounted for the
second largest amount of sales at 21%.

Disclaimer:
The information in this report has been derived from sources deemed reliable. However, being subject to errors, omissions, and changes in data, no warranty is made as to its accuracy. Fur-
ther, no warranties or representation shall be made by FourPoint Investment Sales Partners and/or its agents, representatives, or affiliates regarding oral statements that have been made
in the discussion of the above report. This presentation, prepared by FourPoint, was distributed to the recipient under the assumption that s/he is a sophisticated real estate professional, and
s/he should not make investment decisions based on this report. This publication does not render legal, accounting, appraisal, counseling, investment, or other professional advice. Should
such services or other expert assistance be needed, it is recommended that the services of a competent person or firm, having access to the details of the situation, be employed. This report
shall not be reproduced or quoted without express written approval from FourPoint principals.

CONTENTS

2019 Student Housing Transactions                                                      05          Student Housing Debt Overview                                                           22

Student Housing Pricing Metrics                                                        12          Student Housing Development Pipeline                                                    25

Student Housing Cap Rate Analysis                                                      15          Student Housing Supply and Demand Analysis                                              30

Student Housing Buyers & Sellers                                                       19          FourPoint Investment Sales Partners                                                     34

4   |   FOURPOINT 2019 STUDENT HOUSING YEAR-END REPORT                                                                          © 2020 FourPoint Investment Sales Partners. All Rights Reserved.
STUDENT HOUSING YEAR-END REPORT - FourPoint Investments
Property: 191 College
                                                                                                        Developer: American Campus Communities
                                                                                                        University: Auburn University
                                                                                                        Photo: Images by Johnny Stevens

“         GLOBAL INVESTOR INTEREST IN THE STUDENT HOUSING SECTOR REMAINS
          ROBUST with leading institutional groups actively investing in our space.
          While 2019 saw a decrease in transaction volume, this does not indicate a
          waning interest in our industry, as evidenced by the further compression of
          cap rates across the sector. The decrease is reflective of a lack of available
          product due to the changing investor profile as institutional investors
                                                                                                2019 Student
                                                                                                    Housing
                                                                                                Transactions
          typically have longer hold periods, are investing through portfolio or platform
          recapitalizations, or investing in build-to-core programs. As such, traditional
          merchant developers are not selling their developments upon stabilization

                                                                                            ”
          but holding them longer with institutional capital partners. We expect to see
          continued strong interest to invest in student housing in 2020 and beyond.

          WILLIAM TALBOT
          Chief Investment Officer
          American Campus Communities (NYSE: ACC)

© 2020 FourPoint Investment Sales Partners. All Rights Reserved.         FOURPOINT 2019 STUDENT HOUSING YEAR-END REPORT               |   5
STUDENT HOUSING YEAR-END REPORT - FourPoint Investments
2019 REGIONAL STUDENT HOUSING TRANSACTIONS

                                            16
                                                                             6                                        25                                                  23

                                                                                               22                                                56
United States Total

     CLASS           #          AVG$/UNIT             AVG$/BED            AVG$/SF        AVG CAP RATE

          A          63       $295,783               $104,222              $252             5.39%
          B          54       $170,868                $60,686              $156             5.81%
          C          31       $128,411                $69,773              $153             5.67%        The numbers in the map above represent the amount of 2019 transactions over $5M in each region of the
                                                                                                         United States. Portfolio transactions greater than $100M are not included in this data set. Details for portfolio
  TOTAL/AVG       148         $212,073                $80,850              $196             5.58%        transactions can be found on page 9 of this report.

Pacific Coast Region                                                                                           Midwest Region
Total Transactions: 16 Total Properties: 16                                                                    Total Transactions: 25 Total Properties*: 29

    CLASS        #           AVG$/UNIT              AVG$/BED           AVG$/SF        AVG CAP RATE                CLASS         #           AVG$/UNIT              AVG$/BED             AVG$/SF         AVG CAP RATE

     A           6          $257,032              $118,996              $308              5.14%                     A          11          $277,758               $103,514               $241              5.09%
     B           3          $280,288               $92,953              $255              4.63%                     B          10          $136,360                $47,038               $109              6.65%
     C           7          $210,618              $109,142              $235              5.07%                     C           4           $79,251                $46,973                $98              6.53%

Southeast Region                                                                                               *Four-Property Portfolio in Champaign, IL counted as one transaction. Two-property Portfolio in Ann
                                                                                                               Arbor, MI counted as one transaction.
Total Transactions: 56 Total Properties*: 64
                                                                                                               Mountain West Region
    CLASS        #          AVG$/UNIT             AVG$/BED           AVG$/SF        AVG CAP RATE               Total Transactions: 6         Total Properties: 6

     A          23         $271,387              $100,551             $215             5.50%
                                                                                                                  CLASS          #           AVG$/UNIT               AVG$/BED             AVG$/SF         AVG CAP RATE
     B          25         $130,369               $47,128             $117             5.57%
                                                                                                                     A           3          $279,904                $75,145                $183               5.33%
     C          8           $89,224               $36,352              $85             7.15%
                                                                                                                     B           2          $162,935                $49,027                $144               5.75%
*Three-Property Portfolio in Raleigh, NC counted as one transaction. Two-Property Portfolio in Clemson
counted as one transaction. Two-Property Portfolio in Tuscaloosa counted as one transaction. Two-                    C           1          $149,237                $97,997                $182               5.55%
Property Portfolio in Raleigh counted as one transaction. Two-Property Portfolio in Charlotte counted
as one transaction. Two-Property Portfolio in Tallahassee counted as one transaction. Two-Property
Portfolio in Tallahassee counted as one transaction.

Southwest Region                                                                                               Northeast Region
Total Transactions: 22 Total Properties*: 23                                                                   Total Transactions: 23 Total Properties*: 27

    CLASS        #           AVG$/UNIT              AVG$/BED           AVG$/SF        AVG CAP RATE                CLASS         #           AVG$/UNIT              AVG$/BED             AVG$/SF         AVG CAP RATE

     A          10          $335,475              $121,574              $295              5.52%                     A          10          $306,932               $124,270               $315              5.45%
     B           7          $174,206               $58,667              $160              5.86%                     B           7          $312,866               $145,207               $462              5.38%
     C           5          $115,656               $77,351              $168              6.08%                     C           6          $143,748                $77,340               $165              4.96%
*Two-Property portfolio in Austin, TX counted as one transaction.                                              *Four-Property Portfolio in State College, PA counted as one transaction. Two-Property Portfolio in New-
                                                                                                               ark, DE counted as one transaction. Class B averages inflated due to two Manhattan transactions.

6     |       FOURPOINT 2019 STUDENT HOUSING YEAR-END REPORT                                                                              © 2020 FourPoint Investment Sales Partners. All Rights Reserved.
STUDENT HOUSING YEAR-END REPORT - FourPoint Investments
2019 INDIVIDUAL STUDENT HOUSING TRANSACTIONS
                             164
                            165

                     123
                  122
                                                                                                                                                                                                                                    84

                                                                                                                       91                                                                                                          81
                                           68 59
                                           58 69                                                                      90                                                                                   119                31
                                                                                                                                                                                                 118
                                                                                                                                                                                                             116117
                                                                                                                                                                85                                                     120121 30
                                                                                                                                                                88 89 86 87                                           32 33
                                                                                                                                                                                                                       34
                17                                                                                                                                                                                    128-132
                                                                                                                                                     66-68                                                         124
                                                                                                                                                            73
                                                           160                                                                                   69         7172
              16 25                                                             29                        114                                     70                                                          82 83
                                                                                                                                                    60-63                                                    161
                                                                                                                                                      64 65                                          162
                     1819                                                                                       7475 92                                                                                               163
                      20                                                        28                                                          93                        77 76

                                      115                                                                                                               78                                    104-107 97
                                                                                                                                                                              141                       108-113
                          23
                             24                                                                                                                               143 140                        98-101
                        21 22                                                                                             87                                                     103
                                                                                                                                                                                 108102
                                                                                                                                                                                     108
                                                                                                                                                 142                                  134-137
                                                                                                                                                                  2                            138139
                                                   9 108
                                   26 27                                              153
                                                                                                                                                                               55 52
                                                                                                                                                   95 96                     53 54                   133
                                                    11-15                                                                                                     3-6
                                                                                                                                                              3-7
                                                                                                                                                                         1                      56
                                                                                                                                  80
                                                                                                159                                                    94                          57
                                                                                                          151 152                                                              42-44
                                                                                                                                                                               38-50
With over $6.17B in total sales volume                                                          144-150                                79                                                   36 37
                                                                                               156-158
($5.4B of individual transactions and $780M                                                    154 155
of portfolio transactions), 2019 was the                                                                                                                                                        51
fourth most active sales year in the history                                                                                                                                                                     35
of the student housing industry.

      2019 Individual Student Housing Transaction Totals

      148 TRANSACTIONS       CLOSED
                                                                                24,543 UNITS                                   SOLD
                                                                                                                                                                         65,336 BEDS                                          SOLD

 #     PROPERTY                                                  CITY                STATE   BEDS           #       PROPERTY                                                                         CITY                    STATE       BEDS
 1     The Connection at Auburn                                  Auburn               AL     900           23       Chateau Sera and Tropicana                                                       Los Angeles               CA            64
 2     Huntsville Place                                          Huntsville           AL     336           24       Highland Parc                                                                    Riverside                 CA            n/a
 3     The Preserve at Tuscaloosa - FKA Parker 301               Tuscaloosa           AL     680           25       The Crossings                                                                    Sacramento                CA            750
 4     My House on the 50                                        Tuscaloosa           AL     161           26       Fifty Twenty-Five                                                                San Diego                 CA            942
 5     My House on Caplewood                                     Tuscaloosa           AL     150           27       Paseo Place                                                                      San Diego                 CA            120
 6     The Grand at Rum Creek                                    Tuscaloosa           AL     768           28       Lion Village                                                                     Colorado Springs          CO            506
 7     Landmark Apartments                                       Tuscaloosa           AL     150           29       FPA6 Ram Portfolio                                                               Fort Collins              CO            699
 8     Cottages on Hollywood                                     Fayetteville         AR     652           30       Cambridge/ Oxford Apartments                                                     New Haven                 CT            147
 9     MarQ                                                      Tempe                AZ     263           31       Willington Oaks                                                                  Willington                CT            192
 10    Sterling 920 Terrace                                      Tempe                AZ     775           32       The Retreat at Newark                                                            Newark                    DE            597
 11    Aspire Tucson                                             Tucson               AZ     540           33       Park Place                                                                       Newark                    DE            n/a
 12    Wildcat Canyon Village                                    Tucson               AZ     128           34       Studio Green Apartments                                                          Newark                    DE            n/a
 13    INDI Tucson                                               Tucson               AZ     247           35       University Square                                                                Boca Raton                FL            128
 14    University Lofts                                          Tucson               AZ     39            36       Point West Apartments                                                            Gainesville               FL            n/a
 15    Sierra Pointe Apartments                                  Tuscon               AZ     137           37       Cabana Beach - Gainesville                                                       Gainesville               FL        1,488
 16    Hillside Residence Hall                                   Berkeley             CA     72            38       The Social Row - FKA The Savannahs Student Housing Tallahassee                                             FL            177
 17    Gateway Apartments                                        Chico                CA     158           39       Elevate on Cascade/Cityview                                                      Tallahassee               FL            216
 18    Copper Beech Fresno                                       Clovis               CA     506           40       The Flex at Stadium Centre                                                       Tallahassee               FL            340
 19    Campus Edge                                               Fresno               CA     416           41       The Assemblage on Gaines                                                         Tallahassee               FL            340
 20    The Victor Apartments                                     Fresno               CA     416           42       Catalyst                                                                         Tallahassee               FL            402
 21    Alvista Long Beach                                        Long Beach           CA     439           43       Hayden Commons                                                                   Tallahassee               FL            64
 22    The Wilcox Collection                                     Los Angeles          CA     n/a           44       The Social 1600                                                                  Tallahassee               FL            516

                                                                                                                                                             (Individual Transactions List Continued on Next Page)

 © 2020 FourPoint Investment Sales Partners. All Rights Reserved.                                     FOURPOINT 2019 STUDENT HOUSING YEAR-END REPORT                                                                                     |        7
STUDENT HOUSING YEAR-END REPORT - FourPoint Investments
2019 INDIVIDUAL STUDENT HOUSING TRANSACTIONS (CONT.)
 #       PROPERTY                                        CITY             STATE   BEDS     #   PROPERTY                                              CITY              STATE     BEDS
45       University Courtyard Apartments                 Tallahassee       FL     384     106 Collegiate Commons                                     Greensboro          NC       324
46       Bainbridge Place Apartments                     Tallahassee       FL     164     107 Sebastian Courtyard & Village (2 Properties)           Greensboro          NC       648
47       Harbin Terrace                                  Tallahassee       FL     n/a     108 Signature 1505                                         Raleigh             NC       525
48       College Club Townhomes                          Tallahassee       FL     544     109 Logan & Chamberlain II                                 Raleigh             NC       113
49       Summit at Railroad Square                       Tallahassee       FL     135     110 Logan & Chamberlain I                                  Raleigh             NC       188
50       Summit at All Saints                            Tallahassee       FL     100     111 University Village at 2505                             Raleigh             NC       288
51       4050 Lofts                                      Tampa             FL     722     112 Campus West at Tryon                                   Raleigh             NC       162
52       Theory West Midtown                             Atlanta           GA     525     113 The College Inn                                        Raleigh             NC       440
53       University Lofts                                Carrollton        GA      45     114 Academy Lincoln                                        Lincoln             NE       632
54       Campus Walk Apartment Homes                     Carrollton        GA     204     115 Rebel Place                                            Las Vegas           NV       480
55       SOVA                                            Marietta          GA     816     116 Twin River Commons                                     Binghamton          NY       371
56       The Hue                                         Savannah          GA     446     117 20 Hawley                                              Binghamton          NY       290
57       Blanton Common                                  Valdosta          GA     860     118 Monarch 716                                            Buffalo             NY       592
58       Green Leaf River Edge                           Boise             ID     622     119 Auden Ithaca (fka Gun Hill Residences)                 Ithaca              NY       273
59       Park Village (fka The 208 Apartments)           Boise             ID     188     120 55 John Street                                         New York            NY       499
60       908 S. First                                    Champaign         IL      96     121 1760 Third Avenue                                      New York            NY      1,107
61       501 S. Sixth                                    Champaign         IL     104     122 The Union Student Living                               Corvallis           OR       222
62       307 E. Daniel                                   Champaign         IL      40     123 ArtHouse                                               Portland            OR       94
63       1008 S. Fourth                                  Champaign         IL     158     124 Lehigh University Portfolio (44 properties)            Bethlehem           PA       219
64       University Village                              Charleston        IL     391     125 Apartments at 1220                                     Philadelphia        PA       414
65       Campus Pointe                                   Charleston        IL     336     126 Spruce Hill                                            Philadelphia        PA       428
66       Automatic Lofts                                 Chicago           IL     482     127 The Greenery Apartments                                Philadelphia        PA       105
67       30 East                                         Chicago           IL     386     128 The Diplomat                                           State College       PA       72
68       Tailor Lofts                                    Chicago           IL     441     129 Garner Court                                           State College       PA       76
69       Lincoln Park Townhomes                          Normal            IL     156     130 Alexander Court                                        State College       PA       179
70       The Place at 117                                Savoy             IL     588     131 Beaver Hill                                            State College       PA       654
71       The Annex on 10th                               Indianapolis      IN     223     132 Cedarbrook                                             State College       PA       271
72       The College Crossing at National                Indianapolis      IN     168     133 My House on Meeting                                    Charleston          SC       156
73       West Lafayette Portfolio                        West Lafayette    IN     n/a     134 Tiger Towne Village                                    Clemson             SC       282
74       The Connection at Lawrence                      Lawrence          KS     888     135 Tiger Towne Farmhouses                                 Clemson             SC       231
75       The Rockland                                    Lawrence          KS     647     136 Campus View                                            Clemson             SC       278
76       Fields of Bluegrass                             Lexington         KY     528     137 The Collective at Clemson (fka Aspen Heights Clemson) Clemson              SC       598
77       Trifecta Apartments (fka The Arch Apartments)   Louisville        KY     604     138 The Southern at 1051                                   Columbia            SC      1,002
78       Station 74                                      Murray            KY     268     139 Stadium Suites                                         Columbia            SC       924
79       University Place                                Lafayette         LA     342     140 The Edge (Campus Edge)                                 Cookeville          TN       288
80       University Crossing                             Ruston            LA     552     141 The Social at Grand Forest (2 Properties)              Knoxville           TN       334
81       1047 Commonwealth                               Boston            MA     380     142 Nine at Memphis                                        Memphis             TN       385
82       Alloy by Alta Apartments                        College Park      MD     399     143 East Main Quarters                                     Murfreesboro        TN       252
83       Landmark College Park                           College Park      MD     829     144 Villas on 26th                                         Austin              TX       182
84       Bayside Village                                 Portland          ME     402     145 MUZE                                                   Austin              TX       450
85       Evolve at Allendale                             Allendale         MI     580     146 21 Pearl                                               Austin              TX       251
86       Zaragon Place                                   Ann Arbor         MI     248     147 Rio West                                               Austin              TX       388
87       Zaragon West                                    Ann Arbor         MI     198     148 University Estates                                     Austin              TX      1,548
88       The Paddock                                     Kalamazoo         MI     784     149 University Village                                     Austin              TX      1,152
89       Western Pines                                   Kalamazoo         MI     200     150 Skyloft                                                Austin              TX       674
90       Lofts @ 1633                                    Mankato           MN      69     151 University Trails                                      College Station     TX       828
91       University Village                              Minneapolis       MN     425     152 The Lofts at Wolf Pen Creek                            College Station     TX       567
92       Century Towers Residences                       Kansas City       MO     307     153 Thrive Lubbock (fka Gateway at Lubbock)                Lubbock             TX       744
93       Everly on the Loop                              St. Louis         MO     428     154 The Luxx                                               San Antonio         TX       694
94       Reserve at Long Point                           Hattiesburg       MS     420     155 High View Place                                        San Antonio         TX       624
95       The Social Campus                               Starkville        MS     1,344   156 The Lyndon                                             San Marcos          TX       515
96       Lakeside                                        Starkville        MS     504     157 The Metropolitan                                       San Marcos          TX       171
97       The Warehouse (Rosemary) Apartments             Chapel Hill       NC     215     158 Riverside Ranch                                        San Marcos          TX       372
98       Willows at The University                       Charlotte         NC     n/a     159 Mustang Ranch                                          Stephenville        TX       501
99       Haven 49                                        Charlotte         NC     887     160 Promenade Place                                        Orem                UT       429
100 The Union (fka Campus Pointe)                        Charlotte         NC     183     161 The Rixey                                              Arlington           VA       356
101 The Mill (fka The Flats at Mallard Creek)            Charlotte         NC     451     162 Foxhill Townhomes                                      Harrisonburg        VA       404
102 Greenhill Apartments at Columbus                     Columbus          NC     278     163 The Towers on Franklin                                 Richmond            VA       357
103 River Walk                                           Cullowhee         NC     490     164 Sky Vue                                                Bellingham         WA        120
104 Block 43 (fka Spring Place)                          Greensboro        NC     484     165 Mountain View Hall                                     Everett            WA        120
105 University Park                                      Greensboro        NC     214

     8     |    FOURPOINT 2019 STUDENT HOUSING YEAR-END REPORT                                                           © 2020 FourPoint Investment Sales Partners. All Rights Reserved.
STUDENT HOUSING YEAR-END REPORT - FourPoint Investments
2019 PORTFOLIO STUDENT HOUSING TRANSACTIONS

                                                                                                                                                         3                     4

                                                                                                                                                                                   5

                    1-6                                                               1

                                                                                                                                             4
                                                                                                  2                                                  1

                                                                                                                                                                  3
                                                                                                                                                                           3
            Capstone / Kayne Anderson to Scion Group                                                         1 2
                                                                                                              6
            Equity Residential to Dinerstein/Harrison Street

            908 Development Group / Scannell Properties to Landmark Properties                                                                                                          2

            Various Sellers to Vie Management

       2019 Portfolio Student Housing Transaction Totals

       4 PORTFOLIOS
              CLOSED
                                                            19 PROPERTIES   CLOSED
                                                                                                                          2,433 UNITS             SOLD
                                                                                                                                                                                       6,609 BEDS            SOLD

For the purpose of this report, transactions that are both greater than $100M and three or more properties are considered portfolios.

 Seller: Capstone/Kayne Anderson (4 Properties | 873 Units | 3,150 Beds)                                               Seller: 908 Development Group/Scannell Properties (3 Properties | 311 Units | 1,130 Beds)
 Buyer: Scion Group/Hana Financial Group                                                                               Buyer: Landmark Properties
 # PROPERTY                                                          CITY                 STATE       BEDS            # PROPERTY                                                       CITY            STATE            BEDS
 1     Cottages of Fort Collins                                      Fort Collins          CO          888            1    The Nine Rio                                                 Austin          TX              347

 2     Cottages of Lubbock                                           Lubbock               TX          847            2    The Nine at West Campus                                      Austin          TX              345

 3     The Nine at Gainesville                                       Gainesville           FL          625            3    The Nine at Tallahassee                                      Tallahassee     FL              438

 4     Archive Oxford                                                Oxford                MS          790
                                                                                                                      Seller: Various (6 Properties | 912 Units | 1,805 Beds)
 Seller: Equity Residential (6 Properties | 337 Units | 524 Beds)                                                     Buyer: Vie Management/Safanad
 Buyer: The Dinerstein Company/Harrison Street
                                                                                                                      #   PROPERTY                                                     CITY            STATE            BEDS
 # PROPERTY                                                          CITY                 STATE       BEDS           1    University Downs                                             Tuscaloosa       AL              436
 1     Sterling Oxford (FKA The Berkleyan)                           Berkeley              CA          107
                                                                                                                     2    Vie Villas at Boca Raton (FKA University View)               Boca Raton       FL              165
 2     Sterling Jefferson (FKA Renaissance Villas)                   Berkeley              CA          48
                                                                                                                     3    Hillcrest Oakwood Apartments                                 Big Rapids       MI              616
 3     Sterling Addison (FKA ARTech)                                 Berkeley              CA          39
                                                                                                                     4    Colonie Apartments                                           Amherst          NY              184
 4     Sterling University Ave (FKA Touriel)                         Berkeley              CA          56
 5     Sterling Haste (FKA Fine Arts)                                Berkeley              CA          117           5    Southgate Apartments                                         State College    PA              152

 6     Sterling Allston (FKA Gaia)                                   Berkeley              CA          157           6    Ella Lofts                                                   San Marcos       TX              252

     © 2020 FourPoint Investment Sales Partners. All Rights Reserved.                                           FOURPOINT 2019 STUDENT HOUSING YEAR-END REPORT                                                      |     9
STUDENT HOUSING YEAR-END REPORT - FourPoint Investments
HISTORICAL STUDENT HOUSING TRANSACTIONS

Total transaction volume in 2019 was $6.17B which represented                                Despite the lack of portfolio transactions, the data for 2019 still
a 40% decrease from the record-setting volume of the prior                                   offers several positive narratives. For example, at $6.17B and
three years. Over the past decade student housing investment                                 151 transactions, 2019 still ranks as the fourth most active
activity increased at exponential rates each year, so it may                                 year in the history of the student housing industry. In fact, if all
come as a surprise that transaction volume decreased so                                      portfolio transactions are eliminated from the historical data,
dramatically in such a short period of time. But upon careful                                2019 is the second most active year on record. Another positive
examination, this year’s significant decrease is attributed to one                           note is that excluding the singular portfolio transaction, the
factor – the lack of meaningful portfolio transaction volume. In                             average sized contract for 2019 was a record $36M, indicating
2019 there was only one portfolio transaction totaling $380M,                                a flight to quality and higher-priced properties. We believe
vs 2016-2018 when an average of $4.65B in portfolio sales                                    the data indicates that the fundamentals of student housing
were recorded each year.                                                                     investment continued to be healthy through 2019.

For the context of this report, we classify a portfolio transaction                          In the coming years developers will deliver a near-record
as any arms-length transaction that includes a minimum of                                    number of properties and new entrants continue to seek scale
three properties and an aggregate volume in excess of $150M.                                 by quickly consolidating national portfolios. Student housing
When accounting for a transaction like the 2018 sale and                                     continues to evolve as a respected vehicle for institutional equity
privatization of EdR to Greysar, the numbers in our report                                   within the United States and from across the globe.
exclude any enterprise value (goodwill, technology, etc.) that
is associated with the published transaction amount.

      [ Sales Volume ]                                                                                                                                  [ No. of Transactions ]

     $10,000,000,000 -                                                                                                                                                        - 200

                                                                                                                                        179                                   - 180
                                                                                                                                                            173
      $8,000,000,000 -                                                                                                                           158                          - 160
                                                                                                                                                                     152
                                                                                                                                                                              - 140
                                                                                                                             133
      $6,000,000,000 -                                                                                                                                                        - 120

                                                                                                                                                                              - 100

      $4,000,000,000 -                81                                                    83                    80                                                          - 80
                          67                    64                                                     65
                                                                                 59                                                                                           - 60
                                                                      46
      $2,000,000,000 -                                                                                                                                                        - 40
                                                           30
                                                                                                                                                                              - 20

                  $0 -                                                                                                                                                        -0
                         2006      2007       2008       2009       2010       2011       2012        2013       2014       2015       2016     2017        2018    2019

                                                                       Volume                       Transactions

                                                                        Portfolio Transactions

                               Data internally tracked, compiled, and calculated from FourPoint Investment Sales Partners’ proprietary database. The data
                                              only accounts for sales over $5M. Portfolio transactions are accounted for as one transaction.

10    |   FOURPOINT 2019 STUDENT HOUSING YEAR-END REPORT                                                                     © 2020 FourPoint Investment Sales Partners. All Rights Reserved.
Quarterly Transactions
The first half of 2019 accounted for 60% of all 2019                 [ Sales Volume ]                                                                           [ No. of Transactions ]

transactions and was much more active than the
                                                                                                                                                                                 - 50
second half. While the first and second quarter                    $2,500,000,000 -

shared high transaction volume, their sales volume                                              44                    45
was vastly different. At ~$1.75B, Q1 sales volume                  $2,000,000,000 -                                                                                 40           - 40

is almost double that of Q2, which was ~$900M.
The difference is easily identified by noting that six             $1,500,000,000 -                                                                                              - 30
(five individual and one portfolio) transactions that
closed in the first quarter were above $90M, while all                                                                                       23
                                                                   $1,000,000,000 -                                                                                              - 20
transactions in the second quarter were below $90M.
In contrast, 26 transactions occurred in Q2 that were                                                                                                                            - 10
                                                                     $500,000,000 -
less than $15M, while Q1 only had 14 transactions
less than $15M. Following historical trends, Q4
                                                                                 $0 -                                                                                            -0
finished the year with above average sales activity.
                                                                                                Q1                    Q2                     Q3                     Q4

                                                                                                                    Volume                    Transactions

                                                                                   Data internally tracked, compiled, and calculated from FourPoint Investment Sales
                                                                                  Partners’ proprietary database. The data only accounts for sales over $5M. Portfolio
                                                                                                    transactions are accounted for as one transaction.

Monthly Transactions
February (~$950M) and December (~$650M) were                        [ Sales Volume ]                                                                             [ No. of Transactions ]

the two most active months of 2019, and accounted
                                                                   $1,000,000,000 -                                                                                                - 20
for 26% of 2019 sales volume. Outside of these two
                                                                                                                                                                                   - 18
months, the average monthly sales volume was                        $875,000,000 -
                                                                                                                                                                          17
approximately $450M per month. February had five                    $750,000,000 -
                                                                                         16     16                            16                                                   - 16
                                                                                                              15
individual transactions, all $90M or higher, while May                                                                14                                                           - 14
                                                                    $625,000,000 -
recorded the lowest sales volume ($150M) due to a                                                      12                                                          12              - 12
                                                                                                                                                           11
number of smaller transactions.                                     $500,000,000 -                                                           10                                    - 10

                                                                                                                                     8                                             -8
                                                                    $375,000,000 -
                                                                                                                                                                                   -6
                                                                    $250,000,000 -                                                                  5
                                                                                                                                                                                   -4
                                                                    $125,000,000 -                                                                                                 -2

                                                                                 $0 -                                                                                              -0
                                                                                        Jan.   Feb.   Mar.   Apr.    May     June   July    Aug.   Sep.   Oct.     Nov.   Dec.

                                                                                                             Volume                        Transactions

                                                                                   Data internally tracked, compiled, and calculated from FourPoint Investment Sales
                                                                                  Partners’ proprietary database. The data only accounts for sales over $5M. Portfolio
                                                                                                    transactions are accounted for as one transaction.

© 2020 FourPoint Investment Sales Partners. All Rights Reserved.     FOURPOINT 2019 STUDENT HOUSING YEAR-END REPORT                                                               |       11
Property: Rise on Chauncey
                                                                                                        Developer: CA Ventures
                                                                                                        University: Purdue University
                                                                                                        Photo: LCP 360

Student Housing
Pricing Metrics                           “         ATTRACTIVE YIELDS IN REAL ESTATE AS COMPARED TO OTHER ASSET
                                                    CLASSES SHOULD CONTINUE TO DRIVE INTEREST AND RECORD-SETTING
                                                    PRICING ON A PER UNIT/BED/SF BASIS IN THE STUDENT HOUSING
                                                    INDUSTRY. Downward pressure on yields will likely persist given the
                                                    historic low interest rate environment and the continued demand from
                                                    capital seeking access to the student housing sector, particularly for
                                                    investments that possess durable cash flows. However, in addition to
                                                    perceived macro supply, an increase in loan delinquencies and lender

                                                                                    ”
                                                    skepticism in certain markets may impact the depth of the buyer pool
                                                    and pricing going forward.

                                                    BEN MOHNS
                                                    Managing Director
                                                    Harrison Street Real Estate Capital

12   |   FOURPOINT 2019 STUDENT HOUSING YEAR-END REPORT                     © 2020 FourPoint Investment Sales Partners. All Rights Reserved.
STUDE NT HO USIN G P RICIN G METRI CS

          [Price / Unit / Bed]                                                                                                                                                 [Price / SF]

           $250,000 -                                                                                                                                                              - $200

           $225,000 -                                                                                                                                                              - $185

           $200,000 -                                                                                                                                                              - $170

           $175,000 -                                                                                                                                                              - $155

           $150,000 -                                                                                                                                                              - $140

           $125,000 -                                                                                                                                                              - $125

           $100,000 -                                                                                                                                                              - $110

             $75,000 -                                                                                                                                                             - $95

             $50,000 -                                                                                                                                                             - $80

             $25,000 -                                                                                                                                                             - $65

                     $0 -                                                                                                                                                          - $50
                               2007       2008        2009        2010        2011        2012 2013               2014 2015               2016        2017 2018 2019

                                                                           Price/Unit             Price/Bed                  Price/SF

                                      Data internally tracked, compiled, and calculated from FourPoint Investment Sales Partners’ proprietary database. Pricing indicated in
                                                    chart represents stabilized sales. Stabilized sales include all transactions not sold by a lender or receiver.

 2019 pricing levels are very similar to the past three
 years. Pricing metrics showed a nominal increase on                                                       Property: The Nest
                                                                                                           Developer: Trinitas
 a per unit and per bed basis when compared to 2018,                                                       University: University of Kansas
 but experienced a healthy jump upward on a per square                                                     Photo: William Manning Photography

 foot basis, achieving an all-time high at nearly $200/
 PSF. The pricing increase on a square foot basis is likely
 attributed to developers' continued appetite for higher
 density projects in pedestrian locations, opting for more
 four, five, or six-bedroom floor plans which often maximize
 rent per square foot. The number of assets trading north
 of $100,000 per bed continues to be significant, accounting
 for about a third of all transactions in 2019.

 Despite interest rate volatility throughout the year, cap
 rates remained at all-time lows, which continued to drive
 pricing near record highs. Aggressive capital remains
 active in the industry and helped sustain consistent pricing
 levels over the past three years. As developers face rising
 construction costs and investors look to maximize returns
 by pushing rental rates higher, pricing for 2020 is expected
 to continue to increase.

© 2020 FourPoint Investment Sales Partners. All Rights Reserved.                                      FOURPOINT 2019 STUDENT HOUSING YEAR-END REPORT                                          |   13
STUDE NT HO USIN G P R ICIN G METRI CS

 Class A vs. B vs. C Pricing                                        Total Transaction Volume (%) By Class Type
 In order to better distinguish meaningful trends found among
 Class A, B and C student housing properties, the 2019 year-
 end report has adjusted the qualifying criteria assigned              21%
 to each class. This report identifies any property built (or
 significantly renovated) in 2011 or later as a Class A asset.
 Class B assets are identified as being built (or significantly                                                                                      Class A
                                                                                                                               43%                   (2011-2019)
 renovated) between 1996 and 2010, while Class C assets are
 identified as being built in 1995 or earlier.                                                                                                       Class B
                                                                                                                                                     (1996-2010)

 Class A sales crept above $100,000 per bed in 2019 to                                                                                               Class C
                                                                                                                                                     (1995 & Earlier)
 $104,222 per bed after falling just shy of that benchmark
 in 2018. This represents only the second time that the                   36%
 average Class A sales price has surpassed the $100,000/
 bed threshold. Price per unit for class A sales also increased
 relative to 2018, growing over 10% and approaching $300,000/
 unit. With new developments carrying a higher bed-to-unit          Average Pricing by Class Type
 ratio as developers look to maximize unit layout in new high-
 density developments, we can expect the trend of increased         [Price / Unit / Bed]                                                              [Price / SF]
 price per unit year-over-year to continue. Regionally, Class
 A pricing on a per bed and per unit basis increased in four of      $300,000 -                                                                               - $300

 the six regions with the Northeast and Pacific regions being        $275,000 -                                                                               - $275
 the two that went the opposite direction. Despite a decline in
                                                                     $250,000 -
 pricing, the Northeast region still held on as the region with                                                                                               - $250
 the highest price per bed for Class A assets, falling just below    $225,000 -
 $125,000 per bed. From a transaction volume perspective,                                                                                                     - $225
                                                                     $200,000 -
 the Southeast region accounted for the highest percentage of                                                                                                 - $200
                                                                     $175,000 -
 overall Class A transactions for a third year in a row, almost
 37%, putting it right in line with both 2017 and 2018.              $150,000 -                                                                               - $175

                                                                     $125,000 -                                                                               - $150
 As expected, Class B pricing in 2019 sits well below that of
 Class A averages. Accounting for 36% of individual trades           $100,000 -
                                                                                                                                                              - $125
 during 2018, Class B pricing on a per bed basis ($60,686/ bed)       $75,000 -
 represents a 3% increase over the combined Class B pricing                                                                                                   - $100
                                                                      $50,000 -
 of 2018. The Northeast region was the only region that had
                                                                      $25,000 -                                                                               - $75
 Class B pricing surpass $100,000 per bed average as well as
 passing the $300,000 per unit pricing. The Northeast region                $0 -                                                                              - $50
 price per square foot for Class B properties also shot up to                              Class A                 Class B               Class C
 $462 PSF. The underlying reason that the Northeast region                                (2011-2019)             (1996-2010)          (1995 & Earlier)

 saw such strong performance from the Class B category was                                   Price/Unit             Price/Bed              Price/SF
 due to two transactions that were high-density and urban in
 nature and accounted for over 75% of the sales volume for                Data internally tracked, compiled, and calculated from FourPoint Investment Sales Partners’
                                                                           proprietary database. Pricing indicated above represents stabilized sales. Stabilized sales
 class B assets in this region.                                         include all transactions not sold by a lender or receiver. Class A designation is properties built
                                                                        from 2011 through 2019, Class B designation is properties built from 1996 through 2010, Class
                                                                                             C designation is properties built any time through 1995.
 Class C pricing, representing about 20% of transaction volume
 in 2019, averaged almost $70,000 per bed, a 15% increase
 over Class B per bed pricing. However, when comparing price        more heavily focused on one and two bedrooms. Almost all
 per unit, Class C transactions were 25% lower than Class           properties built before 1995 were not purpose-built student
 B assets on per unit pricing. This is primarily explained by       housing, and rather operate as student housing by default given
 older properties having less density, and a unit mix that is       their location to nearby universities.

14   |   FOURPOINT 2019 STUDENT HOUSING YEAR-END REPORT                                           © 2020 FourPoint Investment Sales Partners. All Rights Reserved.
Property: Hub on Campus West Lafayette
                                                                                                        Developer: Core Spaces
                                                                                                        University: Purdue University
                                                                                                        Photo: Kevin Kaminiski Photography

“        Prior to 2014 the student housing industry primarily consisted of a handful
         of niche investors. Over the last five years foreign capital and large domestic
         investors made significant allocations to the space, and now the largest
         equity funds in the world have an allocation for student housing. THE
         COMBINATION OF INCREASED INVESTOR DEMAND AND LOW INTEREST
         RATES HAS DRAMATICALLY INCREASED LIQUIDITY, AND CAP RATES HAVE
                                                                                            Student Housing
                                                                                           Cap Rate Analysis
         COMPRESSED. There is a flight to quality at this phase of the cycle and in
         2020 I predict cap rates for Tier One product will continue to hold steady,

                                                                                           ”
         if not compress slightly. Assets in tertiary markets are harder to sell,
         although at the right price, foreign capital can solve for their higher-yield
         return requirements.

         JOHN PREISS
         Chief Investment Officer
         The Preiss Company

© 2020 FourPoint Investment Sales Partners. All Rights Reserved.         FOURPOINT 2019 STUDENT HOUSING YEAR-END REPORT                 |    15
STUDE NT HO USIN G CAP R ATES

 For the sixth consecutive year the average cap rate for student
 housing transactions compressed, hitting a new record low of                                                                                                            Property: The Ruckus 2.0

 5.58%. This represents a 23-basis point compression from the                                                                                                            Developer: Lincoln Ventures
                                                                                                                                                                         University: The University of Texas at Austin

 previous year, and almost a full percent lower than the average                                                                                                         Photo: Twist Tours

 cap rate in 2014 (6.51%). This continued compression further
 demonstrates that student housing has reached a wide level of
 acceptance in the investment community. Considered a much
 riskier asset class than conventional multifamily, the most
 recent data illustrates the spread between student housing
 and conventional multifamily cap rates has narrowed to record
 levels. Although market dependent, there are now examples
 of student housing assets trading at cap rates below that of
 conventional multifamily. Despite the potential for interest
 rate volatility and other macroeconomic factors, we expect cap
 rates to generally remain near the record lows established
 in 2019.

                                                  5.58% AVERAGE CAP RATE
     [Cap Rate]                                                                                                                                                                       [10-Year Treasury]

      9.0% -                                                                                                                                                                                              - 3.0%

      7.5% -                                                                                                                                                                                              - 2.5%

      6.0% -                                                                                                                                                                                              - 2.0%

      4.5% -                                                                                                                                                                                              - 1.5%

      3.0% -                                                                                                                                                                                              - 1.0%

      1.5% -                                                                                                                                                                                              - 0.5%

      0.0% -                                                                                                                                                                                              - 0.0%
                01/2/2019                02/21/2019                 05/19/2019                 07/19/2019                09/19/2020                 11/19/2019                  12/30/2019

                                                                             Cap Rate                 10-Year Treasury

                                                                   Linear Cap Rate                    Linear 10-Year Treasury

               Data internally tracked, compiled, and calculated from FourPoint Investment Sales Partners’ proprietary database. Graph includes all stabilized sales with cap rate data avail-
               able but does not include portfolio transactions due to the lack of asset-specific cap rate data available. All data deemed reliable; however, no representation is being made to
                                                                                            the accuracy thereof.

16    |   FOURPOINT 2019 STUDENT HOUSING YEAR-END REPORT                                                                                 © 2020 FourPoint Investment Sales Partners. All Rights Reserved.
5.39% AVERAGE CLASS A CAP RATE
 Class A Cap Rates
                                                                         [Cap Rate]

 The average Class A cap rate dropped in 2019 to 5.39%                    8.00% -

 which is 18 basis lower than the previous year. This
 established a new record low which was previously                        7.00% -
 seen in 2017. Of the Class A trades that occurred in
 2019, almost 70% were mid- rise or high-rise product                     6.00% -
 with an average distance to campus of less than 0.60
 miles. Among the Class A sales, only 40% were located
                                                                          5.00% -
 at universities designated as a “power 5” conference
 but on average commanded a cap rate 30 basis points
                                                                          4.00% -
 lower than those at non “power 5” universities. As
 developers continue to build predominately high-
 density projects in close proximity to campus, Class                     3.00% -

 A cap rates on a forward-looking basis are expected
 to remain at historic lows.                                              2.00% -
                                                                                     01/15/19       3/28/19        6/24/19          11/15/19         12/19/19

                                                                                                                                                           [Date]
                                                                                                    Cap Rate                 Linear Cap Rate

                                                                            Data internally tracked, compiled, and calculated from FourPoint Investments Sales
                                                                            Partners’ proprietary database. Graph includes all properties sold in 2019 built after
                                                                        January 1, 2011 with cap rate data available but does not include portfolio transactions due
                                                                         to the lack of asset-specific cap rate data available. All data deemed reliable; however, no
                                                                                            representation is being made to the accuracy thereof.

 Class B Cap Rates                                                          5.81% AVERAGE CLASS B CAP RATE
 Accounting for about a third of the transactions in                       [Cap Rate]

 2019, Class B properties had an average cap rate of                      10.00% -

 5.81%. As expected, a healthy spread of 42 basis points
 exists between Class A and Class B cap rates. This
                                                                           8.00% -
 spread is best represented by the location and product
 type built during generation-one student housing (late
 90’s to mid 2000’s). Seventy-two percent of the Class                     6.00% -
 B transactions in 2019 were garden-style trades, with
 an average distance to campus at just under one mile.
                                                                           4.00% -
 While institutions and other low cost-of-capital buyers
 continue to chase low-risk core product, a large group
 of opportunistic buyers maintain a strict focus on more                   2.00% -
 value-oriented acquisitions. Although these buyers
 may be priced out of the Class A environment, they
 tend to enjoy a much healthier yield provided by assets                   0.00% -
                                                                                     01/16/19        3/27/19        6/19/19         11/19/19         12/30/19
 in this profile. With high demand for Class B product
                                                                                                                                                          [Date]
 and increased competition to find strong investment
                                                                                                      Cap Rate                 Linear Cap Rate
 opportunities in tier one markets, cap rates for Class
 B product are likely to remain at historic lows in 2020.                  Data internally tracked, compiled, and calculated from FourPoint Investments Sales
                                                                          Partners’ proprietary database. Graph includes all properties sold in 2019 built after
                                                                          January 1, 1996 and before January 1, 2011 with cap rate data available but does not
                                                                        include portfolio transactions due to the lack of asset-specific cap rate data available. All
                                                                        data deemed reliable; however, no representation is being made to the accuracy thereof.

© 2020 FourPoint Investment Sales Partners. All Rights Reserved.   FOURPOINT 2019 STUDENT HOUSING YEAR-END REPORT                                                  |    17
5.67% AVERAGE CLASS C CAP RATE
Class C Cap Rates
                                                             [Cap Rate]

Only 31 transactions in 2019 qualified as Class C           9.00% -
assets (built before 1996). Working with a smaller
data set led to some interesting conclusions, namely        8.00% -
an average Class C cap rate of 5.67% which is 14 basis
points lower than the average Class B cap rate in
                                                            7.00% -
2019. Class C cap rates traded lower than Class B cap
rates, despite Class C product being much older and
                                                            6.00% -
typically in need of more capital improvements than
Class B product. Additionally, the average distance
to campus for Class C properties was less than 0.50         5.00% -

miles. This illustrates the investments community’s
appetite, and willingness to pay a premium for the          4.00% -
best possible location. Additionally, because Class C
product generally has more upside from a value-add          3.00% -
perspective, investors are willing to forego stabilized
cap rates day-one in return for higher yields throughout
                                                            2.00% -
their investment period.                                              01/02/19          3/28/19        6/27/18         11/19/20          12/19/19

                                                                                                                                               [Date]
                                                                                         Cap Rate                 Linear Cap Rate

                                                               Data internally tracked, compiled, and calculated from FourPoint Investments Sales
                                                              Partners’ proprietary database. Graph includes all properties sold in 2019 built before
                                                           January 1, 1996 with cap rate data available but does not include portfolio transactions due
                                                            to the lack of asset-specific cap rate data available. All data deemed reliable; however, no
                                                                               representation is being made to the accuracy thereof.

                                                                                                                  Property: Identity Miami
                                                                                                                  Developer: CA Ventures
                                                                                                                  University: Florida International University
                                                                                                                  Photo: LCP 360
Property: Hub on Campus Tucson Speedway
Developer: Core Spaces
University: University of Arizona
Photo: Kevin Kaminiski Photography

“          A cornerstone of the student housing sector has always been the selective
           and disciplined buyer of individual assets. With time and experience
           those same buyers typically progress to transacting on larger portfolio
           acquisitions. IN 2019 THERE WAS AN INFLOW OF CAPITAL FROM NEW
           ENTRANTS, PARTICULARLY THE SOVEREIGN INVESTMENT COMMUNITY,
           AND IN 2020 WE EXPECT TO SEE THE RETURN OF LARGE PORTFOLIO
                                                                                          Student Housing
                                                                                          Buyers & Sellers
           ACQUISITIONS BY THESE GROUPS. Timberline Real Estate Ventures is
           cautiously optimistic that this will boost overall transaction volume in the
           sector, subject to external impacts from global macroeconomic events.

           ANDREW STARK
           Principal
           Timeberline Real Estate Ventures

© 2020 FourPoint Investment Sales Partners. All Rights Reserved.
                                                                              ”
                                                                          FOURPOINT 2019 STUDENT HOUSING YEAR-END REPORT   |   19
BUYER TRENDS

                                                                                                                                  5%       2%
 Foreign capital investment in student housing reemerged in
 2019. The surge in foreign investment was fueled by a slew                                                 17%

 of acquisitions by groups from China, the United Kingdom,                                                                                                                         Developer
                                                                                                                                                               31%
 South Korea and the Gulf states. Together, Operator Fund                                                                                                                          Foreign Capital

 Joint Ventures (34%) and Foreign Capital (31%) dominated
                                                                                                                          2019
                                                                                                                                                                                   Operator Fund / JV
                                                                                                      4%
 the buyer pool in 2019. These groups are often structured                                                                                                                         Private
 similarly; however, if the equity is originated in a non-                                                                                                                         REIT
                                                                                                       8%
 US based entity, the transaction is accounted for in the
                                                                                                                                                                                   Syndicator/DST/TIC
 Foreign Capital bucket. The third most active buyer type
                                                                                                                                                                                   University
 was Syndicator / DST / TIC on all purple highlights, which
 made up 17% of the 2019 buyer pool. This is in line with
                                                                                                                                       34%
 2018 (19%), and we expect the trend to continue and this
 buyer type will account for approximately 20% of the buyer
                                                                                                                                     2% 1%
 pool each year.                                                                                                                                    8%
                                                                                                                                                                                   Family Office
                                                                                                              19%
                                                                                                                                                                                   Foreign Capital

                                                                                                                                                                                   Institution

                                                                                                      1%                                                                           Operator Fund / JV

                                                                                                      6%
                                                                                                                          2018                                                     Private

                                                                                                                                                                                   REIT

                                                                                                                                                                40%
                                                                                                                                                                                   Syndicator/DST/TIC

                                                                                                                                                                                   University
100% -
                                                                                                               23%

 90% -

 80% -

 70% -

 60% -

 50% -

 40% -

 30% -

 20% -

 10% -

     0% -
            2007 2008 2009 2010 2011 2012 2013 2014 2015 2016 2017 2018 2019

                               Private                            University

                               REIT                               Operator Fund / JV

                               Syndicator/DST/TIC                 Foreign Capital

                               Institution                        Developer

                                                                                                       Property: Sterling Heights
 Data internally tracked, compiled, and calculated from FourPoint Investment Sales Partners’           Developer: The Dinerstein Companies
 proprietary database. Charts based on $6.17B of individual and portfolio transaction sales volume.    University: University of Texas at San Antonio
                                                                                                       Photo: Hugh Hargrave Photography

20     |    FOURPOINT 2019 STUDENT HOUSING YEAR-END REPORT                                                                              © 2020 FourPoint Investment Sales Partners. All Rights Reserved.
SELLER TRENDS
                                                                                                                     4%
                                                                                                            7%

Developers dominated the seller profile in 2019, accounting                                      12%                                                    Developer

for a whopping 53% of the total sales. This is a change from                                                                                            Foreign Capital
last year when REIT sales accounted for over 40% of the
                                                                                                                 2019
                                                                                                                                                        Lender/Receiver
transactions; due mainly to the $3.2B privatization of EdR
                                                                                                                                                 53%    Operator Fund / JV
to Greystar. No portfolios of the same scale traded in 2019;
                                                                                                                                                        Private
therefore, it makes sense that developers, who were the
second biggest seller in 2018, regained the mantle as the                                            21%                                                TIC/DST/Syndicator

dominant seller in 2019. In each of the past five years nearly                                                                                          REIT

50,000 beds have been delivered - many from developers                                                           1% 3%

who do not plan to hold long term. In 2019, Operator/Fund
Joint Ventures made up the next largest seller category at                                                           0.2% 1%
21%. The remaining five types of sellers combined made
                                                                                                                                                        Developer
up 26% of the disposition market.                                                                                                         24%
                                                                                                                                                        Foreign Capital

                                                                                                                                                        Institution

                                                                                                                 2018
                                                                                                                                                        Lender/Receiver
                                                                                               41%                                               1%
                                                                                                                                                 2%     Operator / Fund JV
                                                                                                                                                 0.2%
                                                                                                                                                        Private/Syndicator/TIC
                                                                                                                                                9%
                                                                                                                                                        REIT

                                                                                                                                                        University
100% -
                                                                                                                               22%
 90% -

 80% -

 70% -

 60% -

 50% -

 40% -

 30% -

 20% -

 10% -

  0% -
         2007 2008 2009 2010 2011 2012 2013 2014 2015 2016 2017 2018 2019

                         Private/Syndicator/TIC                   Lender/Reciever

                         Operator/Fund JV                         Developer

                         REIT                                     University

                                                                                                 Property: Hub on Campus West Lafayette
                         Institution                              Foreign Capital                Developer: Core Spaces
                                                                                                 University: Purdue University
                                                                                                 Photo: Kevin Kaminiski Photography

       Data internally tracked, compiled, and calculated from FourPoint Investment Sales
       Partners’ proprietary database. Charts based on $6.17B of individual and portfolio
       transaction sales volume.

© 2020 FourPoint Investment Sales Partners. All Rights Reserved.                            FOURPOINT 2019 STUDENT HOUSING YEAR-END REPORT                                |   21
Property: The Standard at Flagstaff
Developer: Landmark Properties
University: Northern Arizona University
Photo: Kyle Zirkus Photography

Student Housing
Debt Overview                               “      It was great news to all of us when the FHFA announced the new volume
                                                   caps for each agency, allowing them to originate up to $80MM in 2020.
                                                   While their focus in 2020 is on “Mission-driven”/affordable housing, the
                                                   agencies will still be a significant part of the student housing market
                                                   this year. I do not expect Fannie & Freddie to meet the $4.4B loan
                                                   origination number they achieved last year, but they are still very much
                                                   in the market and providing liquidity in both healthy and challenging
                                                   submarkets. Going forward in 2020, student housing borrowers should
                                                   expect more scrutiny from the agencies on market selectivity as well
                                                   as sponsor track record and experience. THE GOOD NEWS IS THAT WE
                                                   ARE IN THE LOWEST RATE ENVIRONMENT OF ALL TIME AND THERE HAS

                                                                                                                               ”
                                                   NEVER BEEN A BETTER TIME TO LOCK A 10-YEAR FIXED RATE LOAN.

                                                   WILL BAKER
                                                   Senior Managing Director | Real Estate Finance
                                                   Walker & Dunlop

22   |   FOURPOINT 2019 STUDENT HOUSING YEAR-END REPORT                     © 2020 FourPoint Investment Sales Partners. All Rights Reserved.
HISTORIC AL STUDENT HOUSING LOAN VOLUME

The Government Sponsored Enterprises (GSE’s), Freddie            announcement allowed loan caps of $100B for both Freddie
Mac and Fannie Mae, play a crucial role in the liquidity and     & Fannie multifamily without exclusions for student housing.
stability of the student housing market. Over the past five
years the duo has originated over $20B in student housing        With new allocations from the Federal Reserve, the GSE’s
loans and continues to be the most readily available sources     continue to offer non-recourse financing for dedicated student
of financing in the sector.                                      housing properties within two-miles of campus or on a
                                                                 university-owned transportation line. These loans are offered
Despite a decrease in student housing sales volume in 2019,      with terms of five to thirty years with fixed and variable rate
GSE debt origination volume remained near all-time highs.        options available with a maximum loan- to-value of 80% and
At $4.4B of originations, $2.7 coming from Fannie Mae and        a minimum debt service coverage ratio of 1.30x.
$1.7B from Freddie Mac, the GSE’s comprised a dominating
71% of all student housing origination volume in 2019.           As agency lending options remain attractive, CMBS student
                                                                 housing volume continues to decrease. CMBS originations
In Fall 2019, the FHFA announced a revised cap structure on      comprise only 3% of the 2019 originations, down from only
all multifamily agency lending and renewed allocations. The      6% in 2018. The balance of originations in 2019 consisted
                                                                 of Life Companies, Banks, Debt Funds, and other sources.

      [Loan Volume]
   $4,000,000,000 -

   $3,500,000,000 -

   $3,000,000,000 -

   $2,500,000,000 -

   $2,000,000,000 -

   $1,500,000,000 -

   $1,000,000,000 -

     $500,000,000 -

               $0 -
                        2013           2014         2015           2016         2017           2018             2019

                                              Fannie Mae       Freddie Mac       CMBS

                                                                                                                Property: Rise on Chauncey
                                                                                                                Developer: CA Ventures
                                                                                                                University: Purdue University
                                                                                                                Photo: LCP 360
2019 Index Data

After steady rate increases to the 10-Year          3.00 %

Treasury since 2015, the Federal Reserve            2.80 %
issued three different rate cuts of 25 basis        2.60 %
points in August, September, and October 2019.      2.40 %
The 10-Year Index began the year near 2.75%
                                                    2.20 %
and decreased approximately 100 basis points
                                                    2.00 %
over the course of the year. The One-Month
LIBOR mirrored this trend, starting the year        1.80 %

at 2.45% and ending at 1.40%. In 2020, based        1.60 %
on global macroeconomic events, we expect           1.40 %
all indexes to continue to drop to all-time lows.
                                                    1.20 %

                                                    1.00 %
                                                             1/2/19     3/1/19       5/1/19       7/1/19      9/1/19        11/1/19        12/31/19

                                                                              1-Month LIBOR                   10-Year Treasury

Historical Treasury Vs. Cap Rate Trends

Over the past ten years, the 10-Year Treasury       8.00 %
has steadily decreased from an average of
                                                    7.00 %
3.22% in 2010, to 2.14% in 2019. As expected,
student housing cap rates have followed this        6.00 %
trend and have dropped from an average of
7.05% in 2010, to an astounding 5.58% in 2019.      5.00 %

                                                    4.00 %

                                                    3.00 %

                                                    2.00 %

                                                    1.00 %
                                                             2010     2011    2012    2013      2014   2015    2016      2017     2018        2019

                                                                             Average Cap Rate              10-Year Treasury Average

                                                                                                               Property: The Mark Tucson
                                                                                                               Developer: Landmark Properties
                                                                                                               University: University of Arizona
                                                                                                               Photo: Zach Rolen, Rolen Image
Property: The Mark Tucson
 Developer: Landmark Properties
 University: University of Arizona
 Photo: Zach Rolen, Rolen Image

“             At Landmark, we carefully analyze the forward looking supply and demand
              fundamentals to determine the markets we like. Until recently, we had
              been focused almost exclusively on development. Given how replacement
              costs have outpaced rents in many markets, though, development doesn’t
              always make sense. As such, these are the markets where we’re focused
              on acquisitions. WE ALWAYS LOOK TO THE MARKET FIRST, THEN MAKE
                                                                                        Student Housing
                                                                                           Development
                                                                                                Pipeline

                                            ”
              OUR INVESTMENT DECISION ON LOCATION AND THE SUBMARKET
              BARRIERS TO ENTRY.

              J. WESLEY ROGERS
              President and CEO
              Landmark Properties

© 2020 FourPoint Investment Sales Partners. All Rights Reserved.      FOURPOINT 2019 STUDENT HOUSING YEAR-END REPORT   |   25
2019 STUDENT HOUSING                                                                                         2019 was one of the most active development
                                                                                                              years in the history of the student housing space
 DELIVERIES                                                                                                   in terms of the number of properties developed.
                                                                                                              This map pinpoints all known developments
                                                                                                              delivered in 2019 as reported by Axiometrics
                                                                                                              and FourPoint independent research.

                   51                         2829
           49
          50                                           27

                                                                                                                            25                                                            33
                                                                                                                                      15                     34           35
                                                                                                                                      16-18 14
                                                                                      2324
                                                                                                                                                                 43        37 36
                                                                                                               1                                     22 4142                  38-40
              47                                                                            20                                       6
      48 45                                                                                                                 3-5 7-10
                                                                26                                                                  11     21
                                                                                                                                                                   44
                                                                                                                        2                  13
                                        32
                                30 31                                                                    19                      12                                7778
                                                                                                                                                                    79
                    46                       83                                            87           55
                                                                                                                                               82 76
                                                                                                                                         72
                                                                                                                                           68 69                  80 81
                                                                                                                                            70
                                             8485                                                                           74 75 54           71
                                              86                                      93                                             52 53
                                                                                      88
                                                                                   89-92                                                         62-65
                                                                                  9798          94 95                                                    57-60
                                                                                                                   73                                            56
                                                                                  9699
                                                                                                                                                          66 67
                                                                                                                                                                          61

      2019 Portfolio Student Housing Delivery Totals

          99 PROPERTIES     DELIVERED
                                                               17,472 UNITS                        DELIVERED
                                                                                                                                      49,595 BEDS                                     DELIVERED

 Pacific Coast Region                                                                             Midwest Region
     # OF PROPERTIES DELIVERED          # OF UNITS DELIVERED    # OF BEDS DELIVERED                 # OF PROPERTIES DELIVERED              # OF UNITS DELIVERED                 # OF BEDS DELIVERED

                        7                           1,356             3,788                                        25                               4,528                              11,119

 Mountain States Region                                                                           Southeast Region
     # OF PROPERTIES DELIVERED          # OF UNITS DELIVERED    # OF BEDS DELIVERED                 # OF PROPERTIES DELIVERED               # OF UNITS DELIVERED                # OF BEDS DELIVERED

                        7                           1,260             4,289                                        31                                4,843                             15,340

 Southwest Region                                                                                 Northeast Region
     # OF PROPERTIES DELIVERED          # OF UNITS DELIVERED    # OF BEDS DELIVERED                 # OF PROPERTIES DELIVERED               # OF UNITS DELIVERED                # OF BEDS DELIVERED

                    17                              2,866             8,429                                        12                                2,619                              6,630

26    |   FOURPOINT 2019 STUDENT HOUSING YEAR-END REPORT                                                                          © 2020 FourPoint Investment Sales Partners. All Rights Reserved.
2019 STUDENT HOUSING DELIVERIES
#    CITY                                        STATE              UNITS   BEDS      #    CITY                 STATE    UNITS       BEDS
Midwest Region                                                                        Southeast Region
1    Coralville                                    IA               151     303       52   Auburn                AL      126         481
2    Edwardsville                                  IL               162     468       53   Auburn                AL      219         858
3    Champaign                                     IL               170     538       54   Tuscaloosa            AL       64         114
4    Champaign                                     IL               218     548       55   Fayetteville          AR      180         652
5    Urbana                                        IL               126     476       56   Daytona Beach         FL       96         376
6    Kokomo                                        IN                75     125       57   Gainesville           FL       18         54
7    West Lafayette                                IN               280     835       58   Gainesville           FL       42         114
8    West Lafayette                               IN                233     608       59   Gainesville           FL       48         132
9    West Lafayette                               IN                250     675       60   Gainesville           FL      310         598
10   West Lafayette                               IN                 36      96       61   Miami                 FL      186         621
11   Lawrence                                     KS                270     784       62   Tallahassee           FL      104         438
12   Bowling Green                                KY                218     381       63   Tallahassee           FL       78         340
13   Lexington                                    KY                159     473       64   Tallahassee           FL      265         915
14   Ann Arbor                                    MI                 58     261       65   Tallahassee           FL      149         517
15   Big Rapids                                   MI                120     318       66   Tampa                 FL      209         755
16   East Lansing                                 MI                273     273       67   Tampa                 FL       48         120
17   East Lansing                                 MI                146     219       68   Atlanta               GA      183         537
18   East Lansing                                 MI                347     585       69   Atlanta               GA      221         676
19   Springfield                                  MO                150     348       70   Atlanta               GA      237         685
20   Omaha                                        NE                240     360       71   Macon                 GA       96         306
21   Cincinnati                                   OH                351     1,029     72   Marietta              GA      248         816
22   Kent                                         OH                126     384       73   Lafayette             LA      191         595
23   Vermillion                                   SD                169     496       74   Starkville            MS      250         656
24   Vermillion                                   SD                 74     236       75   Starkville            MS      300         820
25   Green Bay                                    WI                126     300       76   Greenville            NC      192         609
Mountain States Region                                                                77   Raleigh               NC       81         188
26   Denver                                       CO                253     919       78   Raleigh               NC       42         114
27   Bozeman                                      MT                225     887       79   Raleigh               NC      174         658
28   Missoula                                     MT                176     500       80   Charleston            SC       74         258
29   Missoula                                     MT                 52     208
                                                                                      81   Charleston            SC      114         343
30   Las Vegas                                    NV                226     758
                                                                                      82   Seneca                SC      298         994
31   Las Vegas                                    NV                215     601
32   St. George                                   UT                113     416       Southwest Region

Northeast Region                                                                      83   Flagstaff             AZ      192         650

33   Boston                                       MA                207     805       84   Tucson                AZ      200         540
34   Buffalo                                      NY                 92     302       85   Tucson                AZ       55         183
35   Ithaca                                       NY                442     872
                                                                                      86   Tucson                AZ      154         595
36   Bethlehem                                    PA                144     428
                                                                                      87   Stillwater            OK      201         475
37   Kutztown                                     PA                110     408
38   Philadelphia                                 PA                126     251       88   Arlington             TX      298         687

39   Philadelphia                                 PA                192     533       89   Austin                TX      129         439
40   Philadelphia                                 PA                734     1,351     90   Austin                TX      157         450
41   Pittsburgh                                   PA                 88     120
                                                                                      91   Austin                TX       64         239
42   Pittsburgh                                   PA                186     473
                                                                                      92   Austin                TX      100         250
43   State College                                PA                158     662
44   Harrisonburg                                 VA                140     425       93   Denton                TX      189         700

Pacific Coast Region                                                                  94   Huntsville            TX      184         653

45   Berkeley                                     CA                 70     238       95   Huntsville            TX      150         544
46   Irvine                                       CA                500     1,441     96   San Antonio           TX      235         932
47   Sacramento                                   CA                 90     300       97   San Marcos            TX      143         234
48   San Francisco                                CA                200     600
                                                                                      98   San Marcos            TX      183         348
49   Corvallis                                    OR                124     624
                                                                                      99   San Marcos            TX      232         510
50   Eugene                                       OR                231     444
51   Portland                                     OR                141     141

 © 2020 FourPoint Investment Sales Partners. All Rights Reserved.                   FOURPOINT 2019 STUDENT HOUSING YEAR-END REPORT    |     27
2020 STUDENT HOUSING DEVELOPMENT PIPELINE

                    44

                                42 43
            40 41

                                                                                                          9 10 17
                                                                                                                                                           3031
                                                                                                                                                                                32
                                                                                                                                                                             2829
                                                                                                                                                 1213            3334
            38      2223                         2425                                          11                                                   16
          37                                                    1920                                                     12        56          1415                   2627
           39                                                      21                                                    3 4
                                                                 18                                                                     8 7                      36
                                                                                                                                                          35
                                                                                                                                                    63   64 6769
                                                                                                                                           7677           6870
                                                                                                                                               6566
                                                                                                          49                                       75          7172
                                                                                                                                             60        73 74
                                          79
                                         78 80                                                                                     47       6159
                                                                                                                                  48
                                                                                                                                        4546
                                                                                        8182                   62                               58
                                                                                    8384                                                       56
                                                                                    8889       8687                                                      51-54
                                                                                     90           85

     2020 deliveries will continue the eight-year                                                                                                           57
     development boom in the student housing space.                                                                                                                   50
                                                                                                                                                                      55
     The above map pinpoints all known developments as
     reported by Axiometrics and FourPoint independent
     research.

      2019 Portfolio Student Housing Development Pipeline Totals

          90 PROPERTIES    IN PIPELINE
                                                                16,389                                UNITS
                                                                                                      IN PIPELINE
                                                                                                                                   44,534 BEDS                                 IN PIPELINE

     Pacific Coast Region                                                                       Midwest Region
     # OF PROPERTIES IN PIPELINE          # OF UNITS PIPELINE   # OF BEDS IN PIPELINE               # OF PROPERTIES IN PIPELINE         # OF UNITS PIPELINE             # OF BEDS IN PIPELINE

                     8                           1,454                  4,761                                   17                             2,233                           4,941

     Mountain States Region                                                                     Southeast Region
     # OF PROPERTIES IN PIPELINE          # OF UNITS PIPELINE   # OF BEDS IN PIPELINE               # OF PROPERTIES IN PIPELINE         # OF UNITS PIPELINE             # OF BEDS IN PIPELINE

                     8                           1,319                  4,273                                   33                             6,450                          17,255

     Southwest Region                                                                           Northeast Region
     # OF PROPERTIES IN PIPELINE          # OF UNITS PIPELINE   # OF BEDS IN PIPELINE               # OF PROPERTIES IN PIPELINE         # OF UNITS PIPELINE             # OF BEDS IN PIPELINE

                    13                           2,823                  7,725                                   11                             2,110                           5,579

28    |    FOURPOINT 2019 STUDENT HOUSING YEAR-END REPORT                                                                      © 2020 FourPoint Investment Sales Partners. All Rights Reserved.
2019 STUDENT HOUSING DEVELOPMENT PIPELINE

 #     CITY                                         STATE               UNITS   BEDS      #    CITY                 STATE    UNITS       BEDS
 Midwest Region                                                                           Southeast Region
 1     Champaign                                      IL                322     658       45   Auburn                AL      221         610
 2     Champaign                                      IL                 50     164       46   Auburn                AL      140         500
 3     Champaign                                      IL                 30     104       47   Birmingham            AL      196         518

 4     Champaign                                      IL                 20      68       48   Tuscaloosa            AL      132         296

 5     Indianapolis                                  IN                  56      98       49   Russellville          AR      240         519

 6     Lawrence                                      KS                 120     312       50   Davie                 FL      225         775

 7     Lexington                                     KY                 176     581       51   Gainesville           FL      156         492

 8     Louisville                                    KY                 231     591       52   Gainesville           FL      109         413

 9     Minneapolis                                   MN                 169     192       53   Gainesville           FL      235         618

10     Minneapolis                                   MN                 114     417       54   Gainesville           FL      310         589

11     Omaha                                         NE                 247     371       55   Miami                 FL      886         1,244
                                                                                          56   Tallahassee           FL      272         891
12     Cleveland                                     OH                 115     235
                                                                                          57   Tampa                 FL      217         640
13     Cleveland                                     OH                  64     236
                                                                                          58   Albany                GA       75         216
14     Columbus                                      OH                 133     300
                                                                                          59   Atlanta               GA      230         801
15     Columbus                                      OH                 258     258
                                                                                          60   Carrollton            GA      200         628
16     Youngstown                                    OH                  75     185
                                                                                          61   Kennesaw              GA      179         656
17     Menomonie                                     WI                  53     171
                                                                                          62   Ruston                LA      118         324
 Mountain States Region
                                                                                          63   Boone                 NC      146         380
18     Colorado Springs                              CO                  42     154
                                                                                          64   Chapel Hill           NC      300         626
19     Fort Collins                                  CO                 233     767
                                                                                          65   Cullowhee             NC       62         248
20     Fort Collins                                  CO                 107     402
                                                                                          66   Cullowhee             NC       52         210
21     Greeley                                       CO                  72     108
                                                                                          67   Durham                NC       80         200
22     Reno                                          NV                 158     508
                                                                                          68   Raleigh               NC      217         644
23     Reno                                          NV                 125     330
                                                                                          69   Raleigh               NC      132         326
24     Orem                                          UT                 300     960
                                                                                          70   Raleigh               NC      180         523
25     Orem                                          UT                 282     1,044
                                                                                          71   Wilmington            NC      150         493
 Northeast Region
                                                                                          72   Wilmington            NC      150         470
26     Towson                                        MD                 248     611
                                                                                          73   Columbia              SC      132         507
27     Towson                                        MD                 214     720
                                                                                          74   Conway                SC      182         564
28     New Brunswick                                 NJ                 181     575
                                                                                          75   Spartanburg           SC      200         486
29     New Brunswick                                 NJ                 186     592
                                                                                          76   Knoxville             TN      160         310
30     Buffalo                                       NY                 219     232
                                                                                          77   Knoxville             TN      166         538
31     Buffalo                                       NY                 322     354
                                                                                          Southwest Region
32     New York                                      NY                  80     153       78 Tempe                   AZ      391         1024
323 State College                                    PA                 247     824       79 Tempe                   AZ      268         464
34     State College                                 PA                 268     1,093     80 Tempe                   AZ      285         723
35     Blacksburg                                    VA                  75     215       81 Arlington               TX      298         701
36     Lynchburg                                     VA                  70     210       82 Arlington               TX      298         700
 Pacific Coast Region                                                                     83 Austin                  TX      156         512
37     Berkeley                                      CA                  58      74       84 Austin                  TX      166         567
38     Davis                                         CA                 160     540       85 Houston                 TX      147         405
39     San Jose                                      CA                 260     1,039     86 Huntsville              TX      150         544
40     Corvallis                                     OR                 146     446       87 Huntsville              TX      181         724
41     Corvallis                                     OR                 228     687       88 San Marcos              TX      220         754
42     Pullman                                       WA                 187     767       89 San Marcos              TX      120         373
43     Pullman                                       WA                 188     558       90 San Marcos              TX      143         234

44     Seattle                                       WA                 227     650

     © 2020 FourPoint Investment Sales Partners. All Rights Reserved.                   FOURPOINT 2019 STUDENT HOUSING YEAR-END REPORT     |     29
Property: West Edge
Developer: Gilbane
University: University of Colorado at Colorado Springs
Photo: David Patterson Photography

Student Housing
Supply & Demand                                          “   Gilbane’s student housing business is evolving to address new market
                                                             realities, including higher costs and dwindling pedestrian land supply,
                                                             through a greater emphasis on density and a refined set of high impact
                                                             amenities. PEDESTRIAN LOCATIONS WITH HIGH BARRIERS TO ENTRY
                                                             AND POSITIVE ENROLLMENT TRENDS WILL REMAIN KEY METRICS
Analysis                                                     FOR OUR UNDERWRITING while we concurrently look to enhance our
                                                             communities with more academically-oriented amenities including
                                                             virtual learning centers, micro study pods and wellness centers. These
                                                             purposeful amenities along with ultra-livable units will provide our
                                                             students with the Next Level of Student Housing® for 2020 and beyond.

30     |   FOURPOINT 2019 STUDENT HOUSING YEAR-END REPORT
                                                             EDWARD T. BRODERICK
                                                             CEO and President
                                                             Gilbane Development Company
                                                                                                                                         ”
                                                                                     © 2020 FourPoint Investment Sales Partners. All Rights Reserved.
You can also read