Does Student Loan Forgiveness Drive Disability Application? - NBER
←
→
Page content transcription
If your browser does not render page correctly, please read the page content below
Does Student Loan Forgiveness Drive Disability
                       Application?

                                               Philip Armour
                                              RAND Corporation

                                              Melanie A. Zaber
                                              RAND Corporation

Student loan debt in the US exceeds $1.3 trillion, and unlike credit card and medical debt,
typically cannot be discharged through bankruptcy. Moreover, this debt has been increasing: the
share of borrowers leaving school with more than $50,000 of federal student debt increased from
2 percent in 1992 to 17 percent in 2014. However, federal student loan debt discharge is
available for disabled individuals through the Department of Education's Total and Permanent
Disability Discharge (TPDD) mechanism through certification of a total and permanent
disability. In July 2013, the TPDD expanded to include receipt of Social Security Disability
Insurance (SSDI) or Supplemental Security Income (SSI) as an eligible category for discharge,
provided medical improvement was not expected. Using data from the Survey of Income and
Program Participation (SIPP) matched to SSI and SSDI applications, we find that SSDI and SSI
application rates increased among respondents with student loans relative to rates among those
without student loans. Our estimates suggest the policy change raised the probability of applying
for SSDI or SSI in a given quarter among student loan-holders by 50% (baseline rate per quarter
is approximately 0.3%), generally increasing SSI and SSDI awards. However, these induced
award recipients were unlikely to receive the disability designation necessary to obtain student
loan discharge. Given that the geographic distributions of student loan indebtedness and
historical SSDI/SSI program participation differ, there are strong implications for both the size
and location of SSDI and SSI beneficiaries. Furthermore, these findings highlight the importance
of learning from policy changes in programs that interact with SSDI and SSI to better understand
the drivers of disability program participation.

We would like to thank Kathleen Mullen, Priyanka Anand, and Fatih Unlu for helpful comments. We are also
grateful to seminar participants at the US Social Security Administration, the American Public Policy and
Management annual meetings, and the Center for Causal Inference for useful discussions that shaped the paper. Any
remaining errors are our own. We thank Rushil Zutshi for research support. The research reported herein was
performed pursuant to grant RDR18000003 from the US Social Security Administration (SSA) funded as part of the
Retirement and Disability Research Consortium. The opinions and conclusions expressed are solely those of the
author(s) and do not represent the opinions or policy of SSA, any agency of the Federal Government, or NBER.
Neither the United States Government nor any agency thereof, nor any of their employees, makes any warranty,
express or implied, or assumes any legal liability or responsibility for the accuracy, completeness, or usefulness of
the contents of this report. Reference herein to any specific commercial product, process or service by trade name,
trademark, manufacturer, or otherwise does not necessarily constitute or imply endorsement, recommendation or
favoring by the United States Government or any agency thereof.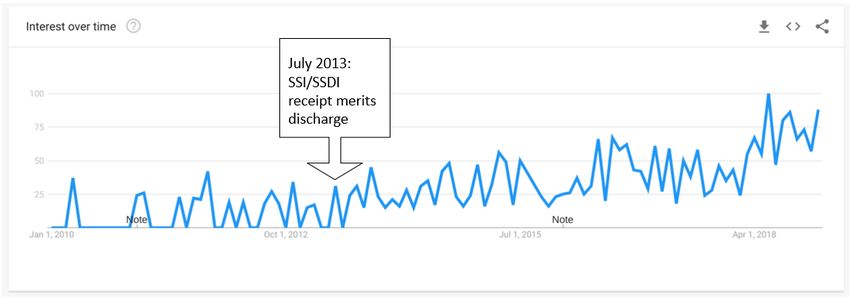
Introduction
Rising costs of postsecondary education coupled with increasing labor market returns to
postsecondary education have jointly created a rapid increase in the number of students financing
some or all of a postsecondary education with student loans over the past two decades (Lochner
and Monge-Naranjo, 2016). Simultaneously, finding and keeping a job (with or without a college
education) has become a much less certain prospect (Lochner and Shin, 2014; Hoynes et al.,
2012). Thus, the traditional way of getting rid of one’s student loans—paying them off—has
become more challenging, and some loan-averse students have sought out alternative means of
financing their education (Marcus 2016). Student loan debt is increasing particularly quickly
among older Americans; between 2005 and 2015, the amount of federal student loan debt held
by borrowers age 50 to 64 increased from $43 billion to $183 billion (GAO 2016).
        Student loan debt has been linked to delays in marriage (Bozick and Estacion 2014),
declining homeownership (Houle and Berger 2015), reduced entrepreneurship (Ambrose et al.
2015), and a decrease in work-life balance satisfaction and reduced childbearing (Velez et al.
2018). Student loans are generally not dischargeable in bankruptcy.
        Certain fields like teaching, medicine, and public service offer loan forgiveness
programs. However, for those in other career fields or otherwise ineligible for these programs, an
earnings shock can strain one’s ability to repay student loans. The onset of a work-limiting
disability is an example of such an earnings shock, and the Department of Education recognizes
the difficulty of repaying student loans on a fixed income by offering student loan discharge for
disabled individuals.
Disability discharge of student loans
Prior to 2013, the Department of Education’s Total and Permanent Disability Discharge (TPDD)
allowed for two classes of student loan borrowers to have their federal student loans discharged:
veterans with a 100% service-connected disability rating or an individual unemployability rating,
or an individual who has a licensed physician certify an inability to engage in substantial gainful
activity due to a physical or mental impairment lasting at least 60 months or that will result in
death. However, in July of 2013, the TPDD mechanism expanded to include individuals who
were receiving SSDI or SSI benefits, although this expansion was limited to SSDI or SSI
beneficiaries with a “medical improvement not expected” determination, a subset of all
beneficiaries, as discussed below in the SSDI and SSI section.
         In theory, the prior allowance for a physician’s certification is the same criterion as that
used by SSA in determining a disability of at least 60 months (an inability to perform substantial
gainful activity) and does not require the individual satisfy the SSI asset test or be covered by
SSDI, but the ability to have the SSA determination process directly satisfy the documentation
requirements of TPDD substantially reduces the TPDD-related application costs, as well as
increases the benefit of SSDI or SSI participation. Furthermore, this expansion to the TPDD
criteria was widely publicized, increasing the saliency of TPDD as a pathway to student loan
discharge, as evidenced in the frequency of searches for “tpd discharge” reported by Google
Trends.
Figure 1: Google Searches for “tpd discharge” from 2010-2018
Note: Y-axis shows an index of frequency of Google searches over this time period, with the lowest value in this
time period indexed to 0, and the highest value indexed to 100. The frequency of searches roughly doubled after the
policy change (comparing 2012 and 2013), but Google does not make the base number of searches available. The
data have not been smoothed or filtered.
Searches for “tpd discharge” were at their lowest prior to the July 2013 expansion; after this
expansion there was a sustained increase in the frequency of searches relative to before. This
increase does not appear to have subsided. Although not conclusive evidence, the timing of this
first uptick in awareness and information seeking as to TPDD appears to have aligned with the
expansion of TPDD to include SSDI or SSI beneficiaries.
Social Security Disability Insurance and Supplemental Security Income
SSDI and SSI are the largest federal disability programs not limited to veterans or federal
employees and are both administered by the Social Security Administration (SSA), with the
same definition of disability: a health condition preventing earning at the Substantial Gainful
Activity (SGA) level that is expected to last at least 12 months or result in death, where SGA is
defined as earning at least $1,260 per month and is indexed to the national wage level. In
additional to this earnings limitation, both programs have non-medial requirements. Applicants
for SSDI must have a recent work history covered by Social Security: at the time of their
disability applicants must having earned 40 quarters of coverage1 overall, 20 of which had to
have been earned in the past 10 years, although younger workers have lower requirements.
Applicants without this work history are denied on technical grounds. Applicants for SSI cannot
have deemed resources over $2,000 per person, or $3,000 per couple, with certain exceptions,
such as the value of a home or car. Individuals applying to either program, or both concurrently,
go through the disability determination process administered by their states’ Disability
Determination Services (DDS).
This determination process involves a substantial amount of time and documentation,
requiring applicants to satisfy the non-medical requirements, as well providing medical and
vocational information to allow for determination by an examiner. Although SSDI-only
applicants can begin this process online, applicants for SSI or concurrent SSDI-SSI applicants
must file their claims either over the phone or in-person at a Social Security field office.
1
Workers earn a quarter of coverage for every $1,410 of Social-Security-covered earnings, up to four per
year. This amount is indexed to wage growth.Deshpande and Li (2019) find that the proximity and congestion of a local field office have a
substantial impact on the likelihood of applicant.
The up-to-five-step determination process is described below, with the first step
conducted by the field office and steps two through four conducted by the DDS examiner:
1) Applicants with earnings at or above the SGA level are denied.
2) Applicants with impairments deemed not severe or of short duration are denied.
3) Applicants with impairments that meet or equal a condition in the Listing of
Impairments are allowed on medical grounds.
4) Applicants who do not satisfy stage (3) and have a capacity for past work are denied.
5) Applicants who do not satisfy stage (3), but do not have capacity for past work or for
any work in the national economy are allowed; otherwise they are denied.
The median processing time for an initial application was 3.4 months. However, only a third of
initial applications are allowed, requiring the remaining applicants to either accept this denial or
appeal this denial, either to another examiner through reconsideration when required (with a
median processing time of 8 months), or directly to an Administrative Law Judge (ALJ).
Approximately half of those initially denied (that is, a third of the overall initial applicant pool)
eventually appeal to an ALJ, where the median processing time is 28.8 months, with, ultimately,
only just over 40 percent of applicants being accepted (Autor et al. 2015). This application
process can thus take a substantial period of time for a typical applicant, during which the
applicant cannot engage in SGA and is more likely than not to be denied benefits.
However, less frequently discussed in the literature of SSDI or SSI application is the
category of determination upon award. Applicants whose applications are successful can fall into
one of three categories: “medical improvement expected” with a Continuing Disability Review
(CDR) scheduled 6 to 18 months later to determine if the individual has medically improved;
“medical improvement possible” with a CDR scheduled for 3 years later; or “medical
improvement not expected” with a CDR scheduled for 5 to 7 years later. It is only this latter
category of determination that leads to eligibility for TPDD, and in SSA’s Disability Analysis
File, only 25.1% of SSDI/SSI beneficiaries have a “medical improvement not expected”
determination.2
Although SSDI and SSI have the same disability determination process, they differ in the
non-disability components of eligibility: SSDI is part of the Old Age, Survivors, and Disability
Insurance system, often generally referred to as “Social Security,” and is thus social insurance.
Applicants must have a sufficient work history to be eligible for, and thus covered by, SSDI, and
their potential monthly benefit is based on their history of Social Security covered earnings. SSI,
on the other hand, is a means-tested program, with a maximum federal benefit that is reduced by
receipt of other income.
A frequent topic of research in disability research is explaining the substantial temporal
and geographic variation in participation in these programs. Decades of per-capita SSDI program
growth, referred to as a “fiscal crisis unfolding” (Autor and Duggan 2006), continuing through
the Great Recession (Liebman 2015), have given way to declining applications and awards in
recent years (SSA, 2018). These changes have not been confined to mere changes in the overall
size of the program: the composition of disabling conditions has shifted toward mental and
2
See https://www.ssa.gov/disabilityresearch/documents/daf_puf/DAFPublicUseFileDocumentation.pdf
Page 97.musculoskeletal conditions, as well as toward female beneficiaries amidst increased female labor
force participation through the end of the 20th century (Duggan and Imberman 2009).
Another facet of heterogeneity is the wide variation in disability program participation
across counties within the US, from fewer than 1 percent to over 20 percent of county
population. The literature exploring the explanations for this geographic variation point to
differences in underlying disabling health conditions, strength of the local economy, and
participation rates among those with disabling condition as the drivers for these differences, not
differences in program administration (Gettens et al., 2018).
Indeed, one of the earliest well-identified studies of drivers of local SSDI participation
showed that closures of local coal mines led to corresponding upticks in local disability program
participation rates (Black et al., 2002). Studies such as this one began an ongoing literature in
defining “conditional applicants”: individuals who may satisfy the medical definition of
disability but will apply only in the presence of a non-health factor. This literature seeks to
identify the non-health shocks that can induce application in this population, thereby revealing
the conditions and types of individuals under which such individuals’ disability program
application is contingent. Benefit replacement rates for low-skill workers (Autor and Duggan
2003), availability of health insurance (Maestas et al. 2014), and declining value of Social
Security retirement benefits (Duggan et al. 2007) have all been linked to greater likelihood of
application to SSDI or SSI. However, recent evidence on the impact of Medicaid expansion of
disability program participation has shown zero or only a small impact (Anand et al. 2019,
Schmidt et al. 2019), indicating that the type of health coverage and the affected population are
vital for understanding the population of conditional applicants.
A more recent line of research concerned with conditional applicants has focused not on
these factors external to SSDI or SSI, but on transaction or information costs associated with the
programs themselves as a driver in application prevalence. These studies have shown that
closures of local Social Security offices (Deshpande and Li 2019), expansion of online
application options (Foote et al. 2019), and merely informing individuals that they are covered
by SSDI (Armour 2018) all can account for differences in SSDI application rates on the order of
double-digit percentage differences.
This transaction cost-related research on SSDI and SSI join a larger recent literature
showing the importance of information costs and barriers to public program participation, from
the EITC (Bhargava and Manoli 2015) to SNAP (Daponte et al. 1999) to postsecondary
enrollment (Hoxby and Turner 2015; Barr and Turner 2018; Dynarski et al. 2018). In contrast to
the theoretical basis for imposing ordeals to increase targeting efficiency – wherein those less
likely to participate in the presence of transaction costs represent those least in need of the
program at hand – these studies often show that the transaction-cost-marginal applicant is as
likely to be accepted onto SSDI or SSI, if not more likely, than the average applicant. Indeed,
increasing evidence points to frictions in optimization increasing among the neediest potential
beneficiaries (Finkelstein and Notowidigdo 2019), suggesting that “ordeals” mechanisms may
not be an appropriate second-best tool in these contexts.
This study contributes to the aforementioned research base in three ways: first, it provides
evidence of a new margin for disability application based not on health or income, but debt.
Although it is not the first to do so, other work in this area is still in-progress, with preliminary
indications that bankruptcy, foreclosure, eviction, and home sale peak around the time of
disability application (Deshpande et al. 2019). Second, the role of student debt in driving new
SSDI and SSI applications has strong implications for the geographic distribution of disabilityprogram participation, given that the geographic distribution in student loan indebtedness, and
hence the marginal applicants identified in this study, differs considerably from the pre-existing
geographic distribution of SSDI and SSI program participation. And third, the nature of the
TPDD policy change and the resulting magnitude of behavioral response in increased SSDI/SSI
application speaks to a prior lack of awareness or existing transaction costs in the TPDD
program, especially given the costly and restrictive SSDI/SSI route to TPDD.
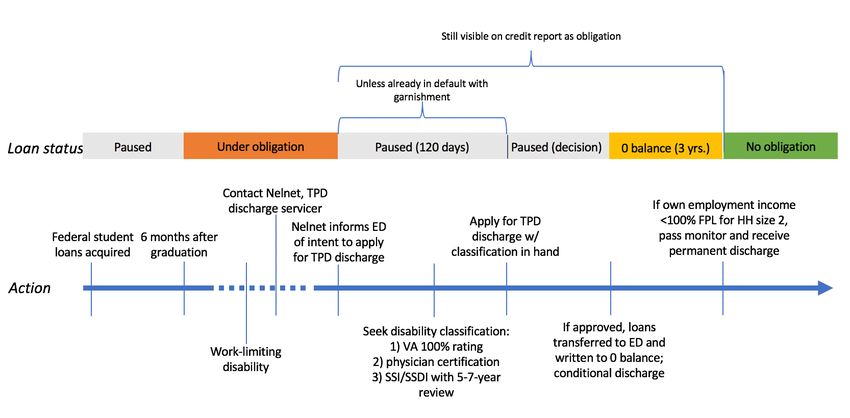
Obtaining a student loan discharge through the TPDD program
As shown in Figure 2, the TPD discharge is not an instant process. Any amount of time after
experiencing a work-limiting disability, a student loan borrower can contact Nelnet, the
Department of Education’s (ED) servicer for the disability discharge program. If the borrower
expresses interest in applying for TPD discharge, Nelnet notifies the ED of his or her intent to
apply, and student loan payments are paused for 120 days unless the borrower is already in
default. The borrower then can choose a method of demonstrating disability. After the 2013
policy change, one of these methods is receiving SSI or SSDI with a 5-7 year review period. A
borrower could newly apply for SSI or SSDI, or already be receiving SSI or SSDI. With that
certification in hand, the borrower applies for TPD discharge through Nelnet. At this point,
payments on his or her federal student loans are paused indefinitely while a decision is made
(again, assuming the loans are not already in default). If the application is approved, the student
loans are transferred to the ED and the balance is zeroed out for a three-year monitoring period.
Note that the student loans are still visible on the credit report while paused and throughout the
monitoring period as an obligation.
Figure 2: TPD Discharge Application Process and Timeline
During the monitoring period, the borrower is subject to income verification. If his or her
own employment income (non-wage and salary income is excluded, as is other household
income) remains below 100 percent of the federal poverty line for a household of two adults for
the entirety of the three-year period, the monitoring period ends and he or she receives a
permanent discharge, with no remaining obligation on federal loans. The discharge of student
loans was considered taxable income until January 2018.Data
The chief requirement of any analysis of the impact of the SSDI/SSI TPD discharge expansion
on SSDI/SSI application is a data source containing both measures of SSDI/SSI application and
variation in “treatment,” be it pre-policy-change vs. post-policy change, existing federal student
loan indebtedness, or, preferably, both. The first choice for such a data source would be
individually matched administrative records containing both Social Security records with timing
of SSDI/SSI application and Department of Education or credit bureau data on federal student
loan indebtedness; however, such a match is beyond the scope of this analysis.
Instead, our primary analysis draws on survey data – the 2014 Panel of the Survey of
Income and Program Participation (SIPP) and its accompanying self-reported student loan
indebtedness variables, as well as its rich array of sociodemographic variables – matched to
Social Security Form 831 files, which contain a record for every application to SSDI, SSI, or
both for each individual in the 2014 SIPP that gives permission for such a match for research
purposes.
SSI/SSDI application data
Our measures of SSDI and SSI application and award, as well as characteristics of the applicants
and awardees, come from the same source: SSA Form 831 files. Each state’s Disability
Determination Service (DDS) renders the initial medical determination for individuals applying
for disability benefits under Title II (SSDI) and Title XVI (SSI); the Form 831 file contains data
from these DDS decisions.
A Form 831 record is established once the DDS makes its decision. Subsequent decisions
or corrections to earlier decisions result in additional records with the same identifiers but with
new values and dates. The key identifying fields, Social Security Number (SSN) and Beneficiary
Identification Code (BIC), identify the individual and Filing Date (FLD) records the filing date
of an application. Yearly Form 831 files are available back to 1988 and have uniform record
layouts beginning with 1989. A person may have several 831 records in the same and/or different
yearly files, and multiple Form 831 records are present if a person filed concurrent Title II and
Title XVI claims, if an initial claim was denied and was then appealed, or if more than one
application was filed.
Of particular relevance for this analysis are which program the applicant applied to,
recorded in the RID variable, and whether the applicant applied concurrently to both, recorded in
the CCF variable. The result of their determination – whether they were determined to be
disabled – is recorded in the RDT variable, whether the disability is deemed permanent (and
hence eligible for TPD discharge) is recorded in the DPM variable, and the body system
corresponding to the primary diagnosis code is recorded in the BS variable, from which we
construct three types of awardees: musculoskeletal, mental conditions, and other.
We discuss below how we construct application and award outcomes from these Form
831 files differently for our two analyses.
SIPP student loan data
The Census Bureau has administered a version of the SIPP since 1984, eliciting information on
income from multiple sources, public program participation, work characteristics, and family and
household structure, among other individual- and household-level characteristics. The SIPP is a
longitudinal survey: once a new SIPP panel begins, households are re-interviewed every wave,
running from 2.5 to 4 years. The SIPP sample universe is the civilian, noninstitutionalizedpopulation of the United States, with the 2014 SIPP sample is a multistage stratified sample of
53,070 housing units based on addresses from, chiefly, the 2010 Decennial Census.
The SIPP underwent a major re-engineering starting with the 2014 panel: in contrast to
prior panels, in which respondents were interviewed every four months with references to work,
income, and program participation in each month since the last interview, the 2014 SIPP
conducts annual interviews, with references to the twelve preceding months. Therefore the first
wave of the 2014 SIPP refers to the 2013 calendar year. To address data quality issues related to
recall bias over a longer reference period, the 2014 SIPP includes an Event History Calendar
(EHC) to enhance respondent recall. According to the 2014 SIPP Panel Users’ Guide: “The EHC
helps respondents recall information in a more natural ‘autobiographical’ manner by using life
events as triggers to recall other economic events. For example, a residence change may often
occur contemporaneously with an employment change. The entire process of compiling the
calendar focuses, by its nature, on consistency and sequential order of events, and attempts to
correct for otherwise missing data. The EHC was developed through a series of annual field tests
conducted between 2010 and 2013” (Census Bureau 2016).
During SIPP interviews, respondents can consent to administrative data linkage using
personal information; consenting respondents who match to a Social Security record are given a
Protected Identity Key (PIK) that links individuals’ SIPP data with administrative records. Of the
72,065 respondents in universe for SSA disability programs in wave 1 of the 2014 SIPP, 64,721
(90 percent) of the cases had had a successful match between SIPP data and SSA administrative
records (Giefer et al. 2015), with the remaining 10 percent of the cases unmatched due to either a
lack of respondent consent or an inadequacy of SIPP personal information in facilitating a match.
Unlike the 2008 SIPP panel, the 2014 SIPP includes questions specifically about debt
from student loans and educational expenses. For each reference month, respondents are asked
about a range of debt, but our primary analysis focuses on individuals who answer in the
affirmative to “Owed any money for student loans or educational-related expenses during the
reference period.” The earliest reference period available is January 2013, therefore preceding
the 2013 TPDD change.
Finally, we use only an indicator for any student loan debt to further isolate ourselves
from any such bias: TPDD results in discharge of federal student loan debt. Provided individuals
have other forms of student loan debt not discharged via TPDD, or at least not as quickly, such
individuals would still be included in our treatment group.3
Descriptive statistics
Using the 90 percent of SIPP respondents with matched SSA records, we construct an analytic
file at the quarter by person level, following a discrete hazard approach of individuals “at risk” of
first SSDI or SSI application (Allison 1984, Armour 2018). That is, starting in quarter one of
2010, we include an observation for each individual for each quarter in which he or she has not
applied for SSDI or SSI, or applied for SSDI or SSI for the first time in that quarter, with no
additional observations after their first application. We follow individuals through the end of
2016, with SSDI or SSI application observed from the Form 831 records. We then match
individual-level characteristics from the first reference month from wave 1 of the 2014 SIPP
(again, refencing calendar year 2013). Although there are potentially multiple Form 831 per
SIPP respondent, our measures of application correspond to the earliest such application. We
3
Furthermore, research by Akers and Chingos (2014) suggests that more than a third of students
with federal student loan debt are unaware they have federal debt, suggesting that the distinction may be
unclear to many, again leading to conservative bias.also construct our award based on the filing date corresponding to their awarded application
record.
We conduct analyses over two analytic samples: one of all matched SIPP respondents,
and a second based on those covered by SSDI in the previous year, calculated based on the
Summary Earnings File from the prior year meeting the recent work and total quarter
requirements. Summary statistics for these two samples, as well as the subgroups with and
without student debt, are reported in Table 1. Student debt holders tend be younger and more
educated, are more likely to have credit card debt, and have an average total student debt level of
over $23,000.
Empirical strategy
We follow a discrete-hazard approach, not a duration model, to estimating the effect of the
TPDD expansion on SSDI/SSI application (Allison 1984). A traditional duration model would
require a well-defined and observable “beginning” of the duration, or in this context, the onset of
a potentially disabling health condition. In the context of disability policy studies, not only is
disability onset difficult to observe in most surveys, the relevant onset – when a condition first
manifested, when it first began to interfere with participation opportunities, when it first began to
interfere with work, when other health conditions or life circumstances exacerbated any
interference, or employment separation – depends vitally on the context at hand. Instead, the
discrete-hazard approach allows us to define at a point in time the population “at risk” of SSDI
or SSI, and, accounting for a range of individual and economic characteristics, estimate the effect
of a policy change in the presence of well-defined treatment and control groups. Using our Form
831 files, we construct a longitudinal file wherein an individual contributes an observation in a
quarter if he or she is “at risk” in that quarter: if they are age 18 to 65 and have not previously
applied SSDI or SSI, and, in the case of our SSDI application model, had sufficient Quarters of
Coverage to be covered by SSDI by the end of the year prior to the current quarter. Our sample
window stretches from Quarter 1 of 2010 to Quarter 4 of 2016. Given the timing of the treatment
during Quarter 3 of 2013, we exclude this quarter from the file. In the 699,478 quarter-year
observations “at-risk” of SSDI application in this window, we observe 2,194 SSDI or SSDI/SSI-
concurrent first-time applications. In the 1,071,957 quarter-year observations “at-risk” of either
SSDI or SSI application, we observe 3,243 first-time applications to one of these disability
programs.
We merge on to this longitudinal file our Wave 1 2014 SIPP file which contains rich
sociodemographic variables as well as student loan indebtedness, used to define our treatment
and control groups. For the reasons indicated above – TPDD does not necessarily apply to non-
federal student debt and the timing of the student debt question – we define our treatment group
as those reporting any student loan debt in their own name for January of 2013, and who are
treated beginning after Quarter 3 of 2013. Our control group are those reporting no student loan
debt for January of 2013.4
Our individual-level analysis then takes the form of a classic difference-in-differences
specification:
!""#$%&'$()*+ = . + 0 (2 > 201383) + :;'?'* + @ (2 > 201383);'?'*
+ AB*+ + C+ + D*+ (1)
4
We conduct similar analyses with student loan debt in any month of 2014 as our treatment, and in no
month of 2014 as our control, with no significant differences in results.Where β represents our treatment effect – the estimated coefficient on application for
those with student loan debt in quarters after the TPDD policy change. We control for a range of
individual-level characteristics, represented in the X matrix: age, age-squared, sex, race/ethnicity
(non-Hispanic white, non-Hispanic black, non-Hispanic other race, and Hispanic), marital status,
and educational attainment.5 The collection of coefficients γ correspond to quarter fixed effects.
The specification above represents a linear specification, although our primary specification is a
logit. We cluster our standard errors at the individual-level but have also estimated linear models
with two-way clusters at the individual and quarter level, with no change in significance of our
findings; we also present results based on unweighted and weighted logit specifications, although
our preferred causal estimate is based on the unweighted logit with individual-level clustered
standard errors (Solon et al. 2015). For robustness, we estimate our analysis both with OLS and
WLS specifications, with the latter weighting based on the 2014 SIPP Wave 1 person-level
weights, with qualitatively and quantitatively similar results. We conduct analyses with two
samples: all “at-risk” individuals, where the outcome measured is SSDI, SSI, or SSDI/SSI-
concurrent applications; and a subset of individuals covered by SSDI in the prior year, where the
outcome measured is SSDI or SSDI/SSI-concurrent applications, since this outcome is only
possible for those covered by SSDI.6 Since we report odds ratios, in the presence of a detectable
policy effect, we expect restricting the sample to those covered by SSDI to increase the
proportional increase in the likelihood of an application observed, since we do not observe
technical denials in our data.
We do not focus on SSI-only applicants, since the wealth measures in the SIPP are not
detailed enough for a determination of whether an individual would satisfy the resources limit in
SSI.
The underlying assumption behind this estimation approach is that, conditional on
observable covariates, relative rates of disability program application among those with and
without student debt in early 2013 would be unchanged over our sample window, if not for the
July 2013 change in TPDD eligibility mechanism. This persistent difference in disability
program participation rates between those with and without student debt is accounted for by our
estimate of ρ; furthermore, we account for population-wide changes in rates of disability
program application with δ, both as a general “post-July-2013” control, and in additional
specifications, as quarter-specific fixed effects.
The primary threat to this assumption is the presence of differences in disability program
participation by student loan indebtedness, over the time period in question, independent of the
TPDD discharge change. In our analyses below, we attempt to address this issue by conducting
placebo tests, such as estimating TPDD “effects” for those with other forms of debt who should
be unaffected by the TPDD change, as well as by estimating pre-TPDD time-trend differences by
student-loan indebtedness to determine whether relative disability program participation rates
appear to be changing over time.
Additionally, we examine the extent to which different types of individuals are induced to
apply to SSDI or SSI by the TPDD change. For example, the welfare implications of new
applicants differ if these applicants were previously high earners who opted to leave employment
5
Note that due to our discrete-hazard empirical approach, whereby we define our sample as those “at-
risk” of first-time SSDI or SSI application, our outcome variable is binary and an absorbing state, and
hence we are unable to include individual-level fixed effects.
6
Technical denials, including SSDI denials because the applicant is not covered by SSDI, are not
observed in our matched Form 831 files.to enter long-term disability programs or if they were previously not working and are
transitioning from non-employment to SSDI or SSI. We also examine which types of disabling
health conditions appear most responsive, the differential effects of which have implications for
the composition of the SSDI and SSI rolls. Finally, we estimate the likelihood of not just an
SSDI or SSI award, but an SSDI or SSI award for which “medical improvement is not expected,”
the requirement for TPDD eligibility.
Results
Table 2 shows the treatment odds ratio7 estimates, indications of level of significance, and 95
percent confidence intervals from different versions of Equation 1 over the full sample, with
SSDI, SSI, or SSDI/SSI-concurrent application all resulting in a left-hand side value of one.
Moving from column 1 to 4 represents a movement to a more saturated model: Column 1
contains just a constant, dummy for any student debt, dummy for post-2013 Q3, and the
interaction term estimating our treatment effect. Our logit odds ratio estimate is highly
statistically significant, corresponding to a treatment effect of a 48% increase in the odds of
disability program application in each quarter. Adding in demographic controls, quarter fixed
effects instead of just a post-2013 Q3 dummy, and clustering standard errors at the individual
level results in a similarly highly statistically significant treatment effect of a 46% increase in the
odds of disability program application in each quarter. The final column limits the sample to
those with some college or greater educational attainment; this treatment effect is
correspondingly higher, consistent with student debt load disproportionately held by those with
educational attainment in these categories.
Table 3 next limits the analysis to the sample covered by SSDI with the outcome being
application to SSDI. The magnitude of the estimates declines slightly, with a new treatment
effect for the most saturated model – column 4 – of a 36% increase in application odds; again,
this estimate is higher for the subsample with some college or higher educational attainment. For
robustness, Appendix Tables 1 and 2 provide parallel estimates as those in Table 1, although
employing OLS or WLS specifications. The findings, in both statistical significance and point
estimate, quite similar to the logit estimates from Table 2. However, those covered by SSDI, by
definition, have a more recent attachment to the labor force or higher earnings than those not
covered by SSDI. Although these estimates are not statistically significantly different than those
from Table 2, this sample difference is one explanation for why the point estimates are lower.
Table 4 next provides estimates of the time path of application between those with
student debt and those without to determine whether there were prior trends, as well as the
pathway of the treatment effect after the policy change. Due to the large number of quarters and
limited number of applications, we aggregate our analytic sample to the year level, excluding the
partially treated year 2013. We include an indicator variable for student debt, and an interaction
with student debt for each year, omitting 2012 as the latest pre-treatment interaction. We
estimate both logit and OLS models across three samples: the entire at-risk SSDI/SSI population,
those covered by SSDI in the prior year, and those covered by SSDI in the prior year who also
7
Technically, exponentiated log odds from interaction terms in logit models, such as the difference-in-
differences treatment term reported in this analysis, are not odds ratios, but ratios of odds ratios. For simplicity, we
refer to them as odds ratios in this paper, but we also note that in the current context, the rate of “success,” or
application to SSDI or SSI, stands at only 0.3 percent, and thus the denominator of any odds (1-Pr(application)) is
very close to one. Thus, even in the presence of a tripling of the application rate, this ratio of odds ratios and odds
ratios themselves approximate a risk ratio to the hundredth decimal place.had zero earnings in the prior year, as measured in the administrative SSA Summary Earnings
Record.
All these specifications show that there is no statistically significant pre-trend, whereas
those with student debt are substantially more likely to apply for SSDI or SSI starting in 2014.
Depending on the sample, this effect persists, or even increases, through 2015, but, with the
exception of a single OLS model, is no longer statistically significant by 2016.
We note that the confidence interval for the estimates for 2016 contain not just a null
effect of one, but also the estimated odds ratios for 2014 and 2015. But these estimates are
consistent with the theory that this policy change resulted in an influx of new applicants due to
“pent-up” demand for student loan debt relief, with a corresponding decline in applications after
this stock of applicants apply, akin to the difference between immediate and long-run differences
in divorce rates after divorce policy changes (Wolfers 2006). However, given that we define our
treatment group based on 2013 student loan indebtedness, these noisier estimates may also be
indicative of attenuation bias, which we cannot directly address in this analysis.
Up to this point, we have focused on either any disability program application, or SSDI
(and SSDI/SSI-concurrent) application among those covered by SSDI. Table 5 expands this
analysis to examine impacts on application to these programs separately, as well as the impact on
award rates, and composition of awards.
Columns 1 and 2 show that the 46% odds ratio estimate from column 4 of Table 2, and
the 36% odds ratio estimate from column 4 of Table 3 are being driven by SSDI-only
applications. That is, there is no evidence of an increase in SSDI/SSI-concurrent application,
whereas the estimated increase for SSDI-only is a 60% odds ratio.
Although we find strong application impacts, the implications for SSDI and for
individuals differ dramatically if these applications are overwhelmingly accepted or
overwhelmingly denied. If the latter, these individuals were induced to apply and went through
the lengthy application process with no success, and in the process increasing the workload of
the DDSs. If the former, these are indeed individuals who qualify for SSDI. We find that the
former story tends to dominate: the increase in SSDI awards (106% odds ratio increase) exceeds
that of the application effect (60%), increasing the targeting efficiency of the program
(Deshpande and Li 2019). That is, it appears that these conditional applicants – those with
student debt seeking a TPDD through the new SSDI/SSI discharge route – are disproportionately
likely to be awarded disability benefits. In other words, the increase in the potential value of
disability program participation – discharge of federal student loans – increased the targeting
efficiency of disability programs.
But were these induced applicants likely to qualify for TPDD? Column 7 and 8 look at
whether these awards resulted in a permanent disability classification (satisfying the “medical
improvement not expected” categorization), which is the requirement for TPDD, or a non-
permanent classification, which would carry with it SSDI or SSI benefits, but not convey
automatic TPDD eligibility to the awardee through the SSA pathway. Although there is a
positive point estimate on the impact on permanent disability awards, this estimate is not
statistically significant; the non-permanent disability classification appears to be driving the
estimated treatment effect of an increase in awards. That is, the policy inducement to apply for
SSDI/SSI – discharge of federal student loans for those accepted onto these programs and
determined to be permanently disabled – induced more application to SSDI, led to improved
SSDI targeting, but did not result in statistically significantly increased permanent disability
determinations. However, these applicants and awarded SSDI/SSI beneficiaries, now aware ofTPDD, may seek out the physician route to discharge their federal student loans. Unfortunately,
the data used in these analyses cannot identify the extent to which these SSDI/SSI applicants go
on to have their debt discharged through this alternative route.
Table 6 explores further heterogeneity in awards and applications; namely, whether the
treatment effect varies by body system of the primary diagnosis code of awardees, and whether
the application effect varies by recent work. We separate out body system of awards into three
categories: musculoskeletal, mental disorder, and other body system. Although we estimate
positive coefficients for all three conditions, the estimate for mental disorders is not statistically
significant; the musculoskeletal estimate is positive, with an estimated 56% increase in the odds
of application; however, the effect is even higher for other body systems, estimated at a 72%
increase in the odds of application. It is difficult to disentangle differences in application
increases from screening, since musculoskeletal and mental conditions have been described as
less easily verifiable (Duggan and Imberman 2009), and hence these increases in awards may be
the result of a screening out of these less verifiable conditions. However, these estimates imply
the presence of conditional applicants among “more verifiable” conditions.
Column 4 presents results from a specification including both the treatment variable and
an interaction term with whether the individual had any positive earnings in the previous year (as
well as an unshown variable with whether the un-interacted variable of any earnings in the
previous year). The treatment estimate rises considerably, although the estimate on the
interaction term among those with earnings in the prior year nearly completely offsets this effect.
That is, the overall treatment effect appears to be driven by those who are already not earning at
all.8 Consistent with the finding that these conditional applicants were more likely to be awarded
benefits than the average applicant, Table 6 indicates that these conditional applicants do not
appear to be coming from those currently working or those with “less verifiable” conditions.
Finally, in our individual-level analysis, Table 7 shows heterogeneous treatment
estimates by age group, across the overall sample and the SSDI-covered sample, and across logit
and OLS models. Our general finding is that the results are consistently statistically significant
for the 50-59 population; this finding is consistent with the “aching to retire” narrative of
Duggan et al. 2007, in which small to moderate changes in Social Security retirement benefits
can induce application among older Americans. The estimates for the 60-65 population are
generally larger, although with this smaller population, many of these higher point estimates are
not statistically significant. However, multiple specifications also find an effect among the 30-39
population, suggesting that student debt discharge, and seeking relief thereof, is a potentially
strong motivation for those earlier in their working-age life, resulting in application to these
long-term disability programs, from which return-to-work is rare.
Robustness and falsification tests
The Table 4 estimates showed that our estimated effect did not pre-date the policy change,
indicating that our analysis passes this “lead” placebo test. Table 8 provides another approach to
a placebo test: if we conduct our analysis not with student debt interacted with a post-July 2013
policy change, but with another type of debt holding, do we still see an effect? Since there were
not corresponding SSDI/SSI policy changes for these other kinds of debt in this time period, we
should see no significant effect. One issue that arises though is that there is correlation between
8
See Appendix Table PC for estimates by application/award type for the subsample with no
earnings in the prior year.holding different types of debt. In this table, we show results from both standalone estimates, and
while including these other debt types.
We find that whenever student debt is included, we estimate the same, statistically
indistinguishable coefficient. When we include credit card debt post-2013 as our treatment on its
own, we find a statistically significant estimate, but this estimate becomes insignificant when we
include our student debt treatment variable. Including “All Other” debt is never statistically
significant, indicating that our estimated effect is due to the TPDD policy change, and not other
debt-related trends in SSDI/SSI application.
In an ideal world, we would be able to demonstrate a corresponding increase in TPD
discharges coming from the SSDI/SSI qualification route. However, the ED can only identify
TPD discharge participants for 2014-present; furthermore, our analyses indicate that most of
these induced SSDI/SSI applicants were not designated as “medical improvement not expected,”
the designation required for TPDD discharge, and thus would have to seek the physician TPDD
route. What we can learn from the limited data available, shown in Table 9, is that when the ED
started sending letters to existing SSDI/SSI recipients who held federal student loans and a
“medical improvement not expected” designation notifying them about the program and their
eligibility in 2016, there was a large increase in TPD discharge approvals. Thus, the SSDI/SSI-
receiving population does seem to be sensitive along information and cost-reduction margins.
Conceptual framework
These empirical results present a potential puzzle. To understand the factors driving them, let us
consider the marginal applicant—the disabled individual who would not apply for SSDI/SSI
without this TPDD pathway, but who would once he or she could potentially receive both
benefits. Although there are potentially many current SSDI/SSI beneficiaries who were induced
to apply for TPDD after the expansion, especially after the later information outreach program
conducted by ED, our empirical approach focuses on induced to newly apply for SSDI/SSI.
While there is limited data available on TPDD utilization, specifically on the fraction of
applicants that are successful for each TPDD type, the median amount of discharged debt among
successful TPD applicants in FY2015 was $17,500 and the average was about $25,000 (GAO
2016). However, the automatic notification of SSI/SSDI recipients with federal student loan debt
took place in the spring of that fiscal year, so this number may differ greatly in our study period.
Finally, while we abstract from timing concerns for the purposes of this model, note that using
the physician or SSA pathway to apply for TPDD requires first that the prospective applicant
obtain a certification of disability, either from a physician, or from the “medical improvement
not expected” SSDI/SSI designation, which requires a physician visit for the application process.
The prospective applicant can then complete the TPDD application paperwork.
The goal of this model is to attempt to rationalize the observed behavior: a lack of both
TPDD and SSDI/SSI prior to the 2013 TPDD expansion, followed by increased disability
program application by those with student debt after this expansion.
We begin with a single-period utility maximization framework, where utility is a function
of resources, plus any program awards, minus the costs of application. In the pre-policy change
period, disabled individuals can choose to apply for SSI or SSDI, TPDD (with physician
certification of disability), both, or neither. Let W refer to an individual’s resources, DI be the
value of SSDI or SSI benefits if awarded, and TPDD the value of discharged debt if TPDD is
successful. Denote the non-physician costs associated with SSDI/SSI application as cDI, denotethe non-physician costs associated with TPDD application as cTPDD, and the cost of visiting a
physician to certify disability, for either SSDI/SSI or TPDD, as cPhys.
However, SSDI/SSI award or TPDD discharge are not certain, and if pursued separately,
these probabilities are given by:
"G
EF : Expected probability of acceptance onto DI
"L
HIJK : Expected probability of TPDD via physician certification
Since the marginal applicant under study – one who applies for SSDI/SSI only after the TPDD
expansion – did not apply for SSDI/SSI before the expansion, we can infer that:
EF MNO + =P − %EF − %HIJK R + (1 − "G
"G EF )MNO − %EF − %HIJK R < M(O) (2)
Or the expected utility from applying for SSDI/SSI, incurring any associated costs with
application, is below utility from not applying. We can also infer that the expected utility from
TPDD application via physician certification was below their utility from not applying, since it
was the TPDD expansion that induced SSDI/SSI application:
"L
TIJK MNO + UV== − %WHEE − %HIJK R + N1 − "L
TIJK RMNO − %WHEE − %HIJK R < M(O) (3)
Finally, before the TPDD expansion, our marginal applicants chose not to apply for both
SSDI/SSI and TPDD physician certification, to which we assign three probabilities based on
potential outcomes:
"EF,
L HIJK : Probability of acceptance onto DI and TPDD via physician certification
"EF,L !HIJK : Probability of acceptance onto DI, without TPDD via physician certification
"!EF,
L HIJK : Probability of DI denial and TPDD via physician certification
We assign separate probabilities to allow for potential correlation between SSDI/SSI and TPDD
outcomes, instead of assuming independence. We assume that an individual can use a single
physician visit to satisfy both SSDI/SSI and TPDD application, but since the marginal applicant
did not apply for both, we can infer that:
"EF,
L HIJK MNO + UV== + =P − %WHEE − %HIJK − %EF R
+ "EF,
L !HIJK MNO + =P − %WHEE − %HIJK − %EF R + "!EF,
L HIJK MNO + UV== − %WHEE − %HIJK − %EF R
+ N1 − "EF,
L HIJK − "EF,
L !HIJK − "!EF,
L HIJK RMNO − %WHEE − %HIJK − %EF R < M(O ) (4 )
However, after the TPDD expansion, we observe an increase in SSDI/SSI applications among
those with student debt, implying that the marginal applicant had expected utility from pursuing
the SSDI/SSI route to TPDD higher than the outside of option of no application. We assume the
following probabilities associated with application:
"EF,L[F\] : Probability of acceptance onto DI, with Medical Improvement Not Expected"EF,L
![F\] : Probability of acceptance onto DI, without Medical Improvement Not
Expected
We have just two independent probabilities, instead of three in the pre-expansion period, since an
individual cannot satisfy the medical improvement not expected requirement if they are not
awarded benefits. The choice to apply after the TPDD expansion therefore implies:
"EF,L
[F\] MNO + UV== + =P − %WHEE − %HIJK − %EF R
+"EF,L
![F\] MNO + =P − %WHEE − %HIJK − %EF R
+N1 − "EF,L ![F\] RMNO − %WHEE − %HIJK − %EF R ≥ M(O )
[F\] − "EF,L (5)
Note here that because marginal applicants revealed themselves to not pursue TPDD via the
physician certification route in the pre-period, under constant or decreasing absolute risk
aversion, they will not apply for physician certification in the event of a lack of success pursing
the SSDI/SSI route.
We can combine this inequality with the previous one to arrive at:
"EF,L[F\] MNO + UV== + =P − %WHEE − %HIJK − %EF R
+ "EF,L ![F\] MNO + =P − %WHEE − %HIJK − %EF R
+ N1 − "EF,L [F\] − "EF,L![F\] RMNO − %WHEE − %HIJK − %EF R
> "EF,
L HIJK MNO + UV== + =P − %WHEE − %HIJK − %EF R
+ "EF,L !HIJK MNO + =P − %WHEE − %HIJK − %EF R
+ "!EF,
L HIJK MNO + UV== − %WHEE − %HIJK − %EF R +
N1 − "EF,
L HIJK − "EF,L !HIJK − "!EF,
L HIJK RMNO − %WHEE − %HIJK − %EF R (6)
Before rearranging and simplifying, note that there were no SSDI/SSI policy changes in this
period, and thus:
"EF,L
[F\] + "EF,L
![F\] = "EF,
L HIJK + "EF,
L !HIJK (7)
That is, the likelihood of any type of DI award is the same, regardless of medical improvement
determination or the outcome of the physician certification. The above inequality therefore
simplifies to:
N"EF,L L
[F\] − "EF, HIJK RMNO + UV== + =P − %WHEE − %HIJK − %EF R
+N"EF,L
![F\] − "EF,
L !HIJK RMNO + =P − %WHEE − %HIJK − %EF R >
"!EF,
L HIJK bMNO + UV== − %WHEE − %HIJK − %EF R − MNO − %WHEE − %HIJK − %EF Rc (8)
The values of each term therefore imply:N"EF,L [F\] − "EF,
L HIJK RMNO + UV== + =P − %WHEE − %HIJK − %EF R +
e
("EF, ![F\] − "EF,
L !HIJK )MNO + UV== + =P − %WHEE − %HIJK − %EF R
> N"EF,L[F\] − "EF,L HIJK RMNO + UV== + =P − %WHEE − %HIJK − %EF R +
e
("EF, L
![F\] − "EF, !HIJK )MNO + =P − %WHEE − %HIJK − %EF R
> "!EF,
L HIJK (MNO + UV== − %WHEE − %HIJK − %EF R
−MNO − %WHEE − %HIJK − %EF R) ≥ 0 (9)
Simplifying, we have:
N"EF,L
[F\] + "EF,L
![F\] − "EF,
L HIJK − "EF,
L !HIJK RMNO + UV== + =P − %WHEE − %HIJK − %EF R >
L
"!EF, HIJK bMNO + UV== − %WHEE − %HIJK − %EF R − MNO − %WHEE − %HIJK − %EF Rc ≥ 0 (10)
Recalling equation (7), the first multiplicative component becomes 0, yielding a contradiction:
0 > "!EF,
L HIJK bMNO + UV== − %WHEE − %HIJK − %EF R − MNO − %WHEE − %HIJK − %EF Rc ≥ 0
The observed lack of SSDI/SSI or TPDD in the pre-expansion period, and the increased
SSDI/SSI application after the TPDD expansion, cannot be explained by this rational model.
What would be able to explain this pattern of behavior? One explanation would be a lack
of awareness of the TPDD physician certification route; if there were a substantial information
cost, or a zero expected probability of TPDD through this route, which changed after the TPDD
expansion and increased awareness of TPDD, then we could no longer assume that individuals
had rationally opted not to apply for TPDD in the pre-expansion period, either alone or in
combination with SSDI/SSI application. Instead, we would only be able to infer that they had
preferred to apply for SSDI/SSI based on the expected benefits from those programs alone.
Indeed, one implication of this explanation would be TPDD physician certification applications
among post-expansion induced SSDI/SSI applicants who were not assigned “medical
improvement not expected” designations. Unfortunately, a lack of access to longitudinal TPDD
data precludes conducting such an analysis, and TPDD program participation data currently
available only cover the post-expansion period. However, future work examining more recent
policy changes such as the automatic notification of student loan-holding SSDI/SSI recipients
could determine the plausibility of the information margin story.
Another potential explanation is that the cost of physician certification (%HIJK ) may not be
symmetric between the two processes of SSDI/SSI certification and TPDD certification. Most
major metropolitan areas have at least one SSA office nearby, and the offices may serve as an
important resource in explaining the steps necessary to obtain physician certification and walking
the potential applicant through the paperwork, reducing implicit costs. Future work employing
individual-level data with information on distance from SSA offices could shed light on the
plausibility of this mechanism: if debt-holding individuals located near an SSA office were more
likely to be induced to apply for SSDI/SSI than debt-holding individuals located away from SSA
offices, then implicit costs may be a compelling explanation.You can also read