Foreclosures Dampen the Economic Recovery - June 2011 - SUNTRUST
←
→
Page content transcription
If your browser does not render page correctly, please read the page content below
Foreclosures Dampen
               the Economic Recovery
               June 2011

               The Thomas Jefferson
               Institute for Public Policy

               Virginia Economic Forecast
               2011-2012

sponsored by

SUNTRUST                                     1
The Thomas Jefferson Institute for Public Policy is a non-
The Thomas Jefferson Institute partisan research and education organization devoted to im-
for Public Policy proving the lives of the people in Virginia. The Institute was
organized in 1996, and was the only state and local govern-
ment focused public policy foundation in Virginia based on
a philosophy of limited government, free enterprise and in-
dividual responsibility. It is a “solutions tank” seeking better
ways to accomplish the policies and programs currently being
undertaken by state and local government – always based
on the Institute’s underlying philosophy. The first study was
published in February 1997.
The work of the Thomas Jefferson Institute for Public Policy
is geared toward educating our political, business and com-
munity leadership about the issues facing our society here
in Virginia. The Institute offers creative solutions to these
problems in a non-partisan manner.
The Thomas Jefferson Institute is a fully approved foundation
by the Internal Revenue Service. It is designated a 501(c)(3)
organization and contributions are tax-deductible under the
law. Individuals, corporations, associations and foundations
are invited to contribute to the Thomas Jefferson Institute and
participate in our programs.
For more information on the programs and publications of
the Thomas Jefferson Institute, please contact:
Thomas Jefferson Institute for Public Policy
9035 Golden Sunset Lane
Springfield, Virginia 22153
703/440-9447
email: info@thomasjeffersoninst.org
website: www.thomasjeffersoninst.org
Cover Photo: John G. Hendron
This annual Virginia Economic Forecast 2011-2012 is published by the Thomas
Jefferson Institute for Public Policy. This study does not necessarily reflect the
views of the Thomas Jefferson Institute or its Board of Directors. Nothing in this
study should be construed as an attempt to hinder or aid any legislation.Table of Contents Foreword...................................................................................... 4 Executive Summary..................................................................... 5 National Economy....................................................................... 7 Foreclosures Dampen the Economic Recovery......................... 10 Virginia Economy...................................................................... 16 About Chmura Economics & Analytics.................................... 22 Jefferson Institute Board of Directors....................................... 23
Foreword

    The Thomas Jefferson Institute for Public Policy is proud to present its twelfth annual report on the econ-
    omy of the United States and Virginia. It is part of the foundation’s efforts to offer well-researched studies
    for our state leaders to assist them in better preparing for the future.

    This year’s annual Virginia Economic Forecast was again researched and written by Dr. Christine Chmu-
    ra and her team at Chmura Economics & Analytics (Chmura) headquartered in Richmond. Dr. Chmura
    founded Chmura Economics & Analytics in 1999 after serving as Chief Economist at Crestar Bank (pur-
    chased by SunTrust) for seven years. Chmura has since grown into a leading member of its industry,
    specializing in quantitative research, traditional economics, workforce and economic development, and
    software design.

    “Virginia Economic Forecast: 2011–2012” is made available to our state’s elected leaders, business lead-
    ers, and the media in order to assist them in better understanding the economic reality facing our state.
    This year’s edition, titled “Foreclosures Dampen the Economic Recovery,” features an analysis of the fore-
    closure crisis in the nation and in Virginia, and how its lingering effects will play out during the recovery
    from the recession. The economic forecast also describes the improving economy in 2010 and expectations
    about the continuing recovery.

    Last year’s Virginia Economic Forecast anticipated the beginning of the recovery. In 2010, real gross do-
    mestic product expanded 2.8%, similar to Chmura’s forecast of 2.9%. Consumer spending was slower than
    anticipated, growing 1.7% in 2010 compared to a projection of 2.3%. Residential investment also fared
    more poorly than thought, contracting 3.0% in the year compared to Chmura’s forecast of a 1.0% decline.
    In Virginia, the housing market also fared worse than expected, with building permits improving just
    1.6% in 2010, falling short of an expected stronger rebound of 10.7%. Employment in the Commonwealth
    slipped 0.2% further in 2010 rather than posting a modest 0.4% advance per projections.

    We once again thank SunTrust for sponsoring this year’s “Virginia Economic Forecast: 2011–2012.” Noth-
    ing in this report should be construed as supporting or opposing any legislation. The opinions are those of
    the authors and not necessarily those of the Thomas Jefferson Institute, its Board of Directors, or SunTrust
    as the sponsor of this report.

    Michael W. Thompson
    Chairman and President
    Thomas Jefferson Institute for Public Policy
    June 2011

4
Executive Summary
The Nation
By mid-2009, the recession officially ended and the U.S. economy returned to growth.
The labor market and financial markets have been improving since the first half of 2009. The
U.S. economy has experienced seven consecutive quarters of real gross domestic product
(GDP) growth, 1.8 million jobs have been added since February 2010, and the unemploy-
ment rate is trending downward.
The recovery is moderate because of the headwinds that remain: continued falling housing
prices, additional foreclosures, stubbornly high unemployment, and soaring energy prices.
From December 2007 to February 2010, 8.7 million jobs were lost in the nation. If employ-
ment expands by 127,000 jobs a month—the average pace from February 2010 through April
2011—it will take about four and a half years to reach pre-recession employment levels.
Chmura Economics & Analytics (Chmura) forecasts real GDP to grow 2.7% in 2011 and
3.1% in 2012. Employment is expected to expand 1.0% in 2011, followed by 1.2% growth
in 2012. Consumer spending is expected to continue its rebound and grow 2.9% in 2011 and
2.5% in 2012. Residential real estate and investment in commercial structures are forecast
to continue to contract in 2011 and begin to rebound in 2012. Despite an uptick in headline
inflation, inflation remains under control and interest rates are forecast to remain fairly low.
Foreclosures
In 2007, only 0.9% of all mortgages in the country were in foreclosure, but that rate
jumped to 1.6% in 2008 and 2.6% in 2009. The foreclosure rates appear to have leveled
off in 2010, but at elevated levels. Based on data for the first eleven months of 2010, about
3.2% of all mortgages in the nation were in foreclosure in 2010.
5In March 2011, one in every 742 housing units in Virginia filed for foreclosure compared
to the national average of one in every 542. Regions where homes are least affordable are
those that experienced heightened foreclosure activity. Eighty-seven percent of March 2011
foreclosures in Virginia were filed in the Northern Virginia, Richmond, and Hampton Roads
metropolitan areas.
Until the excess foreclosed properties are digested by the market, housing activity will
be less likely to rebound. The increased supply of homes on the market and lack of demand
continues to depress home prices, thus preventing a speedy recovery of the housing market.
In addition to directly affecting residential investment in GDP, foreclosures also indirectly
slow down consumer spending due to the impact on consumer wealth.
Virginia
In Virginia, employment expanded 1.1% (+39,257 jobs) over the year ending March
2011 compared to 1.0% growth in the nation. Since May 2010, the year-over-year pace of
job growth in Virginia has not exceeded the pace in the nation by more than 0.6 percentage
points. This contrasts with the period from October 2008 through November 2009 when
both the state and nation were contracting jobs but the pace of job loss in the nation was
over a percentage point faster than in Virginia.
Over the year ending March 2011, most of the job gains in Virginia were due to three
sectors: professional and business services (+16,101 jobs), education and health services
(+10,451), and retail (+11,960). Manufacturing added 947 jobs in the state over this period,
equivalent to a 0.4% employment gain—a rare expansion in this industry that has posted
only seven months of year-over-year job growth since October 1998.
The housing market in Virginia has continued to struggle. The Virginia Association of
Realtors reported that 82,809 homes were sold in the state in 2010, a 9.8% decrease from
2009. The median sales price in 2010 was $236,900, up 3.3% from the prior year. The
weakness in the housing market is underscored by residential building permit activity. After
double-digit percentage declines for four straight years, single-family building permits in
Virginia posted a mere 1.6% annual average expansion in 2010. The projection for 2011 is
modest growth of 1.8%.
6quarter of 2009. In addition, initial unemployment claims
started to decline in April 2009 and dipped below the im-
portant 400,000 mark—the threshold usually associated
National Economy
with steady job growth—from mid-February to mid-April.
A subsequent upswing in initial claims above 400,000,
however, is a reminder that the recovery remains uneven.
Headwinds Remain
In the aftermath of the longest and deepest downturn since
Although the recession officially ended in June 2009 ac- the Great Depression, the U.S. economy has experienced a
cording to the National Bureau of Economic Research, the somewhat weak and uneven recovery because of the head-
official arbiter of recessions, the economic recovery has winds that remain. In particular, falling housing prices, ad-
been slow and uneven. Real gross domestic product (GDP) ditional foreclosures, continued high unemployment, and
increased at an annualized 2.6% pace in the third quarter of soaring energy prices are putting downward pressure on
2010, followed by annualized gains of 3.1% in the fourth economic growth.
quarter and a lackluster 1.8% in the first quarter of 2011
(based on the “second estimate”). Despite the slowdown in Historically, housing leads the country out of recessions;
GDP growth in the first quarter of 2011, recent data indicate the current housing market, however, has yet to sustain
that economic momentum is building and the weakness is positive contributions to GDP growth in this recovery.
likely transitory. Signs that the recovery is beginning to Weakness in the housing market— particularly the con-
gain traction include improving labor market conditions, traction in home prices that is partly due to the glut of fore-
retail sales growth, and advancing industrial production. closed homes—has been restraining consumer spending.
The sharp decline in housing prices has reduced consumers’
Real Gross Domestic Product net worth; some consumers have reacted to this drop by
Quarterly Annualized Percent Change deferring nonessential spending.
10%
8% High unemployment is another headwind that has been
6% damping economic growth because of the associated re-
4% duction in wages and spending. The severity of the reces-
2% sion that ended in June 2009, and the prospect of slow
0% employment gains, will likely hamper growth for a few
-2% years. From December 2007 to February 2010, 8.7 million
-4%
people lost their jobs in the nation. Since then, 1.8 million
-6%
jobs have been added, leaving a net loss of roughly 7.0
-8%
million jobs based on nonfarm payroll employment. If em-
1994 1996 1998 2000 2002 2004 2006 2008 2010
ployment continues to expand at a moderate 127,000 jobs
Source: Bureau of Economic Analysis
per month—the average pace from February 2010 through
April 2011—it will take about four and a half years to reach
Nearly two years into the recovery, the U.S. economy is be- pre-recession employment levels.1 Sustaining the more
ginning to show signs that the recovery is gaining strength. recent pace of 233,000 jobs per month—the average pace
As of April 2011, employment had increased for seven from February 2011 to April 2011—would be needed to
consecutive months. In February 2011, nonfarm payroll
employment grew by 235,000, followed by increases of 1 Note that reaching pre-recession employment levels does not take into
account growth needed in the labor market due to new job-seekers.
221,000 in March and 244,000 in April. The Dow Jones
Industrial Average has rebounded strongly since the first
7Employment expectations, are likely to warrant exceptionally low levels
Nonfarm Payroll in Thousands for the federal funds rate for an extended period.
142,000
The FOMC also noted in its April press release that it will
138,000
continue its $600 billion asset-purchase program and adjust
134,000 its holdings as needed to best foster maximum employment
and price stability. This second round of quantitative easing
130,000 was designed to stimulate the economy in an environment
where the Federal Reserve Board could no longer lower
126,000
the target interest rate.
122,000
Apr-98 Apr-00 Apr-02 Apr-04 Apr-06 Apr-08 Apr-10 To promote a stronger pace of economic recovery and to
Source: Bureau of Labor Statistics help ensure that inflation, over time, is at levels consistent
with its mandate, the Committee decided today to contin-
reach pre-recession employment levels in roughly two and
ue expanding its holdings of securities as announced in
a half years. The unemployment rate stood at an elevated
November. In particular, the Committee is maintaining its
9.0% as of April 2011. Chmura forecasts the national un-
existing policy of reinvesting principal payments from its
employment rate will average 8.7% in 2011, 8.1% in 2012,
securities holdings and will complete purchases of $600
and 7.5% in 2013.
billion of longer-term Treasury securities by the end of the
current quarter. The Committee will regularly review the
Soaring energy prices are a third headwind affecting eco-
size and composition of its securities holdings in light of
nomic growth. Rising gas prices caused in large part by
incoming information and is prepared to adjust those hold-
unrest in the Middle East and North Africa are eroding
ings as needed to best foster maximum employment and
consumer confidence and raising inflation expectations.
price stability.
The consumer price index for gasoline rose 3.3% in April
2011 after increasing 5.6% in March—jumping 33.1% in
Due to the recent run-up in commodity prices, especially
all since April 2010. The latest retail sales data for April
energy prices, inflation has become a top economic con-
suggest that the negative effects of rising energy and food
cern for Americans. Chairman Bernanke has indicated that
prices on discretionary spending are becoming apparent
he believes this increase in inflation will be transitory. He
as household budgets are stretched by rising costs. Con-
recently said:
sequently, consumers are struggling to contribute to eco-
nomic growth as their purchasing power erodes.
... the most likely outcome is that the recent rise in commod-
Monetary Policy ity prices will lead to, at most, a temporary and relatively
modest increase in U.S. consumer price inflation--an out-
The federal funds rate has been virtually 0% since Decem-
look consistent with the projections of both FOMC par-
ber 2008. Moreover, as of April 2011, the Federal Open
ticipants and most private forecasters. That said, sustained
Market Committee (FOMC) press release continued to
rises in the prices of oil or other commodities would repre-
indicate this policy will continue:
sent a threat both to economic growth and to overall price
stability, particularly if they were to cause inflation expec-
The Committee will maintain the target range for the feder-
tations to become less well anchored. We will continue to
al funds rate at 0 to 1/4 percent and continues to anticipate
monitor these developments closely and are prepared to
that economic conditions, including low rates of resource
respond as necessary to best support the ongoing recovery
utilization, subdued inflation trends, and stable inflation
in a context of price stability.2
2 Federal Reserve Chairman Ben S. Bernanke, “Semiannual Monetary
8 Policy Report to the Congress,” before the Committee on Banking, Housing,
and Urban Affairs, U.S. Senate, Washington, D.C., March 1, 2011.Forecast buyer tax credit. It recovered in the fourth quarter of 2010,
expanding 3.3%. Residential investment fell off again in
Chmura Economics & Analytics (Chmura) forecasts real the first quarter of 2011, but is expected to resume modest
GDP to grow 2.7% in 2011 and 3.1% in 2012. Employment growth in the second quarter; nevertheless, an overall 1.8%
is expected to expand a moderate 1.0% in 2011, followed decline is projected for 2011. The contraction in employ-
by 1.2% growth in 2012—an average pace of growth from ment from the recession and its slow rebound also reduce
2010 through 2012 equivalent to about 117,000 additional the need for additional commercial real estate. Investment
jobs per month. in commercial structures fell 13.7% in 2010 and is forecast
to contract 2.3% in 2011 before growing again in 2012.
Consumers, whose spending accounts for about two-thirds
of GDP, pulled back 1.2% on spending in 2009. Consumer With inflation remaining under control, interest rates are
spending modestly rebounded in 2010, rising 1.7% with forecast to remain fairly low. The consumer price index
an impressive 4.0% annualized gain in the fourth quarter. rose 1.6% in 2010 and is forecast to rise 2.8% in 2011.
Spending rose an annualized 2.2% in the first quarter of The Fed is expected to hold the federal funds rate target
2011 and is forecast to rise 2.9% through 2011 and 2.5% at essentially zero through the third quarter of 2011 until
in 2012. stronger economic growth becomes apparent. The federal
funds rate is forecast to rise to an average 1.5% in 2012.
Residential real estate and nonresidential structures con- Longer-term yields are expected to continue to edge up
tinue to struggle. Residential investment contracted 3.0% with the 10-year Treasury yield averaging 3.5% in 2011
in 2010 with a 27.3% annualized plunge in the third quarter and 4.0% in 2012.
of 2010 following the expiration of the first-time home-
Chmura Economic Forecast
Actual Forecast
2009 2010 2011 2012 2013
Percent Change
Real Gross Domestic Product -2.6 2.8 2.7 3.1 3.2
Consumption Expenditures -1.2 1.7 2.9 2.5 2.5
Gross Private Domestic Investment -22.7 17.0 5.5 8.6 7.8
Residential Investment -22.8 -3.0 -1.8 4.4 6.9
Nonresidential Investment -17.1 5.7 9.6 11.1 8.4
Producer’s Durable Equipment -15.3 15.3 12.6 12.5 9.3
Structures -20.5 -13.7 -2.3 4.0 4.6
Government Expenditures 1.6 1.0 -0.6 1.6 2.2
Trade Deficit (2005 Dollars; Billions)
Net Exports, Goods & Services -362.4 -422.1 -413.7 -441.7 -467.6
Percent Change
Consumer Price Index -0.3 1.6 2.8 2.0 1.4
Yields (%)
Federal Funds Rate 0.2 0.2 0.2 1.5 3.3
Prime Rate 3.3 3.3 3.3 4.5 6.3
10-Year Treasury 3.3 3.2 3.5 4.0 4.5
30-Year Conventional Mortgage 5.0 4.7 5.0 5.6 6.2
Source: Chmura Economics & Analytics
Note:Yields reported for the average of the quarter.
9more investors and speculators into the market which fur-
ther fed the real estate bubble. Reduced home affordability,
Foreclosures Dampen the however, was one result of the housing bubble (see chart).
Economic Recovery
When the housing bubble finally burst, it ushered in a fore-
closure crisis and an economic recession whose effects still
reverberate today. Even as the economic recovery began
accelerating this year, the foreclosure crisis lingers and
could derail the economic recovery. For that reason, this
The most recent recession was in many ways the most se- section of the Virginia Economic Forecast assesses the
vere economic downturn since the Great Depression. Even severity of the current foreclosure situation and its impact
though the recession officially ended in June 2009, effects on the state and national economies.
from the recession persist. The unemployment rate peaked
at 10.1% in October 2009—after the official end of the Foreclosure Process
recession—and the unemployment rate was still high in
Foreclosure is the legal process through which a mortgage
April 2011 at 9.0%. In Virginia, the state unemployment
lender attempts to recover the money owed on a defaulted
rate more than doubled from 3.3% in December 2007 to
loan by selling or taking ownership of the property from the
7.2% in December 2009, and remained above 6.0% as of
borrower. Typically, the foreclosure process begins when a
the latest data in March 2011.
borrower defaults on the loan payment and the lender files
a public default notice. A foreclosure process can result
The recession was triggered by a bursting real estate bubble.
in four outcomes: (1) the borrower reinstates the loan by
During the first half of the 2000s decade, low interest rates,
paying off the default amount during a grace period; (2)
innovation in financial products such as interest-only mort-
the borrower sells the property to a third party during a
gages, and the development of the mortgage securitization
grace period and uses the proceeds to pay off the loan; (3)
market (mortgage-backed securities) created an environ-
the property is purchased by a third party during a public
ment where many subprime customers qualified for home
auction at the end of grace period; or (4) the lender takes
mortgages. The lending environment increased demand
ownership of the property—with the property becoming
and pushed up home prices. High home prices also enticed
bank-owned or real estate owned (REO) property—usually
Home Affordability with the intent to resell it later on the open market.
Percent of Households That Can
Afford a Median-Priced Home Past-due mortgage payments are a harbinger of a foreclo-
60% sure filing.3 Historical delinquency rates for residential real
55% estate loans4 show that from 2000 to 2007, only about 2%
50% of outstanding loans were delinquent more than 30 days.
45%
The delinquency rate began to increase sharply in the sec-
Nation ond half of 2007 and peaked at 11.3% in the second quarter
40%
of 2010. Despite a subsequent decline to 9.9% in the fourth
35%
Virginia
quarter of 2010, current delinquency rates remain much
30%
higher than historical levels, implying that the number of
25% foreclosures will also remain elevated.
2000 2002 2004 2006 2008 2010
Source: Chmura Economics & Analytics
3 The actual month of being delinquent before a foreclosure notice is filed
depends on the mortgage contract. It is typically around two to three months.
4 Residential real estate loans include all loans secured for one- to four-
family properties, such as mortgages, home equity loans, and home equity
10 lines of credit.Delinquency Rate: Foreclosed Mortgages per
Residential Real Estate Loans Thousand Households
(30+ Days, Seasonally Adjusted Annual Rate) (November 2010)
12% 30
10% Florida 28.4 25
8% Nevada 21.2 20
6% Virginia 4.0 15
4% National Average 8.5 10
2% 5
0% 0
2000Q1 2002Q1 2004Q1 2006Q1 2008Q1 2010Q1
Source: Federal Reserve Bank of New York North Dakota 1.1
Source: Federal Reserve
with 4.0 for Virginia. The states topping the list were Flor-
Foreclosures in the Nation and Virginia
ida, Nevada, New Jersey, Illinois, California, and Arizona;
Foreclosure rates skyrocketed after 2007 when only 0.9% all with double-digit foreclosures per 1,000 households.
of all mortgages in the country were in foreclosure. That Foreclosures have been highest in states that had the big-
rate jumped to 1.6% in 2008 and climbed further to 2.6% gest housing bubbles before the recession and/or the most
in 2009. The foreclosure rates appear to have leveled off depressed state economies. The ten states with the highest
in 2010, but at elevated levels. Based on data for the first foreclosure rates accounted for 61% of all foreclosures
eleven months of 2010, about 3.2% of all mortgages in the in the country in November 2010, with the top five states
nation were in foreclosure in 2010. accounting for half of all foreclosures. Florida alone had
23% of all foreclosures in the country in November 2010.
The severity of the foreclosure crisis varies greatly by state Consequently, the negative effects of foreclosures are more
and is highly concentrated in a handful of states. Virginia is pronounced in these states.
faring better than many other states. According to the latest
data of November 2010, an average of 8.5 mortgages per The fact that Virginia is doing better than the national av-
1,000 households were in foreclosure nationally compared erage does not mean Virginia has escaped the foreclosure
crisis unscathed. Regions where homes are least affordable
Percentage of Mortgages are those that experienced heightened foreclosure activity.
in Foreclosure
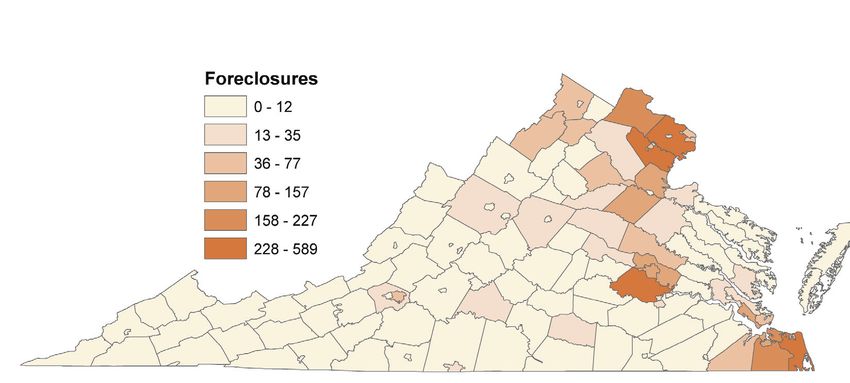
In March 2011, one in every 742 housing units in Virginia
4.0%
filed for foreclosure—better than national average of one in
3.5%
3.0%
542. As the map shows (next page), foreclosures in Virginia
2.5%
have been heavily concentrated in the Northern Virginia,
2.0% Richmond, and Hampton Roads metropolitan statistical
1.5% areas (MSA), with 87% of March filings occurring in these
1.0% localities. In Chesterfield County, one in 283 housing units
0.5% was filed for foreclosure, the highest rate in the state during
0.0% March 2011.
Apr
May
Jul
Feb
Sep
2007
2008
2009
Mar
Jun
Jan
Aug
Oct
Nov
Note: Annual data are presented for 2007-2009.
Source: CoreLogic
11New Foreclosure Filings, March 2011
Source: RealtyTrac
Housing Market in the Wake of the ties are short sales, sold at prices below the balance owed
Foreclosure Crisis for the mortgages.
Though the worst of the foreclosure crisis appears to be The share of distressed sales (either a short sale or an REO)
over, the elevated delinquency rate implies that foreclo- relative to total sales has increased dramatically since the
sures will remain high for some time. Both supply and de- onset of the foreclosure crisis. In 2007, only 6.4% of all
mand forces in the housing market indicate that it may take home sales in the nation were distressed sales. That per-
years to finally digest the millions of foreclosed homes. centage increased to 19.9% in 2008 and 27.7% in 2009.
The most recent data indicate that this percentage stabilized
On the supply side, millions of foreclosed homes have around 30% in 2010, but has shown no signs of falling.
entered the market, dramatically increasing the supply of
homes. The foreclosed properties are either sold at public Until the excess foreclosed properties are digested by the
auctions or become bank-owned properties (REOs) which market, housing activity will be less likely to rebound.
are sold at a later date. Either way, many of these proper- Based on the total number of foreclosed mortgages and
average distressed sales in November 2011, it will take
Percentage of Distressed 18 months to clear the foreclosed homes currently on the
Home Sales national market. In Virginia, 13 months are needed to clear
35% the current glut of foreclosed homes.5 However, these rates
30% do not consider the newly foreclosed homes that will con-
25% tinue to enter the market in the future.
20%
15%
While foreclosed properties have increased the supply of
10%
houses, demand is soft because of the continued high un-
employment rate as well as stricter lending policies. After
5%
the foreclosure crisis, banks tightened their lending prac-
0%
tices which resulted in a sharp reduction in home loan ap-
2007
2008
2009
Mar
Aug
Jan
Oct
Nov
Apr
May
Sep
Feb
Jun
Jul
plications and originations. In 2009, 4.2 million home loan
Note: Annual data are presented for 2007-2009.
applications were filed in the nation to purchase single-
Source: CoreLogic family homes, only 36% of applications filed at their peak
5 Source: U.S. Housing and Mortgage Trends, Prepared by CoreLogic
12 February 2011. http://www.corelogic.com/.Mortgage Finance Activities Home Price Changes
Millions
14
Virginia Metropolitan Areas
Applications From Peak to 2010Q4 From 2000Q1 to Peak
12
Loans
Winchester -31% 120%
10
Harrisonburg -9% 81%
8 Blacksburg -4% 62%
Bristol -1% 55%
6
Danville -6% 42%
4 Charlottesville -11% 107%
Lynchburg -4% 63%
2
Roanoke -5% 63%
0 Richmond -12% 84%
2000 2001 2002 2003 2004 2005 2006 2007 2008 2009 Hampton Roads -11% 120%
Northern Virginia -21% 142%
Note: Includes only single-family purchase applications and originations.
Source: Federal Reserve Board
Source: Federal Housing Finance Agency
in 2005.6 Similarly, loan originations for single-family In states that were hardest hit by the foreclosure crisis,
home purchases were 2.8 million in 2009, 38% of their price drops were even larger. Based on Chmura’s model-
2005 level. The home-buyer credit in the second half of ing, home prices for both the nation and Virginia could start
2009 provided a temporary boost for home demand. Oth- growing again as early as fall 2011.
erwise, the 2009 mortgage applications and originations
may have been even more depressed. Housing prices in Virginia have been falling since their
peak in mid-2007. Typically, regions that experienced
Housing Price Index larger price appreciation prior to the recession (such as
Percent Change, Year-Over-Year the Northern Virginia and Winchester metro areas) also
25%
experienced larger price declines. Metropolitan areas with
20% moderate price appreciation (such as Roanoke, Lynchburg,
Virginia
15% and Danville) experienced less price decline.
10%
Nation
Elevated delinquency rates, a large number of distressed
5%
properties, and falling home prices suggest that the fore-
0% closure crisis will continue in the foreseeable future. If the
-5%
number of new foreclosures per year matches the pace of
2010, it may take over six years for the foreclosure rate to
-10%
recede to pre-recession levels. If new foreclosures match
2000Q1 2002Q1 2004Q1 2006Q1 2008Q1 2010Q1
the 2009 pace, it could take three years for the foreclosure
Source: Federal Housing Finance Agency
rate to return to pre-recession levels. Thus, the foreclosure
crisis remains a potential threat for the ongoing economic
The increased supply of homes on the market and lack of recovery.
demand continues to depress home prices, thus prevent-
ing a speedy recovery of the housing market. Almost two
years after the recession ended, housing prices in the nation
and Virginia are still falling. By the end of 2010, home
prices dropped 11% nationally from their mid-2007 peak.
6 This number does not include loan applications for refinance or home
improvement. As a result, it is a good indicator for the market demand for
homes.
13Foreclosure and the Economic Recovery Housing Starts and
Building Permits
The prolonged foreclosure crisis continues to dampen the Nation Virginia
(MUAR) (Monthly)
economic recovery. Foreclosures have a direct impact on 2.5 4,500
GDP growth because it reduces the residential investment 4,000
component of GDP. Residential investment accounted for 2.0 3,500
about 2.5% of national GDP in 2010. A 10% increase in 3,000
1.5
residential investment can boost GDP growth by 0.3 per- 2,500
centage points. With home prices falling and a large num- 1.0
2,000
National Starts
ber of foreclosed homes on the market, however, home National Building Permits
1,500
builders are reluctant to build more homes. National home 0.5 Virginia Building Permits
1,000
starts have been mired around an extremely low level of 0.5 500
0.0 0
million units at an annual (MUAR) rate since 2009. Hous-
2000 2001 2002 2003 2004 2005 2006 2007 2008 2009 2010 2011
ing activities in Virginia have followed the same trend, as Source: U.S. Census
state building permits in 2010 were less than 40% of pre-
recession levels. Most economists forecast modest growth spending by $258 in 2011.9 Based on the current number
in housing starts and residential investment in 2011 and of households that own homes, the declining home prices
2012. Based on current housing market conditions, Chmura could lead to a reduction in consumer spending of $19.3
forecasts GDP growth of 2.7% in 2011 with residential billion in 2011 which would translate into a reduction of
investment contracting 1.8%. In contrast, if residential 0.1 percentage point off the GDP growth rate.
investment grew 10% in 2011, GDP growth for the year
would improve to 3.0%. Other than dampening GDP, the foreclosure crisis also af-
fects other sectors of the economy. The foreclosure crisis
In addition to directly affecting residential investment in contributes to the slow labor market recovery. A delayed
GDP, foreclosures also indirectly slow down consumer housing market recovery prevents the construction sector
spending because of the impact on consumer wealth. When from adding jobs. Foreclosures can also affect state and
home prices are increasing, households can refinance their local finances via declining property taxes due to lower
mortgages with cash-out options to increase their spending. home prices; which in turn can have ripple effects in other
Even the consumers who do not take cash from their home parts of society such as education and quality of life. Thus,
equity feel they are wealthier as property values appreciate. it is not surprising that many localities in Virginia are ex-
Studies have found that consumers spent about five to six periencing budget problems two years after the recession
cents of every dollar of increased housing wealth.7 Sup- ended. In a July 2010 survey of Virginia localities con-
pose housing prices decline by 3% in 2011 as in each of ducted by the Virginia Municipal League, more than half
the past three years. With a median home price of $156,100 of respondents said they had to cut education funding and
in 2011,8 average home prices will fall $4,683 for the year. more than two-thirds have cut or ended contributions to
This implies that the average household will cut annual local civic and cultural organizations.10 Some localities in
Virginia had to lay off teachers or police to balance their
budgets.
7 Source: Housing Wealth, Financial Wealth, and Consumption: New
Evidence from Micro Data. By Raphael Bostic, Stuard Gabriel, and Gary Policy Implications
Painter. Regional Science and Urban Economics, January 2009. Housing
Wealth Effects: Housing’s Impact on Wealth Accumulation, Wealth Distri-
bution and Consumer Spending, by Eric Belsky and Joel Prakken, “Joint Since the onset of the financial crisis, federal and state
Center for Housing Studies Working Paper W04-13, December 2004. governments have proposed several measures to alleviate
8 Source: National Association of Realtors, Feb 2011. http://www.realtor.
org/research/research/ehsdata
the impact of foreclosures. However, these measures have
9 $4,683 * 5.5% = $258.
10 Source: “Survey: Nearly 30% of Virginia’s Localities have had to In-
14 crease Taxes.” http://www.timesnews.net/article.php?id=9024597been less successful in stemming the foreclosure tide. The
fundamental problem in the lack of effective policy is the
moral ambivalence regarding the foreclosure crisis. On the
one hand, many people believe that foreclosures have a
negative effect on the economy and communities and that
government should intervene to reduce the impact. One
the other hand, some policymakers believe homeowners
should be responsible for their own actions and that gov-
ernment should not bail out those who took out loans that
they could not afford. As a result, programs intended to ad-
dress the foreclosure issue, such as the Making Home Af-
fordable Program by the Obama administration, did little to
alleviate the foreclosure crisis.11 This program is voluntary
in nature and its eligibility criteria apply only to a small
percentage of mortgages. In a recent survey completed in
the epicenter of the foreclosure crisis—Nevada—a major-
ity of surveyed homeowners said they were not aware of
the federal and state programs to help them, or that banks
were not willing to help when they reached out to them.12
The ambivalent attitude toward foreclosures is expected
to persist with no additional programs helping struggling
homeowners. With the worst of the foreclosure crisis likely
in the past, there is less political pressure for policymakers
to deal with foreclosures. Market forces will work to clear
the foreclosure mess slowly, but surely.
While no legislative actions are expected that will deal with
the foreclosure crisis per se, Congress passed a Financial
Reform Bill (Dodd-Frank Bill) which aimed to prevent
future financial crises. The bill will set up a consumer pro-
tection agency that requires banks to review the income
and credit history of mortgage applicants to ensure they
can afford payments.13 This bill seems to address some of
the causes of the foreclosure crisis. Whether it can prevent
future financial crises in general, and foreclosure crises in
particular, remains to be seen.
11 Source: http://www.makinghomeaffordable.gov/Pages/default.aspx
12 Source: An Analysis of Nevada Foreclosure Crisis, Nevada Association
of Realtors. Available at: http://media.lasvegassun.com/media/pdfs/blogs/
documents/2011/01/25/FaceofForeclosure0125.pdf.
13 Source: Financial Reform Law: What’s in it and How does
it Work? http://www.csmonitor.com/USA/Politics/2010/0721/
Financial-reform-law-What-s-in-it-and-how-does-it-work
15The quicker job loss in the nation resulted in a deeper
trough than experienced in Virginia. Employment in the
state peaked in April 2008 at 3,777,900 and dropped to
Virginia Economy
a trough of 3,591,200 in February 2010 for a 4.9% peak-
to-trough decline. This compares with a 6.3% decline in
the nation. Furthermore, as of March 2011, Virginia has
recovered 33% of its peak-to-trough job losses while the
nation has only recovered 17% of its losses.
As in the nation, the economic recovery in Virginia has
Among the metro areas, there is wide variation in the re-
been slow and uneven. The Commonwealth is performing
covery of recession job losses. Northern Virginia leads
better than the nation overall, and this is clearly seen in the
the pack, having regained 81% of its peak-to-trough job
labor market data. Nevertheless, the recovery will likely
losses as of March 2011. Three of the metros have had
drag on well past 2011 as the state and the metro areas at-
recent troughs (December 2010 or later) and have recap-
tempt to expand economic activity to pre-recession levels.
tured less than a tenth of recession job losses: Blacksburg
(1%), Hampton Roads (3%), and Roanoke (7%). Four other
Employment Growth
metros have regained less than a third of lost jobs as has
Percent Change, Year-Over-Year
4% the state: Richmond (13%), Bristol (17%), Charlottesville
Virginia
3% (26%), and Harrisonburg (31%). The final metros have
2% been above-average in regaining employment losses from
1%
the recession as of March 2011 preliminary data: Win-
0%
chester (45%), Danville (46%), and Lynchburg (75%).
-1%
United States
-2%
-3%
In the near term, Virginia’s job growth is expected to im-
-4% prove, though in somewhat modest fashion. On an annual
-5% average basis, employment in the state is projected to ex-
-6% pand 1.4% in 2011 after receding 0.2% in 2010. Employ-
Mar-99 Mar-01 Mar-03 Mar-05 Mar-07 Mar-09 Mar-11 ment growth is expected to accelerate to 1.6% in 2012,
Source: Bureau of Labor Statistics though based on this forecast the state may not reach pre-
recession levels in this year. By comparison, from 1992 to
2007, Virginia averaged 1.9% annualized job growth.
The year-over-year employment growth rates of Virginia
and the nation have been fairly similar over the last nine Sector Job Growth
months. For the year ending March 2011, total employ-
ment expanded 1.1% (+39,257 jobs) in the state compared Over the year ending March 2011, most of the job gains in
to 1.0% growth in the nation. Since May 2010, the year- Virginia were due to three sectors: professional and busi-
over-year pace of job growth in Virginia has not exceeded ness services (+16,101 jobs), education and health services
the pace in the nation by more than 0.6 percentage points. (+10,451), and retail (+11,960). The two former sectors are
This contrasts with the period from October 2008 through historically the fastest growing in the state, each averag-
November 2009 when both the state and nation were con- ing better than 3.0% annualized job growth over the past
tracting jobs but the pace of job loss in the nation was over twenty years. Retail, in contrast, is recovering lost ground.
a percentage point faster than in Virginia. Retail employment peaked in November 2007 at 428,800
jobs in Virginia; as of March 2011, though the sector was
expanding jobs at a 3.0% year-over-year pace, current em-
ployment was 409,100, over 19,000 jobs below peak.
16Manufacturing added 947 jobs in Virginia over the year for this sector. Over the year ending March 2011, three of
ending March 2011, equivalent to a 0.4% employment gain. these remaining sectors posted job losses: leisure (-5,872
This was a rare expansion in this industry that has posted jobs); information (-3,812); and finance, insurance, and
only seven months of year-over-year job growth since Oc- real estate (-194). The final four sectors posted employ-
tober 1998. Not all manufacturing industries in the Com- ment gains: government (+3,083 jobs); wholesale (+2,289);
monwealth are in decline, however. For example, over the other services (+587); and transportation, warehousing,
five years ending with the third quarter of 2010 (based on and utilities (+367).
a four-quarter moving average), the following industries
added jobs in the state: ship and boat building (+2,249
Technology
jobs), other chemical product and preparation manufactur- Though high-tech employment declined in Virginia during
ing (+1,212), electrical equipment manufacturing (+960), the recession, the drop was not as severe or prolonged as in
and aerospace product and parts manufacturing (+411). the overall economy. From the third quarter of 2008 to the
first quarter of 2010, high-tech shed about 13,100 jobs in
Employment Growth by Sector the state for a 2.2% contraction. By comparison, high-tech
Percent Change, Year Ending March 2011 employment in the nation posted a 6.7% peak-to-trough
4%
3.0 3.2 contraction over the same period.
2.5 2.2
2.1 2.1 2.0
1.7 1.7
1.4 1.5 2%
1.1 1.0
0.70.4
0.3 0.5 0.3 0.4 The latest data show high-tech employment expanding in
0%
2.3
-0.1
-0.4 Virginia. For the year ending with the third quarter of 2010,
-1.4
-1.7 -1.6 -2% high-tech added 3,542 jobs in the state for a 0.6% expan-
Virginia
-4% sion. Wages and salaries in high-tech industries grew even
United States
-5.0 faster over this period, expanding 6.9%--faster than the
-6%
4.2% expansion in wages and salaries among all industries.
FIRE
Retail
Wholesale
TWU
Leisure
Total
PBS
Educ/Health
Other Services
Government
Construction
Information
Manufacturing
Despite the high-tech job growth in the state, only four of
the eleven state metro areas expanded high-tech employ-
Source: Bureau of Labor Statistics
ment over this period. In fact, the Northern Virginia metro
area added 4,774 high-tech jobs over the year ending with
the third quarter of 2010, exceeding the total net high-tech
Like manufacturing, the construction sector in Virginia has job growth in the state.
just recently added jobs on a year-over-year basis after a
long period of contraction. For the year ending March 2011, Level-one high-tech industries are those employing a high-
construction expanded by 3,350 jobs (+1.7%). Construc- er percentage of technology-oriented occupations com-
tion employment was in year-over-year decline in the state pared with level two or level three industries. Level-one
from October 2006 through December 2010, a period that industries contracted 2.9% in Virginia from peak to trough
coincides with the housing market correction. Construction due to the recession, much less than the 7.3% contraction
employment peaked in the state in March 2006 at 264,400; in the nation. Over the year ending with the third quarter
five years later, construction jobs numbered 195,200 in of 2010, the largest job gains among level-one industries in
Virginia after more than one in every four construction Virginia were posted in scientific research and development
jobs were lost. services (+2,375 jobs) and computer systems design and
related services (+1,157). Over the same period, seven of
The remaining sectors are likewise in the similar position the twelve level-one industry groups shed jobs in the state,
of regaining jobs lost following previous peaks. Govern- led by a 623-job contraction in architectural, engineering,
ment is somewhat an exception to this—if one ignores the and related services.
temporary bump of federal jobs due to the census in 2010,
recent March 2011 employment may have been a peak
17High-Technology Growth in Virginia
Employment Wages and Salaries
Thousands of Dollars*
NAICS Industry 2009Q3 2010Q3 Change % Change 2009Q3 2010Q3 Change % Change
Total Employment 3,525,410 3,541,681 16,271 0.5 41,104,861 42,847,714 1,742,853 4.2
Total High Technology 585,842 589,384 3,542 0.6 12,630,624 13,498,245 867,621 6.9
Level 1 274,404 276,412 2,009 0.7 6,005,788 6,492,761 486,973 8.1
Pharmaceutical and Medicine
3254 3,476 3,424 -52 -1.5 63,876 64,355 479 0.8
Manufacturing
Computer and Peripheral Equipment
3341 714 687 -27 -3.7 10,414 11,382 968 9.3
Manufacturing
Communications Equipment
3342 1,445 1,466 21 1.5 25,004 37,888 12,884 51.5
Manufacturing
Semiconductor and Other Electronic
3344 4,137 4,103 -33 -0.8 62,144 66,142 3,998 6.4
Component Manufacturing
Navigational, Measuring, Electromedical,
3345 5,089 4,644 -445 -8.7 108,366 103,847 -4,519 -4.2
and Control Instruments Manufacturing
Aerospace Product and Parts
3364 3,028 3,207 179 5.9 64,260 69,312 5,053 7.9
Manufacturing
5112 Software Publishers 4,846 4,888 42 0.9 129,783 140,076 10,292 7.9
Data Processing, Hosting, and Related
5182 11,470 11,104 -366 -3.2 216,207 212,698 -3,509 -1.6
Services
5191 Other Information Services 7,855 7,634 -221 -2.8 93,068 93,989 921 1.0
Architectural, Engineering, and Related
5413 67,358 66,735 -623 -0.9 1,343,299 1,385,891 42,591 3.2
Services
Computer Systems Design and Related
5415 138,743 139,900 1,157 0.8 3,277,109 3,597,973 320,864 9.8
Services
Scientific Research and Development
5417 26,244 28,619 2,375 9.0 612,258 709,207 96,950 15.8
Services
Level 2 172,062 176,550 4,488 2.6 3,971,630 4,235,902 264,272 6.7
Level 3 139,376 136,421 -2,955 -2.1 2,653,205 2,769,582 116,377 4.4
* Includes some stock options that were exercised.
Note: Data in this table include both privately-owned and government-owned high-tech operations. Figures may not sum due to rounding.
Source: Chmura Economics & Analytics and Virginia Employment Commission
An industry is defined as high-tech in this publication if, at the national level, it possesses at least double the percentage of employment in technology-oriented occupations
compared to the average for all industries. Level one high-tech industries possess at least five times the average of technology-oriented occupations, level two employ 3.0
to 4.9 times the average, and level three at least 2.0 times the average.
Labor Market ployment rates as of March 2011 were found in Danville
(9.4%) and Bristol (7.4%).
After peaking at 7.2% from December 2009 through Febru-
ary 2010, the unemployment rate in Virginia has steadily Initial unemployment claims data indicate improvement
trended downward, reaching 6.3% as of March 2011. By in the labor market, though a quick return to pre-recession
comparison, the national unemployment rate peaked at levels is unlikely. The six-month moving average of initial
10.1% in October 2009 and has trended downward, though unemployment claims in Virginia peaked in July 2009 at
less steadily so. Among the metro areas, the lowest March 46,877. Initial claims have receded sharply since, with the
2011 unemployment rates were recorded in Northern Vir- moving average falling 38% to 29,145 in March 2011. This
ginia (4.5%) and Charlottesville (5.0%), the same metros level of initial claims, however, is still relatively high—in
that have had the two lowest unemployment rates in the the two years preceding the recession, initial claims aver-
state since January 2008. The highest metro area unem- aged about 22,000 per month in the Commonwealth.
18Unemployment Rate 70.6% in Virginia while dropping in the nation from 64.5%
11% to 64.1%. The percentage of income supplied by transfer
10% payments (social security, unemployment compensation,
9%
welfare, disability payments, etc.) increased in both the
8%
7%
state and the nation—consistent with expectations for a
United States
6% period of slow and contracting growth. From 2009 to 2010,
5% the proportion of income provided by transfer payments
4% increased from 12.9% to 13.4% in Virginia and from 17.5%
Virginia
3%
to 18.3% in the nation.
2%
1%
Mar-99 Mar-01 Mar-03 Mar-05 Mar-07 Mar-09 Mar-11
Total wages and salaries in Virginia rose 1.8% in 2010 after
Source: Bureau of Labor Statistics
contracting 1.2% in 2009. With the business cycle on the
upswing, wages and salaries growth is forecast to acceler-
Income ate to 4.7% in 2011 and 5.1% in 2012. All of the metro
From 2009 to 2010, real personal income advanced 1.5% areas in Virginia are expected to see growth in wages and
in Virginia compared to 1.3% in the nation—Virginia’s salaries in 2011. With the exception of Northern Virginia,
pace of growth ranking 18th among the fifty states. Per- every state metro area saw a decline in wages and salaries
sonal income is made up of (1) net earnings; (2) dividends, in at least one of the past two years.
interest, and rent; and (3) transfer receipts. Virginia’s total Retail Sales
income growth in 2010 exceeded that of the nation due to
better growth in net earnings—which expanded 3.0% in Consumer spending in Virginia has begun to recover from
the state compared to 2.4% in the nation. Over the past ten a long and sustained drop due to the recession. Over the
years, Virginia averaged 2.3% annualized growth in real year ending March 2011, retail sales grew 3.4% in the state
personal income, outpacing the 1.5% annualized growth as every metro area posted an expansion. The six-month
in the nation. moving average of retail sales peaked in Virginia in June
2007 before plummeting 8.4% to a trough in February
The proportion of income supplied by net earnings was 2010. As of March 2011, the moving average of retail sales
level in the state while decreasing in the nation in 2010. Net in Virginia was 4.7% below its pre-recession peak.
earnings consist of wage and salary disbursements, other
labor income, and proprietor’s income. From 2009 to 2010, On an annual average basis, real retail sales fell 0.6% in
the proportion of income from net earnings remained at 2010 after dropping 5.4% in both 2009 and 2008. Real
retail sales are expected to improve 4.2% in 2011 and to
Real Personal Income Growth accelerate slightly to 4.3% growth in 2012. All of the state
Percent Change, Year-Over-Year
metro areas are expected to see real retail sales growth
8%
over 2011 and 2012 as sales attempt to rebound from prior
Virginia
6% losses.
4%
2%
0%
-2%
United States
-4%
1999 2001 2003 2005 2007 2009
Source: Bureau of Economic Analysis
19Retail Sales, Percent Change Home Price Appreciation
Year-Over-Year, Six-Month Moving Average Percent Change, Year-Over-Year
15% 25%
20%
Virginia
10%
15%
5% 10%
5%
0%
0%
-5% -5%
United States
-10%
-10%
1999 2001 2003 2005 2007 2009
Mar-99 Mar-01 Mar-03 Mar-05 Mar-07 Mar-09 Mar-11
Source: Federal Housing Finance Agency
Source: Virginia Department of Taxation
ington DC tri-state metro (with fourth quarter 2010 prices
Housing Market
20.9% below the peak attained in the last quarter of 2006).
Unlike retail sales, the housing market in Virginia has not
made clear strides for a rebound, but rather has continued The weakness in the housing market is underscored by
to struggle. The Virginia Association of Realtors reported residential building permit activity—which, instead of
that 82,809 homes were sold in the state in 2010, a 9.8% bounding back, has been crawling back. After double-digit
decrease from 2009. The median sales price in 2010 was percentage declines for four straight years, single-family
$236,900, up 3.3% from the prior year. building permits in Virginia finally posted a gain, but it was
merely a 1.6% annual average expansion in 2010. Expec-
An alternative measure of home prices is the Federal tations for 2011 are that growth remains modest at 1.8%.
Housing Finance Agency’s (FHFA) House Price Index, a While most of the metros in the Commonwealth are pro-
weighted repeat sales index that is a true measure of price jected to see increases in building permit activity in 2011,
appreciation as it is not affected by changes in the size or several are forecast to see declines: Harrisonburg (-0.5%),
quality of homes sold. According to the FHFA index, home Lynchburg (-2.7%), and Winchester (-5.8%).
prices fell 1.4% in Virginia in the fourth quarter of 2010
Metro Areas
on a year-over-year basis, continuing a string of declines
begun in the fourth quarter of 2007.14 Home prices fell at Accelerated growth in employment is expected in 2011 as
a similar 1.3% pace in the nation in the fourth quarter of the recession recedes further into the background; a full re-
2010. covery, however, is not expected to be quick. On an annual
average basis, employment in Virginia plummeted 3.2% in
According to the FHFA index, Virginia home prices in the 2009 and slipped an additional 0.2% in 2010. Statewide
fourth quarter of 2010 are 11.6% below their peak that was employment is forecast to advance 1.4% in 2011 and 1.6%
reached in the second quarter of 2007. Among the metro in 2012. Every metro area in the state is expected to see
areas, the largest declines in prices were recorded in Win- job growth in 2011.
chester (with fourth quarter 2010 prices 31.7% below the
peak reached in the second quarter of 2006) and the Wash- Four of Virginia’s metro areas are forecast to see less than
a half percent gain in employment in 2011. Three of these
14 This is calculated using the FHFA’s All-Transactions Index as opposed are the metros that have been the slowest growing over
to their Purchase Only Index. The All Transactions Index augments pur-
chase price valuations with appraisals from refinanced mortgages.
the past decade, each posting an annual average contrac-
tion in employment from 2000 to 2010: Danville (-1.9%),
Roanoke (-0.6%), and Bristol (-0.5%). The fourth metro
20area with modest growth expectations in 2011 is Hampton Chmura Virginia Forecast
Roads, forecast to expand employment 0.2% in 2011. In Most-Likely Scenario, Annual Average Change
March 2011, Hampton Roads posted a 0.2% year-over-year Actual Forecast
Blacksburg 2008 2009 2010 2011 2012
decline in employment and also recorded the slowest pace Total Employment* 0.6% -3.6% -2.6% 1.5% 1.8%
Wages and Salaries** -0.3% -3.5% 0.2% 3.9% 3.6%
of growth in retail sales (+1.2%) among the state metros. Real Retail Sales -1.4% -6.1% -2.2% 3.6% 3.1%
Building Permits*** N/A N/A N/A N/A N/A
Bristol
Metros with 2011 job growth expectations close to average Total Employment* 0.5% -4.2% -1.1% 0.3% 0.4%
Wages and Salaries** 4.0% 4.5% -2.4% 1.6% 2.4%
in the Commonwealth include Richmond (+1.0% in 2011) Real Retail Sales -2.1% -2.8% -0.6% 2.0% 0.2%
and Blacksburg (+1.5%). Richmond has been slower that Building Permits -26.7% -27.7% -1.9% 2.3% 3.8%
Charlottesville
the state to recoup job losses due to the recession. In March Total Employment* -0.1% -2.2% -1.0% 2.1% 2.1%
Wages and Salaries** 2.1% -0.2% 1.1% 5.3% 5.6%
2011, Richmond was shedding jobs on a year-over-year Real Retail Sales -6.1% -7.6% 0.9% 5.2% 3.5%
basis in three key sectors that were performing better state- Building Permits
Danville
-30.6% -18.2% 8.7% 4.1% 8.4%
wide: manufacturing; government; and finance, insurance, Total Employment* -0.3% -3.6% -2.3% 0.4% 0.2%
Wages and Salaries** 0.7% -3.3% 0.5% 2.1% 2.1%
and real estate. Blacksburg was one of only three state Real Retail Sales -6.2% -5.1% -1.2% 1.7% 1.3%
Building Permits -41.9% -21.1% -3.9% 2.6% 5.1%
metros to post an overall decline in employment over the Hampton Roads
year ending March 2011 (Hampton Roads and Roanoke Total Employment* -1.2% -3.3% -1.2% 0.2% 0.3%
Wages and Salaries** 2.1% -1.5% -0.3% 2.9% 3.3%
being the others). Recent data, however, show a dramatic Real Retail Sales -7.1% -5.1% -1.9% 2.1% 1.6%
Building Permits -28.7% -10.5% 7.2% 0.1% 6.0%
improvement in Blacksburg’s unemployment rate (6.6% Harrisonburg
in March 2011) and retail sales (+8.2% in March 2011 on Total Employment* -1.0% -2.6% 1.7% 3.6% 2.9%
Wages and Salaries** 3.8% -0.9% 0.6% 5.8% 4.2%
a year-over-year basis). Real Retail Sales -2.1% -10.4% -0.1% 7.4% 2.7%
Building Permits -37.8% 0.6% -13.0% -0.5% 8.8%
Lynchburg
Total Employment* 1.0% -4.7% -1.3% 2.1% 1.5%
Northern Virginia is expected to expand employment 2.0% Wages and Salaries** 3.4% -3.3% 0.5% 4.1% 4.0%
in 2011 as it continues to be a main driver in the state’s Real Retail Sales -0.1% -9.8% 2.2% 1.3% 3.5%
Building Permits -41.0% -33.6% 1.0% -2.7% 8.3%
recovery. After employment bottomed out in the state in Northern Virginia
Total Employment* 0.2% -1.7% 0.8% 2.0% 2.7%
February 2010, about 61,000 jobs were added as of March Wages and Salaries** 3.1% 0.1% 2.9% 5.7% 6.2%
2011 with nearly half of that job growth (49% to be exact) Real Retail Sales -6.0% -3.8% 0.7% 6.1% 6.5%
Building Permits -35.5% -1.4% 6.4% 3.6% 9.7%
occurring in Northern Virginia. In addition, as of the third Richmond
Total Employment* -0.5% -3.9% -0.9% 1.0% 1.4%
quarter of 2010, Northern Virginia accounted for 57% of Wages and Salaries** 1.4% -4.7% 1.0% 4.7% 4.4%
the state’s high-tech jobs and 67% of its high-tech wages Real Retail Sales
Building Permits
-5.3%
-32.8%
-5.9%
-31.4%
-2.4%
-5.5%
5.0%
0.5%
4.8%
3.8%
and salaries. Roanoke
Total Employment* -0.7% -4.0% -2.0% 0.2% 0.3%
Wages and Salaries** 2.6% -1.6% -1.4% 2.4% 2.8%
Real Retail Sales -2.8% -10.9% -2.1% 2.5% 2.3%
The remaining metro areas are forecast to record em- Building Permits -16.9% -44.3% -10.6% 6.1% 9.2%
ployment growth of 2.0% or better in 2011: Winchester Winchester
Total Employment* -2.8% -4.6% 0.4% 2.0% 2.1%
(+2.0%), Charlottesville (+2.1%), Lynchburg (+2.1%), Wages and Salaries** 0.3% -2.6% 1.1% 3.8% 4.8%
Real Retail Sales -9.3% -11.2% 1.9% 5.2% 6.0%
and Harrisonburg (+3.6%). Among all the state metros, Building Permits -35.7% -14.7% -3.0% -5.8% 6.2%
Winchester posted the largest peak-to-trough employment Non-MSAs
Total Employment* 3.4% -6.3% 0.2% 2.3% 1.6%
decline (-9.0%) due to the recession. Lynchburg’s decline Wages and Salaries** 2.8% -1.2% 3.5% 4.8% 5.3%
Real Retail Sales -3.2% -4.9% -0.1% 0.2% 1.2%
was also fairly large (-7.9%), but preliminary first quarter Building Permits -44.4% -31.9% -12.8% 0.5% -7.1%
VA-Totals
of 2011 employment data suggest the metro has recovered Total Employment* 0.0% -3.2% -0.2% 1.4% 1.6%
about three-quarters of those job losses. Charlottesville and Wages and Salaries** 2.5% -1.2% 1.8% 4.7% 5.1%
Real Retail Sales -5.4% -5.4% -0.6% 4.2% 4.3%
Harrisonburg, on the other hand, have posted the best job Building Permits -34.0% -16.6% 1.6% 1.8% 6.6%
growth in the state over the last decade outside of North- *Employment refers to nonagricultural employment **Wages and salaries include some
options that were exercised. Actual data are through the 4th quarter of 2010. ***Since
ern Virginia. From 2000 to 2010, the state managed 0.3% 2005, building permits data are not reported for Blacksburg metro.
All reported series are seasonally adjusted.
annualized average job growth compared to 0.9% in Har-
risonburg and 1.1% in Charlottesville.
21You can also read