Climatic and societal impacts of a "forgotten" cluster of volcanic eruptions in 1108-1110 CE - Nature
←
→
Page content transcription
If your browser does not render page correctly, please read the page content below
www.nature.com/scientificreports

            OPEN           Climatic and societal impacts of
                           a “forgotten” cluster of volcanic
                           eruptions in 1108-1110 CE
                           Sébastien Guillet1*, Christophe Corona2, Francis Ludlow                3
                                                                                                      , Clive Oppenheimer     4
                                                                                                                                  &
                           Markus Stoffel1,5,6
                           Recently revised ice core chronologies for Greenland have newly identified one of the largest sulfate
                           deposition signals of the last millennium as occurring between 1108 and 1113 CE. Long considered
                           the product of the 1104 CE Hekla (Iceland) eruption, this event can now be associated with substantial
                           deposition seen in Antarctica under a similarly revised chronology. This newly recognized bipolar
                           deposition episode has consequently been deemed to reveal a previously unknown major tropical
                           eruption in 1108 CE. Here we show that a unique medieval observation of a “dark” total lunar eclipse
                           attests to a dust veil over Europe in May 1110 CE, corroborating the revised ice-core chronologies.
                           Furthermore, careful evaluation of ice core records points to the occurrence of several closely spaced
                           volcanic eruptions between 1108 and 1110 CE. The sources of these eruptions remain unknown, but we
                           propose that Mt. Asama, whose largest Holocene eruption occurred in August 1108 CE and is credibly
                           documented by a contemporary Japanese observer, is a plausible contributor to the elevated sulfate in
                           Greenland. Dendroclimatology and historical documentation both attest, moreover, to severe climatic
                           anomalies following the proposed eruptions, likely providing the environmental preconditions for
                           subsistence crises experienced in Western Europe between 1109 and 1111 CE.

                           While understanding of the climate forcing associated with large volcanic eruptions has advanced greatly since
                           the 1991 Mount Pinatubo eruption, the wider environmental impacts and consequences of volcanism on the
                           trajectories of human societies remain only partially explored, especially for the early and high medieval periods
                           (c. 400–1300 CE). Historical investigations have been mostly restricted to a limited number of volcanic events
                           such as the 939 Eldgjá, 946 Changbaishan and 1257 Samalas eruptions1–5. The paucity of studies covering the
                           high medieval period can be explained by (i) the challenges in accessing, reading, and interpreting European,
                           Near Eastern and Asian historical sources, (ii) the limited number of well-replicated millennium-length tree-ring
                           chronologies, and (iii) uncertainties in ice core dating.
                               Using high-resolution ice core glacio-chemical measurements, automated ice-core layer counting, well-dated
                           and independent time markers (including the cosmic-ray events of 774 and 993 CE), tephra markers and historical
                           reports of atmospheric phenomena (e.g., dust veils) associated with volcanic aerosol presence, Sigl et al.6 demon-
                           strated that ice core records relying upon the Greenland Ice Core Chronology 2005 (GICC05) timescale required a
                           correction of approximately seven years in the first millennium CE, and up to four years in the period we study in
                           this paper. This led to revised ice-core chronologies for Greenland (NS1–2011) and Antarctica (WD2014), as well as
                           to refinements of the radiative forcing record (due to volcanism) extending back to 500 BCE.
                               A prominent discovery arising from this revised ice-core dating is a major and hitherto unrecognized bipo-
                           lar volcanic signal with sulfate deposition starting in late 1108 or early 1109 CE and persisting until early 1113
                           CE in the Greenland record6. Using the GICC05 timescale, this volcanic horizon in Greenland had previously
                           been ascribed to the 1104 CE Hekla eruption6–9 – although no tephra has yet been identified in this layer in any
                           Greenland ice core6,9,10 – and thereby disassociated from what had appeared to be a slightly younger sulfate peak

                           1
                             Climatic Change Impacts and Risks in the Anthropocene (C-CIA), Institute for Environmental Sciences, University
                           of Geneva, 66 Boulevard Carl Vogt, CH-1205, Geneva, Switzerland. 2Geolab, Université Clermont Auvergne, CNRS,
                           F-63000, Clermont-Ferrand, France. 3Trinity Centre for Environmental Humanities, Department of History, School
                           of Histories & Humanities, Trinity College, Dublin, D2, Ireland. 4Department of Geography, University of Cambridge,
                           Downing Place, Cambridge, CB2 3EN, United Kingdom. 5Department of Earth Sciences, University of Geneva, Rue
                           des Maraîchers 13, CH-1205, Geneva, Switzerland. 6Department F.-A. Forel for Environmental and Aquatic Sciences,
                           University of Geneva, 66 Boulevard Carl Vogt, CH-1205, Geneva, Switzerland. *email: sebastien.guillet@unige.ch

Scientific Reports |   (2020) 10:6715 | https://doi.org/10.1038/s41598-020-63339-3                                                          1
www.nature.com/scientificreports/ www.nature.com/scientificreports
in Antarctic ice core records. The same signal in the Greenland Ice Sheet Project 2 (GISP2) ice core11 was simi-
larly ascribed to Hekla at 1104 CE and used as a chronological tie-point for the Meese-Sowers GISP2 time-scale.
Examining whether the re-dating of this volcanic horizon is supported by independent evidence is therefore
critical when assessing the validity of ice-core timescales (e.g., Meese-Sowers, GICC05, NS1–2011). With an
estimated volcanic stratospheric sulfur injection (VSSI) of 19.2 Tg[S] and a cumulative global radiative forcing
of −12.6 W/m2, the event ranks seventh in the last millennium or 13th in the last 2500 years in the NS1–2011
volcanic forcing dataset6,12. This degree of forcing is comparable with that estimated for the major volcanic signal
in c. 1601 CE (−11.6 W/m2), for which there is evidence for significant impacts on climate and society13–16. Here
using historical and tree ring records we investigate whether independent evidence exists both for the existence
and timing of the 1108 CE event as proposed in the NS1–2011 timescale. We also evaluate the potential eruptive
source(s) and the impacts that this event may have had on NH climate and contemporary societies.
Dark total lunar eclipse corroborates timing of major explosive volcanism. The spectacular
atmospheric optical phenomena associated with high-altitude volcanic aerosols have caught the attention of
chroniclers since ancient times. Relevant observations include twilight glows, dimming or discoloration of the
Sun, and solar coronae (i.e., Bishop’s Rings)17,18. Reports of these manifestations have been used to identify the
occurrence, timing, and climatic-forcing potential of large eruptions19,20, and to validate and anchor ice core chro-
nologies6. Volcanic influences on the appearance of the lunar disk hold similar potential, though have received
less attention. In particular, the reported brightness of lunar eclipses can be employed both to detect volcanic
aerosols in the stratosphere and to quantify stratospheric optical depths following large eruptions4,21–24.
The darkest total lunar eclipses (Luminosity = 0, see Materials and Methods) recorded since 1600 CE (i.e. in
1601, 1642, 1816, 1884, 1913, 1983, and 1992) have all been linked to large volcanic eruptions, namely the 1600
Huaynaputina, 1641 Parker, 1815 Tambora, 1883 Krakatau, 1912 Katmai-Novarupta, 1983 El Chichón, and 1991
Pinatubo eruptions21,23,24. Despite this potential, high medieval written sources have yet to be fully examined for
contemporary evidence of dark total lunar eclipses. Accordingly, we thoroughly surveyed available European and
Near Eastern texts spanning the early 12th century. NASA’s Five Millennia Catalog of Lunar Eclipses25 (based on astro-
nomical retrocalculation) notes that seven total lunar eclipses were observable in Europe between 1100 and 1120
CE, namely on 17 September 1103, 11 January 1107, 6 July 1107, 5 May 1110, 8 August 1114, 16 June 1117 and 10
December 1117 CE. Our survey recovered 17 original historical reports that credibly pertain to these eclipses.
In total, six out of the 17 observations specified the color and brightness of the Moon and allowed character-
ization of eclipses according to the Danjon scale, which ranks lunar luminosity on a scale of 0 to 4 in order of
increasing brightness (see Materials and Methods); all eclipses - with documented brightness - were rated bright
at L = 3 or L = 4 (Table S1), except that of 1110 CE, for which L = 0.
The contemporary Anglo Saxon Peterborough Chronicle highlights the exceptional darkness of the Moon in
this latter case26: “On the fifth night in the month of May appeared the moon shining bright in the evening, and
afterwards by little and little its light diminished, so that, as soon as night came, it was so completely extinguished
withal, that neither light, nor orb, nor anything at all of it was seen. And so it continued nearly until day, and then
appeared shining full and bright.” Significantly, the chronicler attests to an otherwise clear night sky, indicating
that the Moon’s disappearance cannot be explained by the presence of clouds: “All the night was the firmament
very clear, and the stars over all the heavens shining very bright.” This testimony contrasts starkly with records of
blood-red Moons for previous and subsequent eclipses (Table S1). We also note that this is one of the longest and
most detailed accounts we are aware of for any dark lunar eclipse occurring between 500 and 1800 CE, rivalling
the apparent darkness of the total lunar eclipses noticed after the 1257 CE Samalas5 and 1883 CE Krakatau27–29
eruptions (see Text S1 for more details).
The darkness of the 1110 CE total lunar eclipse has, indeed, long caught the attention of astronomers21,30–32.
The astronomer Georges Frederick Chambers (1841–1915) was one of the first to remark on its singular nature:
“It is evident that this [eclipse] was an instance of a ‘black’ eclipse when the Moon becomes quite invisible instead of
shining with the familiar coppery hue”30. Hitherto, the blackness of this eclipsed Moon has not been directly linked
to the presence of volcanic aerosols in the stratosphere in May 1110 CE. The new evidence for a stratospheric
aerosol veil in 1110 CE thus provides an independent validation of the NS1–2011 and WD2014 timescales, which
place notable sulfate deposition in both poles at this time. We note that no other evidence of volcanic dust veil,
such as a dimming of the Sun, red twilight glows and/or reddish solar haloes, could be found during our investi-
gations for the years 1108–1110 CE.
Reinterpreting the bipolar ice core signature and evaluating potential eruptive source(s). Sigl.
et al.6 originally assigned the 1108–1109 CE volcanic ice core horizon to one single unidentified tropical eruption.
Here, based on a close re-examination of the NEEM-2011-S1, NGRIP and WDC06A records, we posit that this
volcanic horizon may instead reflect the contribution of several closely-spaced volcanic eruptions that occurred
between 1108 and 1110 CE.
The NEEM-2011-S1 record shows a sharp inflection upward around mid-1108 CE, reaching a peak (~40 nssS)
by the end of the year (Fig. 1). The signal then gradually decays until around mid-1110 CE when there is another
substantial increase in sulfur to a peak (~75 nssS) in late 1110 CE followed by a sharp decline to early 1111 CE.
Lesser but still elevated sulphate then persists until late 1112 or early 1113 CE. The NGRIP record – synchronized
to the NS1–2011 timescale (Sigl et al., 2015) – largely follows, despite its lower resolution and some short-lived
departures, the NEEM-2011-S1 trend (Fig. 1). The signal in the WDC06A record is less pronounced than in the
Greenland ice cores. It shows elevated sulfur deposition most visibly between 1109 and 1111 CE, with a main
peak (~35 nssS) in c. late 1109 CE (Fig. 1). Allowing for uncertainty in the inter-polar chronologies, it is possible
to reach several credible interpretations of the volcanic history over these years, summarized as scenarios 1–3 in
the following:
Scientific Reports | (2020) 10:6715 | https://doi.org/10.1038/s41598-020-63339-3 2www.nature.com/scientificreports/ www.nature.com/scientificreports
Year (C.E.)
1100 1102 1104 1106 1108 1110 1112 1114 1116 1118 1120 1122
100 100
11.01.1107 05.05.1110 18.08.1114 15.06/10.12.1117
Dark Lunar Eclipse
Reddish Lunar Eclipse
80 NEEM-2011-S1 ice core - nssS
80
WDC06A ice core - nssS
NGRIP ice core - S
Non-sea-salt sulfur (nssS) ppb
60 60
Sulfur (S) ppb
40 40
20 20
0 0
1100 1102 1104 1106 1108 1110 1112 1114 1116 1118 1120 1122
Year (C.E.)
Figure 1. (a) Monthly-resolved non-sea-salt sulfur records from the NEEM-2011-S1, NGRIP and the
WDC06A ice cores6 and (b) brightness of the total lunar eclipses observed in Europe for the period 1100–1122
CE. Dark total eclipses of the Moon indicate high atmospheric turbidity; while a reddish disk shown by the
eclipsed Moon betrays a clear stratosphere.
Scenario 1: (1) a tropical eruption in 1108 CE, responsible for the sulfur deposits in Antarctica in 1109 CE and
contributing to the broader signal (1108–1113 CE) seen in the Greenland records, together with (2) an almost
synchronous high latitude NH eruption (potentially of Asama in Japan in August-October 1108 CE, see below for
details), and (3) a further high-latitude NH eruption in late 1109 or early 1110 CE.
Scenario 2: (1) A number of large eruptions in the mid- to high latitudes of the NH (Mount Asama being one
potential source), with deposition starting in 1108 CE, responsible for the broader signal (1108–1113 CE) seen in
Greenland, and (2) a tropical eruption with sulfur deposition peaking in late 1109 CE in the WDC06A ice core
and contributing additional volcanic aerosol deposition in Greenland records.
Scenario 3: Alternatively, one could also propose a scenario without any tropical eruption. This scenario
would include: (1) A number of large eruptions in the mid- to high latitudes of the NH (Mount Asama being one
potential source, as before), with deposition starting in 1108 CE, responsible for the extended period of sulfur
deposition (1108–1113 CE) seen in the Greenland records. (2) A large eruption in the Southern Hemisphere (SH)
in late 1108 to early 1109 CE, independently producing the elevated levels of sulfur deposition observed in the
WDC06A ice core.
At this stage, the temporal resolution of the NEEM-2011-S1 and WDC06A ice core records does not allow
more precise estimation of the number of volcanic eruptions that contributed to sulfur deposition between 1108
and 1113 CE, nor does it allow for the quantification of the individual contribution of each eruption to this deposi-
tion. The sources of these eruptions also remain unknown, yet one eruption with a historical date in this period is
that of Mount Asama in Japan (36°40′ N, 138°52′ E, 2568 m above sea level). The so-called Chūyūki 中右記 diary,
written by the statesman Fujiwara no Munetada 藤原宗忠 (1062–1141), states that the eruption of Mount Asama
began in late August 1108 and lasted until October 1108 CE: “October 13: According to a report from the province
of Kōzuke, there is a high mountain in the middle of the province, Mount Asama. In the years 1065–1069, a slight
smoke rose above the volcano but later became imperceptible. On August 29, there was a fire at the top of the volcano,
a thick layer of ash in the governor’s garden, everywhere the fields and the rice fields are rendered unfit for cultiva-
tion. We never saw that in the country. It is a very strange and rare thing.” (see Table S2 for more details). With an
assigned VEI of 5, the 1108 CE eruption is considered the largest Holocene eruption of Asama. Its magnitude
is larger than that of the volcano’s notorious 1783 CE eruption, which killed more than 1400 people. Taking the
eruption period as August-October of 1108 CE, associated sulfate deposition over Greenland can be expected to
have potentially spanned from late 1108 CE up to early 1110 CE. Considering chronological uncertainties, we
consider it plausible that the 1108 CE Asama eruption contributed to the Greenland ice core signal. The occur-
rence of several major volcanic events with a NH ice-core sulphate deposition bias is also consistent with a heavy
NH stratospheric aerosol loading sufficient to induce the May 1110 CE dark eclipse.
Tree-ring-based evidence of climatic impacts of the 1108–1110 CE volcanic cluster. To identify
as well as spatially and temporally characterize potential climatic impacts arising from these eruptions, which we
describe as the 1108-1110 CE volcanic cluster, we employ a tree-ring network of 25 NH chronologies (Table S3,
Fig. S15). These are used to reconstruct JJA temperatures for 40–90°N over land and spanning the period 500–
2000 CE (see Table S4 for statistical details of the reconstruction).
Scientific Reports | (2020) 10:6715 | https://doi.org/10.1038/s41598-020-63339-3 3www.nature.com/scientificreports/ www.nature.com/scientificreports
a
2
1
(in °C wrt 1961-1990)
Temperature anomaly
0
-1
1259
536 1109 1453 1816
1601
-2
500 600 700 800 900 1000 1100 1200 1300 1400 1500 1600 1700 1800 1900 2000
b Year
1108-1110 events 1257 Samalas eruption 1452/1453 Unknown event
(°C, relative to 30-yrs climatology)
2
NVOLC v2
Sch2015
Temperature anomaly
NTrend2015
1
0
-1
-2
1100 1105 1110 1115 1120 1250 1255 1260 1265 1270 1445 1450 1455 1460 1465
Year Year Year
1600 Huaynaputina eruption 1815 Tambora eruption
(°C, relative to 30-yrs climatology)
2
Temperature anomaly
1
0
-1
-2
1590 1595 1600 1605 1610 1805 1810 1815 1820 1825
Year Year
Figure 2. Tree-ring reconstructions (NVOLC v2) of NH extra-tropical land (40–90°N) summer temperature
anomalies (with respect to the period 1961–1990) since 500 CE. (a) Comparison of NVOLC_filt v2 with recently
published reconstructions, Sch2015 (33) and (b) N-TREND2015 (34) for the 1108–1110 CE, 1257 CE Samalas,
1452/1453 CE Unknown, 1600 CE Huaynaputina, and 1815 CE Tambora eruptions.
The unfiltered reconstruction (Fig. 2a; Material and Methods) identified 1109 CE as experiencing one of the
most extreme NH summer coolings of the last ~1500 years (rank 6) with temperatures of −1.3 °C relative to the
1961–1990 reference period. This value is exceeded by only a handful of cases, all of which are associated with
major explosive volcanism, including −1.6 °C in 1601 CE (rank 1, Huaynaputina), −1.5 °C in 1816 CE (rank 3,
Tambora), −1.4 °C in 536 CE (rank 4, unidentified volcano) and –1.3 °C in 1453 CE (rank 5, unidentified vol-
cano). Examining the filtered NVOLC_filt v2 reconstruction, designed to quantify volcanically-induced cooling
with respect to contemporary climatology (see Material and Methods), strong NH summer cooling is still seen
to prevail in 1109 CE (−1 °C; Fig. 2b), being the 11th coldest NH summer since 500 CE. Comparable values are
observed for the years 1816, 1601, 1259 (all at −1.2 °C), 536 (−1 °C), and 1453 CE (−0.9 °C), all associated with
major volcanic eruptions (Fig. 3b), and ranking as the 1st, 3rd, 2nd, 7th, and 12th coldest years in the filtered series,
respectively. Our findings are corroborated by comparison with other recent, large-scale reconstructions33,34
(hereafter referred to as Sch015 and NTREND015) that rank 1109 CE as the 12th and 30th coolest summer, respec-
tively, of the last millennium (Fig. 2b). Notably, none of these reconstructions (NVOLC v2, NVOLC_filt v2, Sch015
and NTREND015) record significant summer temperature anomalies at the hemispheric scale in the years 1110
or 1111 CE (Fig. 2b).
Figures 3 and S2 show JJA-gridded reconstructions for 1109 CE (3065 1°×1° grid points with a coefficient
of efficiency>0.1) that reveal widespread, but heterogeneous NH summer cooling. The most affected regions
are Siberia (−2.3 °C), Scandinavia (−2 °C), Central Asia (−1.5 °C), Quebec (−1.5 °C) and, to a lesser extent,
Western Europe (−0.4 °C). This evidence for particularly severe cooling in Siberia, Central Asia, and Quebec is
Scientific Reports | (2020) 10:6715 | https://doi.org/10.1038/s41598-020-63339-3 4www.nature.com/scientificreports/ www.nature.com/scientificreports
a. 1109 b. 1258 c. 1816
°C wrt 31yr mov. av.
0 2500 5000 km
Below -2 -1.2 -0.8 -0.4 -0.2 0 0.3 0.6 1 Above
Figure 3. Spatial extent of the JJA temperature anomalies induced by (a) the 1108–1110 CE, (b) 1257 CE
Samalas and (c) 1815 CE Tambora eruptions.
corroborated by the occurrence of frost rings and light rings in the tree-ring chronologies of Yamal, Polar Ural,
Altai, Quebec and Western USA during the 1109 CE growing season (i.e. April-September; Table S5). In contrast,
above-average temperatures prevailed in British Columbia (+0.8 °C), Greenland (+0.4 °C), and Yakutia (+0.3 °C)
during this summer (Fig. 3). The persistence of the summer cooling following our proposed eruption cluster
between 1108 and 1110 CE is also heterogeneous in spatial terms. Whereas Siberia, Scandinavia, and Central Asia
experienced the most extended cooling (>2 years), elsewhere reconstructed summer temperatures recovered
more rapidly after 1109 CE (Fig. S3).
Documentary evidence for climatic impacts in Western Europe. We identified 13 narrative sources
(Table S2) that describe meteorological phenomena and conditions in the years 1109–1111 CE. Despite the
more limited frequency of meteorological entries at the beginning of the 12th century when compared with sub-
sequent periods35,36, the abundance of testimonies referring to adverse weather, crop failures, and famines in
these years is notably comparable with the number of accounts for later events such as 1137 CE, known as one of
the driest summers of the century, which had major human impacts, or with 1151, 1174, 1195, and 1196 CE (see
Fig. S4), which stand out as the coldest and wettest summers of this period37,38 (Fig. S5).
The majority of our surveyed sources describe heavy and unseasonable rainfalls over the Atlantic domain
of Europe, especially in the summer and autumn of 1109 CE. For instance, testimony from France provided by
Orderic Vitalis (1075–1141/43 CE), a monk at the Saint-Evroult abbey and a contemporary witness, describes
“excessive rainfall”, while the Ex Historiae Francicae Fragmento and the Annals of Hasungen similarly report con-
tinuous rainfall in the North and Western part of France and in Germany (Table S2). For Ireland, the contempo-
rary Gaelic Irish Annals of Inisfallen report “heavy rain and bad weather in the summer and autumn” (Table S2).
The hydroclimatic anomalies experienced during the summer of 1109 CE are for this region of Europe consistent
with climate observations in 1258 and 1816 CE after the Samalas and Tambora eruptions, respectively4,5,39–42. The
Old World Drought Atlas (OWDA)43, which employs tree-ring data to reconstruct spring-summer soil mois-
ture, also corroborates our documentary evidence for wet summer conditions in Ireland, Britain, and Western
France for 1109 CE (Fig. S6). The overt focus of our documentary data on precipitation anomalies (through their
impacts on flooding and crop failures), as opposed to summer temperature anomalies, is notable and usefully
demonstrates how sources may exhibit biases towards reporting the meteorological phenomena with the greatest
societal impact44. We note, however, that over Northwest Europe, years with wet spring-summer conditions are
usually also cold45, such that our documentary evidence of anomalously high wetness indirectly corroborates the
cold conditions seen in the tree-ring-based summer temperature for 1109 CE.
Documentary evidence of societal impact and response in Western Europe. Diverse societal
impacts and responses to these weather conditions are revealed by our sources, starting in 1109 CE. In France,
Belgium and England, persistent wet summer and autumn weather reduced crop yields in this year. For France,
Orderic Vitalis reports in the Historia Ecclesiastica how excessive rainfall “drowned the crops, the barrenness of
the earth cried aloud, and the grape harvest was an almost total failure” (Table S2). Similarly, the Life of Blessed
Tiron describe how “floods of rain” in Northern and Western France rendered soils unproductive (Table S2). Crop
shortages led to severe food price inflation in Burgundy (France), where wheat prices doubled between the winter
of 1108/1109 and July 1109 CE according to The Chronicle of Saint-Pierre-le-Vif de Sens (Table S2). Although the
text does not elaborate upon causation, as is characteristic of many annalistic and chronicle sources46, sharp food
price increases often followed harvest shortfalls, compounded by grain hoarding and speculation by crop-owners
seeking to maximize profits47. Withholding of grain supplies and speculation were observed, for example, after
Scientific Reports | (2020) 10:6715 | https://doi.org/10.1038/s41598-020-63339-3 5www.nature.com/scientificreports/ www.nature.com/scientificreports
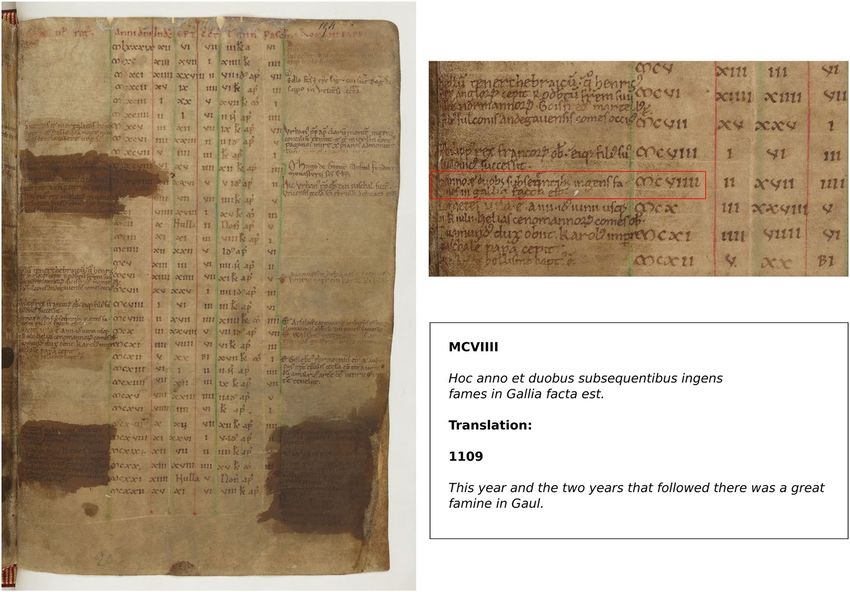
Figure 4. Original manuscript of the Annals of Saint Evroult, Normandy, France (source: Annales Uticenses.
Bibliothèque Nationale de France, Paris, Ms Latin 10062, f154r). The manuscript displays a paschal table, also
known as an Easter table, used to determine for successive years the changing dates on which Easter fell, one
of the most important days in the liturgical calendar. On the margins of the Easter table, several brief historical
notes were added, providing information mostly about king’s reigns, as well as the succession of abbots,
bishops and Popes. The entry for the year 1109 CE, however, records a major famine in France lasting three
years. This note was written at the abbey of Saint Evroult by a contemporary witness, the monk Orderic Vitalis
(1075–1141/1143 CE). Orderic Vitalis is one of the most famous scribes of the 12th century. He is predominantly
known as the author of the Historia Ecclesiastica, in which he provides a more detailed and lengthy account of
the famine of 1109–1111 CE (Table S2).
the back-to-back harvest failures of 1257/1258, 1315/1316/1317 and 1351/1352 CE5,47–50. The Annals of Inisfallen
also provide evidence of societal coping mechanisms, demonstrating how these were contingent upon prevailing
belief systems, in describing for Ireland how “fastings and abstinence were observed and alms given to God” so that
the “heavy rain and bad weather in the summer and autumn might be dispelled” (Table S2).
The assembled evidence suggests that the subsistence difficulties, which began in 1109, deepened into famine
in several regions of western Europe, with particular severity in the kingdom of France (Fig. 4, Table S2). The
Chronicle of Morigny (Etampes, Île de France) thus reports for 1109–10 CE that “all of Gaul suffered from a severe
famine and for seven continuous years the lack of everything required to maintain life lingered on, and thus killed off
many people and reduced countless numbers of rich people to poverty”. With its echoes of Joseph’s seven-year fam-
ine in Egypt as described in Genesis, we cannot take too literally the stated duration of the famine. Nevertheless,
the chronicler’s intention is to underscore its uncommon severity. In summary, our exegesis points to onset of
subsistence crises in 1109 CE, verging on or transitioning into famine in some regions in 1110 and persisting
until 1111 CE. Notably, Orderic Vitalis dedicated two entries of his chronicle to famine. The first, pertaining to
1109 CE, noted that “where both Ceres and Bacchus [i.e., the Roman gods of cereals and wines, respectively] failed,
terrible famine decimated human beings everywhere”, while the other, pertaining to 1110 CE, reported how “for
three consecutive years, from the second to the fourth indiction [i.e., 1109 to 1111 CE], there was a terrible famine
in France, and great numbers of folk were seriously weakened”. Subsistence crises are also reported for Catalonia
(Spain) in 1110 and 1111 CE51, and implied to have affected Ireland and England (Table S2). The limited number
of meteorological observations or information related to subsistence crises in sources surveyed from the Holy
Roman Empire (i.e., present-day Germany, Austria, and Italy), precludes any inference on societal consequences
in these regions for the time being.
By reducing food availability, the climatic perturbations induced by the 1108–1110 eruptions may have ini-
tiated the preconditions necessary for famine. Importantly, however, subsistence crisis and famines arise from
multiple, often interacting, influences occurring on a range of temporal scales, such as extreme weather coin-
ciding with destructive military activities (e.g., warfare involving scorched earth tactics), burdensome economic
policies (e.g. taxation) or rapid demographic changes47. The Peterborough Chronicle provides a valuable illustra-
tion of this point in supplying an explicit qualification of multi-causality that is rarely found in High Medieval
sources. It reports that 1110 CE “was a very disastrous year … through bad weather by which the earth-crops were
Scientific Reports | (2020) 10:6715 | https://doi.org/10.1038/s41598-020-63339-3 6www.nature.com/scientificreports/ www.nature.com/scientificreports
badly damaged, and tree-crops all well-nigh ruined all over this land”, but argues as well that the “disastrous year”
also resulted from the burden of “… the tax which the king took for his daughter’s gift …” for her marriage to the
emperor. It is also noteworthy that although the crisis that struck Western Europe between 1109 and 1111 CE was
acute, at least 9 other major famines can be identified for the late 11th and 12th centuries, namely in 1093–1095,
1098–1099, 1124–1126, 1145–1147, 1162–1163, 1175–1177, 1181–1182, 1190–1192 and 1195–1198 CE, of which
only two (1181-1182 and 1190-1192) closely coincide with known substantial volcanic eruptions, thereby high-
lighting that volcanically-induced climatic perturbations were not always the primary cause of famines in the 12th
century.
Conclusions and perspectives. The new evidence for a stratospheric aerosol veil in 1110 CE on the basis
of a contemporary observation of a dark total lunar eclipse allows an independent validation of the accuracy
of the NS1–2011 timescale for the 12th century. In this paper, we also document a mean NH cooling of about
1 °C in 1109 CE, an anomaly that is comparable to that observed following major eruptions in 1816, 1601, 1453,
1258/1259, and 536 CE, as well as a severe subsistence crisis in Western Europe that was likely preconditioned
by extreme weather. We therefore posit that these anomalies may result from the cumulative climatic effects of
several closely-spaced volcanic eruptions that occurred between 1108 and 1110 CE.
The eruptions of 1108–1110 CE therefore constitute, along with 536/40, 1453/58, and 1809/15 CE, a further
example of a climatically and societally impactful cluster of explosive eruptions. But significant differences also
exist in our case, given the close timing of this proposed cluster. The climatic impact of this 12th century cluster
may thus be less persistent than the decadal-scale cooling of the “double events” of 536/40, 1453/58, and 1809/15
CE that are separated by 5 to 6 years52.
Finally, our study provides an important example of the challenges frequently encountered in reconciling
ice-core volcanic signals from multiple cores. It emphasizes the likelihood that some episodes of contiguous
volcanic sulphate deposition in ice cores may result from more than one eruption, as recently demonstrated for
the 1259 CE Antarctic signal53. A major ongoing challenge is thus to identify cases in which volcanic sulphate
signals may represent the contribution of multiple events (e.g., where a bipolar volcanic signal results from two
or more extratropical NH and SH events versus a single tropical event), which may produce meaningfully differ-
ent climatic responses. A combination of evidence and methodologies is essential here. Documentary evidence
such as that detailing the August 1108 CE eruption of Asama is advantageous in pinpointing the precise location,
timing and, particularly when combined with geological evidence, magnitude of historical eruptions. However,
magnitude (explosiveness) is not a direct measure of climatic forcing potential, and petrological evidence may
help determine the sulphate output from Asama 1108 CE. We also encourage the search for and characterization
of tephra in the Greenland and Antarctic ice cores at this time as a means of fingerprinting the contribution of
specific volcanoes. Such measures can not only test and further refine our proposed scenarios, which is essential,
but also yet further scenarios that are conceivable when considering variable sulphate transport times to both
poles and remaining chronological uncertainties in the NS1–2011 and WD2014 time-scales.
Material and Methods
Analysis of contemporary historical sources. More than 130 medieval documentary sources from the
12th century were extensively searched for references to possible climatic impacts of the “forgotten”, early 12th
century volcanic eruption cluster. Contemporary sources are mostly found in compilations of medieval texts
edited in the series of the (i) Monumenta Germaniae Historica, (ii) Rerum Britannicarum Medii Ævi scriptores
and Annales Monastici (often simply known as “The Rolls Series”), (iii) Recueil des historiens des Gaules et de la
France as well as in the (iv) Rerum Italicarum scriptores. In addition, several annals, chronicles and vitae have
been surveyed; these included, among others, the Peterborough Chronicle (part of the Anglo-Saxon Chronicle), the
ecclesiastical history of Orderic Vitalis, the chronicle of Saint-Pierre-le-Vif de Sens, the chronicle of Morigny and
the life of Blessed Bernard of Tiron (see Table S2). Original sources were mostly written in Latin and to a lesser
extent in vernacular (i.e. Old English) and Middle Irish (Gaelic).
Assessing coloration of lunar eclipses. Particular attention was focused on optical phenomena sugges-
tive of the presence of volcanic aerosols in the stratosphere21, such as the dimming of the Sun or dark total lunar
eclipses. Concerns regarding remaining inconsistencies in the dating of volcanic events for the 1450 s and 1690s,
stimulated by suggested mismatches between volcanic forcing data and responses in tree-ring-based temperature
reconstructions54,55, motivate a search for additional validation of the newly re-dated ice core volcanic horizons
using independent and securely dated historical evidence of lunar brightness.
During a total lunar eclipse, sunlight incident on the Earth limbs is absorbed and then scattered. The green
to violet portion of the spectrum is most affected while most of the orange to red light is transmitted through
the atmosphere. The remaining light is refracted by the atmosphere into the Earth shadow, projecting indirect,
reddish light on to the Moon. This gives the fully-eclipsed Moon its characteristic copper to deep-red color. In
the presence of volcanic aerosol in the stratosphere, however, refraction and scattering of sunlight into the Earth
shadow is greatly diminished, hence the eclipsed Moon is darkened. In extreme cases, it can become practically
invisible to naked-eye observation23,24. Here, the reliability of eclipse observations was assessed using NASA’s
Five Millennia Catalog of Lunar Eclipses covering the period 1999 BCE – CE 300025. The darkness of the Moon
was rated according to the Danjon scale56 ranging from L = 0 (very dark, indicating a high turbidity of the strat-
osphere) to L = 4 (very bright, copper-red or orange, indicating low stratospheric turbidity)17. We gave greatest
weight to first-hand information derived from contemporary sources, and dates in chronicles were screened
systematically for errors by cross-checking information with other manuscripts (Table S1 and Table S2). Care was
taken to identify duplicated reports. Duplicates refer to historical material for which the author did not witness
the event described but rather copied the information from another source. The content of duplicated reports is
Scientific Reports | (2020) 10:6715 | https://doi.org/10.1038/s41598-020-63339-3 7www.nature.com/scientificreports/ www.nature.com/scientificreports
therefore not original. Frequent duplication occurred in the Middle Age due to the shared ancestry and common
source material of many surviving texts. All duplicates that were identified are listed in Table S1 and S2 but were
not used for the analyses.
Tree-ring based reconstruction of NH summer temperatures. NH Reconstruction. To quantify the
NH summer cooling induced by the 1108–1110 CE eruptions, we used an updated version of the NVOLC recon-
struction (NVOLC v2) published by Guillet et al. (5). NVOLC v2 consists of 25 proxy records (13 tree-ring width
and 12 maximum latewood density chronologies). The first version of NVOLC was initially designed to quantify
the NH summer cooling induced by the 1257 CE Samalas eruption. To estimate the changes in temperature
observed after the 1257 CE eruption in Greenland – where no millenium-long tree-ring chronology is availa-
ble - 3 annually resolved stable isotope series from Greenland, namely the GRIP, Crete and DYE3 records, were
incorporated to the NVOLC dataset. However these records have been dated using the GICC05 timescale. While
the chronological error of the GICC05 timescale is small around the time of the 1257 CE Samalas eruption, Sigl
et al. (6) have shown that for earlier years such as 1108–1110 CE, a more substantial level of noise may be added.
We therefore excluded these records from the NVOLC v2 network and recomputed the NH JJA reconstruction.
A principal component regression (PCR) approach was chosen to reconstruct NH JJA temperature anomalies
(wrt 1961–1990). The bootstrap method was combined with the PCR to estimate the skill of the reconstruction
and compute confidence intervals of reconstructed JJA temperatures. To gradually adjust to the changing num-
ber of records available back in time, we combined the PCR with a nested approach. NVOLC v2 reconstruction
is based on 23 subsets of tree-ring chronologies or nests. The earliest and most recent nests span the periods
500–551 and 1992–2000 CE, respectively. The most replicated nest is composed of 25 chronologies and spans the
period 1230–1972 CE (see Table S4). The nested PCR was computed as follows:
For each nest, a principal component analysis was calculated on the proxy predictors and the first n principal
components (PCs) with eigenvalues >1 were retained as predictors to develop a multiple linear regression model.
The regression models were all calibrated on JJA temperature obtained from the Berkeley Earth Surface (BEST)
dataset over the period 1805–1972 CE. For each nested regression model, a split calibration–verification proce-
dure was repeated 1,000 times using the bootstrap method to assess the robustness of the transfer function and
1,000 reconstructions were generated. The final reconstruction of each nest is the median of the 1,000 realizations
and is given with its 95% bootstrap confidence interval (Fig. 3). For each nest, the coefficient of determination
(r2 for the calibration and R2 for the verification periods), RE (reduction of error) and CE (coefficient of effi-
ciency) statistics were calculated. These statistics are illustrated with their 2.5 and 97.5 percentiles in Table S4.
The NVOLC v2 reconstruction (500–2000 CE) is obtained by appending together the 23 reconstructions, with
their mean and variance adjusted to be the same as the most replicated nest. Finally, to quantify the reconstructed
cooling within a context of climate variability prevailing at the time of major volcanic eruptions, we filtered the
NVOLC v2 series with a 31-yr running mean (NVOLC_filt v2). For example, in the case of the year 1109 CE, a
background was calculated by averaging the window 1094–1108 CE and 1110–1124 CE. The anomaly is then
created by subtracting this background from the 1109 CE reconstructed temperature.
Climate Field Reconstruction. To estimate regional variability of summer cooling induced the 1108–1110 CE
eruptions, we developed a climate field reconstruction of extratropical Northern Hemisphere summer tempera-
tures spanning the last 1500 years. The target field (predictand) used for the reconstruction is the BEST JJA grid-
ded temperature dataset (1°x1° latitude-longitude grid). The Northern Hemisphere was divided into 11 regions
based on the spatial distribution of the 25 chronologies and their correlation (Fig. S1, Table S3). A minimum
coefficient correlation (r) threshold above 0.3 (p < 0.05) over the common period of the chronologies was used
to cluster the tree-ring records in the same region. For each region, the number of chronologies ranges between
1 (Quebec, Central Europe, Siberia - Taymir, Siberia - Yakutia, and China - Qilian Mountains) and 5 (Western
Europe).
For cluster with several chronologies (n ≥ 2), we applied a nested PCR to reconstruct the JJA surface tem-
peratures anomaly field. For clusters with only one chronology, we used an ordinary least square regression. The
performance and temporal stability of reconstruction models over the 1901–1972 period common to all chronol-
ogies was assessed for each grid point through a split-sample calibration and verification approach repeated 1000
times using the bootstrap method. For each grid point the skills of the reconstruction was assessed using the r2,
R2, RE and CE statistics (Fig. S2). Based on these statistics, a total of 3486 grid points (CE > 0.1) in the Northern
Hemisphere have been reconstructed back to 500 CE, with a minimum number of 52 grid points (CE > 0.1) for
the Indigirka cluster and maximum of 918 grid points (CE > 0.1) for the Siberia - Polar Ural cluster.
Data availability
The data used to perform our analysis as well as our results have been uploaded to Zenodo and are accessible
using the following link: https://doi.org/10.5281/zenodo.3724674
Received: 16 November 2018; Accepted: 27 March 2020;
Published: xx xx xxxx
References
1. Stothers, R. B. Far Reach of the Tenth Century Eldgjá Eruption, Iceland. Clim. Change 39, 715–726 (1998).
2. Oppenheimer, C. et al. The Eldgjá eruption: timing, long-range impacts and influence on the Christianisation of Iceland. Clim.
Change 147, 369–381 (2018).
3. Oppenheimer, C. et al. Multi-proxy dating the ‘Millennium Eruption’ of Changbaishan to late 946 CE. Quat. Sci. Rev. 158, 164–171
(2017).
Scientific Reports | (2020) 10:6715 | https://doi.org/10.1038/s41598-020-63339-3 8www.nature.com/scientificreports/ www.nature.com/scientificreports
4. Stothers, R. B. Climatic and Demographic Consequences of the Massive Volcanic Eruption of 1258. Clim. Change 45, 361–374
(2000).
5. Guillet, S. et al. Climate response to the Samalas volcanic eruption in 1257 revealed by proxy records. Nat. Geosci. 10, 123–128
(2017).
6. Sigl, M. et al. Timing and climate forcing of volcanic eruptions for the past 2,500 years. Nature 523, 543–549 (2015).
7. Hammer, C. U., Clausen, H. B. & Dansgaard, W. Greenland ice sheet evidence of post-glacial volcanism and its climatic impact.
Nature 288, 230–235 (1980).
8. Zielinski, G. A. Stratospheric loading and optical depth estimates of explosive volcanism over the last 2100 years derived from the
Greenland Ice Sheet Project 2 ice core. J. Geophys. Res. 100, 20937 (1995).
9. Vinther, B. M. et al. A synchronized dating of three Greenland ice cores throughout the Holocene. J. Geophys. Res. 111 (2006).
10. Abbott, P. M. & Davies, S. M. Volcanism and the Greenland ice-cores: the tephra record. Earth-Sci. Rev. 115, 173–191 (2012).
11. Meese, D. A. et al. The Greenland Ice Sheet Project 2 depth-age scale: Methods and results. J. Geophys. Res. Oceans 102, 26411–26423
(1997).
12. Toohey, M. & Sigl, M. Volcanic stratospheric sulfur injections and aerosol optical depth from 500 BCE to 1900 CE. Earth Syst. Sci.
Data 9, 809–831 (2017).
13. Briffa, K. R., Jones, P. D., Schweingruber, F. H. & Osborn, T. J. Influence of volcanic eruptions on Northern Hemisphere summer
temperature over the past 600 years. Nature 393, 450–455 (1998).
14. de Silva, S. L. & Zielinski, G. A. Global influence of the AD 1600 eruption of Huaynaputina, Peru. Nature 393, 455–458 (1998).
15. White, S. A cold welcome: the Little Ice Age and Europe’s encounter with North America. (Harvard University Press, 2017).
16. Ludlow, F. & Crampsie, A. Environmental History of Ireland, 1550-1730. In Cambridge History of Ireland: Volume 2, Early Modern
Ireland, 1550-1730 671–704 (Ohlmeyer, J., 2018).
17. Stothers, R. B. Cloudy and clear stratospheres before A.D. 1000 inferred from written sources. J. Geophys. Res. 107 (2002).
18. Oppenheimer, C. Eruptions that shook the world. (Cambridge University Press, 2011).
19. Lamb, H. H. Volcanic Dust in the Atmosphere; with a Chronology and Assessment of Its Meteorological Significance. Philos. Trans.
R. Soc. Math. Phys. Eng. Sci. 266, 425–533 (1970).
20. Stothers, R. B. Major optical depth perturbations to the stratosphere from volcanic eruptions: Pyrheliometric period, 1881-1960. J.
Geophys. Res. Atmospheres 101, 3901–3920 (1996).
21. Keen, R. A. Volcanic Aerosols and Lunar Eclipses. Science 222, 1011–1013 (1983).
22. Hofmann, D. et al. Surface-based observations of volcanic emissions to the stratosphere. In Geophysical Monograph Series (eds.
Robock, A. & Oppenheimer, C.) 139, 57–73 (American Geophysical Union, 2003).
23. Stothers, R. B. Stratospheric Transparency Derived from Total Lunar Eclipse Colors, 1665–1800. Publ. Astron. Soc. Pac. 116, 886–893
(2004).
24. Stothers, R. B. Stratospheric Transparency Derived from Total Lunar Eclipse Colors, 1801–1881. Publ. Astron. Soc. Pac. 117,
1445–1450 (2005).
25. Espenak, F. & Meeus, J. Five Millennium Catalog of Lunar Eclipses: -1999 to +3000. (2009).
26. The Anglo-Saxon chronicle. (Dent [u.a.], 1975).
27. Flammarion, C. L’éclipse de Lune du 4 octobre 1884. La revue populaire d’Astronomie, de mététorologie et de Physique du Globe 3, 488
(1885).
28. Symons, G. J. et al. The Eruption of Krakatoa: And Subsequent Phenomena. (Trübner & Company, 1888).
29. Lowe, E. J. The Recent Eclipse of the Moon. Nature 30, 590 (1884).
30. Chambers, G. F. The Story of Eclipses, (1899).
31. Link, F. CHAPTER 6 - Lunar Eclipses. in Physics and Astronomy of the Moon (ed. Kopal, Z.) 161–229 Academic Press, https://doi.
org/10.1016/B978-1-4832-3240-9.50010-9 (1961).
32. Maclean, A. D. I. The Cause of Dark Lunar Eclipses. J. Br. Astron. Assoc. 96, 263–265 (1984).
33. Schneider, L. et al. Revising midlatitude summer temperatures back to A.D. 600 based on a wood density network: Revising
hemispheric temperature history. Geophys. Res. Lett. 42, 4556–4562 (2015).
34. Wilson, R. et al. Last millennium northern hemisphere summer temperatures from tree rings: Part I: The long term context. Quat.
Sci. Rev. 134, 1–18 (2016).
35. Glaser, R. On the Course of Temperature in Central Europe since the Year 1000 A.D. Hist. Soc. Res. Hist. Sozialforschung 22, 59–87
(1997).
36. Pfister, C., Schwarz-Zanetti, G., Wegmann, M. & Luterbacher, J. Winter air temperature variations in western Europe during the
Early and High Middle Ages (AD 750–1300). The Holocene 8, 535–552 (1998).
37. Alexandre, P. Le climat en Europe au Moyen Age: contribution à l’histoire des variations climatiques de 1000 à 1425, d’après les sources
narratives de l’Europe occidentale. (Ecole des hautes études en sciences sociales, 1987).
38. van Engelen, A. F. V., Buisman, J. & Ijnsen, F. A Millennium of Weather, Winds and Water in the Low Countries. In History and
Climate (eds. Jones, P. D., Ogilvie, A. E. J., Davies, T. D. & Briffa, K. R.) 101–124 (Springer US, 2001).
39. The Year without a summer? world climate in 1816. (Canadian Museum of Nature, 1992).
40. Oppenheimer, C. Climatic, environmental and human consequences of the largest known historic eruption: Tambora volcano
(Indonesia) 1815. Prog. Phys. Geogr. Earth Environ. 27, 230–259 (2003).
41. Trigo, R. M. et al. Iberia in 1816, the year without a summer. Int. J. Climatol. 29, 99–115 (2009).
42. Brönnimann, S. & Krämer, D. Tambora and the “Year Without a Summer” of 1816. A Perspective on Earth and Human Systems
Science. in (Geographica Bernensia, 2016).
43. Cook, E. R. et al. Old World megadroughts and pluvials during the Common Era. Sci. Adv. 1, e1500561–e1500561 (2015).
44. Ludlow, F. The Utility of the Irish Annals as a Source for the Reconstruction of the Climate. (Trinity College, 2010).
45. Rao, M. P. et al. European and Mediterranean hydroclimate responses to tropical volcanic forcing over the last millennium. Geophys.
Res. Lett. 44, 2017GL073057 (2017).
46. White, H. The Value of Narrativity in the Representation of Reality. Crit. Inq. 7, 5–27 (1980).
47. Slavin, P. Climate and famines: a historical reassessment. Wiley Interdiscip. Rev. Clim. Change 7, 433–447 (2016).
48. Keene, D. Crisis Management in London’s Food Supply, 1250–1500. In Commercial Activity, Markets and Entrepreneurs in the Middle
Ages 45–62 (Ben Dodds, Christian D. Liddy, 2011).
49. Campbell, B. M. S. Global Climates, The 1257 Mega-Eruption of Samalas Volcano, Indonesia, And The English Food Crisis of 1258.
Trans. R. Hist. Soc. 27, 87–121 (2017).
50. Slavin, P. Market Failure during The Great Famine in England and Wales (1315-1317). Past Present 222, 9–49 (2014).
51. Benito i Monclús, P. ‘Et si sterilitas, ut solet, in terra illa fuerit…’ frecuencia, longevidad y gravedad de las carestías en Cataluña
durante la ‘fase del crecimiento’ de la economía medieval (siglos XI-XIII). In Crisis de subsistencia y crisis agrarias en la Edad Media
79–110 (Hipólito Rafael Oliva Herrer, Pere Benito i Monclús, 2007).
52. Toohey, M., Krüger, K., Sigl, M., Stordal, F. & Svensen, H. Climatic and societal impacts of a volcanic double event at the dawn of the
Middle Ages. Clim. Change 136, 401–412 (2016).
53. Narcisi, B., Petit, J. R., Delmonte, B., Batanova, V. & Savarino, J. Multiple sources for tephra from AD 1259 volcanic signal in
Antarctic ice cores. Quat. Sci. Rev. 210, 164–174 (2019).
Scientific Reports | (2020) 10:6715 | https://doi.org/10.1038/s41598-020-63339-3 9www.nature.com/scientificreports/ www.nature.com/scientificreports
54. Esper, J., Büntgen, U., Hartl-Meier, C., Oppenheimer, C. & Schneider, L. Northern Hemisphere temperature anomalies during the
1450s period of ambiguous volcanic forcing. Bull. Volcanol. 79, 41 (2017).
55. Schneider, L., Smerdon, J. E., Pretis, F., Hartl-Meier, C. & Esper, J. A new archive of large volcanic events over the past millennium
derived from reconstructed summer temperatures. Environ. Res. Lett. 12, 094005 (2017).
56. Danjon, A. Relation Entre l’Eclairement de la Lune Eclipsée et l’Activité Solaire. L’Astronomie 261–265 (1921).
Acknowledgements
S.G., C.C. and M.S. acknowledge support from the Era.Net RUSplus project ELVECS (SNF project number:
IZRPZ0_164735) and the Sinergia project CALDERA (SNF project number: CRSII5_183571). C.O. is
supported by the NERC Centre for Observation and Modelling of Earthquakes, Volcanoes and Tectonics. F.L.
acknowledges support from an Irish Research Council Starting Laureate Award for the Climates of Conflict in
Ancient Babylonia (CLICAB) project (IRCLA/2017/303), as well as the Irish Research Council “Irish Droughts:
Environmental & Cultural Memories” project (COALESCE/2019/43). S.G. and C.C. are grateful to Séverine Finet
for her help with R-scripts. S.G. acknowledges Prof. Pierre Souyri (University of Geneva, Department of East
Asian Studies) for translating the entries of the Chūyūki diary pertaining to the 1108 CE Mount Asama eruption.
This work benefitted greatly from stimulating discussions with the participants of the Past Global Changes
(PAGES) Volcanic Impacts on Climate and Society (VICS) working group.
Author contributions
S.G., C.C. and M.S. designed the research. S.G and F.L. investigated historical archives. S.G. and C.C produced
the Northern Hemisphere tree-ring based reconstruction. S.G., C.O. and F.L. reanalyzed ice core data from
Greenland and Antarctica. S.G., C.C., F.L., C.O. and M.S. wrote the paper.
Competing interests
The authors declare no competing interests.
Additional information
Supplementary information is available for this paper at https://doi.org/10.1038/s41598-020-63339-3.
Correspondence and requests for materials should be addressed to S.G.
Reprints and permissions information is available at www.nature.com/reprints.
Publisher’s note Springer Nature remains neutral with regard to jurisdictional claims in published maps and
institutional affiliations.
Open Access This article is licensed under a Creative Commons Attribution 4.0 International
License, which permits use, sharing, adaptation, distribution and reproduction in any medium or
format, as long as you give appropriate credit to the original author(s) and the source, provide a link to the Cre-
ative Commons license, and indicate if changes were made. The images or other third party material in this
article are included in the article’s Creative Commons license, unless indicated otherwise in a credit line to the
material. If material is not included in the article’s Creative Commons license and your intended use is not per-
mitted by statutory regulation or exceeds the permitted use, you will need to obtain permission directly from the
copyright holder. To view a copy of this license, visit http://creativecommons.org/licenses/by/4.0/.
© The Author(s) 2020
Scientific Reports | (2020) 10:6715 | https://doi.org/10.1038/s41598-020-63339-3 10You can also read