Hazardous base surges of Taal's 2020 eruption - Nature
←
→
Page content transcription
If your browser does not render page correctly, please read the page content below
www.nature.com/scientificreports
OPEN Hazardous base surges of Taal’s
2020 eruption
A. M. F. Lagmay1,2*, M. I. R. Balangue‑Tarriela1, M. Aurelio1, R. Ybanez1, A. Bonus‑Ybanez2,
J. Sulapas1,2, C. Baldago1, D. M. Sarmiento1, H. Cabria3, R. Rodolfo3,4, D. J. Rafael1,
J. R. Trinidad1, E. Obille Jr.5 & N. Rosell II3
After 43 years of repose, Taal Volcano erupted on 12 January 2020 forming hazardous base surges.
Using field, remote sensing (i.e. UAV and LiDAR), and numerical methods, we gathered primary data
to generate well-constrained observed information on dune bedform characteristics, impact dynamic
pressures and velocities of base surges. This is to advance our knowledge on this type of hazard to
understand and evaluate its consequences and risks. The dilute and wet surges traveled at 50-60 ms−1
near the crater rim and decelerated before making impact on coastal communities with dynamic
pressures of at least 1.7 kPa. The base surges killed more than a thousand livestock in the southeast
of Taal Volcano Island, and then traveled another ~ 600 m offshore. This work is a rare document of
a complete, fresh, and practically undisturbed base surge deposit, important in the study of dune
deposits formed by volcanic and other processes on Earth and other planets.
After 43 years of repose, Taal Volcano erupted on 12 January 2020 forming a 17–21-km high p lume1–3 causing
prolonged widespread disruption to the normal daily activities of surrounding populations. Only one death was
directly attributed to the explosive eruption, the body of a person retrieved under a ~ 1.5 m-thick pyroclastic
deposit on the west coast of Taal Volcano Island (TVI). Another man who failed to evacuate from the island is
still missing4. Considering the sudden and explosive nature of Taal Volcano’s 2020 eruption that generated base
surges, the number of recorded fatalities could have easily been higher.
Base surges are one of the most lethal and destructive hazards of Taal’s historical e ruptions5. Taal Volcano’s
1965 eruption was well-documented by J.G. M oore6,7, who after observations of similar basal flows in nuclear
blasts, coined the word “Base Surge”, a term still used in the volcanological literature and by warning agencies
until today8–10. Base surges are the dilute, wet, and turbulent end-member of Pyroclastic Density Currents
(PDCs), which are gravity-driven flows generated by the collapse and lateral spreading of hot gas particle-laden
mixtures produced during explosive volcanic e ruptions11,12. Base surges form when magma and water interact
during explosive phreatomagmatic e ruptions10,13–18.
The 1911 eruption of Taal Volcano killed 1,335 people19, whereas the 1965 eruption killed 2006. Other eruptive
events, such as in AD1716, AD1731, AD1749, and AD1754, were also described to produce base surges resulting
in thousands of d eaths20. Out of the 34 recorded historical eruptions since AD1572, Taal had six distinct erup-
tions reported to have generated base s urges19,20. Here, we report the seventh distinct eruption of Taal Volcano
that generated base surges. Until the time of this writing, there is no verbal account nor published report on the
occurrence of base surges from Taal Volcano’s 2020 eruption.
The 2020 base surges were accidentally discovered during an ecological expedition on the barren Taal Volcano
Island (TVI) to search for signs of life (i.e. flora and fauna) and clues on how to make the area productive a gain21.
These base surges were mapped in the field with the aid of satellite and drone technologies. Pre-eruption Light
Detection and Ranging (LiDAR) data and post-eruption drone-generated Digital Terrain Models (DTMs) were
used to measure the thickness and estimate the volume of the latest surge deposits of Taal Volcano. The dune field
in the southeast sector offers a rare, largely undisturbed, and nearly complete picture of a base surge deposit field,
which we describe concisely in this article. Often, these deposits are studied as discontinuous outcrops years after
an eruptive event (e.g. Maungataketake, New Zealand; Tungurahua, Ecuador; Taal, Philippines), when erosion,
deposition, and vegetation have obliterated or concealed important features that hinder better understanding
of flow emplacement and d ynamics22–24.
1
UP National Insitute of Geological Sciences, College of Science, University of the Philippines, Diliman, Quezon
City, Philippines. 2UP Resilience Institute and NOAH Center, University of the Philippines, Diliman, Quezon
City, Metro Manila, Philippines. 3Agriculture Sustainability Initiatives for Nature, Inc., Diliman, Quezon City,
Philippines. 4Department of Environmental Science, Ateneo De Manila University, Loyola heights, Quezon City,
Metro Manila, Philippines. 5National Institute for Science and Mathematics Education Development, University of
the Philippines, Diliman, Quezon City, Philippines. *email: aalagmay@up.edu.ph
Scientific Reports | (2021) 11:15703 | https://doi.org/10.1038/s41598-021-94866-2 1
Vol.:(0123456789)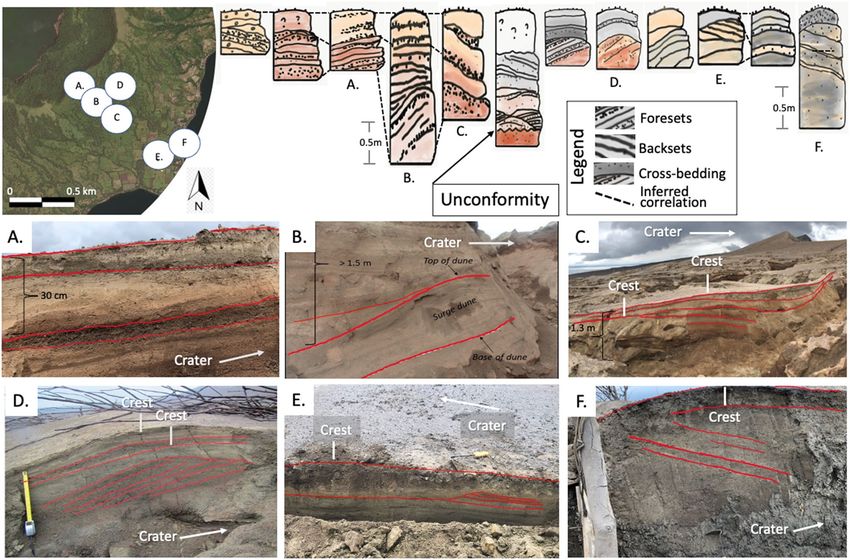
www.nature.com/scientificreports/
Figure 1. Photographs and screenshots of videos of the 12 January 2020 eruption of Taal. (A) Eruption showing
a lateral basal cloud with an estimated fountain height of 360-370 m. Photo by Johnny Alegre (CC-BY SA4.0).
(B) Umbrella cloud and convective regions. Photo by David Comes Lorenzo. (C) Magnified view of base surges
(dilute and “wet” PDCs) forming in the southeast sector of TVI; (D) Dust covering the southeastern slopes of
TVI. Photos C and D by Andres Alisuag.
As one of the 16 Decade V olcanoes25–27 identified by the International Association of Volcanology and Chem-
istry of the Earth’s Interior (IAVCEI), this work on the Taal Volcano 2020 base surges is of particular importance
because of the destructive nature and proximity of the volcano to densely populated areas. The results can also
be used to compare dune deposits formed by volcanic, and other processes on Earth and other p lanets28–30.
Results
Analysis of time‑series imagery and video analysis. The 12 January 2020 eruption of Taal Vol-
cano generated a vertical volcanic eruption column consisting of a gas thrust (jet phase), a convective, and an
umbrella region31. The gas thrust region rose to ~ 130 meters above the Main Crater (MC) rim and is identified
by the region where ballistic volcanic bombs and laterally moving flows (basal clouds) traveling at 50-60 ms−1 are
observed. In the convective region, ingested air continued to expand the plume reducing its density. This caused
the discharging mixture of hot gas and pyroclasts to rise and form a gray-colored column of billowing clouds
that thickened upward. By around 4:00 pm, a north-drifting umbrella cloud is well-formed (Fig. 1), which by
8:00 pm reached a height of 17-21 km1–3 with an E-W diameter of ~ 100 km. The eruption height and umbrella
diameter suggest that the eruption was characterized by mass discharge r ates31,32 in the order of 107 kgs−1 equiva-
lent to a Volcanic Explosivity Index (VEI)=4. Intense activity lasted up to about 10 hours and started to wane in
the morning of 13 January 2020 at about 2:49 am when lava fountaining was observed33. Volcanic activity on 13
January 2020 was characterized by a series of discrete, cannon-like e xplosions34 that were directed towards the
west (see supplementary video).
Thickness and volume. Based on the analysis of pre- and post-2020 eruption DTMs of the southeast sec-
tor of TVI, the base surge deposits of Taal Volcano are thickest on the upper slopes (50–180 m elevation) where
the gradient is on average about 17°. The maximum and average thickness on these slopes are 12 m and 4.7 m,
respectively (Fig. 3). In the middle part of the southeast sector (20–80 m elevation), where the average slope
gradient is 13°, the maximum thickness is 11 m whereas the average thickness is 2.6 m. The lower slopes near the
coast (4–26 m elevation), with an average gradient of 8° have the thinnest deposits with a maximum and average
thickness of 5.8 m and 0.9 m, respectively.
The base surge deposits drape differentially over undulating topography. Deposits are relatively thin at the
crest of hills becoming thicker at their base. This is observed almost everywhere in the dune field except for an
area where there is a conspicuous topographic bulge at the lower half of the upper-slope section (Fig. 3). Upon
closer examination of topographic profiles, this sudden change in relief reflects the frontal edge of an older pre-
2020 PDC deposit draped by new deposits. In this area, dilute PDC deposits are thick at the top of the old deposit
and abruptly become thin downslope of the bulge. Sudden thinning of the deposit downstream of the bulge may
Scientific Reports | (2021) 11:15703 | https://doi.org/10.1038/s41598-021-94866-2 2
Vol:.(1234567890)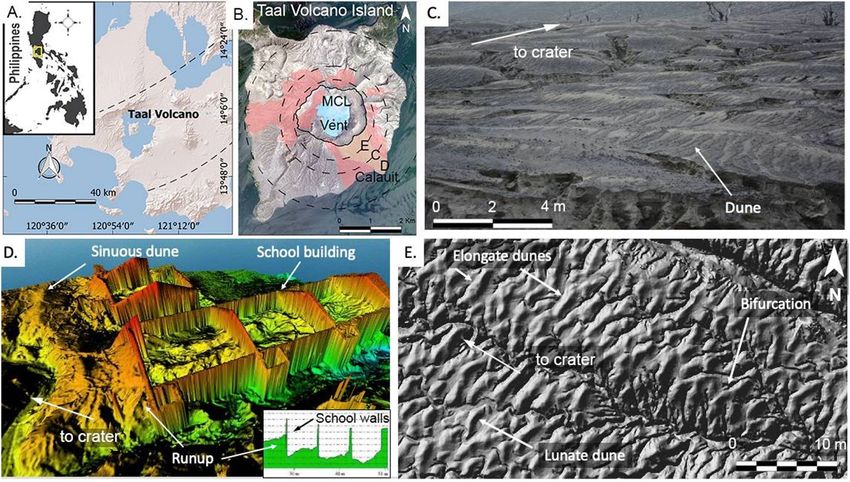
www.nature.com/scientificreports/
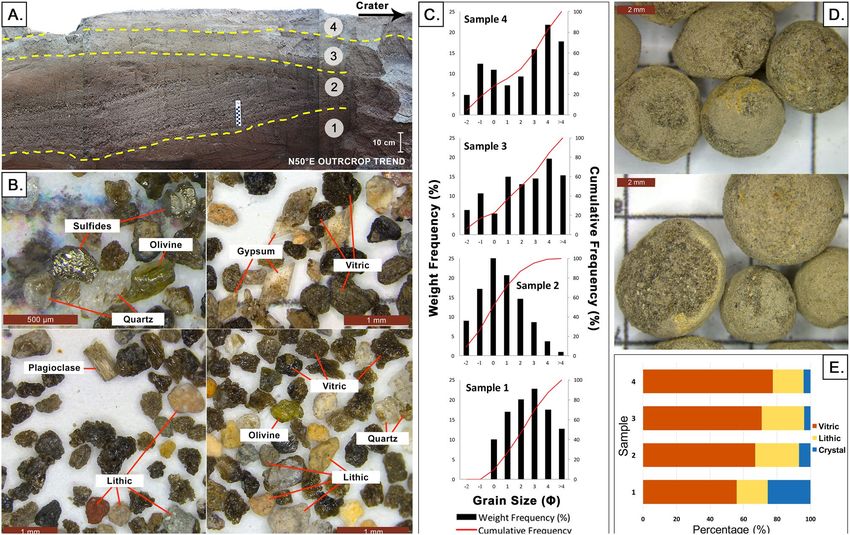
Figure 2. Dunes of TVI. (A) General location of Taal Volcano Island. The area within the dashed lines is
the Macolod Corridor, a 40-km-wide rift z one65. (B) Distribution of the 2020 base surge dunes. Circles refer
to upper slope, middle slope, and lower slope boundaries. Areas with dune forms identified through satellite
imagery are in red. Field validation was done in the southeast flank (yellow portion of map). K3 and ASTI
(“Philippine Copyright 2021 by DOST-ASTI”, includes material (c) KARI 2021, Distribution (SI Imaging
Services, Republic of Korea), all rights reserved. (C) Photograph of the dune field. (D) Digital Surface Model
of school overwhelmed by base surges. Sinuous dunes and runup of the base surge also occur inside the
classrooms. (E) Plan view image of dunes showing elongate and lunate dunes. Bifurcation of dunes is also
shown.
be due to the pre-existing gully that channelled the base surge or air entrainment as the current jumped over the
bulge favoring suspension. In other areas of the lower slopes, base surge deposits become thinner immediately
upon crossing a pre-eruption river channel (Fig. 3). The deposit thickens after a few tens of meters and suddenly
thins out again after another river channel is crossed in the dendritic drainage network of the southeast flank.
The estimated volume of the base surge deposits on TVI, which cover an area of 6.2 million m2 (Fig. 2), is
19 ± 3 million m 3 with a Dense Rock Equivalent (DRE)35 of 10 ±1.6 million m 3. The thickness of the deposit at
the coast is 0.9 m on average, which indicates that the base surges reached the outer lake. Based on the extent
of base surge dunes in the west, our calculations placed the end of the density current in the southeast sector ~
600 m offshore the village of Calauit (see Fig. 2B).
Morphology. Remotely sensed images show the entire TVI covered by light gray tephra. Close-up views
reveal a distinct mottled texture that arises from dune-like forms, typical of base surge deposits6,7. The outlines
of these dunes were delineated manually from the crater rim to the coast of the island on the southeastern and
western slopes. They are also present in areas in the north but do not extend up to the coast of TVI (Fig. 2). There
are no dunes in the southwest slopes because of the high elevation of the main crater rim in the southwest. The
distribution suggests radial spreading of the base surges as a result of column collapse7 with possible contribu-
tion from discrete “cocktail jets”, “radially-overpressured jets” and “eruption slugs”13–15,17,36.
The southeast sector is characterized by a desert-like dune field (Fig. 2) and incised channels from surface
water runoff erosion. The larger incised channels or gullies generally follow pre-eruption drainage whereas the
smaller incised channels are mainly controlled by the dune relief. Larger dunes bear erosion marks that resemble
a trellis drainage pattern that connect to smaller incised channels at the base of and in between dunes. These
smaller incised channels, in turn, connect to larger gullies.
Base surge dunes in the eastern sector of TVI are generally oriented parallel to the southeast crater rim and
are most prominent at mid-slopes. The ratio of dune wave height (0.12–0.80 m) and wavelength (1.1–9.0 m)
scales down towards gentler slopes at low elevations (Fig. 3) with wave height decreasing progressively, which
reflects waning of the density current. The ratios of wave height to wavelength plot partly within the field of
base surges (moist PDCs) in pyroclastic dunes studied worldwide37. This field of moist PDCs in the diagram is
Scientific Reports | (2021) 11:15703 | https://doi.org/10.1038/s41598-021-94866-2 3
Vol.:(0123456789)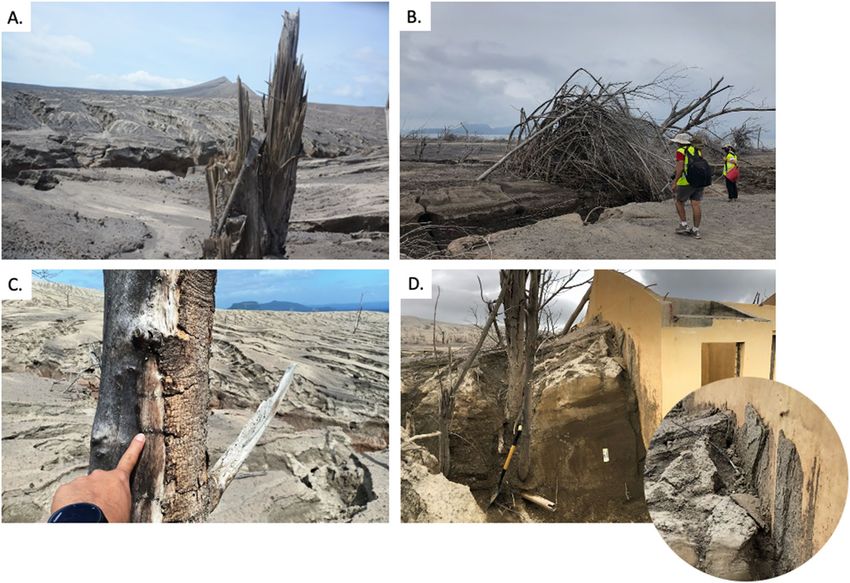
www.nature.com/scientificreports/
Figure 3. (A) Graph of dune waveheight vs wavelength for subaerial dry and moist pyroclastic flows, eolian,
fluvial and aqueous sediment-gravity (epiclastic) flows. Modified from Moorehouse and White (2016) (B)
Thickness of surge deposits in the upper, middle, and lower slopes of the southeast sector of TVI. Profiles also
show dunes with stoss and lee sides at different gradients of underlying slope.
hereby expanded because of the morphometry of dunes in the mid-slopes and those near the coast, which exhibit
smaller wave height to wavelength ratios.
Dunes are asymmetrical with the stoss side invariably shorter than the lee side (Fig. 3). When measured
relative to the horizontal plane, the stoss sides of dunes have gentler slopes compared to their lee sides along
steep slopes of the volcano. Nearer to the coast where the volcano gradient is nearly flat, the stoss side is steeper
than the lee side. However, when stoss and lee angles are measured relative to the dip angle of the underlying
slope, steepness of the stoss is always higher than the lee side of dunes. This observation where the underlying
topography affects the measurement angle of the stoss and lee sides has implications to the study of outcrops of
old dune formations produced by dilute PDCs. When not recognized, this may lead to difficulties in the inter-
pretation of flow direction and formation mechanisms of bedforms22,24,38.
Dune bedforms are mostly elongated with lengths ranging from 3.9 - 12.6 m and are sinuous or lunate in
planform. The bedforms have a mean length of 5.7 m with a standard deviation of 1.9 m. Lunate dunes22 are domi-
nantly crescent-shaped and concave downstream. They are commonly found at the lower slopes whereas sinuous
dunes are more abundant at the middle and upper slopes. Occasional bifurcation of dunes was also observed.
Dune bedforms are not readily apparent in the area a few tens of meters from the crater rim but closer examina-
tion in the field reveals the presence of slight bulges on the surface with underlying cross-bedded structures.
Stratigraphy and componentry. The stratigraphy of the 2020 base surge deposits in southeast TVI is
composed of alternating undulating beds and laminae which are, in general, relatively coarser near the crater
compared to those near the coast (Fig. 5). This suggests that the density currents were losing energy and carrying
capacity as they traveled downslope. When foresets and backsets of beds and laminae of non-uniform thickness
connect, they form dunes. Laterally continuous, horizontal planar beds with equal thickness and well-sorted
components are less pervasive. When present, they may indicate the contribution from fall out of pyroclasts. The
presence of accretionary lapili in almost all of the deposits, plastered deposits on vertical walls, as well as abun-
dance of juveniles and accidental clasts, constitute strong evidence that suggests a wet density current formed
from water-magma interaction10.
The pre-2020 eruption topography is marked by the presence of plant debris. Overlying the unconformity is
a poorly sorted 0.2-m bedded tephra deposit dominated by ash-sized pyroclasts. This bed is overlain by cross-
bedded deposits dominated by lapilli-sized lithic and crystal fragments. Some of the tephra layers show grading,
both normal and reverse. The number of irregularly stacked dunes is variable, ranging from 1-4 dune bed forms
of variable sizes with outcrops in the mid-slope having the most number in a stack. In between stacked dunes
are differential draping beds that fill the trough between laterally adjacent dunes. Laminae composed of poorly-
sorted finer-grained tephra cap the dunes. Overall, there is an increase in the proportion of fine components
in strata towards the top of each outcrop. These stratified beds and laminae of the surge deposits are believed
by many to have formed from numerous explosions that generate particle-laden density currents that vary in
Scientific Reports | (2021) 11:15703 | https://doi.org/10.1038/s41598-021-94866-2 4
Vol:.(1234567890)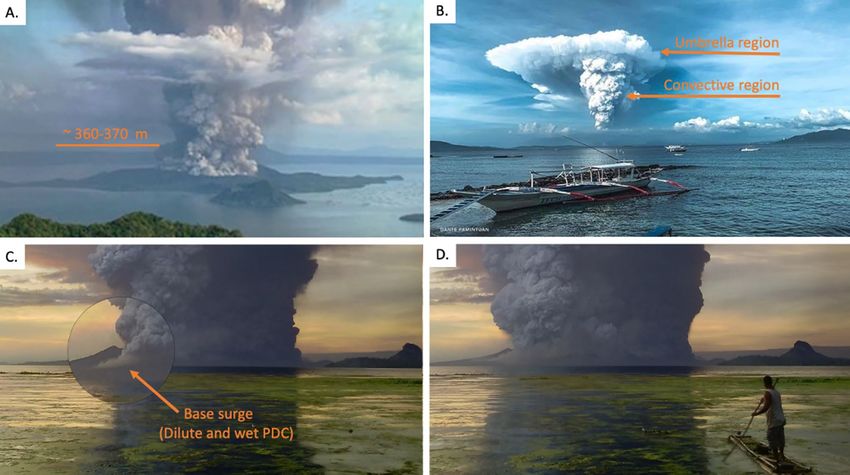
www.nature.com/scientificreports/
Figure 4. (A) Station 1 (14.002304°, 121.008571° Located at Fig. 5D) where samples were collected; (B) Ash
components including vitric, lithic, and crystals (gypsum, olivine, plagioclase, quartz crystals), as well as
secondary quartz and sulfide fragments from the mineralized hydrothermal system; (C) Grain size distribution
graph per sampled layer; (D) Accretionary lapilli found in Samples 3 and 4; (E) Relative abundance of the
components of ash per sample.
velocity during transport38–42. Lastly, the size-frequency distribution in all sampled beds indicates poor sorting
reflective of deposition from a density current. Some beds exhibit a weakly bimodal distribution (Figure 4).
Nearly all sections of dunes have cross-bedded structures with dipping planar beds inclined by about 5°–18°
(Fig. 5). Foresets and backsets in many sections of dunes are typically truncated by overlying strata and are
interpreted as limbs of earlier-formed dunes that were eroded at their crests by succeeding flows. In the lower
slopes, backsets are steeper than foresets whereas in the proximal to medial areas where the underlying slopes are
steeper, the opposite is observed (see discussion on stoss and lee angles above). There is aggradation or regression
in the upstream direction and migration of the crest of stacked dunes towards the crater typical of antidunes
(Fig. 5C,E,F). However, there were two adjacent outcrops beside a gully where migration of the crest of stacked
dunes is toward the downstream direction (Fig. 5D).
Volcanic glass (vitric), lithics, and crystal fragments comprise the base surge beds (Fig. 4C). The vitric com-
ponent is commonly light brown to black, translucent, and exhibits blocky, scoriaceous, and fluted forms. Bub-
ble wall shards with varying vesicularity were observed in some fractions but with dominance of blocky vitric
components suggestive of a phreatomagmatic eruption origin42. Lithic fragments plucked from the wall rock
or conduit, include sub-rounded rock fragments, oxidized grains, as well as hydrothermal fragments such as
those observed in hydrothermal ore deposits (white to yellow in appearance). Pyrogenic crystal components
(e.g. gypsum, olivine, plagioclase, quartz) consist of euhedral to fragmented free crystals, with some still embed-
ded in glassy groundmass, while hydrothermal minerals (e.g. sulfides, quartz) were mostly observed with the
hydrothermal lithics. All samples contain the 3 tephra components, but are generally dominated by volcanic
glass (56%-77%) with varying morphologies. Lithics are composed of 18–26% hydrothermal fragments (e.g
altered volcanic lithics) with an insignificant amount of rock grains. Crystal fragments have the lowest portion
in all the layers (< 25%).
Impacts. Previously vegetated areas in the southeast sector of TVI were reduced to a desert dune field with
fallen trees, ruptured bamboo, and splintered tree trunks (Fig. 6A,B). The unidirectional blowdown was pro-
nounced near large gullies where base surges were funneled. Trees were debarked and sandblasted mainly on the
side facing the main explosion crater with some scorched but not completely turned into charcoal (Fig. 6C). This
suggests that these wet surges were at a minimum temperature of 200° C 43,44. In this part of the island, regrowth
of trees a year after the 2020 eruption is not evident.
Scientific Reports | (2021) 11:15703 | https://doi.org/10.1038/s41598-021-94866-2 5
Vol.:(0123456789)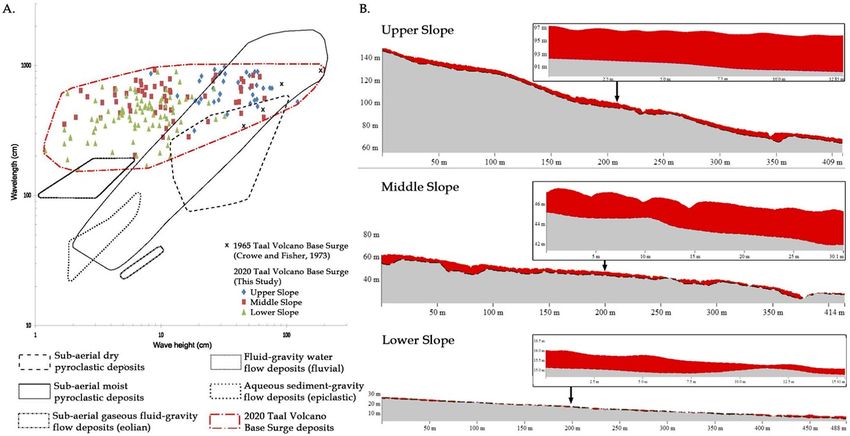
www.nature.com/scientificreports/
Figure 5. Stratigraphy of different dune bedforms in the southeast sector of TVI showing foresets, backsets,
erosional features, curved surfaces, and ballistic fragments on the surface. See locations designated by letters
A–F.
Velocity of the base surges near the crater rim is estimated to be ~ 50–60 ms−1 based on video analysis. When
considering the maximum solution with a 16% exceedance probability as a safety value45,46, calculated dynamic
pressures using PYFLOW_2.0 at the upper slopes (1.3 km from the vent) reflect values typical of a dilute PDC
that can cause light to moderate building damage47, with values ranging from 3.5 kPa over the first 2.5 m (typical
height of a 1-storey house) to 5.2 kPa over the deposit height. The calculated velocities at this location show a
maximum of 48 m s−1 over the deposit height, increasing to 57 ms−1 over a height of 2.5 m.
Downstream, a splintered Ceiba pentrada48 in the lower mid-slopes (Fig. 6A) and a ruptured bamboo located
beside a gully (Fig. 6B) indicate dynamic pressures in excess of 2.1 ± 0.6 kPa and 1.7 ±0.5 k Pa44,49, respectively.
Their equivalent velocities are 40 ± 6 ms−1 and 36 ± 6 ms−1 using a minimum shear flow density of 2.7 kgm−3.
Further downslope, PYFLOW_2.0 estimated a maximum velocity of 14 ms−1 near the coast (2.2 km from the
vent). The computed velocities show a decreasing trend from the crater to the coast. These velocities are con-
sistent with estimates using the energy-line m ethod50–52 and show deceleration despite a concave upward slope
53
profile of Taal Volcano.
Buildings along the coast had collapsed roofs made of galvanized iron sheets and were buried by about 1-2
m of base surge deposits. Some areas were plastered by vertically-oriented and bedded muddy coating (Fig. 6D).
Scattered ballistic projectiles, mainly composed of scoria bombs and minor altered lithic fragments, are found
on the surface of the surge deposit field. They range from lapilli- to block-sized clasts with scoria bombs decreas-
ing in size towards the coast. Multiple base surge flows impacted the community based on evidence of stacked
dune bedforms. Temperatures were also significantly high to scorch trees in the community and can be lethal.
Lastly, even at low temperatures and dynamic pressures, prolonged exposure to inhalable hot fine ash reduces
the chance of s urvival54.
Discussion
Base surges are considered as a main hazard of Taal Volcano. Mobile and water vapor-rich, they can travel at
s−1 and bury everything in their p
velocities greater than 30 m ath7,8. This work provides primary data and observed
information, useful to advance our understanding of base surges and evaluating consequences and risks of such
eruptions17,55.
The 17–21 km-high phreatomagmatic eruption of Taal in 2020 has equivalent mass discharge rates in the
order of 107 kgs−1 with VEI=4. Base surges spread radially on the island from fountain collapse heights31 of ~
360-370 m based on detailed analysis of photographs. A total base surge volume of 19 ±3 million m3 was depos-
ited on the island beginning late afternoon, which most likely continued for another 10 hours based on peak
Scientific Reports | (2021) 11:15703 | https://doi.org/10.1038/s41598-021-94866-2 6
Vol:.(1234567890)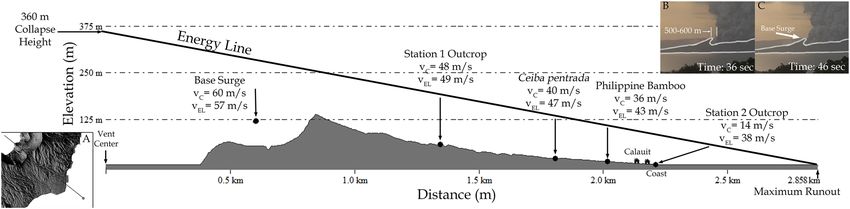
www.nature.com/scientificreports/
Figure 6. Photos of the effect of base surges on the southeast portion of TVI. (A) Snapped and splintered
tree trunk of Ceiba pentrada with trunk diameter ~ 0.5 m; (B) Ruptured bamboo (Culm diameter = 12 cm);
(C) Scorched and debarked tree on the side facing the crater; (D) Base surge deposit run-up against school
wall facing the crater. Inset photo shows plastered base surge deposits. This unique feature of pasty materials
persistently sticking on walls is proposed to be called “ludite”.
activity as reviewed from official bulletins and seismic records. Topographic lows in the southeast and west of
the MC rim allowed base surges to reach coastal areas extending ~ 600 m offshore the village of Calauit in the
southeast sector of TVI.
A total of 480 families in Calauit were lucky to have evacuated the village hours before it was completely
overwhelmed by lethal and destructive base surges. Unfortunately there was not enough lead time to evacuate
480 cattle, 270 horses, 70 carabaos, 276 goats, and more than a thousand swine and poultry56. All were declared
in the livestock mortality report submitted to the Department of Agriculture.
Dunes characterize the base surge deposits on TVI. These elongated and sinuous mounds are perpendicular
to sub-perpendicular to the direction of the density current as checked against the orientation of the blowdown
of trees. Wave height to wavelength ratios of dunes partially plot in the moist PDC field of those studied world-
wide. The unique morphometry of dunes in the mid-slopes and those nearer the coast, exhibiting smaller wave
height to wavelength ratios, extends the field of moist PDCs. Dune profiles exhibit both progressive and regres-
sive migration of dune crests, eroded foresets and backsets, cross stratification, pinch and swell draping, and
other sedimentary structures that provide a rich source of information that can contribute to the discussions on
the flow regime and emplacement of pyroclastic density currents based on bedform c haracteristics22–24,39,44,57–60.
Dynamic pressure and velocity estimates based on video analysis, numerical simulations, and impact calcu-
lations for broken and splintered Ceiba pentrada48 and ruptured bamboo, show a decreasing trend from 50–60
ms−1 from the crater to 48 m s−1 in the upper middle slopes to 36–40 m s−1 near the gullies of lower slopes to
14 ms−1 near the coast. Structural impacts of these dynamic pressures on the village of Calauit were enough to
destroy windows but not topple the walls of 1-storey buildings made of reinforced (steel bars) concrete walls.
The sequence of deposits suggests that the roof of houses collapsed due to tephra accumulation prior to the
arrival of base surges. Lastly, computed velocities are generally consistent with estimates using the energy line
model50–52 and the base surges decelerated from the crater rim to the coast (Figure 7). This is inconsistent with
the models expected for a volcano with a concave upward slope profile like Taal Volcano, where acceleration is
first to be expected before deceleration53.
Scientific Reports | (2021) 11:15703 | https://doi.org/10.1038/s41598-021-94866-2 7
Vol.:(0123456789)www.nature.com/scientificreports/
Figure 7. Projection of energy line model along the southeast profile of Taal Volcano Island where observation
and calculation points for velocity are located from the vent center to the projected maximum runout distance.
Velocities calculated using different methods (vC) and velocities calculated using the energy line model (vEL)
for each of the four observation points are shown. (A) Location of southeast profile and observation points. (B)
Image from timelapse video at 36 seconds showing 500–600 m open area within the southeast inner crater. (C)
Image from time-lapse video at 46 seconds showing the area from B being covered by a moving base surge.
Methodology
Review of images and videos. Hundreds of photos taken by residents around Taal Lake, weekend tourists
and passengers of commercial airplanes were reviewed to determine the type of eruption that took place on 12
January 2020 and 13 January 2020. Time-lapse videos taken by the authors on 13 January from Tagaytay, north
of TVI, were also reviewed. Analysis of the photos include the delineation of low areas of the MCL crater rim and
possible overflow by PDCs above the rim. The fountain collapse height, Hf , was measured from photographs to
be around 130 m high from the eastern ridge of the TVI. We added the 235-m depth of the crater floor, which is
4 m above sea level, to come up with an Hf range of 360–370 m that accounts for inaccuracies in estimation. This
estimate is consistent with the expected range of fountain collapse heights according to Sparks (1997)31 given a
discharge rate that corresponds to the 17–21 km plume height1–3 of Taal Volcano’s 2020 eruption.
Available LiDAR DTMs for the whole island was used to delineate the pre-2020 topography of T VI61 and
for the thickness analysis of newly-formed base surge deposits. The DTMs were also used to measure the dune
dimensions.
Field work and sample collection. Field surveys were conducted on January 30 and February 13, 2021, a
little over a year after the eruption of Taal Volcano. Targeted areas in the 2-day fieldwork of the southeast portion
of TVI were based on the analysis of photographs and remotely sensed imagery. Tephra was sampled in-situ in
different areas of the survey site using a container with fixed volume. These samples were then weighed in the
laboratory for calculation of the bulk density of the base surge deposit, which was in turn used for the conversion
of the base surge tephra volume estimate to DRE volume using the following equation:
Tephra Volume ∗ Tephra Density
DRE = (1)
Magma Density
where magma density used is 2700 k gm−3 (basaltic andesite magma), and tephra density is 1,425 k gm−3.
Descriptions of the tephra stratigraphy were conducted along exposures in rills (≤ 1 m deep) and gullies (3–7
m deep) at the southeast flank of the volcano. Sections were scraped to expose the stratigraphy. Dunes were also
scraped perpendicular to the elongation axis of mounds to expose internal structures.
Grain size and componentry analysis. At least 500 g to 1 kg of samples were collected per layer in the
field to determine the size distribution of ash from individual layers. Grain size analyses were conducted with
manual sieving. Cone and quartered samples were dried overnight at 60C to eliminate moisture. Sieving was
performed using U.S.A. Standard Test Sieves ASTM E-11-2062 in the National Institute of Geological Sciences,
University of the Philippines. Lithic, crystal, and vitric components were identified and described using a ster-
eomicroscope, counting at least 1200 grains per sample.
DEMs from Drones. A DJI Mavic Pro unmanned-aerial-vehicle (UAV) was used to obtain aerial imagery of
parts of the southeastern sector of TVI. Selected regions of interest in the southeast sector were pre-programmed
for mission flight paths covering areas of interest such as drainage, base surge dunes, and communities believed
to have been ovewhelmed by dilute PDCs. Sequential photos along the flight path were collected with 60% over-
lap to generate orthomosaic images, point-clouds, and DSMs.
Estimates of dynamic pressure and velocities. Dynamic pressures for the broken and splintered Ceiba
pentrada (r = 25 cm, σult = 29,600 kPa48, ho = 25 m) and the ruptured bamboo (r = 6 cm, σult = 150,600 kPa63, ho
= 15 m) were calculated using the following49:
Scientific Reports | (2021) 11:15703 | https://doi.org/10.1038/s41598-021-94866-2 8
Vol:.(1234567890)www.nature.com/scientificreports/
1 πr 2 σult
Pdyn = (2)
4 CD h2o
where Pdyn is the dynamic pressure, r is the radius of the tree, σult is the yield strength, CD (1.1) is the coefficient
of drag, and ho is the estimated height of the trees.
Probability density functions of flow properties and impact parameters (e.g. velocity, density, dynamic pres-
sure, rate and time of deposition) were solved based on the grain size and componentry analysis at two of the
sampled outcrops (Station 1: 14.002304°, 121.008571° and Station 2: 13.99353°, 121.0119°) using PYFLOW_2.064.
The program reports the average (corresponding to 50th percentile), minimum (16th percentile), and maximum
(84th percentile) solutions of each fluid dynamic variable. Values reported at specific heights are the maximum
solutions with a 16% exceedance probability, considered here as a “maximum safety” value45,46. Using the dynamic
pressures previously calculated and a minimum shear flow density of 2.7 k gm−3 computed by PYFLOW_2.0 at
Station 2, the flow velocities at the location of the Ceiba pentrada and the ruptured bamboo were calculated with:
1 2
Pdyn = ρv (3)
2
where ρ is the density and v is the velocity.
Energy‑line velocities. The mobility ratio (H/L) was calculated based on the observed collapse height (H
= 360 m) from the time-lapse video whereas the run-out distance (L = 2,858 m) was measured from the center
of the vent to the farthest extent of the dunes observed towards the coast. The resulting mobility ratio was plot-
ted on a log-normal relationship showing the PDC‘s volume and mobility with 95% confidence and prediction
limits50.
The maximum potential velocity of PDCs (Eq. 4)50–52 was derived based on the projected energy line model
from the eruptive center of TVI.
1
v = (2g�h) 2 (4)
where v is the velocity, g is the acceleration due to gravity and h is the vertical distance between energy line and
the ground surface. Points where velocity was observed or calculated using other methods were then plotted
along the energy line profile to compare the resulting potential velocities from the energy line model (Fig. 7).
Limitations. Only deposits in the southeastern areas of TVI are described in this paper with what can be
accomplished in the span of two days of fieldwork with Alert Level 1 (Abnormal) hoisted over the entire Taal
Volcano Island and Covid-19 modified quarantine restrictions still in place.
Data availability
The datasets used and analysed in this study are available on Google Drive at https://tinyurl.com/z74usc32. Use
of the datasets can be cited as follows: “Lagmay et al., 2021 (this paper)”. The pre-eruption LiDAR DEM is openly
available on DOST-Project NOAH’s Phil-LiDAR online portal: https://phillidar-dad.github.io/taal-open-lidar.
html.
Received: 2 April 2021; Accepted: 15 July 2021
References
1. PTCC. Are you affected? (1991). https://fb.watch/4mw1qqclqI/.
2. Perttu, A. et al. Estimates of plume height from infrasound for regional volcano monitoring. J. Volcanol. Geotherm. Res. 402, 106997
(2020).
3. Bachmeier, S. Eruption of the Taal Volcano in the Philippines CIMSS Satellite Blog (2020). https://cimss.ssec.wisc.edu/satellite-
blog/archives/35406.
4. Cinco, M. Man found dead on Taal’s volcano Island (2020). https://n ewsin
fo.i nquir er.n
et/1 22925 2/m
an-f ound-d
ead-o
n-t aals-v olca
no-island.
5. PHIVOLCS. Taal Volcano profile, In: Compilation of Eruptive History and Geology of Taal Volcano. Technical Report, PHIVOLCS-
Library (1991).
6. Moore, J. G., Nakamura, K. & Alcaraz, A. The 1965 eruption of taal volcano. Science 151, 955–960 (1966).
7. Moore, J. Base surge in recent volcanic eruptions. Bull. Volcanol. 30, 337 (1967).
8. Hickson, C. J. Base Surge 41–42 (Springer, 2013). https://doi.org/10.1007/978-1-4020-4399-4_22.
9. PHIVOLCS. Summary of barangays susceptible to volcano base surge (2020). www.phivolcs.dost.gov.ph/vault/pdf/News/2020/
BarangaysAtRiskTaal.BaseSurge-Buffer.pdf.
10. Nemeth, K. & Kosik, S. Review of explosive hydrovolcanism. Geosciences 10, 44 (2020).
11. Druitt, T. H. Pyroclastic density currents. Geol. Soc. 145, 145–182 (1998).
12. Roche, O., Philips, J. & Karim, K. Pyroclastic Density Currents. In Fagents, S., Gregg, T. K. & Lopes, R. M. (eds.) Modeling Volcanic
Processes (The Physics and Mathematics of Volcanism), chap. 10, 203–229 (Cambridge University Press, Cambridge England,
2013).
13. Mastin, L. & Witter, J. The hazards of eruptions through lakes and seawater. J. Volcanol. Geotherm. Res. 97, 195–214 (2000).
14. Belousov, A. & Belousova, M. Eruptive processes effects and deposits of the 1966 and the ancient basaltic phreatomagmatic erup-
tions in karymskoye lake, kamchatka, russia. Spec. Publ. Int. Assoc. Sedimentol. 30, 35–60 (2001).
15. Nemeth, K., Cronin, S., Charley, D., Harrison, M. & Garae, E. Exploding lakes in Vanuatu; “Surtseyan-style” eruptions witnesed
on Ambae Island. Episodes 2006, 87–92 (2007).
Scientific Reports | (2021) 11:15703 | https://doi.org/10.1038/s41598-021-94866-2 9
Vol.:(0123456789)www.nature.com/scientificreports/
16. Dellino, P., Isaia, R., La Volpe, L. & Orsi, G. Interaction between particles transported by fallout and surge in the deposits of the
Agnano-Monte Spina eruption (Campi Flegrei, Southern Italy). J. Volcanol. Geoth. Res. 133, 193–210 (2004).
17. Brand, B. et al. A combined field and numerical approach to understanding dilute pyroclastic density current dynamics and hazard
potential: Auckland volcanic field, new zealand. J. Volcanol. Geotherm. Res. 276, 215–232 (2014).
18. Dufek, J., Esposti, O. T. & Roche, O. Chapter 35-pyroclastic density currents: processes and models. In Sigurdsson, H. (ed.) The
Encyclopedia of Volcanoes, 2nd edn, 617–629 (Academic Press, 2015). https://www.sciencedirect.com/science/article/pii/B9780
123859389000353.
19. Saderra, M. M. The Eruption of Taal Volcano. Bureau of Printing Manila Philippines (1911).
20. Delos, R. P. J. et al. A synthesis and review of historical eruptions at Taal Volcano, Southern Luzon, Philippines. Earth Sci. Rev.
177, 565–588 (2018).
21. Stoye, E. Tardigrade circus and a tree of life-January’s best science images. Nature (2021). https://www.nature.com/immersive/
d41586-021-00095-y/index.html.
22. Douillet, G. A. et al. Dune bedforms produced by dilute pyroclastic density currents from the august 2006 eruption of tungurahua
volcano, ecuador. Bull. Volcanol. 75, 1–20 (2013).
23. Douillet, G. A. et al. Pyroclastic dune bedforms: macroscale structures and lateral variations examples from the 2006 pyroclastic
currents at tungurahua (ecuador). Sedimentology 66, 1531–1559 (2019).
24. Smith, G. et al. A bedform phase diagram for dense granular currents. Nat. Commun. 11, 1–11 (2020).
25. Barberi, F. et al. (1990) Reducing volcanic disasters in the 1990’s. Bull. Volcanol. Soc. Japan 35(1), 80–95 (1990).
26. Torres, R. & Punongbayan, R. Attention focuses on Taal: decade volcano of the Philippines. EOS 76(24), 241–247 (1995).
27. Cas, R. IAVCEI: from small beginnings to a Vibrant International Association. Hist. Geo Space Sci. 10, 181–192 (2019).
28. Thomas, P. C. et al. Bright dunes on Mars. Nature 397, 592–594 (1999).
29. Jackson, D. W., Bourke, M. C. & Smyth, T. A. The dune effect on sand-transporting winds on Mars. Nat. Commun. 6, 1–5 (2015).
30. Smith, K. T. Ghost dunes spotted on mars. Science 361, 376–377 (2018).
31. Sparks, R. et al. Volcanic Plumes (Wiley, 1997).
32. Constantinescu, R. et al. The radius of the umbrella cloud helps characterize large explosive volcanic eruptions. Commun. Earth
Environ. 2, 1–8 (2021).
33. PHIVOLCS. Taal Volcano eruption update 13 January 2020 04:00 PM (2020). https://www.phivolcs.dost.gov.ph/index.php/taal-
volcano-bulletin-menu/9633-eruption-update-for-taal-volcano-13-januar y-2020-04-00-pm.
34. Self, S., WIlson, L., & Nairn, I. A. Vulcanian eruption mechanisms. Nature 277, 440–443 (1979).
35. Crosweller, H. S. et al. Global database on large magnitude explosive volcanic eruptions (lameve). J. Appl. Volcanol. 1, 1–13 (2012).
36. Dellino, P. et al. Conduit flow experiments help constraining the regime of explosive eruptions. J. Geophys. Res. Solid Earth 115,
8369 (2010).
37. Moorhouse, B. L. & White, J. D. Interpreting ambiguous bedforms to distinguish subaerial base surge from subaqueous density
current deposits. Depos. Rec. 2, 173–195 (2016).
38. Cole, P. Migration direction of sand-wave structures in pyroclastic-surge deposits: implications for depositional processes. Geology
19, 1108–1111 (1991).
39. Fisher, R. V. & Waters, A. C. Base surge bed forms in Maar volcanoes. Am. J. Sci. 268, 157–180 (1970).
40. Schminke, H.-U., Fisher, R. V. & Waters, A. C. Antidune and chute and pool structures in the base surge deposits of the Laacher
See area. Germany. Sedimentology 20, 553–574 (1973).
41. Sigurdsson, H., Carey, S. & Fisher, R. The 1982 eruptions of El Chichon Volcano, Mexico: the physical properties of pyroclastic
surges. Bull. Volcanol. 49, 467–488 (1987).
42. Cas, R. & Wright, J. Volcanic Successions: Modern and Ancient (Allen and Unwin, 1987).
43. Browne, F. Theories on the combustion of wood. Technical Report, Madison, Wis.: U.S. Department of Agriculture, Forest Service,
Forest Products Laboratory (1958).
44. Brand, B. & Clarke, A. An unusually energetic basaltic phreatomagmatic eruption: using deposit characteristics to constrain dilute
pyroclastic density current dynamics. J. Volcanol. Geoth. Res. 243, 81–90 (2012).
45. Dellino, P., Mele, D., Sulpizio, R., La Volpe, L. & Braia, G. A method for the calculation of the impact parameters of dilute pyroclastic
density currents based on deposit particle characteristics. J. Geophys. Res. Solid Earth 113, 5987 (2008).
46. Mele, D. et al. Hazard of pyroclastic density currents at the Campi Flegrei Caldera (Southern Italy) as deduced from the combined
use of facies architecture, physical modeling and statistics of the impact parameters. J. Volcanol. Geoth. Res. 299, 35–53 (2015).
47. Baxter, P. J. et al. The impacts of pyroclastic surges on buildings at the eruption of the soufriere hills volcano, montserrat. Bull.
Volcanol. 67, 292–313 (2005).
48. Green, D., Winandy, J. & Kretschmann, D. Wood Handbook-Wood as an Engineering Material (U.S. Department of Agriculture,
1999).
49. Clarke, A. & Voight, B. Pyroclastic current dynamic pressure from aerodynamics of tree or pole blow-down. J. Volcanol. Geoth.
Res. 100, 395–492 (2000).
50. Toyos, G., Cole, P. D., Felpeto, A. & Marti, J. A GIS-based methodology for hazard mapping of small volume pyroclastic density
currents. Nat. Hazards 41, 99–112 (2007).
51. Tierz, P. et al. Suitability of energy cone for probabilistic volcanic hazard assessment: validation tests at somma-vesuvius and campi
flegrei (italy). Bull. Volcanol. 78, 1–15 (2016).
52. Tierz, P. et al. Uncertainty assessment of pyroclastic density currents at mount vesuvius (italy) simulated through the energy cone
model. Nat. Hazard Uncertain. Assess. 223, 125–145 (2016).
53. Valentine, G., Doronzo, D., Dellino, P. & de Tullio, M. Effects of volcano profile on dilute pyroclastic density currents: numerical
simulation. Geology 39, 947–950 (2011).
54. Dellino, P., Dioguardi, F., Isaia, R., Sulpizio, R. & Mele, D. The impact of pyroclastic density currents duration on humans: the case
of the AD 79 eruption of Vesuvius. Sci. Rep. 11, 1–9 (2021).
55. Cole, P. D., Neri, A. & Baxter, P. J. Hazards from pyroclastic density currents. In The Encyclopedia of Volcanoes, 943–956 (Elsevier,
2015).
56. Robles, R. & Robles, T. Initial Visit to Jowivil Crater View Subdivision Balete, Batangas. Technical Report, First Asia Institute of
Technology and Humanities (2020).
57. Fisher, R. Bed forms in base-surge deposits: Lunar implications. Am. J. Sci. 26, 1349–1352 (1969).
58. Waters, A. C. & Fisher, R. V. Base surges and their deposits: Capelinhos and taal volcanoes. J. Geophys. Res. 76, 5596–5614 (1971).
59. Crowe, B. M. & Fisher, R. V. Sedimentary structures in base-surge deposits with special reference to cross-bedding, Ubehebe
Craters, Death Valley, California. Geol. Soc. Am. Bull. 84, 663–682 (1973).
60. Cole, P. & Scarpati, C. A facies interpretation of the eruption and emplacement mechanisms of the upper part of the Neapolitan
Yellow Tuff, Campi Flegrei, Southern Italy. Bull. Volcanol. 55, 311–326 (1993).
61. UP TCAGP & PHIL-LiDAR Program. LiDAR map of Taal Volcano (2020). https://phillidar-dad.github.io/taal-open-lidar.html.
62. International ASTM. Standard Specification forWoven wire Test Sieve Cloth and Test Sieves. Technical Report, ASTM International,
West Conshocken (2014).
63. Bamboo Import. Mechanical Properties of Bamboo (2021). https://www.bambooimport.com/en/blog/what-are-the-mechanical-
properties-of-bamboo.
Scientific Reports | (2021) 11:15703 | https://doi.org/10.1038/s41598-021-94866-2 10
Vol:.(1234567890)www.nature.com/scientificreports/
64. Dioguardi, F. & Mele, D. Pyflow 2.0: a computer program for calculating flow properties and impact paramters of past dilute
pyroclastic density currents based on field data. Bull. Volcanol. 80(28), 1–16 (2018).
65. Förster, H., Oles, D., Knittel, U., Defant, M. J. & Torres, R. C. The macolod corridor: a rift crossing the philippine island arc. Tec-
tonophysics 183, 265–271 (1990).
Acknowledgements
The authors would like to thank the First Asia Institute of Technology and Humanities (FAITH) Colleges, FAITH
Botanic Gardens Foundation (FBGF), and the local government units of Balete, Batangas for collaborating and
facilitating access to the southeast sector of Taal Volcano Island. This work was funded by the University of the
Philippines System through the UP Resilience Institute project “Pandemics, Compound Disasters, and Other
Complex Emergencies” and the UP National Institute of Geological Sciences. We would also like to thank Car-
mille Marie Escape for assisting in digitizing grains for measurement, and the eight brave souls who retrieved a
crashed drone containing invaluable flight data.
Author contributions
All authors participated in the field investigation and writing the manuscirpt.
Competing interests
The authors declare no competing interests.
Additional information
Supplementary Information The online version contains supplementary material available at https://doi.org/
10.1038/s41598-021-94866-2.
Correspondence and requests for materials should be addressed to A.M.F.L.
Reprints and permissions information is available at www.nature.com/reprints.
Publisher’s note Springer Nature remains neutral with regard to jurisdictional claims in published maps and
institutional affiliations.
Open Access This article is licensed under a Creative Commons Attribution 4.0 International
License, which permits use, sharing, adaptation, distribution and reproduction in any medium or
format, as long as you give appropriate credit to the original author(s) and the source, provide a link to the
Creative Commons licence, and indicate if changes were made. The images or other third party material in this
article are included in the article’s Creative Commons licence, unless indicated otherwise in a credit line to the
material. If material is not included in the article’s Creative Commons licence and your intended use is not
permitted by statutory regulation or exceeds the permitted use, you will need to obtain permission directly from
the copyright holder. To view a copy of this licence, visit http://creativecommons.org/licenses/by/4.0/.
© The Author(s) 2021
Scientific Reports | (2021) 11:15703 | https://doi.org/10.1038/s41598-021-94866-2 11
Vol.:(0123456789)You can also read