THE STATE OF HATE INDEX - ROBERT TYNES A BARD CENTER FOR THE STUDY OF HATE PUBLICATION
←
→
Page content transcription
If your browser does not render page correctly, please read the page content below
1
Music from China: East Meets West

                                    THE
                                    STATE
                                    OF
                                    HATE
                                    INDEX
                                    ROBERT TYNES

                                    A BARD CENTER FOR THE
                                    STUDY OF HATE PUBLICATION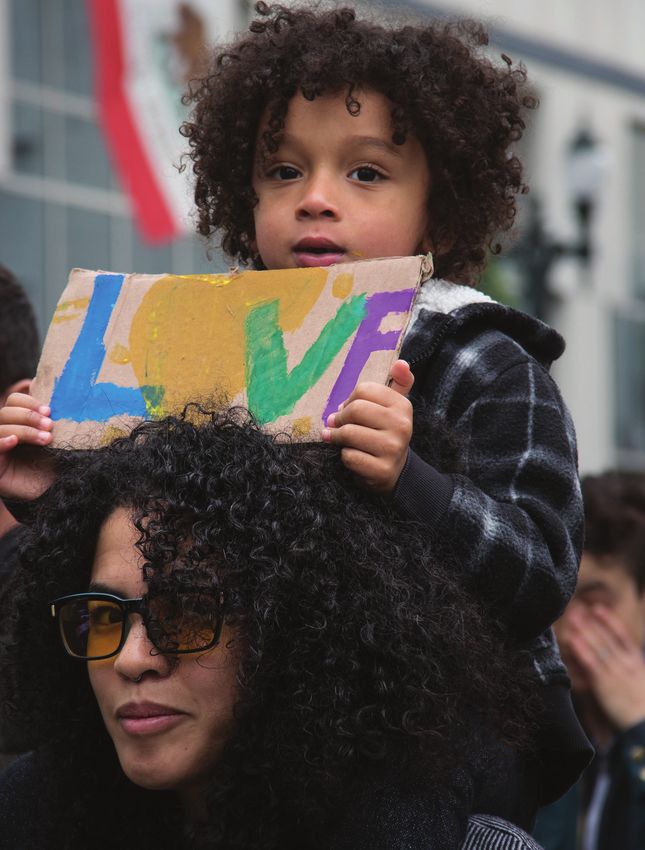
PREFACE
Kenneth S. Stern
Director, Bard Center for the Study of Hate
The Bard Center for the Study of Hate (BCSH) is honored to support the production and promotion
of Robert Tynes’s groundbreaking THE STATE OF HATE INDEX.
The demonization and/or dehumanization of others is a larger phenomenon than just how many
swastikas are drawn on synagogues or people attacked for who they are perceived to be. Sometimes
hate is normative and not expressed viscerally, at times through laws that exclude people from civil
rights and other protections based simply on who they are or who they love. Sometimes we see data
about the various specific phenomena that reflect hate, but the data are usually incomplete and siloed.
What Tynes directs us to do is think more broadly. What are the various factors in each state that can
be quantified to give us information about hate writ large, and the chances people will encounter it?
We hope this landmark study will spur others to replicate this type of approach. One might quibble
about which factors are included (or not included), and the relevant weights one data set or another
is given. But the larger frame is the major contribution of Tynes’s approach—to see hate as a
combination of factors operating simultaneously in a defined geographic area.
We also hope that human rights communities, legislators, business and religious leaders, and others
in states toward the bottom of this Index will use this study to advocate changes that can improve the
lives of their neighbors. Law can be amended or adopted, and practices improved, that can reduce the
quantity of hate. Tynes’s Index is a guidepost of what changes should be considered.
BCSH thanks GS Humane Corporation for understanding the importance of this project and
underwriting it, and Bard colleagues and others who reviewed the text, and helped design and
promote it.
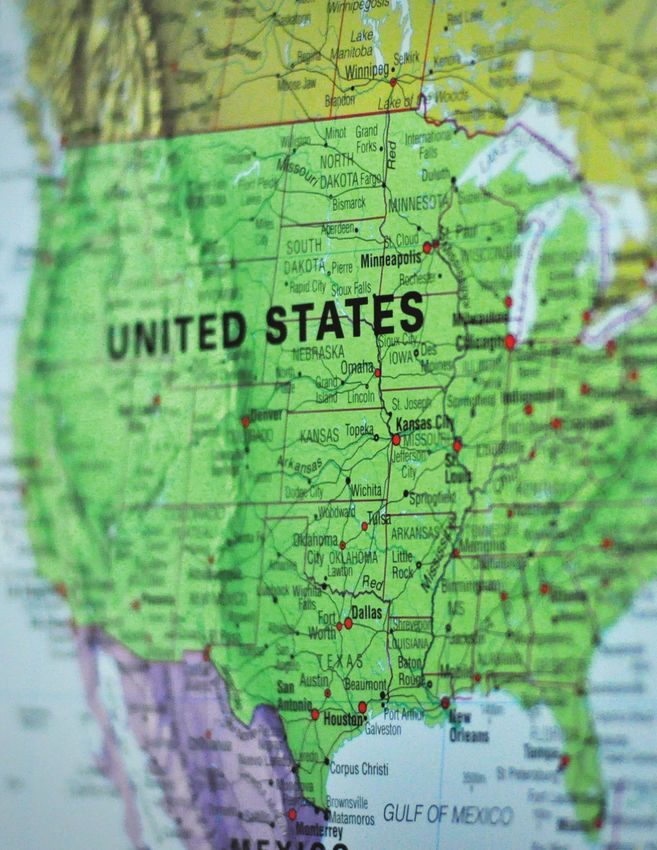
United States map, Will Dendis. CC BY 2.0 The State of Hate Index 3
THE STATE OF HATE INDEX
Robert Tynes1, Bard College2
Hate is not the status quo. Whenever hate arises as a motivation for violence, we are witnessing a break in
what is normal. The fallout is not simply emotional. The end result can be damage to property, to bodies,
and to entire groups of people. The State of Hate Index (SoHI) is an initial sketch of the potential for hate-
based violence3 in a given region. The goal is to map out where hate, and the possibility of hate-based
harm, is more prominent. SoHI examines how hate manifests, and is constrained, in the 50 states of the
United States, looking at multiple indicators in order to suggest when hate might be more likely to occur.4
Think of it as an expansion of Victor Hugo Green’s idea for the Negro Motorist Green Book. For 30
years, starting in 1936, Green published a guide for African Americans who were traveling across
the United States. The book listed motels, restaurants, and gas stations that were friendly to African
Americans—places in which they could take refuge from racist whites while driving across America.5
Green’s guide was similar to the Jewish travel guides of the 1930s that mapped out the more
hospitable places to be in the Catskills.6 The State of Hate Index takes a broader view, pulling back to
the state level and providing the general landscape for hate across America.
Discourse in the media and among public opinion leaders often ascribe stereotypical depictions of parts
of the country as more racist, or less friendly to Lesbian, Gay, Bisexual, Transgender, Queer/Questioning,
and other gender identities (LGBTQ+). The South is often described as racist because of the legacy of
slavery. New York has been portrayed as a gay Mecca, due to its annual Gay Pride Parade and the legacy
of the Stonewall Uprising. These oversimplifications are deceptive though, providing mostly fear and
threat rather than empirical reality. The State of Hate Index is hopefully one step toward reality.
The United States includes a wide range of social groups and norms across vast landscapes. Trying
to partition off where hate clusters within that terrain is not easy. States, however, are a valid starting
point, as we find a combination of social groups (ethnicity, gender, class, etc.) interacting with
structured limitations—laws and policies. Driving across the border from Nevada to Idaho means
losing significant legal protections if you are LGBTQ+. Political lines on a map do matter when it
comes to hate. Sociologists (Bourdieu, Wacquant, and Farage 1994) emphasize how this dynamic is
common when human bodies enter and leave different fields of contention. They note that political
boundaries create power dynamics and increase threat: “The construction of the state monopoly over
physical and symbolic violence is inseparable from the construction of the field of struggles of the
monopoly over the advantages attached to this monopoly” (pp. 16–17).7
Further, such a construction also determines who counts as human: “The political field is the field par
excellence for the exercise of symbolic capital; it is a place where to exist, to be, is perceived.” (p. 192,
Bourdieu 2014). For SoHI, hate is defined as “the human capacity to define, and then dehumanize or
demonize, an ‘other’. . . ” (p. 11, Stern 2004), so that crossing state lines has the potential to humanize
or dehumanize, to determine if you exist or not. This is the implication explored by the Index, one that
groups of people who are discriminated against feel in their bones, while those who have not been
persecuted due to ethnicity, gender, class, etc., barely notice, if at all.
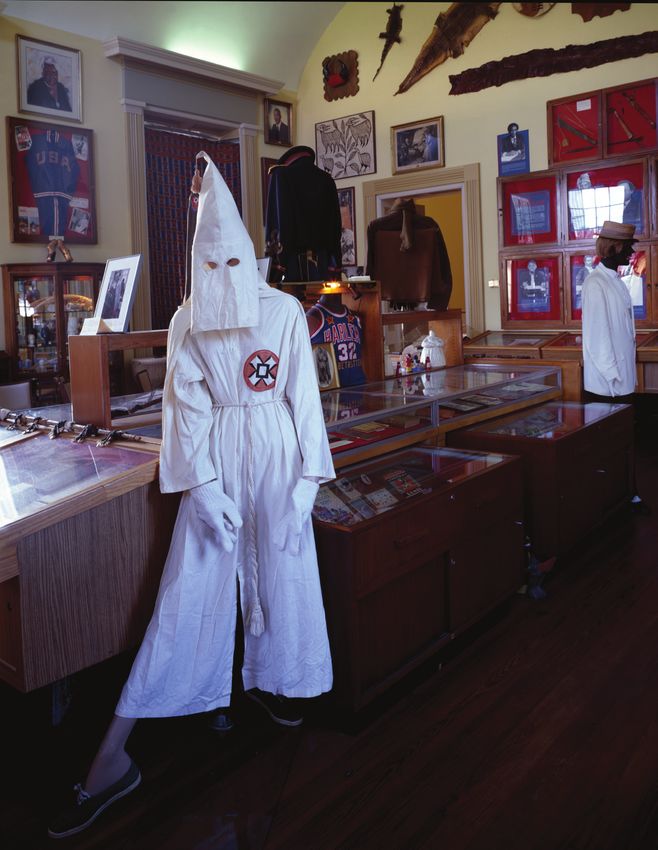
A Ku Klux Klan mannequin in the Meek-Eaton Black Archives in Tallahassee, Florida, The State of Hate Index 5
the Carol M. Highsmith Archive, Library of Congress, Prints and Photographs Division.
Methodology

Gathering data to represent how hate plays out on the ground is not straightforward. Questions such
as which vulnerable groups should be accounted for and what are the best measures for representing
hate are at the center of the SoHI. Ideally one would include as many vulnerable groups as possible,
assess which measures are extremely accurate, and then tally the results. This is not, however, the
terrain of hate statistics.

One common marker is the U.S. Federal Bureau of Investigation (FBI) statistics on hate crimes by
state. The FBI collects yearly data from each state counting hate crimes from vandalism to assault
to murder. The accounting is extensive, however, it is based on what states self-report, which
means states must relay accurate information and must classify the same crimes as hate crimes.
Unfortunately, there is a wide range of variation and underreporting and underclassification is
apparent in the data. As a consequence, the SoHI does not incorporate FBI hate crime numbers into
the Index, but the FBI data will be shown along with the overall rankings.

Setting aside the FBI data, the Index aligned its model with Bourdieu, approaching hate from two
angles. First, in line with habitus, data that measured embodiment—in actions and groups—was
utilized. Second, structure/field measures, such as laws and policies, were also incorporated. SoHI
uses the U.S. state as the level of analysis, as this is where we find the most comprehensive data
across all of the U.S. and the most expansive timeframe. Of course, there may be wide variation
within those political boundaries: northern Michigan is sociopolitically different than the University
of Michigan college town. Yes, Ann Arbor is different than Alpena, but hate groups exist in both cities,
and Whiteness is a more salient part of the identity of a Michigander as compared to the identity of
a New Yorker.

Embodiment—actions and groups

Embodiment was split into: a) those groups whose actions and identities promote and enact hate
(hate groups); and b) those groups whose actions and identities receive hate through violence.
Hate Groups data was collected from the Southern Poverty Law Center (SPLC 2020a) and its
determination of hate groups by state. SPLC defined hate groups as “an organization that—based
on its official statements or principles, the statements of its leaders, or its activities—has beliefs or
practices that attack or malign an entire class of people, typically for their immutable characteristics”
(SPLC 2020b). The measure for this is Number of Hate Groups. Some groups that received hate were
harder to represent. There are very little reliable state-level statistics that track violence against
people who are LGBTQ. This is also true for violence against Asian Americans and Pacific Islanders
(AAPI), which lacks accurate tracking also because of underreporting by the community and victims.8
The FBI Hate Crimes data does count violence against people who are LGBTQ or AAPI, but it is
inaccurate and not comparable from state to state. Because of this, protections for people who are
LGBTQ appear in the structural/field measures. There are three groups that had consistent data
tracking violence against them (women, people who are Jewish, and people perceived as non-white),
and these are the measures used: Violence Against Women (Smith et al 2017), Anti-Semitic Violence
(Anti-Defamation League 2020), and White Supremacy Violence (Anti-Defamation League 2020).9

6 Robert Tynes
Structure/field—laws and policies

Laws and policies can provide protection from hate-based violence, in the very least, by instituting
social norms (nomos) against violence. They are structural elements that raise the cost for anyone
who considers harm against an individual or an organization based on their race/ethnicity, religion,
gender, gender identity, and so forth. Laws and policies also create and maintain the narrative
necessary to make the norm a more concrete reality.10 The Index draws on three sets of information.
First, Levin and Nakashima (2019) created a dataset tracking the General Laws and Policies to the
Prevention of Hate. Their data includes discrimination based on age and based on homelessness
in addition to race/ethnicity, gender identity, etc. Second, the Human Rights Campaign (2020)
monitors state laws regarding issues such as transgender healthcare, adoption for same sex couples,
antibullying, and anti–conversion therapy. This measure is Law and Policies LGBTQ. Third, Gerney
and Parsons (2014) looked at gun and domestic violence laws nationwide, analyzing how states
protect women from gun violence perpetrated by domestic partners. Their study tracks laws on gun
possession prohibitions related to protection orders, sex crimes, and stalking crimes as well as laws
that require the surrender of weapons. Their data in the Index helps represent how serious states are
about saving women’s lives. This measure is Guns and Domestic Violence Laws.

In total there are seven measures in the Index—four for the embodiment category plus three for structure/
field category (See Table 1). The time frame spans a decade, from 2010 to 2020, with the most recent
and/or accurate dataset being utilized or a collection of yearly datasets being used. The past and more
current time reference reveal how the field of hate has manifested into its current form. This does not
mean that similar hate-based events are inevitable in the future. It does reveal, however, to what extent
a state is primed for future violence. Each measure is of equal weight in the Index, but calculating the
measure itself in some cases utilized a weighted system (See Appendix A for details). The measures are
not absolute for the state of hate, but together they do create the closest model we have to date for the

Confederate flag and Proud Boys in Pittsboro, North Carolina, October 2019. Anthony Crider, CC BY 2.0.   The State of Hate Index 7
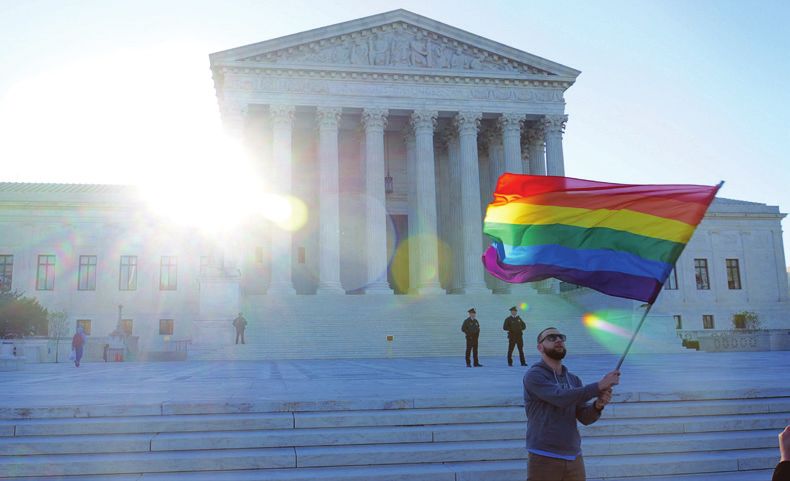
TABLE 1: MEASURES BY CATEGORIES
                      EMBODIMENT                                             STRUCTURE/FIELD
                  Number of Hate Groups                   General Laws and Policies Relating to the Prevention of Hate
                 Violence against Women                                     Laws & Policies LGBTQ
                   Anti-Semitic Violence                             Guns and Domestic Violence Policies
                 White Supremacy Violence

potential for violence and dehumanization in a given region in the United States. For each measure, the
raw data was recorded state by state. Then, all variable data was converted into a ranking system: 1–51.
(District of Columbia was included, because it is a considered a significant territory by the U.S. Census
and all the other agencies whose data is included in the Index.) The ranking system allows us to see how
states compare to one another. It is a closed universe though, so it only describes how each state does in
comparison to the others and not how much of a field of hate exists in that territory. In other words, the
51st rank means that that state has the greatest potential for hate-based violence in the United States.
Even at 51st, a state could be “not so bad,” though; just bad when considering the other states. After each
measure was converted to a rank, the ranks are added together to generate a composite score. The lowest
score translates to the “best” or most hospitable state. For the Index, the lowest composite score is 63 and
the highest is 285. The composite scores are ranked and a final scale is the result (1–51).11

State of Hate Index

The top five states where hate is less likely to flourish and lead to violence are: New York, Hawaii,
Illinois, California, and Connecticut. The bottom five states where hate is more likely to manifest into
violence are: Arkansas, Wyoming, South Dakota, Montana and, lastly, Idaho (See Table 2).

If we look for patterns based on region, we see states from all parts of the country sprinkled
throughout the ranking. There is a preponderance of Eastern and Northeastern states at the top,
accounting for seven of the first 11 states. The Southern and Western states tend to be in the middle
to the bottom of the rankings. There are exceptions, such as Florida and California (See Table 3).

If we compare political parties, Democrats or Republicans, we find a clear polarization with Democrats
at the top of the rankings and Republicans filling out towards the bottom (See Table 4). Political party in
control by state is based on the analysis of the State and Legislative Partisan Composition conducted by
the National Conference of State Legislatures (2020). The overall state control by party was determined
by the composition of the legislative party in control plus the governor’s party. The final state control
coding also considered the general trend of state party control from 2016–2020.

Taking a more conceptual approach, we can compare the Embodiment rankings with the Structure/
Field Rankings. What we find is some correlation between the two categories for some states, such as
Hawaii, New York, Connecticut, South Dakota, and Idaho. However, there is a wide difference between
the Embodiment rankings and Structure/Field rankings for Michigan, Colorado, Washington, and New
Hampshire. (See Table 5 below). This may indicate that the legal and social norms generated in some
states lag behind on the ground events. In other words, enforcement of laws and policies may be stronger
in New York and lax in Idaho, which is why Embodiment and Structure/Field are more closely aligned.
Whereas, in Michigan or Colorado, laws and policies may be strong, but enforcement is not consistent.

8 Robert Tynes
TABLE 2: THE STATE OF HATE INDEX
GENERAL
WHITE LAWS & GUNS AND
NUMBER VIOLENCE ANTI- LAWS &
POLICIES DOMESTIC OVERALL
STATE OF HATE AGAINST SEMITIC SUPREMACY POLICIES TOTAL
Relating to VIOLENCE RANK
GROUPS WOMEN VIOLENCE VIOLENCE LGBTQ
the Prevention LAWS
of Hate
New York 13 19 12 15 2 1 1 63 1
Hawaii 28 10 6 1 10 10 10 75 2
Illinois 14 23 3 16 10 10 4 80 3
California 10 18 15 35 2 1 1 82 4
Connecticut 5 27 26 18 10 1 10 97 5
New Jersey 8 30 20 28 10 1 4 101 6
Maryland 27 36 2 11 2 14 19 111 7
Massachusetts 9 14 32 38 17 1 15 126 8
Florida 29 9 7 10 17 35 25 132 9
Delaware 51 12 21 3 17 14 15 133 10
District of
21 48 30 26 1 1 8 135 11
Columbia
Iowa 2 10 46 29 17 21 10 135 11
Minnesota 11 47 27 30 2 14 4 135 11
Nevada 25 41 5 19 10 1 34 135 11
Rhode Island 7 2 31 33 17 14 34 138 15
New Mexico 1 34 41 13 2 14 34 139 16
Pennsylvania 19 27 13 17 39 24 10 149 17
Missouri 37 16 8 8 10 39 34 152 18
Texas 15 25 16 21 17 41 19 154 19
Washington 32 50 19 42 8 1 4 156 20
Kansas 3 39 4 20 29 31 34 160 21
North Carolina 34 5 28 9 39 27 19 161 22
Tennessee 45 21 24 14 17 41 1 163 23
Louisiana 41 1 36 6 17 46 19 166 24
Utah 20 4 44 48 2 23 25 166 24
Colorado 35 22 33 41 17 10 10 168 26
Ohio 23 24 9 24 39 31 25 175 27
Wisconsin 16 19 40 31 29 24 19 178 28
Oregon 30 51 17 37 10 1 34 180 29
Vermont 4 35 38 51 8 10 34 180 29
Michigan 24 33 18 12 34 28 34 183 31
West Virginia 17 6 42 44 34 35 8 186 32
Virginia 42 17 11 25 39 22 34 190 33
Georgia 36 7 22 4 47 41 34 191 34
Arizona 18 45 14 27 34 39 19 196 35
Oklahoma 12 14 37 40 29 46 25 203 36
Maine 33 43 29 45 17 14 25 206 37
Kentucky 22 39 10 39 29 35 34 208 38
Mississippi 40 27 25 2 34 46 34 208 38
Alabama 44 13 35 5 39 46 34 216 40
Indiana 31 30 34 22 47 31 25 220 41
North Dakota 38 3 51 34 34 35 25 220 41
Alaska 46 49 1 32 29 30 34 221 43
Nebraska 39 25 48 36 17 41 15 221 43
New Hampshire 49 38 43 47 17 14 15 223 45
South Carolina 26 42 23 7 47 46 34 225 46
Arkansas 43 30 45 23 47 28 34 250 47
Wyoming 6 37 39 49 47 41 34 253 48
South Dakota 50 8 49 46 39 46 25 263 49
Montana 48 46 50 50 39 24 25 282 50
Idaho 47 44 47 43 39 31 34 285 51
The State of Hate Index 9TABLE 3: STATE RANKINGS WITH REGION
STATE REGION OVERALL RANK
New York NE 1
Hawaii FW 2
Illinois MW 3
California W 4
Connecticut NE 5
New Jersey NE 6
Maryland E 7
Massachusetts NE 8
Florida S 9
Delaware E 10
District of Columbia E 11
Iowa MW 11
Minnesota MW 11
Nevada SW 11
Rhode Island E 15
New Mexico SW 16
Pennsylvania NE 17
Missouri S 18
Texas SW 19
Washington NW 20
Kansas MW 21
North Carolina S 22
Tennessee S 23
Louisiana S 24
Utah W 24
Colorado W 26
Ohio MW 27
Wisconsin MW 28
Oregon NW 29
Vermont NE 29
Michigan MW 31
West Virginia S 32
Virginia S 33
Georgia S 34
Arizona SW 35
Oklahoma W 36
Maine NE 37
Kentucky S 38
Mississippi S 38
Alabama S 40
Indiana MW 41
North Dakota W 41
Alaska FN 43
Nebraska W 43
New Hampshire NE 45
South Carolina S 46
Arkansas S 47
Wyoming S 48
South Dakota W 49
Montana W 50
Idaho W 51
10 Robert TynesTABLE 4: STATE RANKINGS WITH POLITICAL PARTY
STATE AND LEGISLATIVE
STATE OVERALL RANK
PARTISAN COMPOSITION
New York DEMOCRAT 1
Hawaii DEMOCRAT 2
Illinois DEMOCRAT 3
California DEMOCRAT 4
Connecticut DEMOCRAT 5
New Jersey DEMOCRAT 6
Maryland SPLIT 7
Massachusetts SPLIT 8
Florida REPUBLICAN 9
Delaware DEMOCRAT 10
Iowa REPUBLICAN 11
Minnesota SPLIT 11
District of Columbia DEMOCRAT 11
Nevada DEMOCRAT 11
Rhode Island DEMOCRAT 15
New Mexico DEMOCRAT 16
Pennsylvania SPLIT 17
Missouri REPUBLICAN 18
Texas REPUBLICAN 19
Washington DEMOCRAT 20
Kansas SPLIT 21
North Carolina SPLIT 22
Tennessee REPUBLICAN 23
Louisiana SPLIT 24
Utah REPUBLICAN 24
Colorado DEMOCRAT 26
Ohio REPUBLICAN 27
Wisconsin SPLIT 28
Vermont SPLIT 29
Oregon DEMOCRAT 29
Michigan SPLIT 31
West Virginia REPUBLICAN 32
Virginia DEMOCRAT 33
Georgia REPUBLICAN 34
Arizona REPUBLICAN 35
Oklahoma REPUBLICAN 36
Maine DEMOCRAT 37
Kentucky SPLIT 38
Mississippi REPUBLICAN 38
Alabama REPUBLICAN 40
Indiana REPUBLICAN 41
North Dakota REPUBLICAN 41
Alaska REPUBLICAN 43
Nebraska REPUBLICAN 43
New Hampshire SPLIT 45
South Carolina REPUBLICAN 46
Arkansas REPUBLICAN 47
Wyoming REPUBLICAN 48
South Dakota REPUBLICAN 49
Montana SPLIT 50
Idaho REPUBLICAN 51
The State of Hate Index 11TABLE 5: EMBODIMENT AND STRUCTURE/FIELD CATEGORIES COMPARED
STATE EMBODIMENT ONLY RANK STRUCTURE/FIELD ONLY RANK
Hawaii 1 9
Florida 2 27
Illinois 3 8
New York 4 1
Kansas 5 36
Georgia 6 49
Missouri 6 31
Rhode Island 8 23
Connecticut 9 7
Maryland 9 11
North Carolina 9 32
Pennsylvania 9 25
Texas 13 27
California 14 1
Ohio 15 38
Louisiana 16 30
New Jersey 17 5
Delaware 18 15
Iowa 18 17
Michigan 18 40
New Mexico 21 18
Nevada 22 13
Massachusetts 23 10
Mississippi 24 47
Virginia 25 38
Alabama 26 48
South Carolina 27 51
Oklahoma 28 42
Arizona 29 34
Tennessee 29 22
Wisconsin 31 24
West Virginia 32 27
Kentucky 33 41
Minnesota 34 6
Utah 35 18
Indiana 36 43
District of Columbia 37 3
North Dakota 38 36
Alaska 39 35
Vermont 39 20
Colorado 41 12
Wyoming 41 49
Oregon 43 13
Arkansas 44 45
Washington 45 4
Nebraska 46 25
Maine 47 21
South Dakota 48 46
New Hampshire 49 15
Idaho 50 44
Montana 51 33
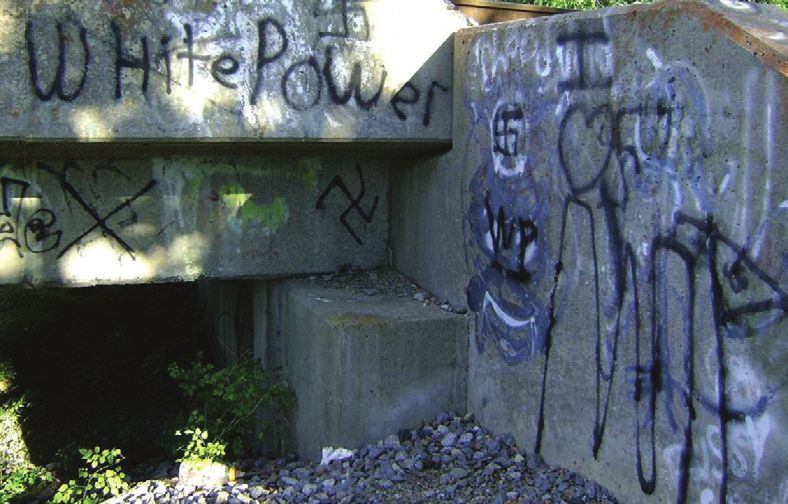
12 Robert TynesSome of the Dynamics of Hate-based Violence The SoHI is a starting point for understanding where hate-based violence is generated (or not). If we accept the Index as a baseline about hate, we can then turn to an exploration of correlations and explanations for why hate happens in certain regions. The point here is not to make predictions, but rather to extend what is revealed from SoHI to generate ideas for further research. Social groups—families, religious collectives, states, etc.—coordinate and cooperate on a regular basis in order to satisfy their wants, needs, and desires. These interactions, however, can become contentious, and may or may not lead to violence. Most of the time, contention in social groups does not lead to violence. In fact, it is more commonly diffused and remedied. Sometimes contention does rise to the level of conflict; and when hate enters the social field of discontent, the results can be disastrous. Following Gurr, an essential flip from internal discontent to external discontent begins with relative deprivation. This is a reflexive action wherein an individual/social group views the loss or denial of a resource in relationship to another individual/social group. The individual/social group perceives the loss or denial of a resource as being the fault of the other—you, she, he, we are being deprived relative to the other. At this point, the Us/Them dichotomy, so essential to the development of hate, manifests. When relative deprivation is activated, then frustration becomes more salient in the social psychology of the group. Sometimes this frustration is instrumentalized into aggression, as a method for acquiring the resource perceived as lost or denied because of the other. Further instrumentalization can lead to hate-based violence against a dehumanized THEM. Whether or not the violence can achieve the goal is inconsequential. The most important point is that the group perceives violence as the only method for achieving their goal. The pathway to hate-based violence is not inevitable. Group cohesion through political violence necessitates both internal and external forces. Internally, some members of the group may band “Sometimes it crawls out from beneath the bridge.” Patrick Feller, CC BY 2.0. The State of Hate Index 13
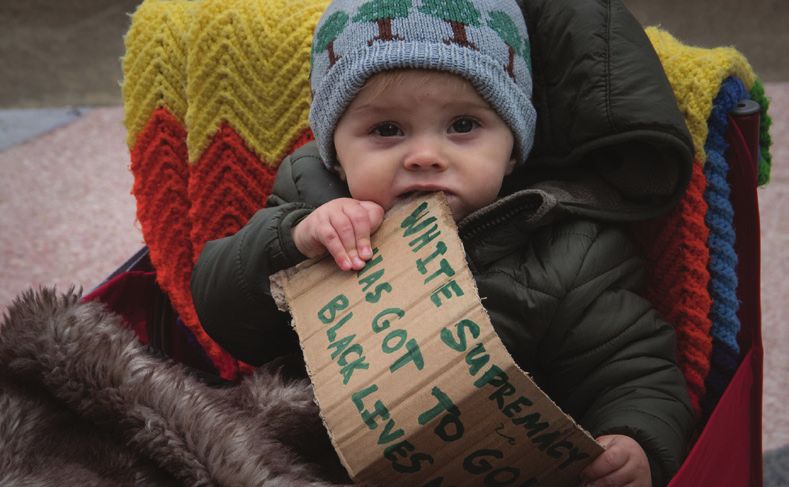
together and call for violence, at which point they must persuade the rest of the group that violence
is the most rational course of action. This is a “ground up” type of mobilization that Kaufman (2001)
describes in his work on ethnic conflict. A group can also be mobilized by charismatic individuals
who are adept at manipulating the discourse surrounding group discontent.12 These elites are political
entrepreneurs who manipulate certain facets of social groups’ webs of significance (Geertz 1977),
signs and symbols that can be essentialized and concretized as the only, inescapable, reality.

The model outlined above presents some of the core dynamics involved in the generation of hate-
based violence. With the SoHI we can test the model, building on the work of others. Yitzhaki (1979)
and Panning (1983) link income inequality as measured by the Gini Coefficient, to relative deprivation.
Further, Levin and McDevitt (1993) find a relationship between economic deprivation and hate-based
violence; and Craig (2002) discusses how poverty and employment might spark greater hate. Other
social scientists have found a connection between urbanization and hate crimes. Ilganski and Levin
(2004) analyze the dynamics of greater heterogeneity in urban areas versus greater homogeneity
in rural areas. They find that in rural areas there can be less diversity, which leads to a greater
likelihood of polarization and the solidifying of an Us versus Them frame of mind. The result is more
extremism and racism in rural regions. Wilson and Ruback (2003) find that hate crimes are higher in
rural counties of Pennsylvania when compared to urban counties. They note, however, that it could
be that hate crimes are more likely to be classified as such in rural areas, a problem perhaps of the
unreliability of hate crime reporting.

Taking these studies as points for exploration, we can pull out four independent variables: income
inequality, poverty, unemployment, and urbanization. Income inequality is measured by the Gini Index
for each state (U.S. Census Bureau 2020a). Poverty is measured by the poverty level for each state (U.S.
Census Bureau 2020b). Unemployment is measured by the unemployment rate for each state (U.S. Bureau
of Labor Statistics 2020). Urbanization is measured by the urban percentage of the population for each
state (U.S. Census Bureau 2020c). Hate crimes, as a ratio of the number of crimes over the population

14 Robert Tynes                                              Pride flag outside the Supreme Court. Ted Eytan, CC BY-SA 2.0.
of the state (FBI 2016, 2017, 2018), is also included as a fifth variable for comparison.13 The dependent
variable is the SoHI rank as measured by the total score (range: 63-285). Conducting a linear regression
analysis to see if there were any correlations, we find two significant variables. Both Urbanization and
Income Inequality strongly correlate with the Overall Rankings for hate in a state (See Table 5).

Urbanization exhibits an extremely strong correlation (>99.99%), and Income Inequality a significant
correlation (>95%). The findings show that the greater the urbanization, the lesser the likelihood of
hate in the state. This supports the work of Ilganski and Levin (2004) and Wilson and Ruback (2003)
and the notion that the greater the heterogeneity of a population, the less likelihood of conflict based
on socially constructed differences. Basically, when more racially/ethically/gender-defined groups
are in daily conflict, the notion of difference and an Us/Them relationship is less salient. For Income
Inequality (as measured by the Gini Coefficient) the correlation is negative in direction, which means
for states, as income inequality increases, hate decreases. While this may run counter to theories
about relative deprivation, it could be that what we see is a greater sense of competitiveness when
incomes are more equal, especially in rural areas where the only exposure to upper classes may come
through the media. In the cities, economic inequality can be overwhelming large; however, people
from all classes intermingle every day, making economic frustration more of an immediate reality,
rather than a mediated imaginary, and, similar to race/ethnicity/gender-defined constructions, class
becomes heterogeneous in more urbanized areas.14

While none of the other variables—Poverty, Unemployment,15 and Hate Crimes—are statistically
significant, it is worth noting that Hate Crimes does not correlate with the SoHI rankings. This would
support the premise that hate crimes are an essential part of unmasking hate in the United States, but
are not yet reliable for comparing one state to another. For instance, observe how New York ranks 1st
for Overall Rank and 38th for Hate Crimes. Meanwhile, Mississippi is 38th for Overall Rank and 1st for
Hate Crimes (See Table 6). As stated earlier, some state justice systems seem more likely to classify
and prosecute hate crimes, which could give the appearance of greater hate in that region.

Baby at Reclaim MLK Rally and March, Oakland, California. Peg Hunter, CC BY-NC 2.0.        The State of Hate Index 15
TABLE 6: REGRESSION RESULTS FOR SOHI RANKINGS WITH INCOME INEQUALITY, POVERTY,
UNEMPLOYMENT, URBANIZATION AND HATE CRIMES

                                                                 MODELS

             VARIABLE                                   A           B                         C

                                                     -633*
         Income Inequality
                                                    (-2.28)

            (Gini Index)                                                                    .234
              Poverty                                                                       (0.12)

                                                                   -2.02
          Unemployment
                                                                  (-0.31)

                                                      -2.12***   -2.35***                  -2.39***
            Urbanization
                                                     (-5.41)     (.-5.82)                  (-5.81)

                                                       .331        .604                     19.8
            Hate Crimes
                                                     (.050)       (0.09)                   (0.36)

                                                      623***       356***                   344***
              Constant
                                                     (4.95)       (7.94)                   (8.04)

             States (N)                                51           51                       51

Notes: *,**,*** = .05, .01, .001 levels of significance.

As mentioned, all of the findings from the linear regression should be taken as exploratory and
explanatory, but not as predictive. As the statistical universe for tracking hate becomes more and
more refined and profuse, we can hopefully move towards an even deeper understanding of the
dynamics of hate, weaving together qualitative and quantitative research.

Conclusion

The State of Hate Index is the first glimpse of how hate manifests from state to state. It is nowhere near
the sharpest picture of the fields of hate in America. It is, however, a sharper view of the dynamics as a
whole, drawn from the most accurate data sources existing to date. Much more refinement is needed.
Asian American, Muslim American, Arab American and Latinx-based hate is included in the general
framework of SoHI, but it is not broken down into separate, stand-alone variables. Hatred toward
these groups has become more apparent in the media since the September 11th attack on the World
Trade Center and the rise to presidency of Donald Trump.16 Coalitions, such as Stop AAPI Hate, are
producing more reliable reporting systems for hate directed at Asian Americans and Pacific Islanders.17
We need even more accounting of hate-based destruction of property and lives. Additionally, policies
and laws matter. The wide range of what lawmakers are willing to do to protect vulnerable groups is
readily apparent in the SoHI. Raising the costs for harm to others works, and legislators who ignore this
endanger the citizens who enter, and live within, their state borders.

16 Robert Tynes
TABLE 7: SOHI OVERALL RANK COMPARED TO HATE CRIMES RANK
STATE OVERALL RANK HATE CRIMES RANK
New York 1 38
Hawaii 2 16
Illinois 3 12
California 4 41
Connecticut 5 39
New Jersey 6 48
Maryland 7 9
Massachusetts 8 49
Florida 9 8
Delaware 10 33
District of Columbia 11 51
Iowa 11 4
Minnesota 11 40
Nevada 11 13
Rhode Island 15 19
New Mexico 16 20
Pennsylvania 17 5
Missouri 18 25
Texas 19 10
Washington 20 50
Kansas 21 34
North Carolina 22 30
Tennessee 23 35
Louisiana 24 6
Utah 24 21
Colorado 26 36
Ohio 27 42
Wisconsin 28 7
Oregon 29 43
Vermont 29 45
Michigan 31 46
West Virginia 32 22
Virginia 33 28
Georgia 34 14
Arizona 35 44
Oklahoma 36 11
Maine 37 37
Kentucky 38 47
Mississippi 38 1
Alabama 40 2
Indiana 41 31
North Dakota 41 23
Alaska 43 15
Nebraska 43 26
New Hampshire 45 27
South Carolina 46 18
Arkansas 47 3
Wyoming 48 24
South Dakota 49 29
Montana 50 17
Idaho 51 32
The State of Hate Index 17NOTES
1. Robert Tynes Ph.D. is a political scientist who researches political violence, child soldiers, online activism, and African
politics. He is the director of research and site director for the Bard Prison Initiative.
2. The Bard Center for the Study of Hate supported this project, from conceptualization to print (and secured a grant
to underwrite the work from GS Humane Corporation). Thank you to Hannah Henry, who helped with research.
Kenneth Stern provided invaluable feedback throughout the project—thank you. Cathy Buerger, Kristin Lane, and Jack
McDevitt were very generous, reviewing an early draft of the paper—thank you for your keen eyes. And thank you to
Maria Simpson, who also offered a thorough review of the manuscript. Finally, thank you to Mary Smith, Leslie Coons
Bostian, and Karen Spencer of the Bard Publications Office.
3. Violence is defined as any action that results in psychological, symbolic, property, or bodily damage.
4. SoHI also includes the District of Columbia.
5. Green, Victor H. (1937-1962). The Negro Motorist Green Book (Vol. 1-20). New York, New York: Victor H. Green &
Company.
6. Taylor, Candacy (2016). “The Roots of Route 66.” The Atlantic, 3 November 2016. Available at: https://www.
theatlantic.com/politics/archive/2016/11/the-roots-of-route-66/506255/
7. In this quote, Bourdieu, Wacquant, and Farage reference to states pertains to countries. Nevertheless, the same
phenomenon is applicable to the federal system of states in America.
8. See Yam (2021) regarding underreporting by the AAPI community; Stop AAPI Hate (2021) started tracking
incidences of hate against AAPI in March 2020. Its 2020–2021 National Report offers detailed data on types of
discrimination, sites of discrimination, and a list of some of the top states by number of incidents. The Center for the
Study of Hate and Extremism (2021) also has compiled valuable statistics on anti-Asian hate crimes. Hopefully these
data collection efforts will continue and become more detailed and robust at the state level.
9. All the variables used for the SoHI and for the regression analysis are discussed in greater detail in Appendix A.
10. For a much more sophisticated discussion regarding law, norms, and narrative see: Cover, Robert (1993). “Nomos
and Narrative.” In Martha Minow, Michael Ryan, and Austin Sarat (eds.), Narrative, Violence, and the Law: The Essays of
Robert Cover. Ann Arbor: University of Michigan Press: 95-172.
11. Note that the SoHI model is not intended to be absolute. Other researchers may find different ways of measuring and
ranking, and we invite that further discussion and refinement.
12. Also see Kaufman (2001); and, of note, van Dijk (1993).
13. See Appendix A for the variables discussed in more detail.
14. Panning (1983) details how research on relative deprivation and income equality finds variation in the correlation—
some uncorrelated and some negative. He suggests that we also include the likelihood that people will compare
themselves to one another economically.
15. Green and Strolovitch (1998) found little connection between unemployment and hate-motivated actions.
16. See Kuek Ker (2016); Mosley (2019); Pilkington (2021); Hong and Bromwich (2021).
17. See https://stopaapihate.org/about/
18. A correlation matrix was run for the variables of Number of Hate Groups, Violence against Women, Anti-Semitic
Violence, and White Supremacy Violence, checking for multicollinearity. No significant collinearity was found.
18 Robert TynesREFERENCES
Anti-Defamation League (2020). “ADL H.E.A.T. Map: Hate, Extremism, Antisemitism, Terrorism.” Available at: https://
www.adl.org/education-and-resources/resource-knowledge-base/adl-heat-map
Bourdieu, Pierre, Loïc J. D. Wacquant, and Samar Farage (1994). “Rethinking the State: Genesis and Structure of the
Bureaucratic Field,” Sociological Theory, Vol. 12, No. 1, pp.
Bourdieu, Pierre. On the State: Lectures at the Collège de France 1989-1992. Edited by Patrick Champagne, Remi Lenoir,
Franck Poupeau, and Marie-Christine Rivière, translated by David Fernbach. Cambridge, UK: Polity Press, 2014.
Craig, Kellina M. (2002). “Examining Hate-motivated Aggression: A Review of the Social Psychological Literature on
Hate Crimes as a Distinct Form of Aggression.” Aggression and Violent Behavior 7: 85-101.
Center for the Study of Hate and Extremism (2021). “Anti-Asian Prejudice.” Fact Sheet March 2021. Available at: https://
www.csusb.edu/sites/default/files/FACT%20SHEET-%20Anti-Asian%20Hate%202020%203.2.21.pdf
FBI (2016). “Table 11: Offense Type by Participating State, 2016” Federal Bureau of Investigation 2016 Hate Crime Statistics.
FBI (2017). “Table 11: Offense Type by Participating State, 2017” Federal Bureau of Investigation 2016 Hate Crime Statistics.
FBI (2018). “Table 11: Offense Type by Participating State, 2018” Federal Bureau of Investigation 2016 Hate Crime Statistics.
FBI (2020). “What We Investigate: Civil Rights: Hate Crimes.” Available at: https://www.fbi.gov/investigate/civil-rights/
hate-crimes
Geertz, Clifford (1977). The Interpretation of Cultures. New York: Basic Books.
Gerney, Arkadi and Chelsea Parsons (2014). “Women under the Gun: How Gun Violence Affects Women and 4 Policy
Solutions to Better Protect.” Center For American Progress.
Green, D. P., & D. Z. Strolovitch (1998). “Defended neighborhoods, integration, and racially motivated crime.” American
Journal of Sociology, 104, 372–404.
Gurr, Ted (1970). Why Men Rebel. Princeton, NJ: Princeton University Press.
Hong, Nicole and Jonah E. Bromwich (2021). “Asian-Americans Are Being Attacked. Why Are Hate Crime Charges So
Rare?” New York Times. 18 March, 2021. Available at: https://www.nytimes.com/2021/03/18/nyregion/asian-hate-
crimes.html
Human Rights Campaign (2020). “State Map of Laws and Policies” Human Rights Campaign. Available at: https://www.
hrc.org/state-maps
Craig, Kellina M. (2002). “Examining Hate-motivated Aggression: A Review of the Social Psychological Literature on
Hate Crimes as a Distinct Form of Aggression.” Aggression and Violent Behavior 7: 85–101.
IIganski, P., and Levin, J. (2004). “Cultures of hate in the urban and rural: Assessing the impact of extremist
organizations.” In N. Chakraborti and J. Garland (Eds.), Rural racism. Cullompton, UK: Willan Publisher: 108-121.
Kaufman, Stuart J. (2001). “Modern Hatreds: The Symbolic Politics of Ethnic War.” Ithaca: Cornell University Press.
Kuek Ker, Kuang Ken (2016). “Data: Hate Crimes against Muslims Increased after 9/11.” The
World, Public Radio International (PRI). Available at: https://www.pri.org/stories/2016-09-12/
data-hate-crimes-against-muslims-increased-after-911
Levin, Brian and Lisa Nakashima (2019). “Report to the Nation: 2019.” Factbook on Hate and Extremism in the U.S. and
Internationally. Center for the Study of Hate and Extremism, California State University, San Bernardino.
Levin, J. and J. McDevitt (1993). Hate Crimes: The Rising Tide of Bigotry and Bloodshed. New York: Plenum.
Mosley, Tonya (2019). “The ‘Forgotten’ History of Anti-Latino Violence.” Here and Now, WBUR Radio. Available at:
https://www.wbur.org/hereandnow/2019/11/25/history-violence-against-latinos
National Conference of State Legislatures (2021). “State Partisan Composition” 23 February 2021. Available at: https://
www.ncsl.org/research/about-state-legislatures/partisan-composition.aspx
National Conference of State Legislatures (2020). “State Partisan Composition.” Available at: https://www.ncsl.org/
research/about-state-legislatures/partisan-composition.aspx
Panning, William H. (1983). “Inequality, Social Comparison, and Relative Deprivation,” American Political Science Review
77: 323–329.
Pilkington, Ed (2021). “FBI under Pressure to Tackle Anti-Asian Hate Crime in Wake of Atlanta Shootings.”
The Guardian. 18 March, 2021. Available at: https://www.theguardian.com/us-news/2021/mar/18/
fbi-pressure-anti-asian-hate-crime-atlanta
Sheskin, Ira M. and Arnold Dashefsky (2021). “United States Jewish Population, 2019,” In Arnold Dashefsky and Ira M.
Sheskin (Eds.), American Jewish Year Book, 2020, Cham, Switzerland: Springer.
The State of Hate Index 19Smith, Sharon G., Jieru Chen, Kathleen C. Basile, Leah K. Gilbert, Melissa T. Merrick, Nimesh Patel, Margie Walling, and
Anurag Jain (2017). “The National Intimate Partner and Sexual Violence Survey (NISVS): 2010–2012 State Report.”
National Center for Injury Prevention and Control Centers for Disease Control and Prevention.
Southern Poverty Law Center (2020a). “Hate Map.” Data available for download at: https://www.splcenter.org/hate-map
Southern Poverty Law Center (2020b). “Methodology: How Hate Groups are Identified and Categorized.” Available at:
https://www.splcenter.org/news/2020/03/18/methodology-how-hate-groups-are-identified-and-categorized
Stern, Kenneth (2004). “The Need for an Interdisciplinary Field of Hate Studies.” Journal of Hate Studies 3(1): 7–35.
Stop AAPI Hate (2021). “2020–2021 National Report.” StopAAPIHate.org. Available at: https://stopaapihate.org
U.S. Bureau of Labor Statistics (2020a). “Local Area Unemployment Statistics: Unemployment Rates for States.” Available
at: https://www.bls.gov/lau/tables.htm
U.S. Bureau of Labor Statistics (2020b). “Labor Force Statistics from the Current Population Survey.” Available at: https://
www.bls.gov/cps/definitions.htm#ur
U.S. Census Bureau (2018). “2018 National and State Population Estimates.” Available at: https://www.census.gov/
newsroom/press-kits/2018/pop-estimates-national-state.html
U.S. Census Bureau (2020a). “Gap between rich and poor, by state in the U.S. 2019.” U.S. Census Bureau statistics as
compiled by Statista.
U.S. Census Bureau (2020b). “Interrelationships of Three-Year Average State Poverty Rates: 2016–2018 (Current
Population Survey, March 2017–2019).” Available at: https://www.census.gov/data/tables/2019/demo/income-
poverty/p60-266.html
U.S. Census Bureau (2020c). “Urban Percentage of the Population for States, Historical.” Data drawn from 2010 as
compiled by Iowa Community Indicators Program, Iowa State University. Available at: https://www.icip.iastate.edu/
tables/population/urban-pct-states
U.S. Census Bureau (2020d). “How the Census Bureau Measures Poverty.” Available at: https://www.census.gov/topics/
income-poverty/poverty/guidance/poverty-measures.html
Van Dijk, Teun A. (1993). Elite Discourse and Racism. London: Sage Publications.
Wilson, M. S., and Ruback, R. (2003). “Hate Crimes in Pennsylvania, 1984–99: Case Characteristics and Police
Responses.” Justice Quarterly 20(2): 373-398.
Yam, Kimmy (2021). “Asian Americans Are Least Likely to Report Hate Incidents, New Research Shows.”
NBCNews.com. 31 March, 2021. Available at: https://www.nbcnews.com/news/asian-america/
asian-americans-are-least-likely-report-hate-incidents-new-research-n1262607
Yitzhaki, Shlomo (1979). “Relative Deprivation and the Gini Coefficient,” Quarterly Journal of Economics 93: 321-324.
20 Robert TynesAPPENDIX A: FURTHER NOTES ON METHODOLOGY
1. Variables for the SoHI
Variables for the SoHI were chosen based on reliability, accuracy, and timeframe. There is no definitive dataset for hate-
based actions. The SoHI is an attempt to build towards greater precision. For now, the state level of analysis held the most
reliable statistics across categories. The timeframe spans 2010–2020. However, that does not mean that all of the data
covers each and every year. Some data is only reliable for 2010–2012, while other data covers 2016–2018. Because of this,
the focus is on depicting the general field of hate during this decade, and not drawing year-to-year causal connections. Also,
not all groups that are discriminated against could be represented equally. As highlighted in the conclusion, groups such as
Asian Americans are represented in the data in general, which is not optimal for understanding a serious, and long-standing,
problem of hate in the United States. Nevertheless, Asian Americans are considered a part of the Index in the variable of
General Laws and Policies Relating to the Prevention of Hate. The following list each variable and how the data was gathered
and processed for use in the Index. District of Columbia is included with the states in recognition of its near-state status.
Number of Hate Groups18
The Number of Hate Groups is drawn from the Southern Poverty Law Center’s (SPLC) database (2020a) on hate
groups in the United States as of 2018. SPLC (2020b) defines hate group as “an organization that—based on its official
statements or principles, the statements of its leaders, or its activities—has beliefs or practices that attack or malign an
entire class of people, typically for their immutable characteristics.” The raw number of hate groups per state is divided by
the population for that state in 2018 (U.S. Census Bureau 2018). The ratio is then used for the state ranking with
1 = lowest percentage and 51 = highest percentage.
Violence Against Women
The Violence against Women variable is constructed from data compiled for the National Intimate Partner and Sexual
Violence Survey (NISVS) 2010–2012. (Smith et al 2017). The NISVS calculates what percentage of the population has
experienced sexual violence for women and for men and with further breakdowns by race/ethnicity. For the SoHI, the
“Contact Sexual Violence for Women” percentage was utilized. Smith et al (2017) define contact sexual violence as
including “rape, being made to penetrate someone else, sexual coercion, and/or unwanted sexual contact” (p. 19).
Sexual violence against women is not a hate crime, but it does represent the dehumanization/othering of women, which
is the essential dynamic of hate. The NISVS percentage was converted to a rank for the SoHI. States are then ranked by
percentage with 1 = lowest percentage and 51 = highest percentage.
Anti-Semitic Violence
The Anti-Semitic Violence variable is calculated from research conducted by the Anti-Defamation League (ADL) (2020).
The data spans from 2016–2020. ADL counts number of incidents by state, defining incidents as: “Criminal and non-
criminal incidents of harassment, vandalism, and assault or other violence that: 1) include circumstances indicating
anti-Jewish animus on the part of the perpetrator; or 2) result in Jewish individuals or organizations being victimized due
to their Jewish or perceived Jewish identity.” The SoHI uses the raw incident count per state divided by the Jewish
population for that state (Sheskin and Dashefsky 2021). The ratio helps reveal the impact on the Jewish population. The
higher the percentage, the greater the effect. States are then ranked by percentage with 1 = lowest percentage and 51 =
highest percentage.
White Supremacy Violence
The White Supremacy Violence variable is calculated from research conducted by the Anti-Defamation League (ADL)
(2020). The data spans from 2016–2020. ADL counts number of events and propaganda incidents by state. White
supremacist events are defined as: “Public and private events in the United States organized or attended by white
supremacists, including rallies and protests, counterprotests, white-power music events, flash mob demonstrations,
hate group meetings, and more.” White supremacist propaganda is defined as: “Incidents of white supremacist
propaganda distribution, including flyers, handbills, posters, stickers, leaflets, and banners.” White supremacist graffiti
is not included. Information on these incidents comes from media, law enforcement, and constituent reporting as well
as direct observations of extremist social media. (See “Information” for “Incidents” on ADL H.E.A.T. Map webpage [ADL
2020]). The SoHI uses the raw incident count per state divided by the Black population for that state (U.S. Census Bureau
The State of Hate Index 212018). The Black population statistic was chosen as a proxy for minority-impacted groups in the state. This is not to say that the hate generated by White supremacy violence is not harming other minority groups as well. Statistics on Black populations tended to be the most reliable for minority groups, and therefore more accurate for use in analysis. The higher the percentage, the greater the effect. States are then ranked by percentage with 1 = lowest percentage and 51 = highest percentage. General Laws and Policies Relating to the Prevention of Hate General Laws and Policies data is culled from Levin and Nakashima (2019). These researchers list the hate crime statutes that exist in each state, coding each one as either “yes” or “no.” There are 10 categories of statutes: Race/Religion/ Ethnicity, Gender, Gender Identity, Age, Sexual Orientation, Disability, Homelessness, Political Affiliation, First Responders/ Police, and Interference with Religious Services. The SoHI utilizes eight of the 10 categories, leaving out Political Affiliation and First Responders/Police. The categories are converted from dichotomous scores (0 = no; 1 = yes) into weighted scores to account for greater discernment on the part of the state. For instance, Race/Religion/Ethnicity is weighted as 1 whereas Gender Identity is weighted as 3. Laws that are more specific and exacting receive a higher weight. For instance, laws against Interference with Religious Services scored 5, versus Race/Religion/Ethnicity, which is weighted as 1. The weighted scores are added together across categories for each state to produce a raw weighted score. The overall rank is determined as the higher the raw weighted score, the greater the protections against hate. For example, District of Columbia had a raw score of 13 and an overall rank of 1 (the greatest level of protections), whereas Arkansas, Georgia, Indiana, South Carolina and Wyoming all had a raw score of 0 and overall rank of 47 (tied for the lowest level of protections). Laws and Policies LGBTQ Laws and Policies LGBTQ data is tallied from the Human Rights Campaign’s (HRC) (2020) maps on state laws and policies as of 2020. HRC tracks laws and policies protecting people who identify as LGBTQ. States are coded according to multiple types of antidiscrimination laws and policies. The SoHI incorporates the following eight HRC categories: Anti- Conversion Therapy, Gender Marker Updates on Identification Documents, Transgender Healthcare, Education, School Anti-Bullying, Public Accommodations, Employment, and Housing. For SoHI, some of the categories are coded from -1 to 2. The negative coding is for laws or policies that discriminate. For example, in South Dakota, there are state laws and policies that limit the inclusion of LGBTQ topics in schools, so it is coded as -1. Conversely, Arkansas has laws and policies that explicitly prohibit “harassment and/or bullying of students based on sexual orientation and gender identity” (HRC 2020). Hence, Arkansas is coded as “2”. The composite score for the eight categories is totaled for a raw score. The raw score is converted to an overall rank for Laws and Policies LGBTQ with 1 being the best score and 46 being the worst score. Guns and Domestic Violence Policies Guns and Domestic Violence Policies are an attempt to measure protections for women against hate, specifically from their domestic partners. Gerney and Parsons (2014) study violent crime in the United States, noting that “the burden of this violence falls overwhelmingly on women” (p. 5). Their analysis includes an accounting of state laws protecting domestic partners against potential gun violence, as of June 2014. These are the eight categories in their analysis that are utilized for SoHI: Gun Possession Bar on Individuals Convicted of Misdemeanor Domestic Violence Crimes; Gun Possession Bar on Individuals Subject to Domestic Violence Protection Orders; Gun Possession Bar on Individuals Convicted of Misdemeanor Sex Crimes; Gun Possession Bar on Individuals Convicted of Misdemeanor Stalking Crimes; Bar for Misdemeanor Domestic Violence Crimes, including “Dating Partners”; Required Surrender of Certain Firearms by Persons Convicted of Misdemeanor Domestic Violence Crimes; Required Surrender of Certain Firearms by Persons Subject to Domestic Violence Restraining Orders; and, Required Removal of Certain Firearms by Law Enforcement at Specified Domestic Violence Incidents (pp. 35–36). Gerney and Parsons (2014) code as either “yes” or “no”. Their dichotomous scale is changed to “1” or “0” for SoHI. The scale range becomes 0-8 with eight being the most protections. The final ranking is 1–34 (some states have the same score), with 1 equal to most protections and 34 equal to least protections. 2. Variables for the Linear Regression The linear regression takes the SoHI Total as the dependent variable (DV), and income inequality, poverty, unemployment, urbanization, and hate crimes as the five independent variables. A variance inflation factor (VIF) test showed no multicollinearity overall. Running a correlation matrix revealed some collinearity, which is why three Models (A-C) were constructed. Results revealed that Urbanization was significant at the .001 level and Income Inequality at the .05 level. 22 Robert Tynes
SoHI Total (DV)
SoHI Total is the dependent variable (DV) used. It has a range from 63–285. It is used instead of the final Overall Rank in
order to adjust for heteroskedasticity.

Income Inequality (IV)
Income Inequality is an independent variable (IV) measured by the Gini Index. The index is a coefficient that ranges from
0–1. The U.S. Census Bureau (2020a) states “the Gini Coefficient is calculated by looking at average income rates. A score
of zero would reflect perfect income equality and a score of 1 indicates a society where one person would have all the
money and all other people have nothing.” The SoHI ranks the Gini Index, setting 1 as least inequality and 51 as greatest
inequality compared to the other states

Poverty (IV)
Poverty is an independent variable (IV) drawn from the U.S. Census (2020b) data for the three-year interrelationship of
poverty rates for 2016–2018. The variable is defined as: “a set of money income thresholds that vary by family size and
composition to determine who is in poverty. If a family’s total income is less than the family’s threshold, then that family
and every individual in it is considered in poverty. The official poverty thresholds do not vary geographically, but they are
updated for inflation using the Consumer Price Index” (U.S. Census Bureau 2020d). The Poverty variable for the linear
regression is measured as the straight percentage for each state.

Unemployment (IV)
Unemployment is an independent variable (IV) measured as a rate, drawn from the U.S. Bureau of Labor of Statistics
(2020a) for 2016–2019. The unemployment rate is “the number of unemployed people as a percentage of the labor force
(the labor force is the sum of the employed and unemployed). The unemployment rate is calculated as: (Unemployed ÷
Labor Force) x 100 (U.S. Bureau of Labor Statistics (2020b). The Unemployment variable for the linear regression is the
straight percentage average for all four years for each state.

Urbanization (IV)
Urbanization is an independent variable (IV) measured as the percentage of the urban population for a state in 2010. This
is the most up-to-date year for this statistic. Urban percentage is calculated from “all population in urbanized areas and
urban clusters (each with their own population size and density thresholds)” divided by the overall population of the state
(U.S. Census Bureau 2020c). The Urbanization variable for the linear regression is the straight percentage average for
each state.

Hate Crimes (IV)
Hate Crimes is an independent variable (IV) drawn from the FBI database for the years 2016–2018. The FBI defines hate
crime as a “criminal offense against a person or property motivated in whole or in part by an offender’s bias against a race,
religion, disability, sexual orientation, ethnicity, gender, or gender identity” (FBI 2020). The SoHI utilizes seven categories
of hate crimes, the more aggressive and violent acts: murder and non-negligent manslaughter; rape; aggravated assault;
simple assault; intimidation; arson; and destruction/damage/vandalism. All the incidents for each category are added
together for the yearly total, and then all three of the year totals are added together for a grand total of incidents. The
grand total is then divided by the state population. The final percentage, converted to a log, is what is used for the linear
regression in order to adjust for heteroskedasticity.

3. Other Variables

State and Legislative Partisan Composition
State and Legislative Partisan Composition is the overall party control of the state as determined by the legislative
controlling party plus the governor controlling party. The timeframe spans 2015–2019, looking at the general trend for
those five years. Data is drawn from research by the National Conference of State Legislatures (2020).

Cover: Reclaim MLK Rally and March in Oakland, California. Peg Hunter, CC BY-NC 2.0.                      The State of Hate Index 23
Back cover: “Say No to Hate Crime!” Mike Gifford, CC BY-NC 2.0.
You can also read