The contribution of functional traits to the understanding of palaeoenvironmental changes
←
→
Page content transcription
If your browser does not render page correctly, please read the page content below
Biological Journal of the Linnean Society, 2021, 133, 1110–1125. With 7 figures.

The contribution of functional traits to the

                                                                                                                              Downloaded from https://academic.oup.com/biolinnean/article/133/4/1110/6279738 by Museum National d'Histoire Naturelle user on 05 August 2021
understanding of palaeoenvironmental changes
LÉA TERRAY1,*, , EMMANUELLE STOETZEL2, ANTHONY HERREL3, and
RAPHAËL CORNETTE1
1
  Institut de Systématique, Evolution, Biodiversité (ISYEB), Muséum National d’Histoire Naturelle,
CNRS, Sorbonne Université, École Pratique des Hautes Études, Université des Antilles, CP50, 57 rue
Cuvier, 75005 Paris, France
2
  Histoire naturelle de l’Homme préhistorique (HNHP), Musée de l’Homme, Muséum national d’Histoire
naturelle, CNRS, Sorbonne Université, Palais de Chaillot, 17 place du Trocadéro, 75016 Paris, France
3
 Mécanismes Adaptatifs et Evolution (MECADEV), Muséum National d’Histoire Naturelle, CNRS, 55
rue Buffon, 75005 Paris, France

Received 26 January 2021; revised 15 March 2021; accepted for publication 16 March 2021

Performance traits implicated in feeding interact directly with the environment and are consequently relevant
ecological indicators. However, they have rarely been used to better understand palaeoenvironmental variation.
Here, we evaluate the usefulness of a performance (i.e. functional) trait, estimated bite force, in reconstructing
the palaeoecology of shrews. We investigate the relationships between mandible morphology, bite force estimates
and the ecological context. We use geometric morphometrics to quantify mandible shape diversity in shrews
of the archaeological site El Harhoura 2 (Rabat, Morocco), dated from the Late Pleistocene to the Holocene.
Morphological groups were used instead of taxa as units of diversity. To explore how phenotypic traits are
linked to their environment, they were compared with palaeoenvironmental inferences for the El Harhoura
2 site extracted from the literature. Morphological groups acted as phenotypic response units. Estimated bite
force was related to palaeoenvironmental variation over the considered period, with a particular sensibility to
arid/humid transitions. The complementarity of morphological and performance indicators allowed us to infer
functional convergence and divergence among shrews. Our results suggest that functional traits may be relevant
indicators of changes in palaeoenvironments. This approach opens up new possibilities to explore the impact of
environmental changes on extinct organisms.

ADDITIONAL KEYWORDS: bite force – functional traits – geometric morphometrics – modularity – palaeo-
environments – shrews.

                    INTRODUCTION                                   and functional traits is complex (Wainwright, 1994;
                                                                   Irschick et al., 2008). Different morphological traits
Performance traits provide a direct link between
                                                                   can generate similar functional outputs by redundancy
ecology, morphology and fitness (Arnold, 1983;
                                                                   (Alfaro et al., 2005), which may lead to functional
Wainwright, 1994). They reflect the ability of
                                                                   convergence in organisms living in environments
individuals to perform ecologically relevant tasks
                                                                   requiring similar performance abilities (Wainwright,
(Irschick et al., 2008) and are subject to selection
                                                                   2005; Young et al., 2007, 2010). Conversely, one
(Irschick et al., 2008). In animals, performance traits
                                                                   morphological trait can affect different performance
are dependent on skeletal structures, variation
                                                                   traits through trade-offs and facilitation. Trade-
in muscular anatomy, contractile physiology and
                                                                   offs occur when there is a conflicting demand on a
variation in biomechanical traits such as lever arms.
                                                                   phenotypic trait through its differential implication in
Consequently, the relationship between morphological
                                                                   several performance traits (Garland & Losos, 1994; Van
                                                                   Damme et al., 2003; Walker, 2007, 2010; Langerhans,
*Corresponding author. E-mail: lea.terray@mnhn.fr                  2009; Holzman et al., 2011; Vanhooydonck et al., 2011).

© 2021 The Linnean Society of London, Biological Journal of the Linnean Society, 2021, 133, 1110–1125                1110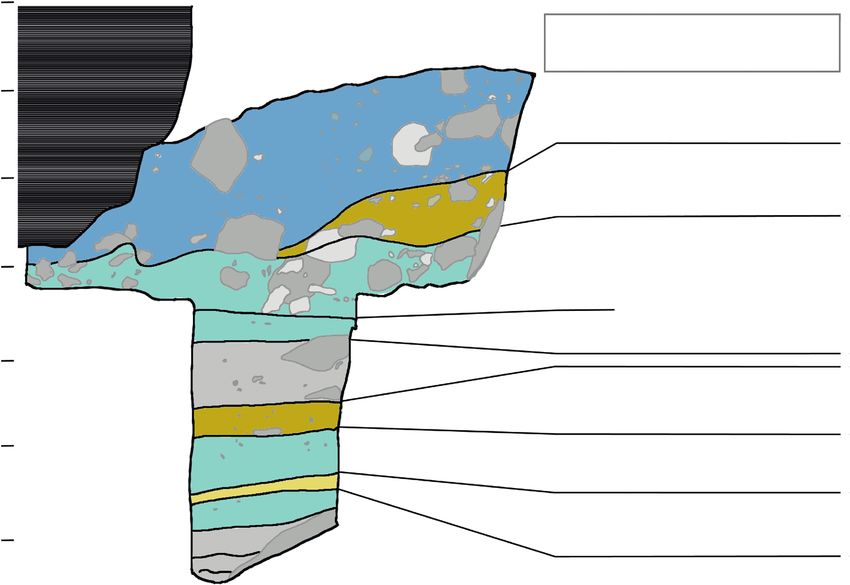
FUNCTIONAL TRAITS AND PALAEOENVIRONMENTS                          1111

Facilitation, on the other hand, occurs when a similar           Klingenberg et al., 2003; Klingenberg, 2004). Thus,
demand is exerted on a phenotypic trait by several               changes in the strength of integration in the feeding
different performance traits (Walker, 2007). Therefore,          apparatus could be related to changes in bite force.
a complex “many-to-many” morphology-performance                  Moreover, the less the modules in a structure like the
relationship may exist (Bergmann & McElroy, 2014),               mandible covary together (i.e. the more modular they

                                                                                                                              Downloaded from https://academic.oup.com/biolinnean/article/133/4/1110/6279738 by Museum National d'Histoire Naturelle user on 05 August 2021
implying that morphological and functional traits may            are), the more disparate are the organisms that can be
not respond similarly to changes in the environment.             produced (Goswami et al., 2014). Modularity patterns
Thus, functional traits may be relevant candidates to            may consequently also be related to bite force disparity.
function as ecological indicators, complementary to              Moreover, changes in modularity are known to respond
morphological traits.                                            to environmental stresses (Badyaev & Foresman,
   Feeding is the function related to dietary ecology            2000). In the light of these facts, modularity in the
(Schwenk, 2000). Bite force is a performance trait               feeding apparatus may also be a relevant indicator for
implicated in feeding. It is a performance trait directly        understanding variation in palaeoenvironments.
linked to diet through the mechanical demands                       The Moroccan archaeological site El Harhoura 2
imposed by variation in the mechanical properties of             (EH2) is located in the Rabat-Témara region, on the
food items (Anderson et al., 2008; Herrel et al., 2008;          North Atlantic coast of Morocco. It is divided into 11
Dumont et al., 2009; Santana et al., 2010; Maestri et al.,       archaeo-stratigraphical levels covering a time period
2016). Changes in diet associated with bite force are            from the Late Pleistocene to the Holocene. Phenotypic
considered one of the main drivers of diversification            evolution related to environmental variation has
in mammals (Christiansen & Wroe, 2007; Monteiro                  been extensively studied at this site (Stoetzel, 2009,
& Nogueira, 2011). Thus, bite forces may be a                    2017; Stoetzel et al., 2010, 2011, 2012b, 2013, 2017).
powerful ecological proxy and have been widely used              Small mammals such as rodents and shrews are a
to characterize dietary ecology in vertebrates (e.g.             relevant model to consider palaeoenvironmental
Freeman, 1979; Losos, 1992; Herrel et al., 2002; Huber,          variation (e.g. Valenzuela et al., 2009; McGuire, 2010;
2005; Kerr et al., 2017).                                        Escudé et al., 2013; Verde Arregoitia et al., 2017).
   Studies on bite force in fossil taxa are common               The biogeographical and ecological characteristics
as they may provide insights into the behavioural                of species (such as diet, habitat and soil), as well
ecology of extinct taxa (e.g. Erickson et al., 1996;             as the global composition of the small vertebrate
Therrien, 2005; Wroe et al., 2005; Lappin et al., 2017;          communities in the different studied levels, allowed
Rinderknecht et al., 2019). However, to our knowledge,           palaeoenvironmental inferences at EH2 (e.g. Stoetzel
estimates of bite force have only rarely been applied            et al., 2011, 2013, 2017). Among the remains recovered
to better understand palaeoenvironmental variation.              at EH2, shrew mandibles have been given peculiar
Commonly, such inferences rely on community                      attention (Cornette et al., 2015a, c). Mandible shape
compositions and/or the characterization of particular           is known for being highly plastic and often varies with
morphotypes (e.g. (Fernandez-Jalvo et al., 1998;                 environmental conditions in these animals (Badyaev
Stoetzel et al., 2011; Comay et al., 2019; Royer et al.,         & Foresman, 2000; Caumul & Polly, 2005; Cornette
2020; López-García et al., 2021). These approaches               et al., 2015a, c; Souquet et al., 2019).
associate a particular biological feature to a specific             In the present study, we sought to understand the
environment. However, an organism’s dietary ecology              relationship between the morphology of the mandible
can be more accurately inferred from bite force than             in shrews, its modularity and the estimated bite force
by categorical ecological classifications (Santana               over time. We further explored whether a functional
et al., 2010). Thus, bite force has a strong potential           trait (bite force) can provide relevant information
to contribute meaningfully to the understanding of               for the understanding of palaeoenvironments. Our
palaeoenvironmental variation.                                   approach is divided in three steps. (1) To evaluate global
   Functional aspects are also important determinants            morphological diversity, shrews were divided into
of morphological integration. This concept defines the           morphological groups (MGs). This characterization of
covariation patterns that exist between morphological            biodiversity was chosen instead of species. MGs allow
traits (Badyaev & Foresman, 2000, 2004; Young &                  for the consideration of variation at several levels of
Badyaev, 2006; Klingenberg, 2008; Klingenberg &                  diversity (inter- and intra-specific), which makes it
Marugán-Lobón, 2013). As a result of selection on                a relevant approach to characterize environment-
performance, traits implicated in a same function                related selection which acts at both levels (Erwin,
interact strongly, making them vary together                     2000; Lande, 2009; Boutin & Lane, 2014; Hautmann,
(Klingenberg, 2008). This may be particularly the                2020). We expected identified MGs to be functional
case when they are linked through muscle insertions              response units to changes in the environment, as has
providing physical and mechanical links between                  been suggested in previous studies (Read et al., 2014;
structures (Cheverud et al., 1997; Mezey et al., 2000;           Khare et al., 2017). (2) Bite force was estimated through

© 2021 The Linnean Society of London, Biological Journal of the Linnean Society, 2021, 133, 1110–1125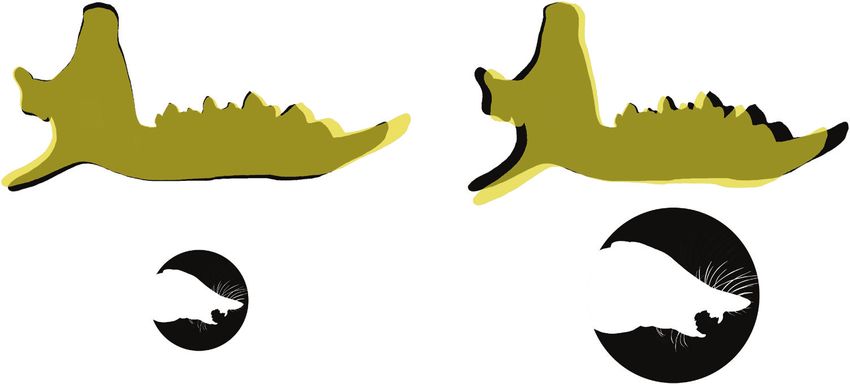
1112     L. TERRAY ET AL.

the mechanical potential. Because performance and                  Atlantic coast, a few kilometres south of Rabat.
morphology are not strictly related, selection can apply           The cave was occupied by Middle Stone Age, Later
differently at both levels of organization (Irschick               Stone Age and Neolithic human populations and
et al., 2008). Thus, quantifying variation in the                  has yielded numerous archaeological materials as
mechanical potential may allow us to detect selection              well as the remains of large and small vertebrates

                                                                                                                                     Downloaded from https://academic.oup.com/biolinnean/article/133/4/1110/6279738 by Museum National d'Histoire Naturelle user on 05 August 2021
events undetectable through morphological proxies. (3)             (Nespoulet et al., 2008; El Hajraoui et al., 2012;
Finally, variation in modularity was characterized. An             Stoetzel et al., 2014). From top to bottom, the
increase in modularity in shrew mandibles may allow                stratigraphy of EH2 cave is structured in 11
morphological diversification within a population                  layers. Eight of these levels are well dated and
utilizing the same resources irrespective of selection             were included in this study (L1, L2, L3, L4a, L5,
on function (Young et al., 2007, 2010) and as such be              L6, L7, L8) (Jacobs & Roberts, 2012; Jacobs et al.,
associated with variation in the environment.                      2012; Janati-Idrissi et al., 2012; Ben Arous et al.,
                                                                   2020a, b). Palaeoenvironmental data were deduced
                                                                   from faunal communities (Stoetzel, 2009; Stoetzel
            MATERIAL AND METHODS                                   et al., 2011, 2012a, b, 2014). An alternation of humid
                                                                   and arid periods has been documented and the
    El Harhoura 2 cave and data collection                         landscape was mainly dominated by steppes with
El Harhoura 2 cave (33°57’08.9” N / 6°55’32.5” W)                  an increase in more wooded areas and water ponds
is an archaeological site located on the Moroccan                  during humid periods (Fig. 1).

Figure 1. Stratigraphy, datation and characteristic environments of the eight layers of EH2 used in this study (Stoetzel,
2009; Jacobs et al., 2012; Janati-Idrissi et al., 2012; Nespoulet & El Hajraoui, 2012 - excavation report; Stoetzel et al., 2012a;
Ben Arous et al., 2020a, b). Three datation methods were used: AMS-14C (based on organic remains), US-ESR (Combined
Uranium Series and Electron Spin Resonance) and OSL (Optical Stimulated Luminescence). Light blue layers: humid and
open environment; dark blue layers: humid and close environment; light yellow layers: arid and open environment; dark
yellow layers: arid and semi-open environment. Layers unused in this study are in grey.

                          © 2021 The Linnean Society of London, Biological Journal of the Linnean Society, 2021, 133, 1110–1125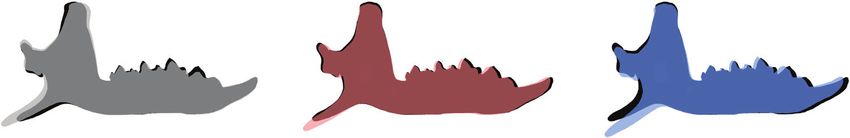
FUNCTIONAL TRAITS AND PALAEOENVIRONMENTS                     1113

  The material studied here is temporarily housed                patterns were not directly comparable. We performed
at the Muséum National d’Histoire Naturelle, Paris,              separate shape analyses for each fragment type (Cplt,
France. It was sampled during the 2005–2009                      A, B and C) following the same protocol. Mandibles
excavation campaigns of the El Harhoura-Témara                   were analysed through a landmark- and sliding semi-
Archaeological Team (directors R. Nespoulet and M.A.             landmark-based approach allowing the description

                                                                                                                         Downloaded from https://academic.oup.com/biolinnean/article/133/4/1110/6279738 by Museum National d'Histoire Naturelle user on 05 August 2021
El Hajraoui). Four species of white-toothed shrews               of the shape of biological relevant areas without
are represented: the material is largely dominated               anatomical landmarks (Bookstein, 1996; Zelditch,
by Crocidura russula but Crocidura lusitania,                    2004; Gunz et al., 2005; Cornette et al., 2013).
Crocidura tarfayensis and Crocidura whitakeri                    Landmark locations for each fragment type are
were also present (Cornette et al., 2015a, c).                   indicated in Figure 2. Semi-landmarks were slid to
Among archaeological remains complete mandibles                  minimize the bending energy. Generalized Procrustes
are rare and most of the material is fragmented.                 Analyses (GPA) were performed on each data set
Nevertheless, mandible fragments also carry relevant             (Cplt, A, B and C) to make objects comparable by
morphological and palaeoenvironmental information                removing effects of translation, rotation and scale
(Cornette et al., 2015a, c) and can be used to increase          (Rohlf & Slice, 1990). Resulting shape coordinates
the sample. Here we used complete mandibles (Clpt)               are the Procrustes residuals. These two last steps
and three types of mandible fragments (A, B, C).                 were performed using the “gpagen” function of the
Chosen fragments are those whose shape best enables              “geomorph” package (Adams & Otárola-Castillo, 2013)
species to be distinguished (Cornette et al., 2015a).            in R Core Team (2020). To reduce data dimensionality,
Fragmentation patterns are illustrated in Figure 2.              principal component analyses were performed on
Extant material (Act) from the Rabat area was added              Procrustes residuals for each data set (Cplt, A, B
to extend the timeline to present day (C. lusitania              and C) and we retained 95% of shape variation for
and C. tarfayensis are no longer present in the area).           the following analyses (Baylac & Frieß, 2005). All
The number of complete and fragmented mandibles                  analyses were performed using R Core Team (2020).
studied is indicated in Table 1. Data acquisition is
described in Cornette et al. (2015a).
                                                                                 Morphological groups
                                                                 To assess shape diversity, mandibles were partitioned
             Geometric morphometrics                             into morphological groups. First, complete mandibles
Two dimensional geometric morphometric analyses                  (Clpt) were clustered based on their shape. To do so
were used. All mandibles could not be analysed                   a morphological K-nearest neighbour method (KNN)
together because remains from various fragmentation              was used. This method is adapted to small data sets,

Figure 2. Types of fragments and their landmark (red points) and semi-landmark (blue points) locations. Clpt: complete
mandibles; A: fragmented mandibles of type A; B: fragmented mandibles of type B; C: fragmented mandibles of type C.

© 2021 The Linnean Society of London, Biological Journal of the Linnean Society, 2021, 133, 1110–1125
1114 L. TERRAY ET AL.
as is the case here, because it is a non-parametric algorithm with the “knn” function of the “class”
classification. In this algorithm, each shape object is package (Venables & Ripley, 2002). Mean shapes
assigned to its nearest neighbour cluster. The “clues” of each morphological group were computed from
function of the “clues” package (Wang et al., 2007) complete mandibles (Clpt) using the functions
proposes an unsupervised KNN, meaning that the “mshape” and “warpRefOutline” of the “geomorph”
Downloaded from https://academic.oup.com/biolinnean/article/133/4/1110/6279738 by Museum National d'Histoire Naturelle user on 05 August 2021
number of clusters is inferred from the data itself, package (Adams & Otárola-Castillo, 2013).
favouring the most robust partitioning of the data
set. The robustness of the clusters is assessed by the
Silhouette index (SI) (Kaufman & Rousseeuw, 1990) Mechanical potential
which measures the strength of the clusters. SI is The mechanical potential as used in this study is the
comprised between -1 and 1. The more SI is close to 1 ratio of the muscle moment arm to the jaw outlever.
(i.e. SI > 0), the more data points are correctly assigned As such it is dependent on the geometry of the skull
to their clusters, and conversely the more SI is close to and mandible and the insertion of the masticatory
-11 (i.e. SI < 0), the more data points are misassigned muscles (Herrel et al., 2008; Chazeau et al., 2013;
(Wang et al., 2007). Manhães et al., 2017; Ginot et al., 2018, 2019). In
To visualize the morphological groups identified, particular, mandible shape is known for being a good
the morphospace of complete mandibles (Cplt) was estimator of bite force (Brassard et al., 2020a, b). As
plotted using the three first axes of the principal a proxy for overall mechanical potential, we choose
component analysis computed on the Cplt data set. the mechanical potential of the temporalis muscle.
Deformations along axes were computed using the This is one of the main muscles involved in bite force
function “PlotRefToTarget” from the “geomorph” generation in shrews (Herrel et al., 2008; Santana
package (Adams & Otárola-Castillo, 2013). Thin- et al., 2010; Brassard et al., 2020a). It was estimated
plate spline deformation grids representing based on the moment arm of the temporalis, computed
differences between the extreme shapes of each axis from the mandible shape. The biomechanical model
and the global mean shape of Cplt mandibles were is presented in Figure 3. It is defined as MP = A / B,
generated. where: A is the moment arm of the temporalis, B is the
Next, we tested the robustness of the morphological jaw out-lever and MP is the mechanical potential of the
groups identified on complete mandibles (Clpt) for
each fragmentation pattern. Artificial A, B and C
fragments were computed from complete mandibles
(Clpt) and strengths of the clusters based on fragments
were assessed using SI. This was achieved using the
“get_Silhouette” function of the “clues” package (Wang
et al., 2007).
Finally, the belonging of true A, B and C mandible
f r a g m e n t s t o t h e m o r p h o l o g i c a l g r o u p s wa s
determined a posteriori using the KNN classification
Table 1. Abundance of remains studied (Clpt: complete
mandibles; A, B, C: fragmented mandibles; Act: actual
mandibles; L1: mandibles of the layer 1 of EH2 [the same
apply to L2, L3, L4a, L5, L6, L7, L8]) Figure 3. Biomechanical model used to estimate the
mechanical potential of the temporalis muscle (MP) from
Layer Clpt A B C TOTAL mandible shape. V is the vector that starts at mid distance
between landmarks 3 and 5 and has, for direction, the
Act 16 - - - 16 intersection between the line passing through landmarks
L1 2 1 - 2 5 3 and 4 and the parallel of the line passing through
L2 2 4 1 2 9 landmarks 2 and 3 passing through 5. A is the moment arm
L3 3 1 1 1 6 of the temporalis (the distance between the landmark 2 and
L4a 2 1 - 1 4 the vector). B is the jaw out-lever (the distance between
L5 10 - 2 3 15 landmarks 1 and 2). M1 and M2 are the definitions of the two
L6 10 2 4 9 25 hypothesized modules of the mandible from the literature
L7 9 7 13 10 39 (Cheverud et al., 1997; Mezey et al., 2000; Klingenberg
L8 - 6 10 11 27 et al., 2003; Klingenberg, 2004) and landmarks implicated
TOTAL 146 (C fragmentation pattern). M1: ascending ramus module;
M2: alveolar region module.
© 2021 The Linnean Society of London, Biological Journal of the Linnean Society, 2021, 133, 1110–1125FUNCTIONAL TRAITS AND PALAEOENVIRONMENTS 1115
temporalis. MP was computed for complete mandibles To evaluate whether cMP is a good estimator of
(Clpt) from Procrustes residuals. bite force, we assessed its reliability on a data set of
However, MP does not reflect the phenotype in simulated data:
nature: because it is computed from Procrustes
1. One thousand bite forces and associated sizes
residuals, it does not account for size variation in the
were simulated. Values were randomly generated
Downloaded from https://academic.oup.com/biolinnean/article/133/4/1110/6279738 by Museum National d'Histoire Naturelle user on 05 August 2021
data set, nor for compensatory effects of musculature.
according to a normal distribution using the “rnorm”
Moreover, it only considers a single force—the
function of the “stats” package, with for bite forces
temporalis muscle—which is applied uniformly (Young
the constraint of a mean of 0.3 and a standard
et al., 2007). All these parameters are important
deviation of 0.15, and for size a mean of 3500 and a
drivers of the mechanical potential, in particular size
standard deviation of 500. Those constraints aimed
(Wroe et al., 2005; Freeman & Lemen, 2008; Herrel
to generate a data set as close as possible to what is
et al., 2008; Chazeau et al., 2013; Manhães et al., 2017;
observed for the species present in our data set.
Ginot et al., 2018, 2019; Brassard et al., 2020a). In
2. MP was computed using (eqn. 3), where cMP
order to increase the accuracy of our estimate of bite
was replaced by bite force values and with a and
force, we corrected MP to take size into account.
b arbitrarily fixed (to represent the “real” relation
It is known that MP is linearly correlated to
between MP, bite force and size in the simulated
mandible/skull size in some mammals, including
data set). Thirty couples of a and b were randomly
shrews (Nogueira et al., 2009; Cornette et al., 2015b;
generated using the “rnorm” function of the “stats”
Manhães et al., 2017; Ginot et al., 2018; Brassard et al.,
package and tested. They were computed in order
2020a). As MP is computed from mandible shape, this
to be similar to the a and b found previously. As
means that it has an allometric component, i.e. even
the correlation between log10 bite force and size
if MP is size-free, a part of the MP results from the
is strictly positive (Wroe et al., 2005; Chazeau
influence of size. To confirm this assumption in our
et al., 2013; Manhães et al., 2017; Ginot et al.,
data set, we tested it on complete mandibles (Cplt)
2019; Brassard et al., 2020a), a should be strictly
by performing a regression of the log-transformed
positive and was generated with the constraint of
centroid size on the log-transformed MP using the
a mean of 3 and a standard deviation of 3. b was
“lm” function of the “stats” package. Centroid size
generated with the constraint of a mean of 0 and a
(Csize) is a size estimator widely used in geometric
standard deviation of 5 to test positive and negative
morphometrics. It is defined as the square root of
values. Tested couples of a and b are presented in
squared distances of all landmarks of a mandible
Supporting Information (Table S1). To simulate
from its centroid (Klingenberg, 2016).
measurement error, Gaussian noise was added to
Corrected MP (cMP) was subsequently expressed
computed MP (error tested at 0.01, 0.05 and 0.1).
as: cMP = MP + f(size) (eqn. 1), where MP is the
3. cMPs were calculated using (eqn. 3), with a and b
mechanical potential and f(size) is the part of cMP
found previously.
due to size. It is also known that log10 bite force is
4. For each pair of values in the simulated data set, we
linearly correlated to size (Wroe et al., 2005; Chazeau
tested whether the relation between the bite force of
et al., 2013; Manhães et al., 2017; Ginot et al., 2019;
individuals was respected by cMPs (for example, if
Brassard et al., 2020a). Thus, for cMP to be a good
we have two individuals X and Y such that: bite force
estimator of bite force, log-transformed cMP must also
X > bite force Y, we must also have cMP X > cMP Y).
be linearly correlated to size. So, in (eqn. 1) we have
Thus, variation in cMP reflects, in a relative way,
f(size) = a*size + b (eqn. 2). The objective here is to
variation in bite force. Mean, minimum and maximum
determine a and b.
scores of reliability among the 30 a and b couples were
We assume that the allometric part of MP is
computed for the three measurement error estimates.
proportional to the influence of size on MP. Thus, a
and b of (eqn. 2) can be found by performing a linear To obtain the cMPs of fragmented mandibles (A, B
regression of size on MP. However, our data have and C) we predicted it from the cMPs of complete ones
a temporal component that we need to consider, (Clpt) according to the following protocol. First, to
otherwise we may lose part of this temporal evaluate the reliability of the prediction, we performed
information as MP and size are both related to covariation analyses between artificial fragments
time. We performed a multivariate regression of generated from the complete mandibles (Clpt)
size and time on MP. Log-transformed values of corresponding to fragmentation patterns (A, B and
MP and Csize were used. a and b of (eqn. 2) were C) and cMP. We used two-block partial least squares
defined with the parameters of this regression: a as analyses (PLS) which assesses the covariance between
the coefficient of log(Csize) and b as the intercept. two sets of variables. This step was done using the
We obtained: log(cMP) = log(MP) + a*log(Csize) + b “two.b.pls” function of the “geomorph” package (Adams
(eqn. 3). & Otárola-Castillo, 2013), which performs a PLS
© 2021 The Linnean Society of London, Biological Journal of the Linnean Society, 2021, 133, 1110–11251116 L. TERRAY ET AL.
adapted to shape data. Then, the cMPs of fragmented Modularity
mandibles were predicted using the “plsr” function As the abundance of complete mandibles (Clpt) per
of the “pls” package (Mevik & Wehrens, 2007). This layer was not sufficient, the modularity analysis was
function allows prediction based on the covariation performed based on the C fragmentation pattern
between the two variables. on complete (Clpt) and C fragments. We divided
Downloaded from https://academic.oup.com/biolinnean/article/133/4/1110/6279738 by Museum National d'Histoire Naturelle user on 05 August 2021
Shapes associated with the strongest and weakest the mandible into two modules a priori according to
cMPs were computed. Those shapes were estimated the hypothesized primary developmental modules
based on the linear regression of cMP on shapes of defined in the literature (Cheverud et al., 1997; Mezey
complete mandibles (Cplt) using “procD.lm” of the et al., 2000; Klingenberg et al., 2003; Klingenberg,
“geomorph” package (Adams & Otárola-Castillo, 2013). 2004) (Fig. 3).
They were then computed with the “warpRefOutline” To q u a n t i f y t h e m o d u l a r s t r u c t u r e o f t h e
function of the same package. mandible, we computed the Covariance Ratio (CR)
Changes of cMP through time were investigated in per layer. CR compares the global covariation
two ways: between hypothesized modules relatively to the
1. Global cMP per layer. Differences between layers covariation within those modules (Adams, 2016).
were tested through pairwise comparisons testing The modularity hypothesis (independence of the
using the “pairwise.t.test” function of the “stats” hypothesized modules) is verified when CR < 1. This
package which correct for multiple testing. measure is unaffected by sample size or the number
2. cMP per morphological group per layer. of variables (Adams, 2016). It was performed using
the “modularity.test” function of the “geomorph”
For both, standard deviation was computed on each package (Adams & Otárola-Castillo, 2013).
layer as a measure of variance.
Figure 4. Principal component analysis on complete mandibles (Cplt).
© 2021 The Linnean Society of London, Biological Journal of the Linnean Society, 2021, 133, 1110–1125FUNCTIONAL TRAITS AND PALAEOENVIRONMENTS 1117
Downloaded from https://academic.oup.com/biolinnean/article/133/4/1110/6279738 by Museum National d'Histoire Naturelle user on 05 August 2021
Figure 5. Mean shapes of the three morphological groups (in grey, red and blue) compared to the global mean shape (in
black) of complete mandibles (Clpt).
Data availability Table 2. Reliability scores of cMP for the three tested
The data underlying this article will be shared on measurement errors
reasonable request to the corresponding author.
Measurement 0.01 0.05 0.10
error
Mean 82% 82% 81%
RESULTS Max. 98% 96% 93%
Morphological groups Min. 66% 66% 66%
Three morphological groups were detected among
complete mandibles (Clpt). We obtained an SI = 0.15, The PLS results showed that cMP is strongly related
meaning that the morphological partitions obtained to A, B and C fragments generated from complete
with the clustering are correct. This partitioning was mandibles (Clpt) (PLS: A fragments, r-pls = 0.66,
also valid for A, B, and C fragments (A fragments: P < 0.05; B fragments, r-pls = 0.75, P < 0.05; C
SI = 0.1; B fragments: SI = 0.09; C fragments: fragments, r-pls = 0.64, P < 0.05), ensuring the
SI = 0.1). reliability of predicted cMPs for fragments.
A visualization of the morphological groups Mean shapes associated with the strongest and weakest
on the principal component analysis of complete cMPs are presented in Figure 6. The shape associated
mandibles (Cplt) and their deformations along major with the weakest cMP (left in Fig. 6) is characterized by
axes is presented in Figure 4. Mean shapes of the an elongated mandibular body and a short mandibular
morphological groups are presented in Figure 5. branch compared to the global average shape of the
The first group (illustrated in grey in Fig. 5) has mandible. On the contrary, the shape associated with the
an elongated mandibular body, a more anteriorly strongest cMP (right in Fig. 6) displays a short mandibular
inclined coronoid and a more dorsally oriented body and a long mandibular branch.
condylar process compared to the average mandible Global changes in cMP through the El Harhoura 2
shape. The second group (illustrated in red in Fig. 5) sequence are presented in Figure 7A. In L7, a period
displays a shape similar to the mean shape. The characterized by an open and arid environment, a
third group (illustrated in blue in Fig. 5) has a short great variability in cMPs co-exist compared to other
mandibular body, a coronoid process that is slightly layers (Fig. 7B). An important increase in average cMP
more posteriorly inclined and a condylar process that is observed from L7 to L5 and then cMP decreases until
is more ventrally oriented. present day resulting in cMP values similar to those
observed in L7 (Fig. 7A). However, pairwise testing
indicates that only the cMP of L5-L7 and Act-L5 are
significantly different (P < 0.05). Raw variations of the
Mechanical potential moment arm of the temporalis (A) are also presented
Log-transformed MP was revealed to be weakly in Supporting Information (Fig. S2).
and negatively correlated to log-transformed Csize Changes in cMP per morphological group through
(R2 = 0.014, P = 0.0029, 52 degrees of freedom). The time are presented in Figure 7B. Not all morphological
multivariate regression (eqn. 3) was also significant groups show the same variation in cMP over time,
(R 2 = 0.12, P = 0.023, 50 degrees of freedom). We nor the same degree of variability. However, the three
obtained a = 0.30 (coefficient of log-transformed Csize) groups display a higher variability in L7. Overall,
and b = -3.47 (intercept). The reliability scores of cMP one of the morphological groups (indicated in blue in
based on the simulated data are indicated in Table 2. Fig. 7B) has a higher cMP than the others. The two
© 2021 The Linnean Society of London, Biological Journal of the Linnean Society, 2021, 133, 1110–11251118 L. TERRAY ET AL.
Downloaded from https://academic.oup.com/biolinnean/article/133/4/1110/6279738 by Museum National d'Histoire Naturelle user on 05 August 2021
Figure 6. Mean shapes associated with the strongest (right) and weakest (left) cMP (in yellow) compared to the global
mean shape (in black) of complete mandibles (Clpt). Strength of the cMPs is symbolized by the size of the shrew drawing
under the models.
other groups (indicated in red and black in Fig. 7B) shrews, and computed the covariation ratio and
display similar cMP values. In L5, the cMPs of the estimated mechanical potential over time. First, we
three morphological groups converge toward high discuss the meaning of morphological groups and
cMP values. Then, starting from L5, there is a drop the benefits of this approach. Next, we focus on the
in mandible shape diversity with the disappearance relation between mandible shape and mechanical
of one morphological group. In L4a and L3, the two potential. Finally, we address the variation in these
remaining groups show a divergence in cMP towards traits over time and compare them to environmental
respectively lower and higher values. In L2, a inferences from the literature to assess their
second diversity drop occurs with the disappearance potential relevance for palaeoenvironmental studies.
of another group. From then onwards only one
morphological group is consistently present, the two
others show only few occurrences. Morphological groups
Over the considered period, up to three morphological
groups of mandibles were found among the four shrews
Modularity species present at EH2 (C. russula, C. whitakeri,
Changes in CR over time are presented in Figure 7C. CR C. tarfayensis and C. lusitania) (Cornette et al.,
was not statistically significant in L2 and L4a. There are 2015a, c). The assessed morphological diversity is
two main changes in CR values, first a slight increase consequently above the species level. Simplification
in L7 (CR = 0.86, P < 0.05) followed by a strong increase of information is a risk of the morphological group
from L5 to L3, with a peak in L3 (CR = 0.95, P < 0.05). approach (Read et al., 2014); however, it provides
access to a partition of variability that is potentially
more informative ecologically than taxonomically
when the studied biological object is sensitive to
DISCUSSION environmental change (Alperin et al., 2011; Read
In this study, we aimed (1) to investigate the et al., 2014; Khare et al., 2017), which is the case
relationship between shrew mandible morphology, for shrew mandibles (Badyaev & Foresman, 2000;
modularity and estimated biting forces (cMP) over Young et al., 2010). The morphological groups reveal
time and (2) to evaluate whether a performance trait variations in the number of morphotypes independent
(bite force) could provide relevant information in the of the number of species. For example, in the recent
understanding of palaeoenvironments. To do so, we layers of EH2 (from L4a until L1) only one or two
explored mandible shape diversity in archaeological morphological groups are present per layer whereas all
© 2021 The Linnean Society of London, Biological Journal of the Linnean Society, 2021, 133, 1110–1125FUNCTIONAL TRAITS AND PALAEOENVIRONMENTS 1119
Downloaded from https://academic.oup.com/biolinnean/article/133/4/1110/6279738 by Museum National d'Histoire Naturelle user on 05 August 2021
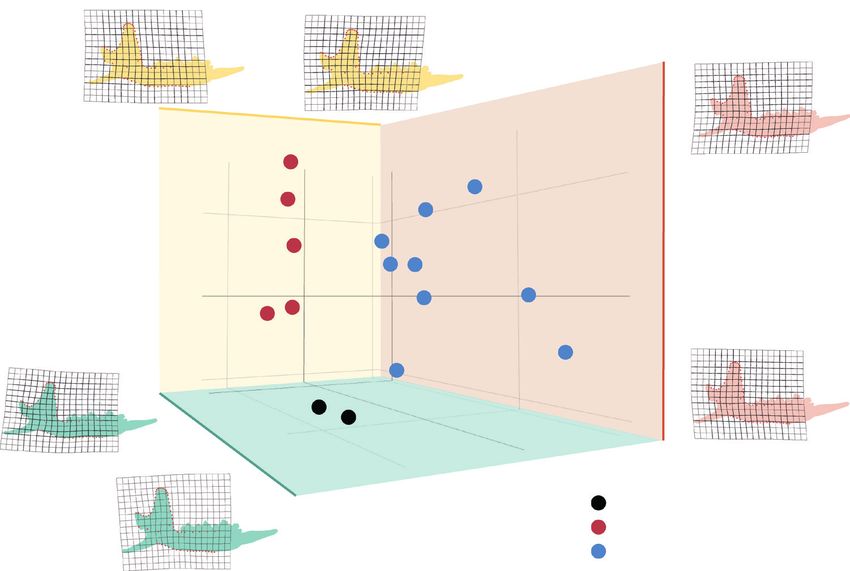
Figure 7. Global changes in cMP (A), cMP per morphological group (B) and CR (C) of the shrews of EH2, from L8 until
present day (Act). Environmental conditions (Stoetzel, 2009; El Hajraoui et al., 2012) are indicated by background colours.
For cMP, standard deviation is indicated for each point. A: layers displaying significant different cMP (L7–L5 and L5–Act)
are indicated by red asterisks. B: black is the first morphological group; red is the second morphological group; blue is the
third morphological group. C: dotted lines indicate missing values.
four species are still present suggesting morphological Mandible shape and mechanical potential
convergence across these species (Cornette et al., The relation between rostrum elongation and mechanical
2015c). The morphological groups are characterized potential is intuitive as a longer rostrum increases
by different functional outputs and in their response the jaw out-lever and consequently results in a lower
to environmental changes. Except in L5, they display mechanical potential. This is illustrated by the negative
a different cMP and show different trends over time, correlation between MP and mandible size. This type of
especially from L4a and L3. To sum up, morphological relation between MP and mandible size has also been
groups are characterized by differences in morphology, observed in other mammals [e.g. Casanovas-Vilar &
functional output and their response to environmental van Dam (2013) for squirrels, Nancy (1982) for felids].
change. Thus, they represent morphological and This implies that the smallest specimens have a higher
functional response units to external variation. mechanical potential than the largest ones. Mechanical
Nevertheless, because we used only three of the five potential and size are both important drivers of bite force.
types of mandible fragments that were used in Cornette These results suggest that the relative importance of
et al. (2015a, c), we reduced the initial sampling which these drivers varies between small and large specimens.
can result in a potential loss of diversity. However, Conformations may be a more important driver of bite
unused fragments were the least informative and force than size in small specimens compared to large
reliable and could have introduced uncertainties into ones. Nevertheless, the weakness of this correlation
the results of this study which is why we chose to suggests that the specimens used here are rather
exclude them. uniform in size.
© 2021 The Linnean Society of London, Biological Journal of the Linnean Society, 2021, 133, 1110–11251120 L. TERRAY ET AL.
Concerning the mandibular branch, our results are Mechanical potential as
consistent with Young et al. (2007) who found that a palaeoenvironmental indicator
a high mechanical potential was associated with a When considering both global and per morphological
greater distance between the condylar and the coronoid group changes in cMP, four important functional
processes. This is related to muscles of the masticatory variations were detected over time in L7, in L5, during
Downloaded from https://academic.oup.com/biolinnean/article/133/4/1110/6279738 by Museum National d'Histoire Naturelle user on 05 August 2021
apparatus: the coronoid process is the place of insertion L4a-L3 and in L2. Three of these (in L7, L5 and L2)
of the temporalis muscle, the condylar process is the match transitions from humid to arid environments
place of insertion of the external pterygoid and the (Stoetzel, 2009; Stoetzel et al., 2011).
angular process is the place of insertion of the internal In L7, we observed a high morphological diversity
pterygoid and the masseter. They all participate in (with the presence of the three morphological groups),
generating bite force and impact bone shape in shrews the co-existence of highly diverse cMPs (Fig. 7A, B)
(Furió et al., 2010; Cornette et al., 2015c). and a decrease in modularity (Fig. 7C). An increase
The mean shapes of morphological groups display in the diversity in cMP could be caused by a release
morphological features that can be related to their of selective pressures on this trait, allowing shrews
mechanical potential. The group displaying the with diverse abilities to survive. This could be due
highest mechanical potential (in blue on Figs 4, 5, 7) to the availability of more diverse resources in the
is the one with the shortest mandibular body and the environment of L7 than in those of other layers.
closest condylar and coronoid processes, which are However, the environment in L7 is characterized by an
morphological and functional particularities related open and dry environment of arid steppes, and seems
to hard diet specialists in shrews (Young et al., 2007). to present less ecological diversity than some other
Conversely the group with the weakest mechanical layers (Stoetzel, 2009; El Hajraoui et al., 2012). Another
potential [in grey (Fig. 5) and in black (Figs 4, 7)] hypothesis might be that a lack of resources drives
displays features characteristic of soft diet specialists character displacement in shrews with forms becoming
in shrews (Young et al., 2007). The third group [in red highly specialized in the consumption of different
(Figs 4, 5, 7)] showing average features likely regroups resources. Moreover, the masseter and the medial
generalist shrews. Thus, morphological groups appear pterygoid muscles also participate in generating bite
to highlight ecological specializations. force (Herrel et al., 2008; Santana et al., 2010; Brassard
Modularity might be a key concept to understand the et al., 2020 a, b). However, these muscles are implicated
link between morphological and functional variation. in the consumption of different types of resources, as
Three main decreases in modularity (i.e. increases in bats where the masseter allows the consumption of
in CR) are observed in the sequence at EH2 in L7, more soft resources (Santana et al., 2010). Moreover,
L5 and L3. In L7, the three morphological groups functional variation is accompanied by a decrease in
display unusual variability in cMP (it is important to modularity. Variation in the degree of covariation
note that this is the layer with the largest sample). In between mandibular modules in shrews may be related
L5, the three morphological groups show remarkably to stressful environmental conditions (Badyaev &
similar cMPs, meaning similar functional outputs. Foresman, 2000). In the light of this fact, it is more likely
Finally, in L3, the two morphological groups display that during the period covered by L7, shrews endured
highly divergent functional outputs. Each decrease particularly stringent environmental conditions, with
in modularity (i.e. increase in CR) in the mandible is fewer and/or different available resources than before.
associated with an increase in the ability of a form As shrews are opportunistic, they might have switched
to produce more diverse functional outputs, allowing their diet during this period inducing a release on the
either divergence (as in L7 and L3) or convergence functioning of the temporalis muscle. However, as L7
(as in L5) in the cMP. These are in contradiction is the layer with the largest sample this may bias our
with Young et al. (2007, 2010), who found that observations.
extensive modularity allowed shrews with more In L5, the cMPs of two morphological groups greatly
diverse morphologies to produce a similar functional increases and the cMPs of the three groups converge
output. However, Young et al. (2010) underlined that toward high values (Fig. 7A, B). Pairwise testing
adaptive responses are highly variable, even at a indicates that global cMP is significantly different
population level, which may explain the difference in L5 compared to L7 and present day (Fig. 7A),
observed in comparison to our results. It may be the and consequently supports the hypothesis of a cMP
adaptive strategy here implies a different relation convergence towards high values in L5. This functional
between mechanical potential and the modularity of convergence is not associated with a convergence of the
the mandible. A possibility might involve variation morphological groups, which is not surprising as those
in skull shape which was not studied here (Cornette two types of convergence (functional and morphological)
et al., 2015c). can be independent (Stayton, 2006). The group of soft
© 2021 The Linnean Society of London, Biological Journal of the Linnean Society, 2021, 133, 1110–1125FUNCTIONAL TRAITS AND PALAEOENVIRONMENTS 1121
diet shrews (in black in Fig. 7B) is possibly subjected as selection for lower performance likely only occurs
to a selection causing large-sized specimens to produce when the trait is energetically expensive to maintain
the highest mechanical potential (as illustrated in or involved in trade-offs with other more relevant traits
Supporting Information, Fig. S1). Here we have a case (Irschick et al., 2008). The energy previously allocated to
of functional redundancy: three distinct morphologies the mechanical potential of the temporalis might have
Downloaded from https://academic.oup.com/biolinnean/article/133/4/1110/6279738 by Museum National d'Histoire Naturelle user on 05 August 2021
producing similar functional outputs (Alfaro et al., been reallocated to another performance trait under
2005). This is observed in environmental conditions stronger selection in the novel environment.
requiring similar performance abilities: distinct
morphologies are then able to adapt to similar functional
demands (Wainwright, 2005; Young et al., 2007, 2010).
CONCLUSION
This functional convergence could be explained by an
increase in the selective pressures caused by fewer or To conclude, results of the present study illustrate
different resources compared to previous layers, as the the relevance of functional traits to detect
transition to L5 is towards a more arid environment palaeoenvironmental transitions. Estimated bite forces
(Stoetzel, 2009; El Hajraoui et al., 2012). showed variation in relation to palaeoenvironmental
In L4a, the morphological group of soft diet shrews is changes over the considered period (Late Pleistocene-
not present anymore. It must have disappeared during Holocene), with a particular sensibility to transition
the previous arid period during which soft resources b e t w e e n a r i d a n d h u m i d e n v i r o n m e n t s. T h e
may have been scarce. It is known that the insect cuticle complementary nature of morphological and
becomes harder under drier environments (Klocke & functional indicators allowed to infer and discuss
Schmitz, 2011). The cMP of the two remaining groups the possible evolutionary and ecological processes
diverged distinctly. The supposed strong selection involved. Functional traits have a great potential for
pressure(s) leading previously to the functional refining palaeoenvironmental and palaeoecological
convergence in L5 must have eased. This is congruent with inferences. Moreover, they appear to be relevant
existing environmental inferences, as the environment in indicators of palaeoenvironmental transitions and
L4a is hypothesized to be very similar to conditions in offer a range of opportunities to explore the impact of
L6 (Stoetzel, 2009; El Hajraoui et al., 2012). In L3, the environmental changes on extinct organisms.
divergence between cMP of the two groups increases. We
can hypothesize that those two shrew morphotypes were
subject to functional divergence. Each group of shrews ACKNOWLEDGEMENTS
may have specialized in the acquisition of a different food
The authors would like to thank the Mission
resource. The group displaying high cMP specializing in
Archéologique El Harhoura-Témara, the Ministère
hard, large objects, requiring mechanical potential with
des Affaires Etrangères et Européennes, France,
an important contribution from the temporalis, and
the Ministère de la Culture, Morocco (directors
the other group specializing on softer, smaller items,
R. Nespoulet and M.A. El Hajraoui), the Institut
which requires less contribution of the temporalis. This
National des Sciences de l’Archéologie et du Patrimoine
divergence might be caused by competition occurring
(INSAP), Rabat, Morocco, and the Institut Scientifique,
among shrews. Such a competition has been suggested
Rabat, Morocco, for helping to provide modern and
between C. russula and other shrews species at EH2 at
fossil shrew specimens. This research was funded by
the exact same period (Cornette et al., 2015c), and shrew
the Université Paris Descartes, the Ecole Doctorale
dietary specialization might be a response to competition
FIRE-Programme Bettencourt. We also thank the two
(Smith & Remington, 1996). In L2, a second diversity drop
anonymous reviewers for constructive comments that
is observed with the disappearance of the group of hard
helped to greatly improve the manuscript. The authors
diet specialists. As in L5, this event occurred following
declare that they have no conflicts of interest.
an arid period during which less diverse resources may
have been available. Only the group of generalist shrews
is continuously present up to present day.
Interestingly, extant shrews display a particularly REFERENCES
weak cMP. This may be caused by the recent deterioration Adams DC. 2016. Evaluating modularity in morphometric
of climatic conditions linked to the increase of human data: challenges with the RV coefficient and a new test
pressure (Lewis & Maslin, 2015). Once again, it might measure. Methods in Ecology and Evolution 7: 565–572.
be explained by a release of selective pressures on the Adams DC, Otárola-Castillo E. 2013. geomorph: an
temporalis resulting from a switch in diet (Santana R package for the collection and analysis of geometric
et al., 2010). Another explanation might be a selection morphometric shape data. Methods in Ecology and Evolution
towards weaker cMP. This is counter-intuitive, however, 4: 393–399.
© 2021 The Linnean Society of London, Biological Journal of the Linnean Society, 2021, 133, 1110–11251122 L. TERRAY ET AL.
Alfaro ME, Bolnick DI, Wainwright PC. 2005. Evolutionary masticatory muscle architecture covary with mandibular shape
consequences of many-to-one mapping of jaw morphology to in domestic dogs? Evolutionary Biology 47: 133–151.
mechanics in labrid fishes. The American Naturalist 165: Casanovas-Vilar I, van Dam J. 2013. Conservatism and
E140–E154. adaptability during squirrel radiation: what is mandible
Alperin MI, Cusminsky GC, Bernasconi E. 2011. Benthic shape telling us? PLoS One 8: e61298.
foraminiferal morphogroups on the Argentine continental Caumul R, Polly D. 2005. Phylogenetic and environmental
Downloaded from https://academic.oup.com/biolinnean/article/133/4/1110/6279738 by Museum National d'Histoire Naturelle user on 05 August 2021
shelf. The Journal of Foraminiferal Research 41: 155–166. components of morphological variation: skull, mandible and molar
Anderson RA, McBrayer LD, Herrel A. 2008. Bite force in shape in marmots (Marmota, Rodentia). Evolution 59: 2460–2472.
vertebrates: opportunities and caveats for use of a nonpareil Chazeau C, Marchal J, Hackert R, Perret M, Herrel A.
whole-animal performance measure. Biological Journal of 2013. Proximate determinants of bite force capacity in the
the Linnean Society 93: 709–720. mouse lemur. Journal of Zoology 290: 42–48.
Arnold SJ. 1983. Morphology, performance and fitness. Cheverud JM, Routman EJ, Irschick DJ. 1997. Pleiotropic
American Zoologist 23: 347–361. effects of individual gene loci on mandibular morphology.
Badyaev AV, Foresman KR. 2000. Extreme environmental Evolution; International Journal of Organic Evolution 51:
change and evolution: stress-induced morphological 2006–2016.
variation is strongly concordant with patterns of evolutionary Christiansen P, Wroe S. 2007. Bite forces and evolutionary
divergence in shrew mandibles. Proceedings. Biological adaptations to feeding ecology in carnivores. Ecology 88:
Sciences 267: 371–377. 347–358.
Badyaev AV, Foresman KR. 2004. Evolution of morphological Comay O, Weissbrod L, Dayan T. 2019. Predictive
integration. I. Functional units channel stress-induced modelling in paleoenvironmental reconstruction: the
variation in shrew mandibles. The American Naturalist 163: micromammals of Manot Cave, Israel. Journal of Human
868–879. Evolution In Press.
Baylac M, Frieß M. 2005. Fourier descriptors, Procrustes Cornette R, Baylac M, Souter T, Herrel A. 2013. Does
superimposition, and data dimensionality: an example of shape co-variation between the skull and the mandible have
cranial shape analysis in modern human populations. In: functional consequences? A 3D approach for a 3D problem.
Slice DE, ed. Modern morphometrics in physical anthropology. Journal of Anatomy 223: 329–336.
New York: Kluwer Academic Publishers-Plenum Publishers, Cornette R, Herrel A, Stoetzel E, Moulin S, Hutterer R,
145–165. Denys C, Baylac M. 2015a. Specific information levels in
Ben Arous E, Falguères C, Nespoulet R, El Hajraoui MA. relation to fragmentation patterns of shrew mandibles: do
2020a. Review of chronological data from the Rabat-Temara fragments tell the same story? Journal of Archaeological
caves (Morocco): implications for understanding human Science 53: 323–330.
occupation in north-west Africa during the Late Pleistocene. In: Cornette R, Stoetzel E, Baylac M, Moulin S, Hutterer R,
Leplongeon A, Goder-Goldberger M, Pleurdeau D, eds. Not just a Nespoulet R, El Hajraoui MA, Denys C, Herrel A.
corridor. Human occupation of the Nile Valley and neighbouring 2015c. Shrews of the genus Crocidura from El Harhoura
regions between 75 000 and 15 000 years ago, Paris, Muséum 2 (Témara, Morocco): the contribution of broken specimens
national d’Histoire naturelle (Natures en Sociétés; 3) 177–201. to the understanding of Late Pleistocene–Holocene
Ben Arous E, Falguères C, Tombret O, El Hajraoui MA, & palaeoenvironments in North Africa. Palaeogeography,
Nespoulet R. 2020b. Combined US-ESR dating of fossil teeth Palaeoclimatology, Palaeoecology 436: 1–8.
from El Harhoura 2 cave (Morocco): New data about the end of Cornette R, Tresset A, Houssin C, Pascal M, Herrel A.
the MSA in Temara region. Quaternary International 556: 88–95. 2015b. Does bite force provide a competitive advantage
Bergmann PJ, McElroy EJ. 2014. Many-to-many mapping in shrews? The case of the greater white-toothed shrew.
of phenotype to performance: an extension of the F-matrix Biological Journal of the Linnean Society 114: 795–807.
for studying functional complexity. Evolutionary Biology 41: Dumont ER, Herrel A, Medellin RA, Vargas-Contreras JA,
546–560. Santana SE. 2009. Built to bite: cranial design and function
Bookstein FL. 1996. Landmark methods for forms without in the wrinkle-faced bat. Journal of Zoology 279: 329–337.
landmarks: morphometrics of group differences in outline El Hajraoui MA, Nespoulet R, Debénath A, Dibble HL,
shape. Medical Image Analysis 1: 225–243. eds. 2012. La Préhistoire de la région de Rabat-Témara.
Boutin S, Lane JE. 2014. Climate change and mammals: Institut National des Sciences de l’Archéologie et du
evolutionary versus plastic responses. Evolutionary Patrimoine: Villes et Sites Archéologiques du Maroc. p. 300.
Applications 7: 29–41. Erickson GM, Kirk SDV, Su J, Levenston ME, Caler WE,
Brassard C, Merlin M, Guintard C, Monchâtre-Leroy E, Carter DR. 1996. Bite-force estimation for Tyrannosaurus
Barrat J, Bausmayer N, Bausmayer S, Bausmayer A, rex from tooth-marked bones. Nature 382: 706–708.
Beyer M, Varlet A, Houssin C, Callou C, Cornette R, Erwin DH. 2000. Macroevolution is more than repeated
Herrel A. 2020a. Bite force and its relation to jaw shape rounds of microevolution. Evolution & Development 2: 78–84.
in domestic dogs. Journal of Experimental Biology 223: Escudé É, Renvoisé É, Lhomme V, Montuire S. 2013. Why
jeb224352. all vole molars (Arvicolinae, Rodentia) are informative to
Brassard C, Merlin M, Monchâtre-Leroy E, Guintard C, be considered as proxy for Quaternary paleoenvironmental
Barrat J, Callou C, Cornette R, Herrel A. 2020b. How does reconstructions. Journal of Archaeological Science 40: 11–23.
© 2021 The Linnean Society of London, Biological Journal of the Linnean Society, 2021, 133, 1110–1125You can also read