Defining strawberry shape uniformity using 3D imaging and genetic mapping - Nature
←
→
Page content transcription
If your browser does not render page correctly, please read the page content below
Li et al. Horticulture Research (2020)7:115
                                    https://doi.org/10.1038/s41438-020-0337-x
                                                                                                                                                                                         Horticulture Research
                                                                                                                                                                                                     www.nature.com/hortres

                                     ARTICLE                                                                                                                                                    Open Access

                                    Defining strawberry shape uniformity using 3D
                                    imaging and genetic mapping
                                    Bo Li 1,2, Helen M. Cockerton1, Abigail W. Johnson1, Amanda Karlström1, Eleftheria Stavridou1, Greg Deakin1 and
                                    Richard J. Harrison1,3

                                      Abstract
                                      Strawberry shape uniformity is a complex trait, influenced by multiple genetic and environmental components. To
                                      complicate matters further, the phenotypic assessment of strawberry uniformity is confounded by the difficulty of
                                      quantifying geometric parameters ‘by eye’ and variation between assessors. An in-depth genetic analysis of strawberry
                                      uniformity has not been undertaken to date, due to the lack of accurate and objective data. Nonetheless, uniformity
                                      remains one of the most important fruit quality selection criteria for the development of a new variety. In this study, a
                                      3D-imaging approach was developed to characterise berry shape uniformity. We show that circularity of the maximum
                                      circumference had the closest predictive relationship with the manual uniformity score. Combining five or six
                                      automated metrics provided the best predictive model, indicating that human assessment of uniformity is highly
                                      complex. Furthermore, visual assessment of strawberry fruit quality in a multi-parental QTL mapping population has
                                      allowed the identification of genetic components controlling uniformity. A “regular shape” QTL was identified and
                                      found to be associated with three uniformity metrics. The QTL was present across a wide array of germplasm,
                                      indicating a potential candidate for marker-assisted breeding, while the potential to implement genomic selection is
                  1234567890():,;
1234567890():,;
                  1234567890():,;
1234567890():,;

                                      explored. A greater understanding of berry uniformity has been achieved through the study of the relative impact of
                                      automated metrics on human perceived uniformity. Furthermore, the comprehensive definition of strawberry shape
                                      uniformity using 3D imaging tools has allowed precision phenotyping, which has improved the accuracy of trait
                                      quantification and unlocked the ability to accurately select for uniform berries.

                                    Introduction                                                                                        Simple, classical studies, which remove all or part of the
                                      Strawberries (Fragaria × ananassa) are not true fruits.                                           achenes from undeveloped pseudocarps has led to a ces-
                                    The red fleshy pseudocarp of a strawberry is formed from                                             sation in the auxin “swelling signal” in the area beneath
                                    a swollen flower base or receptacle. The true fruits are, in                                         each achene and thus uneven fruit development2. In a
                                    fact, the achenes, which develop from a whorl of carpels                                            similar fashion to achene removal, uneven pollination of
                                    and together form an aggregate-accessory fruit. The via-                                            the carpels, or absence of achene development, are the
                                    bility of both carpels and pollen has an important role in                                          main causes of uneven pseudocarps3. Uneven successful
                                    the resulting uniformity of berries1. Carpel position,                                              pollination can be caused by damage to flowers through
                                    density and viability dictate the shape, size and uniformity                                        high temperature, frost or precipitation1. A late frost in
                                    of a strawberry. Indeed, strawberry breeders have selected                                          spring could lead to carpel and other damage, resulting
                                    for high carpel densities in order to produce larger fruits1.                                       not only in malformation but also complete lack of
                                                                                                                                        strawberry development1. Strawberry flowers have a
                                                                                                                                        variable proportion of viable carpels and anthers between
                                    Correspondence: Bo Li (bo2.li@uwe.ac.uk)
                                    1
                                                                                                                                        flower orders, both within a plant and also between dif-
                                     NIAB EMR, East Malling, Kent ME19 6BJ, UK
                                    2                                                                                                   ferent cultivars4,5. Indeed, primary fruit are more likely to
                                     University of the West of England, Bristol BS16 1QY, UK
                                    Full list of author information is available at the end of the article
                                    These authors contributed equally: Bo Li, Helen M. Cockerton

                                    © The Author(s) 2020
                                                        Open Access This article is licensed under a Creative Commons Attribution 4.0 International License, which permits use, sharing, adaptation, distribution and reproduction
                                                        in any medium or format, as long as you give appropriate credit to the original author(s) and the source, provide a link to the Creative Commons license, and indicate if
                                    changes were made. The images or other third party material in this article are included in the article’s Creative Commons license, unless indicated otherwise in a credit line to the material. If
                                    material is not included in the article’s Creative Commons license and your intended use is not permitted by statutory regulation or exceeds the permitted use, you will need to obtain
                                    permission directly from the copyright holder. To view a copy of this license, visit http://creativecommons.org/licenses/by/4.0/.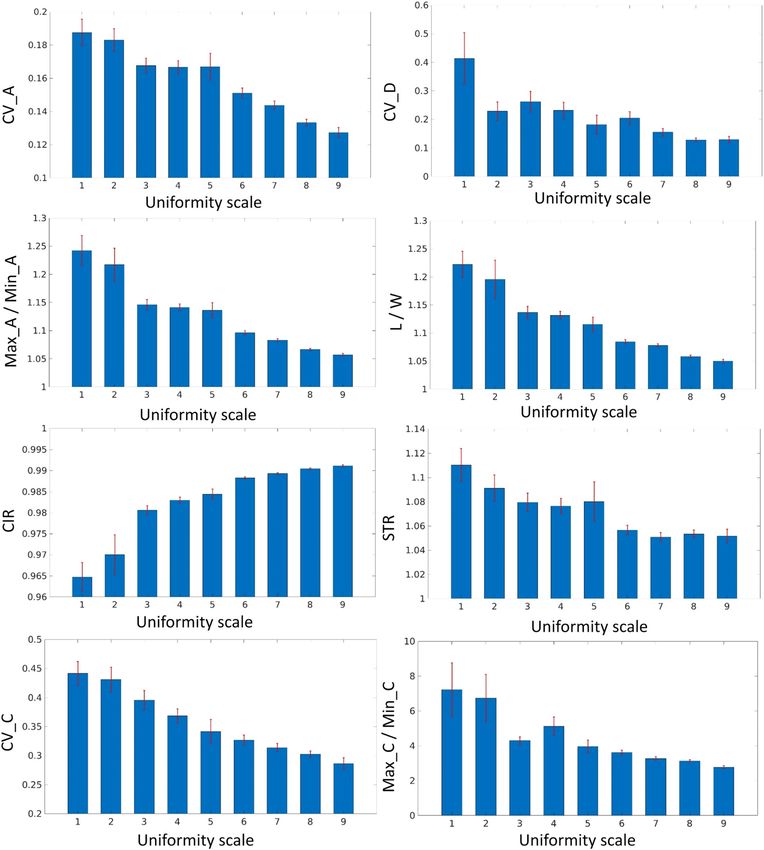
Li et al. Horticulture Research (2020)7:115                                                                           Page 2 of 13

be malformed due to the relatively lower quantities of               previous study25. With the 3D point cloud reconstructed
viable anthers and pollen6,7.                                        based on the Structure from Motion (SfM) method26,
  In spite of the environmental factors known to influence            basic size-related parameters have been measured in three
uniformity, literature has shown that strawberry uni-                dimensions allowing volume estimation with high accu-
formity still has a large genetic component and can be               racy27. Compared with shape and size evaluation, uni-
improved through breeding8,9. Indeed, where breeders                 formity is a multidimensional trait, therefore it is not
have selected for increased uniformity within and among              possible to quantify through 2D image analysis with a
berries, improvements in uniformity were observed over               single viewing angle. The application of 3D image analysis
time8. Cultivars have been shown to differ in their sus-             for phenotyping the external qualities of fruit has not been
ceptibility to misshapen fruit, indicating a significant              sufficiently explored, and the basic, previously char-
genetic component controlling uniformity1,8,10. For                  acterised, shape- and size-related parameters are not
example, ‘Florida Elyana’ is susceptible to rain damage,             adequate for understanding uniformity.
disrupting carpel development and thus misshapen fruit                 Here the application of a 3D phenotyping platform
leading to lower market value9, similarly ‘Camarosa’ has             allows us to investigate the genetic basis of strawberry
been noted as a cultivar, which is particularly susceptible          shape uniformity. The 3D image analysis software
to misshapen fruit with ~4% of yields lost as a result of            leverages the previously developed platform25 in order to
misshapes10,11. By contrast, ‘Florida Radiance’ has high             define eight new external variables and investigate their
marketable yields and does not exhibit a high proportion             importance on manual uniformity assessment. This
of misshapen fruits9. Breeders can influence the propor-              method was applied to a multi-parental strawberry map-
tion of uniform strawberries through selecting—be it                 ping population in order to quantify the genetic compo-
directly or indirectly—for (1) even allocation of viable             nents underpinning strawberry uniformity.
carpels across the receptacle within the flower (2) ready
access to pollen within flowers and (3) high fertility of             Materials and methods
carpels ensuring even successful pollination.                        Plant material and experimental set-up
  Strawberry is an important fruit crop with a global pro-             A multi-parental strawberry population was generated
duction of 9.25 million tonnes in 201712. Producing visually         through crossing 26 diverse cultivars and breeding lines to
appealing strawberry fruit is one of the primary objectives in       create a population of 416 genotypes made up of 26
a strawberry breeding programme13. Shape uniformity is an            crosses each containing up to 16 individuals (Supple-
essential trait of strawberry fruits due to the direct association   mentary Fig. 1). The progenitors were crossed in March
with product quality and value14. Increasing the uniformity of       2016, seed was germinated in June 2016, experimental
berries can increase the proportion of marketable fruit as           plants were pinned down in July–August 2017 and cold
berry irregularity is one of the primary imperfections leading       stored from January to June 2018. Progenitors were
to culling and reduced marketable yield8.                            selected to represent diversity across multiple fruit quality
  As there are no well-defined strawberry phenotyping                 traits. Twelve replicate runner plants were pinned down
guidelines for fruit uniformity, the current system used in          from each genotype into 9 cm square pots containing
the strawberry breeding programmes at NIAB EMR relies                compost. Clonal plants were separated from parental
on visual assessments, which are subjective and laborious.           plants and then placed in cold storage (−2 °C) until the
Unlike morphological traits such as length, volume and               start of the experiment. Plants were potted into 2 L pots
colour, which can be accurately measured manually in a               containing coir and fertigated at 1 kg L−1 (rate: 10 s every
low-throughput manner, uniformity assessment is extre-               45 min) using Vitex Vitafeed (N:P:K, 176:36:255). The trial
mely subjective. As there is no quantitative method of               was located at NIAB EMR, Kent, UK (51° 17′ 24.202″ N 0°
generating phenotypic data for uniformity, the genetic               26′50.918″ E). Two 150 m polytunnels with standard
determinants of strawberry uniformity are still unknown.             luminescence ‘3 year plastic’, 150 micron covers; external
  Computer vision has shown great potential to quantify              temperatures were: June 16(±4) °C, July 16(±4) °C, August
external fruit quality and 2D imaging has been success-              18(±4) °C, September 15(±4/3) °C and October 16(±3) °C.
fully implemented to measure the shape and size of fruits            Pots were arranged in a randomised blocks design on the
such as strawberries15, apples16, watermelon17, cherries18           two central most gutters, pots were held in place using
and mangos19. Basic shape traits such as length, width,              wire and cable ties. Due to the large scale of the experi-
aspect ratio and volume, and more sophisticated traits               ment, replicate blocks were set up at intervals, plants were
such as elliptic Fourier descriptors20 have been quantified           removed from the cold store on the following dates: block
and used to describe variation in fruit quality. 3D imaging          1—29th May; block 2—20th June, block 3—2nd July,
has been successfully used for phenotyping the crop                  block 4—23rd July, block 5—1st August. A Natupol
canopy21,22 and root architecture23,24, and a 3D straw-              Koppert bumble bee hive was added into each polytunnel
berry phenotyping platform has been explored in our                  to assist even pollination. Where possible, three
Li et al. Horticulture Research (2020)7:115                                                                                   Page 3 of 13

                                                                           imaging platforms allowed concurrent imaging of repli-
                                                                           cate berries. The 3D reconstruction was implemented
                                                                           with Agisoft Photoscan (Agisoft, LLC, St. Petersburg,
                                                                           Russia), and in order to increase the accuracy and pro-
                                                                           cessing speed, all images were pre-processed by cropping
                                                                           to a smaller size (400 × 600 pixels). Background subtrac-
                                                                           tion was achieved through arbitrary colour thresholding.
                                                                           The image processing software for webcam control and
                                                                           automated image pre-processing were written in C++
                                                                           utilising the OpenCV Library25,29.

                                                                           Data processing pipeline of phenotypic trait extraction
                                                                           Point cloud pre-processing
                                                                             In the pre-processing stage (Fig. 1), each point cloud model
                                                                           was converted from the colour space of RGB (red, green and
                                                                           blue) to HSV (hue, saturation and value). Arbitrary thresh-
                                                                           olding on the hue channel was used to remove the noise
                                                                           introduced in the reconstruction stage. The clean point cloud
 Fig. 1 Point cloud pre-processing for strawberry body extraction,
 translation to origin of xyz coordinate system and size standardisation
                                                                           was translated to the origin of the 3D coordinate system
                                                                           based on the distance between the moment of the point
                                                                           cloud and the origin. By calculating the eigenvector asso-
strawberries per plant were picked when ripe into egg                      ciated with the largest eigenvalue of the coordinates of points,
boxes. The phenotyping took place over a single season in                  a rotation matrix could be derived to represent the main
2018. Picking for block one began on 11th July 2018 and                    orientation of the point cloud, which can be used to rotate
picking for block 5 finished on 8th November 2018. Boxes                    the point cloud with the main orientation aligned with the z
were labelled with QR codes to assist tracking of geno-                    axis. After rotation, the arbitrary threshold was applied again
types. Strawberry shape uniformity was scored for indi-                    on the hue channel in order to segment the strawberry body
vidual berries on a scale from 1 (completely irregular and                 and blue holder from the whole point cloud. The height of
undulating fruit surface) to 9 (complete 3D uniformity                     the holder was obtained by calculating the difference
around the central axis) with extensive training provided                  between the maximum and minimum values of the holder
for all assessors. Strawberry shape was allocated into 9                   point cloud on the z axis. As the original coordinate system
categories: globose, globose-conic, conic, long-conic, bi-                 generated by SfM method has an arbitrary scale, each point
conic, conic-wedge, wedge, square and miscellaneous,                       cloud model needed to be standardised by the height of the
strawberry shape categories were based on the definitions                   holder, so that the sizes of all point clouds are comparable.
provided by strawberry breeders at NIAB EMR, some of
these categories have been described before15. Manual                      Shape uniformity-related trait measurements
uniformity and shape scores were recorded in the field                        Eight uniformity-related traits were calculated from the
book app 28, the QR scanning feature allowed quick access                  point cloud data of the strawberry body after pre-
to the correct entry form.                                                 processing. These are:
                                                                             Coefficient of variation (CV) of side view areas (CV_A)
3D reconstruction                                                          and the ratio between maximum and minimum side view
  The 3D imaging platform was a modified version of that                    area (Max_A/Min_A). All side views should be identical
developed by He et al.25. Strawberry fruit were placed in                  in a perfectly uniform strawberry. In order to eliminate
the middle of a turntable, on a dark blue holder made by                   the heterogeneity introduced from the calyx and the
polymeric foam (38 mm × 19 mm × 19 mm; height, length                      holder, only the points within the middle 50% of the body
and width). Unlike the previous study, a webcam (Logi-                     height of each point cloud were retained for analysis (Fig.
tech C920, Newark, CA, USA) was fitted at a height of                       2). In order to understand the heterogeneity of different
30 cm and horizontal distance of 25 cm away from the                       side views of a point cloud, each point cloud was rotated
sample. QR codes on containers were scanned through                        along the z axis by 3.6° for 99 rotations, and after each
the webcams allowing tracking of berries and automated                     rotation, the side view of the point cloud was projected
labelling of image files. The imaging rig was placed inside                 onto the x–z plane in 2D (labelled in white). A convex hull
a photography studio tent with constant LED illumina-                      was fitted to each projected image and the contour area
tion. The turntable rotated at a frequency of 50 s per full                was calculated. For area metrics, two traits were obtained;
turn, and an image was captured every second. Six                          the CV of side view areas (CV_A) and the ratio between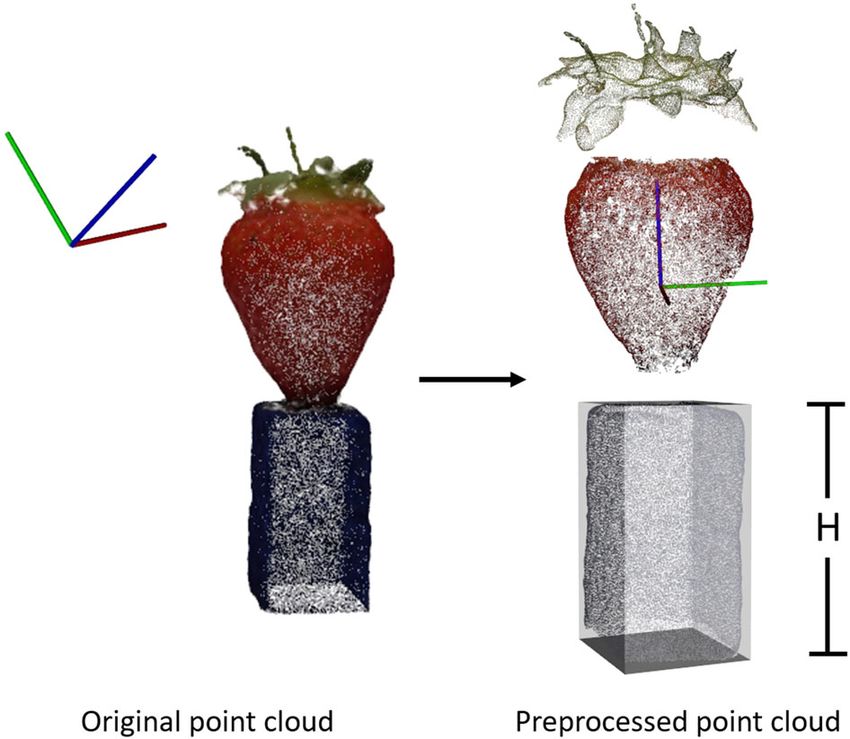
Li et al. Horticulture Research (2020)7:115 Page 4 of 13
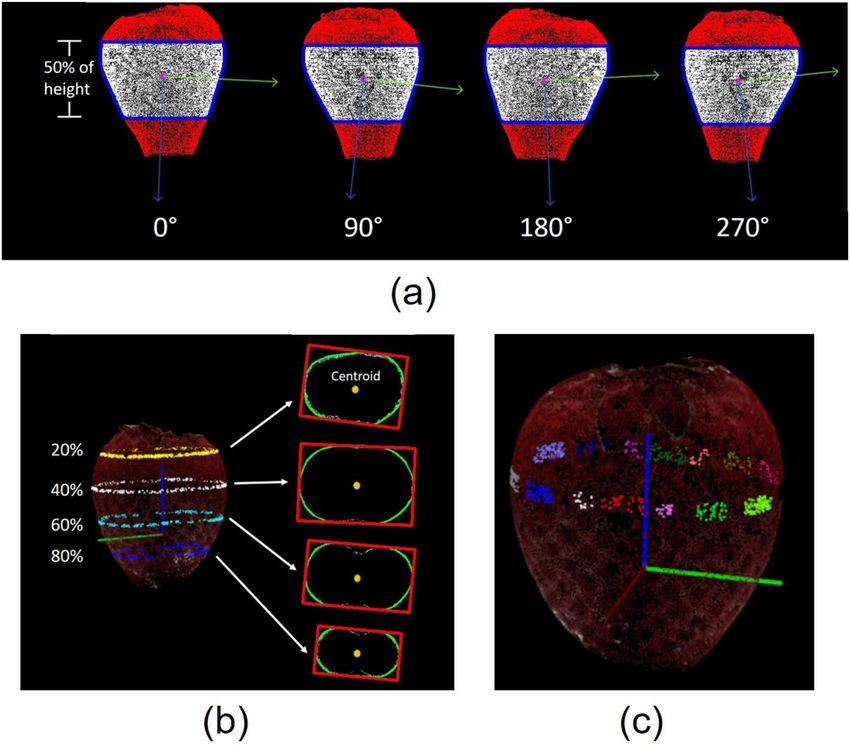
Fig. 2 Side view of strawberry body for the CV measurement of the area and principal orientations. Convex hulls are outlined in blue, and
blue and green arrows indicate the principal orientations (a). Extraction of example slice images horizontal to x–y plane at the height of 20%, 40%,
60% and 80% of the total height. A minimum bounding box is fitted to each slice image (b). Sixteen patches of points labelled in different colours for
curvature estimation (c)
the maximum and minimum area (Max_A/Min_A). An Circularity of the maximum circumference (CIR).
ideal uniform strawberry will have a value of zero for Visually, the circularities of the contours in horizontal
CV_A and one for Max_A/Min_A. slice images are high if the strawberry is uniform. Circu-
CV of principal orientations (CV_D). The major eigen- larity (CIR) was calculated as previously described30:
vector indicating the main orientation was calculated by
principal component analysis (PCA) for all 100 side view 4πA
C¼ ;
projected images, and the heterogeneity of the orientations of p2
the projected images was quantified by calculating the CV of where A and p are the area and perimeter of the convex
angles of the main orientation. Like CV_A, a perfectly uni- hull respectively. For each point cloud, the circularity was
form strawberry will have a value of zero for CV_D. calculated for the slice image with largest contour area.
Aspect ratio of the minimum bounding box (L/W). A Straightness of centre axis (STR). The coordinates of the
lateral slice image was obtained by identifying the inter- centroids for each horizontal slice image can be located by
section between the plane in parallel with the x–y plane calculating the moment of the contour. The centroids can
and point cloud (Fig. 2b). Based on the values on the z be connected as a straight line for a uniform strawberry.
axis, 100 evenly spaced slice images were obtained. The The centroids were calculated for all the slice images
slice image with the largest contour was obtained by within the middle 80% of the body height, and the
calculating the contour area of the convex hulls for all straightness of the central axis was characterised by:
slice images. The principal orientation of the contour was
PN1
identified by the eigenvectors of the first two principal di
components. With calculating the centroid of the con- STR ¼ i¼1
;
D
tour, a bounding box could be computed along the where N (N = 80) is the number of slice images used for
principal orientation. The ratio between the length and the analysis, di is the Euclidean distance between
width of the bounding box was derived and the ratio neighbouring slice images, and D is the Euclidean distance
should be one for a perfectly uniform fruit. between the centroids of the top and bottom slice images.Li et al. Horticulture Research (2020)7:115 Page 5 of 13
CV of curvature and the ratio between maximum and and a call threshold of 0.01. A total of 18,790 markers
minimum curvatures (Max_C/Min_C). The principal were found to segregate across the multiparental popu-
curvature can be calculated for each point in the point lation. Crosslink was used to generate linkage maps—a
cloud, which describes how much the curve deviates from programme developed specifically for polyploid plant
a straight line at this point. It can be imagined that the 3D species37. A total of 34,949 markers were used to generate
curve can be sliced orthogonally around the direction of the consensus map. The map orders from 5 populations
normal in to 2D curve, and the maximum curvature k1 were combined to make the consensus map as detailed in
and minimum curvatures k2 are the two principal curva- the study of Cockerton et al.38 Fragaria × ananassa
tures for the 3D curve31. The average curvature k, which is chromosome number is denoted by 1–7 and the sub-
defined as the mean value of the magnitudes of principal genome number is represented by A–D as specified in
curvatures in the two main directions was applied to ref. 39.
quantify the curvature for a given point. As the curvature
measurement is sensitive to noise, the point cloud surface Genetic analysis
of strawberry body was first smoothed by using Moving The best linear unbiased estimate (BLUE) was calcu-
Least Squares (MLS) method32, which could reconstruct a lated for all genotypes in order to correct for the influence
smooth surface from the noisy point cloud. Sixteen pat- of assessor, data and block, estimated scores were
ches of the points were selected evenly from the points weighted by replicate number. Linear mixed-effects
forming the largest slice in parallel with the x–y plane models were generated for each phenotypic trait with
(Fig. 2c). For each patch, the first half of the largest cur- and without covariates. Grand scores for each genotype
vatures were averaged and used to represent the curvature were calculated using mixed models to account for sig-
of the patch. With the curvatures of all 16 patches, the CV nificant covariates. Broad-sense heritability (H2) was cal-
of curvature (CV_C) and the ratio between maximum and culated using mixed model output parameters generated
minimum curvatures (Max_C/Min_C) were calculated. through the asreml function in the statistical package
ASReml-R version 4.1.0.10640, whereby H2 = VG/VP,
Statistical analysis where VG is the genotype variance and VP is the total
Ordinal regression phenotypic variance. Narrow sense heritability was cal-
Statistical analysis was performed using R (version 3.5.1) culated using the vpredict function in ASReml-R h2 = VA/
and the Genstat statistical package (Version 13.0, VSN VP, where VA is the additive genotypic variance.
International Ltd. England). Differences in uniformity
traits within each shape groups were distinguished using Genomic prediction
ANOVA and Tukey post-hoc test. Pearson coefficients of A genetic additive relationship matrix was calculated for
correlation were calculated between all proposed the population using r package snpReady41. Genetic best
uniformity-related traits. As the group labels are ordinal linear unbiased prediction (GBLUP) was performed using
dependent variables, ordinal regression was used to the statistical package ASReml-R version 4.1.0.10640. 75%
evaluate the performances of all traits33. Model fit was of genotypes were used as the ‘training’ population to
ascertained by using selection criterion values based on predict the phenotype of the remaining 25% of genotypes
the Akaike Information Criterion (AIC) and the Bayesian used as the ‘test’ population, as advised by Erbe et al.42.
Information Criterion (BIC). In general, a better model fit Phenotype was weighted by the number of replicates.
generates lower values for both AIC and BIC34. In order Predictive ability (PA) was defined by the correlation
to identify the optimal variable combination related to between the predicted and actual phenotypic score for the
manual assessment, stepwise AIC and BIC methods were test population over 10 cross validation events, thus
applied35. The most significant variable was identified by allowing us to determine the PA of the model. Prediction
comparing the criterion values of all models. Other vari- accuracy (PAC) was calculated by PAC = PA * √H2 as
ables were added successively and retained if the model fit detailed in Gezan et al.43.
was improved.
Composite interval mapping
Genotyping and linkage map Multi-parental QTL mapping was conducted in R using
DNA was extracted for each genotype from unopened package “mppR”44. A permutation test determined the
leaflets using the Qiagen DNeasy plant mini extraction kit. significance threshold45. A two-step QTL analysis was
Genotyping was conducted using the Axiom® IStraw35 implemented: the selection of cofactors was achieved
384HT array36 (i35k). Marker curation was undertaken through Simple Interval Mapping (SIM) proceeded by a
using the Affymetrix analysis power tools software and multi-QTL model search using composite interval map-
the SNPpolisher R package, parameters were 0.8 for ping (CIM)46,47. As a multi-parent population CIM works
minimum dish quality control, 96% minimum call rate on parent relationships. Therefore the ‘FA2654’ ×Li et al. Horticulture Research (2020)7:115 Page 6 of 13
‘FA8752’ cross was removed as it is not directly related an important region in Max_A/Min_A, CV_C and CIR
through the parental cultivar network. All other crosses uniformity traits. Global adjusted R2 values for all QTL in
were interrelated and formed a single network (Supple- linear models were between 3.16 and 38.89 indicating the
mentary Fig. 1). proportion of variation explained by identified QTLs (Table
5). The maximum variation explained by a single QTL is
Results 10.96% (Table 4). All uniformity traits apart from CV_A were
Characterisation of uniformity-related traits significantly affected by date of picking. CV_D had the largest
All the uniformity-related traits were calculated based broad-sense heritability score of 64.1 and narrow sense
on the point cloud. The mean values and the standard heritability of 51.4 (Table 5).
errors for each visual uniformity class are presented in Fig.
3. ANOVA results showed that significant differences Discussion
were observed between uniformity classes for all traits (p We report for the first time a robust method to measure
< 0.001). The Pearson’s linear correlation coefficients were strawberry shape uniformity and apply this technique to
calculated between all traits, and strong correlations were generate genetic markers for uniformity traits. Several
found amongst Max_A/Min_A, L/W and CIR (Table 1). studies have attempted to quantify strawberry fruit shape
Ordinal regression models were constructed for all vari- using 2D images with neural networks48, 3D imaging49
ables and each variable independently. L/W was not sig- and by machine learning15. However, none of these stu-
nificant due to the high correlation with other variables and dies investigated berry uniformity. Unlike the aforemen-
CIR showed the best model fit with the lowest AIC and BIC tioned studies, who measure a relatively small number of
values (Table 2). New variables were added sequentially to genotypes intensively, we have implemented a high-
the model until no further improvement of the criterion throughput imaging platform across a large population
value was observed. The AIC- and BIC-based stepwise to facilitate genetic analysis of the trait. Although straw-
selection methods showed inconsistent results (Table 3). The berry shape has received greater attention in the litera-
AIC-based method showed the optimal criterion value with ture, in our opinion berry uniformity is a more important
all variables except L/W and Max_C/Min_C, but BIC-based trait for a breeder to improve.
method showed that STR could not improve the model fit. In current strawberry breeding practice, there are no
widely accepted criteria for quantifying uniformity due to the
The influence of shape on uniformity difficulty of defining a multidimensional trait. Here, the
The shape of a strawberry influences the uniformity trait manual strawberry uniformity scale has been designed by
score. Bi-conic strawberries were seen to have high uni- NIAB EMR breeders. As such, the absence of a straightfor-
formity based on the area overlap measures (CV_A & ward definition, has meant that it has not been possible to
Max_A/Min_A), L/W and CIR scores indicating bi-conic study the genetic components controlling strawberry uni-
strawberries have consistently circular horizontal transects at formity in the past. To overcome this, we have used 3D
the middle point. Whereas for curvature uniformity mea- image analysis to define the parameters underlying a bree-
sures (CV_C & Max_C/Min_C), globose fruit are the most der’s perception of strawberry uniformity. The original 3D
uniform and miscellaneous fruit the least (data not shown). strawberry phenotyping system25 could accurately measure
Both the manual uniformity score and CIR could dis- basic size-related traits. In this study, the point cloud analysis
criminate miscellaneous shapes from the other shape cate- software was further developed to quantify strawberry uni-
gories (Fig. 4). formity through eight proposed metrics. By comparing with
the manual scale, the image processing pipeline has
Genomic prediction demonstrated an objective method of characterising straw-
Prediction accuracy values varied between 0.05 and 0.32 berry uniformity components.
(Table 5). Unsurprisingly, traits with low narrow sense her-
itability such as CV_A also show a low predictive ability as Quantifying berry uniformity
the model is based on additive variance (Table 5). CIR, a trait, Circularity of the maximum circumference (CIR) of
which may be considered a valuable trait for a breeder strawberries showed the best predictive ability for manual
exhibited a relatively high prediction accuracy of 0.29. uniformity scores based on the ordinal regression model
fit, when studying individual variables alone. A completely
QTL identification misshapen fruit with a severely undulating fruit surface
A total of 23 QTL were found to be associated with uni- will score a value of 1 for manual assessments, and these
formity traits (Table 4). Of which 20 were detected in more completely misshapen fruits were the easiest category to
than one progenitor. Five focal SNP’s, on chromosome 2B identify by eye, as they were clearly distinct from regular
and 5D were found to represent more than one trait (Table 4, shapes. A low CIR value appears to represent the undu-
Fig. 5). The same focal SNP AX.166521293 was identified as lating misshapen and “miscellaneous” fruit (Fig. 4).Li et al. Horticulture Research (2020)7:115 Page 7 of 13 Fig. 3 Mean value and standard error of calculated uniformity-related traits by the newly developed 3D image analysis software against defined uniformity scale based on manual assessment Miscellaneous berries are the most undesirable fruit shape indicate that there are multiple uniformity components category therefore it is highly beneficial to select against influencing the manual uniformity score. them. When multiple traits are combined to describe uniformity, the best fitting model required the combina- Misshapen fruit QTL tion of CIR, CV_A and Max_A/Min_A, CV_D and CV_C. One of the QTL represented by the focal marker The five factors required for optimal model construction AX.166521293 on chromosome 2B was found to be
Li et al. Horticulture Research (2020)7:115                                                                                   Page 8 of 13

Table 1 Pearson’s linear correlation coefficients among all uniformity-related traits

                          CV_A                Max_A/Min_A             CV_D      L/W         CIR          STR      CV_C        Max_C/Min_C

CV_A                        1.00
Max_A/Min_A                 0.61               1.00
CV_D                        0.13               0.29                    1.00
L/W                         0.54               0.90                    0.27      1.00
CIR                       −0.48               −0.85                   −0.32     −0.85         1.00
STR                         0.12               0.26                    0.06      0.26       −0.29        1.00
CV_C                        0.21               0.24                    0.07      0.23       −0.25        0.15     1.00
Max_C/Min_C                 0.17               0.20                    0.15      0.17       −0.27        0.10     0.57        1.00

All values are significant at p < 0.05 level

Table 2 Summary of individual ordinal models and                                Uniformity trait selection
variable significance of ordinal model with all variables,                         The trait L/W shows little improvement on the overall
toward prediction of manual assessment uniformity scores                        combined trait model fit due to the high correlation with
                                                                                other traits including Max_A/Min_A and CIR, but it was
Model                LogLik           AIC             BIC       Signif. codes
                                                                                still a good predictor of uniformity based on the model fit
CIR                  −1691.82         3401.65         3445.35   ***             when studying individual variables alone. AIC- and BIC-
                                                                                based stepwise feature selection showed disagreement on
Max_A/Min_A          −1707.44         3432.89         3476.85   ***
                                                                                the selection of the STR parameter. The difference
L/W                  −1742.98         3503.96         3547.66                   between calculating AIC and BIC is that AIC does not
CV_A                 −1790.55         3599.09         3642.79   ***             account for the sample size, so when sample number is
CV_C                 −1824.20         3666.41         3710.11   ***             large, BIC applies larger penalty for complex models and
                                                                                leads to a simpler model50. However, this study does not
Max_C/Min_C          −1839.63         3697.25         3740.95   *
                                                                                aim to identify the optimal feature combination to
CV_D                 −1857.94         3733.87         3777.57   ***             develop prediction model related to manual uniformity
STR                  −1861.85         3741.70         3785.39   *               evaluation, but develop a new image-based quantification
*p < 0.05
                                                                                to replace the manual scale, because the ground-truth
**p < 0.01                                                                      data are subjective and as such any large bias can reduce
***p < 0.001
                                                                                the robustness of model development. Moreover, the
                                                                                manual scale cannot be considered a comprehensive
                                                                                assessment as the parameter STR cannot be visually
                                                                                evaluated by eye. However, it must be said that if a trait
associated with CIR, this QTL was also associated with                          cannot be detected by the human eye, then it is not a
CV_C and Max_A/Min_A, each of which were found in                               valuable trait for a strawberry breeder to select upon.
the best fitting model used to describe the manual uni-
formity score. The focal SNP AX.166521293 was found to                          Limitations of the system
be present and significant in six progenitors and had an                           The 3D point cloud analysis software is independent of
effect size of 10.96% on Min_A/Max_A. Therefore, this                           the imaging acquisition system, and the uniformity-
marker is a potential candidate for marker-assisted                             related traits can be extracted automatically in a high-
breeding in selection against completely misshapen and                          throughput manner. However, the imaging collection
irregular strawberries. Furthermore, this work has high-                        throughput was 50 s per fruit and the 3D reconstruction
lighted a region of interest for further study to pinpoint                      has to be performed separately, which limits use to pre-
the causative allele associated with reduced uniformity.                        breeding experiments. Due to the occlusion from the
Dissecting the contribution of genetic and environmental                        viewing angles, the strawberry nose cannot be fully
components believed to underpin strawberry uniformity;                          reconstructed especially for globose-shaped fruit, which
susceptibility to heat stress, carpel and pollen viability,                     decreases the accuracy of STR measurements and also
achene position, size and distribution1 may help to further                     limits the study on automated shape classification. To
elucidate the mechanism of uniformity segregating in the                        increase the throughput and accuracy of 3D phenotyping,
multiparental population.                                                       it is necessary to further develop the hardware with
Li et al. Horticulture Research (2020)7:115 Page 9 of 13 Table 3 Model comparison values for uniformity metrics, toward prediction of manual assessment uniformity scores based on AIC and BIC Model 1 2 3 4 5 6 7 8 CIR x x x x x x x x Max_A/Min_A x x x x x x x L/W x CV_A x x x x x CV_C x x x x Max_C/Min_C x CV_D x x STR x AIC 3401.65 3374.40 3374.29 3362.57 3302.01 3299.53 3291.87 3288.40 BIC 3445.35 3422.95 3427.70 3415.97 3360.28 3362.65 3354.99 3356.38 Fig. 4 Circularity of the maximum circumference (CIR) scores for each manually classified strawberry shape category. Letters denote significant differences between categories. Error bars are standard errors of the mean multiple cameras to allow more viewing angles or a Genetic control of fruit quality structured light-based imaging system with a robotic arm, Papers detailing strawberry fruit quality QTL report and also integrate the hardware driver with 3D recon- genetic alleles associated with multiple fruit quality struction software. The current point cloud image analysis traits including fresh weight, metabolites, external col- software was able to characterise many key external traits, our and firmness51,52, however, there are currently no which are important for strawberry breeding, however, papers, which report QTL associated with strawberry the measurement of other parameters such as achene uniformity. Here, we provide a phenotyping platform, density must be investigated through an improved phe- which has facilitated the assessment of the genetic notyping platform in future studies. components underlying strawberry uniformity for the
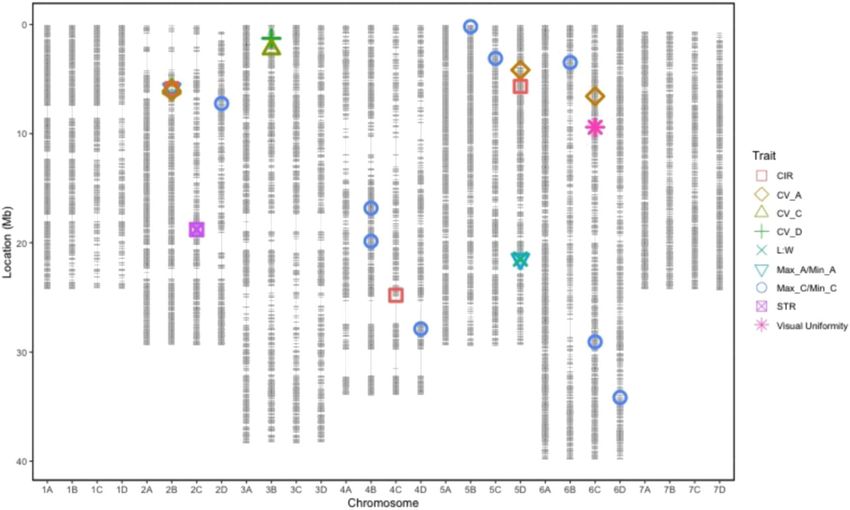
Li et al. Horticulture Research (2020)7:115                                                                                                    Page 10 of 13

Table 4 Focal SNPs representing strawberry uniformity QTL

Marker names                    Chromosome                      Pos Mb                   Log10 p-value                   R2                    Trait

AX.166508140                    6C                               9.41                    3.50                             6.14                 Man Uni
AX.166521303                    2B                               6.12                    4.10                             8.70                 CV_A
AX.89788547                     5D                               4.17                    4.09                             7.66                 CV_A
AX.166525798                    6C                               6.57                    3.22                             6.02                 CV_A
AX.166521293                    2B                               5.88                    4.98                            10.96                 Max_A/Min_A
AX.123361697                    5D                              21.49                    3.07                             3.54                 Max_A/Min_A
AX.89786014                     3B                               1.27                    4.14                             5.45                 CV_D
AX.123361697                    5D                              21.49                    3.26                             3.62                 L:W
AX.166521293                    2B                               5.88                    3.25                             5.88                 CIR
AX.166509340                    4C                              24.79                    3.22                             4.88                 CIR
AX.166515018                    5D                               5.67                    3.18                             5.01                 CIR
AX.166519032                    2C                              18.80                    3.21                             5.44                 STR
AX.166521293                    2B                               5.88                    3.55                             6.25                 CV_C
AX.166527443                    3B                               2.26                    3.03                             4.97                 CV_C
AX.123357183                    2D                               7.24                    3.00                             2.79                 Max_C/Min_C
AX.89863591                     4B                              16.83                    3.23                             2.45                 Max_C/Min_C
AX.166513592                    4B                              19.86                    3.68                             3.76                 Max_C/Min_C
AX.166523206                    4D                              27.87                    4.77                            10.49                 Max_C/Min_C
AX.166514922                    5B                               0.20                    4.00                             7.20                 Max_C/Min_C
AX.166524180                    5C                               3.10                    3.19                             6.35                 Max_C/Min_C
AX.166525020                    6B                               3.48                    3.50                             8.10                 Max_C/Min_C
AX.89797337                     6C                              29.06                    3.06                             4.90                 Max_C/Min_C
AX.123525503                    6D                              34.17                    3.05                             0.64                 Max_C/Min_C

The position of QTL is reported in Mb as scaled to the vesca version 4 genome. Bold text represents focal SNPs associated with more than one uniformity trait

first time. The use of a multi-parental population has                             Genetic control of strawberry fruit shape
allowed the study of a diverse set of germplasm and has                             Unlike uniformity the mechanism controlling fruit
ensured that resulting QTL have a greater relevance for                           shape has been studied extensively in the wild strawberry;
breeders when compared to alleles identified in bi-                                Fragaria vesca and may act as a surrogate model for the
parental studies. Furthermore, implementation of an                               cultivated octoploid strawberry Fragaria × ananassa. In F.
additive genomic selection model indicates that straw-                            vesca, fruit shape is primarily controlled by phyto-
berry shape uniformity—particularly CIR may be                                    hormones53,54. Auxin increases the width of fruit and by
somewhat improved using a genomic selection                                       contrast gibberellic acid (GA) increases the length of a
approach. Overall, 20 of the QTL were found to have an                            strawberry, whereas abscisic acid (ABA) down regulates
effect on uniformity in more than one of the 26 pro-                              both auxin and GA and thus reduces fruit expansion53,54.
genitors indicating that there has been limited linkage                           GA-deficient F. vesca mutants were found to have a
decay between the causal allele and marker, and that the                          “short” or globose berry shape, which, through the
relationships have been maintained across generations.                            application of GA to the berry, could be restored to result
Furthermore, the QTL on chromosome 2B was observed                                in a “long” or long-conic fruit shape54.
three times across different uniformity traits, such traits                         It is clear that breeders wish to select for greater berry
are only partially correlated and thus describe discrete                          uniformity however the confounding relationship
components, as such this allele can be seen to have a                             between shape and uniformity must also be considered.
major role in uniformity.                                                         For example, square, wedge and wedge-conic strawberries
Li et al. Horticulture Research (2020)7:115                                                                                                          Page 11 of 13

  Fig. 5 Location of QTL on the octoploid consensus map scaled to the Fragaria vesca ‘version four’ genome. Horizontal grey lines represent
  iStraw-35k axiom array markers

Table 5 Broad-sense heritability (H2) and narrow sense heritability (h2) across the multiparental population for
automated uniformity trait scores

Trait              H2      h2       Sig. of block     Sig. of date      GxE      No. of QTL      R2        R2 adj     Prediction accuracy        Prediction ability

STR                0.44    0.09     ***               ***               ***      1                 5.44     4.99      0.10                       0.07
CIR                0.50    0.16     ***               ***               ***      3               16.4      15.19      0.29                       0.19
CV_D               0.64    0.51     ***               ***               ***      1                 5.45     5.01      0.32                       0.20
CV_A               0.36    0.02     NS                NS                ***      3               19.54     18.27      0.05                       0.02
CV_C               0.44    0.11     ***               ***               ***      2               11.08     10.17      0.17                       0.13
L/W                0.50    0.15     ***               **                ***      1                 3.62     3.16      0.15                       0.11
Max_C/Min_C        0.40    0.06     NS                *                 NS       9               41.74     38.89      0.20                       0.11
Max_A/Min_A        0.49    0.14     **                ***               ***      2               14.22     13.4       0.19                       0.10
Uniformity         0.43    0.09     NS                ***               ***      1                 6.14     5.68      0.20                       0.06

The impact of block, date and genome by environment interactions (GxE) on uniformity trait scores; represented through significance values of ANOVA tests
comparing mixed models. p-values are denoted by stars: ***
Li et al. Horticulture Research (2020)7:115                                                                                                                 Page 12 of 13

some traits were found to have a higher heritability than                             Conflict of interest
manual uniformity. These values indicate the proportion                               The authors declare that they have no conflict of interest.

of variation segregating in the study population, however                             Supplementary Information accompanies this paper at (https://doi.org/
improvement in the heritability may also be caused, in                                10.1038/s41438-020-0337-x).
part, by more accurate phenotypic measurements. In
particular, high heritability was observed for CV_D, which                            Received: 10 February 2020 Revised: 25 April 2020 Accepted: 17 May 2020
indicates the angle of a strawberry related to whorl of
carpels (Table 5) is under strong genetic control. Date of
picking was seen to have a significant impact on all uni-
                                                                                      References
formity metrics apart from CV_D, which had a large                                     1. Carew, J. G., Morretini, M. & Battey, N. H. Misshapen fruits in strawberry. Small
genetic component. The high significance of date indi-                                      Fruits Rev. 2, 37–50 (2003).
cates the developmental environmental conditions have a                                2. Nitsch, J. P. Growth and morphogenesis of the strawberry as related to auxin.
                                                                                           Am. J. Bot. 37, 211 (1950).
significant impact on strawberry uniformity. Extreme                                    3. Kronenberg, H. G., Braak, J. P. & Zeilinga, A. E. Poor fruit setting in strawberries.
temperatures were observed during the experiment,                                          Ii. Euphytica 8, 245–251 (1959).
which may have caused the significance of date. All traits                              4. Thompson, P. A. Environmental effects on pollination and receptacle devel-
                                                                                           opment in the strawberry. J. Hort. Sci. 46, 1–12 (1971).
apart from CV_C showed a significant genotype by                                        5. Darrow, G. M. The importance of sex in the strawberry. J. Heredity 16, 193–204
environment interaction indicating that genotypes were                                     (1925).
responding differently to heat stress. Misshapen fruit have                            6. Darrow G. M. The Strawberry (Holt, Rinehart and Winston, 1966).
                                                                                       7. Gilbert, C. & Breen, P. J. Low pollen production as a cause of fruit malformation
been found to have a greater proportion of small under-                                    in strawberry. J. Am. Soc. Hort. Sci. 112, 56–60 (1987).
developed achenes following exposure to extreme tem-                                   8. Whitaker, V. M., Hasing, T., Chandler, C. K., Plotto, A. & Baldwin, E. Historical
peratures during embryo development55,56.                                                  trends in strawberry fruit quality revealed by a Trial of University of Florida
                                                                                           Cultivars and Advanced Selections. HortScience 46, 553–557 (2011).
  In this study, we detail a comprehensive dissection of                               9. Chandler, C. K., Santos, B. M., Peres, N. A., Jouquand, C. & Plotto, A. ‘Florida
the traits underlying strawberry uniformity and show that                                  Elyana’ strawberry. HortScience 44, 1775–1776 (2009).
the visual perception of a strawberry can be represented                              10. Zanin, D. S. et al. Agronomic performance of cultivars and advanced selections
                                                                                          of strawberry in the South Plateau of Santa Catarina State. Rev. Ceres. 66,
by five metrics. The generation of an objective measure of                                 159–167 (2019).
uniformity has allowed the assessments of genetic com-                                11. Ariza, M. T., Soria, C., Medina-Mínguez, J. J. & Martínez-Ferri, E. Incidence of
ponents in a multi-parental breeding population. We                                       misshapen fruits in strawberry plants grown under tunnels is affected by
                                                                                          cultivar, planting date, pollination, and low temperatures. HortScience 47,
show uniformity has a strong genetic component that can                                   1569–1573 (2012).
be improved by breeding and identify genetic components                               12. Zhang, D. et al. Chloropicrin alternated with biofumigation increases crop
controlling uniformity that are present across a wide array                               yield and modifies soil bacterial and fungal communities in strawberry pro-
                                                                                          duction. Sci. Total Environ. 675, 615–622 (2019).
of germplasm.                                                                         13. Faedi, W., Mourgues, F., & Rosati, C. Strawberry breeding and varieties: situation
                                                                                          and perspectives. Acta Hort. 51, 51–59 (2001).
                                                                                      14. Nielsen, J. A. & Lovell, P. H. Value of morphological characters for cultivar
Acknowledgements
                                                                                          identification in strawberry (Fragariaxananassa). N.Z. J. Crop Hort. Sci. 28, 89–96
We acknowledge project partners Soloberry, Sainsburys, Botanicoir and
                                                                                          (2000).
Agrovista for their involvement and support of the project. We also
                                                                                      15. Ishikawa, T. et al. Classification of strawberry fruit shape by machine learning.
acknowledge Robert Vickerstaff for generating the octoploid consensus map
                                                                                          ISPRS XLII-2, 463–470 (2018).
as part of other projects and Dr Beatrice Denoyes, INRA and Dr Amparo
                                                                                      16. Mir, J. I. et al. Diversity evaluation of fruit quality of apple (Malus × domestica
Monfort, CRAG for granting the use of their informative markers in the
                                                                                          Borkh.) germplasm through cluster and principal component analysis. Indian J.
production of the strawberry consensus linkage map. This work was supported
                                                                                          Plant Physiol. 22, 221–226 (2017).
by grants from the Biotechnology and Biological Sciences Research Council
                                                                                      17. Akodagali, J. & Balaji, S. Computer vision and image analysis based techniques
(BBSRC) BB/M01200X/2, BB/P005039/1 and Innovate UK project 101914.
                                                                                          for automatic characterization of fruits a review. Int. J. Comput. Appl. 50, 6–12
                                                                                          (2012).
Author details                                                                        18. Beyer, M., Hahn, R., Peschel, S., Harz, M. & Knoche, M. Analysing fruit
1
 NIAB EMR, East Malling, Kent ME19 6BJ, UK. 2University of the West of England,           shape in sweet cherry (Prunus avium L.). Sci. Hort. 96, 139–150
Bristol BS16 1QY, UK. 3NIAB, Huntingdon Road, Cambridge CB3 0LE, UK                       (2002).
                                                                                      19. Naik, S., Patel, B. & Pandey, R. Shape, size and maturity features extraction with
                                                                                          fuzzy classifier for non-destructive mango (Mangifera indica L., cv. Kesar)
Author contributions                                                                      grading. In 2015 IEEE Technological Innovation in ICT for Agriculture and Rural
B.L.—Analysed imaging data; A.J., H.M.C., E.S., B.L. and R.J.H.—conceived and             Development (TIAR). https://doi.org/10.1109/tiar.2015.7358522 (2015).
designed experiments; H.M.C.—conducted quantitative genetics analysis; A.J.,          20. Hiraoka, Y. & Kuramoto, N. Identification of Rhus succedanea L. cultivars using
H.M.C. and A.K.—performed experiments; A.K.—performed genotyping and                      elliptic fourier descriptors based on fruit shape. Silvae Genet. 53, 221–226
wrote initial GBLUP script; G.D.—ordinal regression analysis; B.L., H.M.C. and R.J.       (2004).
H. wrote the manuscript with contributions from all authors.; B.L. and H.M.C.         21. Paproki, A., Sirault, X., Berry, S., Furbank, R. & Fripp, J. A novel mesh processing
equally contributed to the manuscript.                                                    based technique for 3D plant analysis. BMC Plant Biol. 12, 63 (2012).
                                                                                      22. Coupel-Ledru, A. et al. Multi-scale high-throughput phenotyping of apple
                                                                                          architectural and functional traits in orchard reveals genotypic variability under
Data availability                                                                         contrasted watering regimes. Hortic. Res. 6, 52 (2019).
The software developed and datasets generated and analysed during the                 23. Topp, C. N. et al. 3D phenotyping and quantitative trait locus mapping identify
current study are available from the corresponding author on reasonable                   core regions of the rice genome controlling root architecture. Proc. Natl Acad.
request.                                                                                  Sci. USA 110, E1695–E1704 (2013).
Li et al. Horticulture Research (2020)7:115 Page 13 of 13
24. Cockerton, H. M. et al. Genetic and phenotypic associations between root 42. Erbe, M., Pimentel, E. C. G., Sharifi, A. R. & Simianer, H. Assessment of cross-
architecture, arbuscular mycorrhizal fungi colonisation and low phosphate validation strategies for genomic prediction in cattle. In Proc. 9th WCGALP,
tolerance in strawberry (Fragaria × ananassa). BMC Plant Biol. 20, 1–14 (2020). Leipzig (2010).
25. He, J. Q., Harrison, R. J. & Li, B. A novel 3D imaging system for strawberry 43. Gezan, S. A., Osorio, L. F., Verma, S. & Whitaker, V. M. An experimental
phenotyping. Plant Methods 13, 93 (2017). validation of genomic selection in octoploid strawberry. Hort. Res.
26. Westoby, M. J., Brasington, J., Glasser, N. F., Hambrey, M. J. & Reynolds, J. M. 11, 1–9 (2017).
‘Structure-from-Motion’ photogrammetry: a low-cost, effective tool for 44. Garin, V., Wimmer, V., Mezmouk, S., Malosetti, M. & van Eeuwijk, F. How do the
geoscience applications. Geomorphology 179, 300–314 (2012). type of QTL effect and the form of the residual term influence QTL detection
27. Kovacs, L. et al. Comparison between breast volume measurement using 3D in multi-parent populations? A case study in the maize EU-NAM population.
surface imaging and classical techniques. Breast 16, 137–145 (2007). Theor. Appl. Genet. 130, 1753–1764 (2017).
28. Rife, T. W. & Poland, J. A. Field book: an open-source application for field data 45. Churchill, G. A. & Doerge, R. W. Empirical threshold values for quantitative trait
collection on android. Crop Sci. 54, 1624 (2014). mapping. Genetics 138, 963–971 (1994).
29. Laganiere, R. OpenCV 3 Computer Vision Application Programming Cookbook 46. Zeng, Z. B. Theoretical basis for separation of multiple linked gene effects in
(Packt Publishing Ltd, 2017). mapping quantitative trait loci. Proc. Natl Acad. Sci. USA 90, 10972–10976
30. Podczeck, F., Rahman, S. R. & Newton, J. M. Evaluation of a standardised (1993).
procedure to assess the shape of pellets using image analysis. Int J. Pharm. 47. Zeng, Z.-B. Precision mapping of quantitative trait loci. Genetics 136,
192, 123–138 (1999). 1457–1468 (1994).
31. Taubin, G. Estimating the tensor of curvature of a surface from a polyhedral 48. Oo, L. M. & Aung, N. Z. A simple and efficient method for automatic straw-
approximation. In Proc. IEEE International Conference on Computer Vision. berry shape and size estimation and classification. Biosyst. Eng. 170, 96–107
https://doi.org/10.1109/iccv.1995.466840 (1995). (2018).
32. Lancaster, P. & Salkauskas, K. Surfaces generated by moving least squares 49. Kochi, N. et al. A 3D shape-measuring system for assessing strawberry fruits.
methods. Math. Comput. 37, 141–141 (1981). Int. J. Autom. Technol. 12, 395–404 (2018).
33. Gutierrez, P. A., Perez-Ortiz, M., Sanchez-Monedero, J., Fernandez-Navarro, F. & 50. Aho, K., Derryberry, D. & Peterson, T. Model selection for ecologists: the
Hervas-Martinez, C. Ordinal Regression methods: survey and experimental worldviews of AIC and BIC. Ecology 95, 631–636 (2014).
study. IEEE Trans. Knowl. Data Eng. 28, 127–146 (2016). 51. Castro, P. & Lewers, K. S. Identification of quantitative trait loci (QTL)
34. Chakrabarti, A. & Ghosh, J. K. AIC, BIC and recent advances in model selection. for fruit-quality traits and number of weeks of flowering in the
Philos. Stat. 7, 583–605 (2011). cultivated strawberry. Mol. Breed. 36, https://doi.org/10.1007/
35. Yamashita, T., Yamashita, K. & Kamimura, R. A stepwise AIC method for variable s11032-016-0559-7 (2016).
selection in linear regression. Commun. Stat. 36, 2395–2403 (2007). 52. Lerceteau-Köhler, E. et al. Genetic dissection of fruit quality traits in the
36. Verma, S., et al. Clarifying sub-genomic positions of QTLs for flowering habit octoploid cultivated strawberry highlights the role of homoeo-QTL in their
and fruit quality in U.S. strawberry (Fragaria × ananassa) breeding populations control. Theor. Appl Genet. 124, 1059–1077 (2012).
using pedigree-based QTL analysis. Hort. Res. 4. https://doi.org/10.1038/ 53. Liao, X. et al. Interlinked regulatory loops of ABA catabolism and biosynthesis
hortres.2017.62 (2017). coordinate fruit growth and ripening in woodland strawberry. Proc. Natl Acad.
37. Vickerstaff, R. J. & Harrison, R. J. Crosslink: a fast, scriptable genetic mapper for Sci. USA 115, E11542–E11550 (2018).
outcrossing species. Preprint at https://doi.org/10.1101/135277 (2017). 54. Wang, S.-M. et al. Comparative transcriptome analysis of shortened fruit
38. Cockerton, H. M. et al. Identification of powdery mildew resistance QTL in mutant in woodland strawberry (Fragaria vesca) using RNA-Seq. J. Integr. Agric.
strawberry (Fragaria × ananassa). Theor. Appl Genet 131, 1995–2007 (2018). 16, 828–844 (2017).
39. van Dijk, T. et al. Genomic rearrangements and signatures of breeding in the 55. Ariza, M. T., Soria, C., Medina, J. J. & Martínez-Ferri, E. Fruit misshapen in
allo-octoploid strawberry as revealed through an allele dose based SSR linkage strawberry cultivars (Fragaria × ananassa) is related to achenes functionality.
map. BMC Plant Biol. 14, 55 (2014). Ann. Appl. Biol. 158, 130–138 (2011).
40. Butler, D., Cullis, B. R., Gilmour, A. R. & Gogel, B. J. Asreml: asreml () fits the linear 56. Pipattanawong, R., Yamane, K., Fujishige, N., Bang, S.-W. & Yamaki, Y. Effects of
mixed model. R package version 3 (2009). high temperature on pollen quality, ovule fertilization and development of
41. Granato, I. & Fritsche-Neto, R. snpReady: preparing genotypic datasets in order embryo and achene in ‘Tochiotome’ strawberry. J. Jpn. Soc. Hort. Sci. 78,
to run genomic; analysis. R package version 0.9. 6. (2018). 300–306 (2009).You can also read