Subcortical Shape Alterations in Major Depressive Disorder: Findings from the ENIGMA Major Depressive Disorder Working Group - bioRxiv
←
→
Page content transcription
If your browser does not render page correctly, please read the page content below

bioRxiv preprint first posted online Feb. 1, 2019; doi: http://dx.doi.org/10.1101/534370. The copyright holder for this preprint (which
       was not peer-reviewed) is the author/funder, who has granted bioRxiv a license to display the preprint in perpetuity.
                                       All rights reserved. No reuse allowed without permission.

                             Subcortical Shape Alterations in Major Depressive Disorder:
                        Findings from the ENIGMA Major Depressive Disorder Working Group

            Short title: Subcortical shape alterations in depression

            Tiffany C. Ho, Ph.D.1,2*, Boris Gutman, Ph.D.3*, Elena Pozzi, M.Sc.4,5, Hans J. Grabe, M.D.6,
            Norbert Hosten, M.D.7, Katharina Wittfeld, Ph.D.6, Henry Völzke, M.D.8, Bernhard Baune,
            Ph.D.9,10, Udo Dannlowski, M.D., Ph.D.9, Katharina Förster, M.Sc.9, Dominik Grotegerd,
            Ph.D.9, Ronny Redlich, Ph.D.9, Andreas Jansen, Ph.D.11, Tilo Kircher, M.D., Ph.D.11, Axel
            Krug, Ph.D.11, Susanne Meinert, M.Sc.9, Igor Nenadic, M.D., Ph.D.11, Nils Opel, M.D.9,
            Richard Dinga, M.Sc.12, Dick J. Veltman, M.D., Ph.D.12, Knut Schnell, M.D.13, Ilya Veer,
            Ph.D.14, Henrik Walter, M.D., Ph.D.14, Ian H. Gotlib2, Matthew D. Sacchet1, André Aleman,
            Ph.D.15, Nynke A. Groenewold, Ph.D.15,16, Dan J. Stein, M.D., Ph.D.17, Meng Li, Ph.D.18,
            Martin Walter, M.D., Ph.D.19, Neda Jahanshad, Ph.D.20, Paul M. Thompson, Ph.D.20, Philipp
            G. Sämann, M.D., Ph.D.21, Lianne Schmaal, Ph.D.5,22
            1
              Department of Psychiatry & Behavioral Sciences, Stanford University, Stanford, CA USA
            2
              Department of Psychology, Stanford University, Stanford, CA USA
            3
              Department of Biomedical Engineering, Illinois Institute of Technology, Chicago, IL USA
            4
              Melbourne Neuropsychiatry Centre, Department of Psychiatry, The University of Melbourne
            & Melbourne Health, Melbourne, Australia
            5
              Orygen, The National Centre of Excellence in Youth Mental Health, Parkville, Australia
            6
              Department of Psychiatry and Psychotherapy, University Medicine Greifswald, Germany
            and German Centre of Neurodegenerative Diseases (DZNE) site Greifswald/Rostock,
            Germany
            7
              Department of Diagnostic Radiology and Neuroradiology, University Medicine Greifswald,
            Germany
            8
              Institute for Community Medicine, University Medicine Greifswald, Germany
            9
              Department of Psychiatry, University of Münster, Münster, Germany
            10
               Department of Psychiatry, Melbourne Medical School, The University of Melbourne,
            Melbourne, Australia
            11
               Department of Psychiatry, Philipps-University Marburg, Germany
            12
               Department of Psychiatry, Amsterdam University Medical Centers, VU University Medical
            Center, GGZ inGeest, Amsterdam Neuroscience, Amsterdam, The Netherlands
            13
               Department of Psychiatry and Psychotherapy, University Medical Center Göttingen,
            Göttingen, Germany
            14
               Division of Mind and Brain Research, Department of Psychiatry and Psychotherapy CCM,
            Charité - Universitätsmedizin Berlin, corporate member of Freie Universität Berlin, Humboldt-
            Universität zu Berlin, and Berlin Institute of Health, Berlin, Germany
            15
               University of Groningen, University Medical Center Groningen, Department of
            Neuroscience, Groningen, The Netherlands
            16
               University of Groningen, University Medical Center Groningen, Interdisciplinary Center
            Psychopathology and Emotion regulation (ICPE), Groningen, The Netherlands
            17
               Department of Psychiatry and Mental Health, University of Cape Town, South Africa
            18
               Max Planck Institute for Biological Cybernetics, Tuebingen, Germany
            19
               Department of Psychiatry, University Tuebingen, Germany
            20
               Imaging Genetics Center, Mark & Mary Stevens Neuroimaging & Informatics Institute, Keck
            USC School of Medicine, Marina del Rey, CA, USA
            21
               Department of Psychiatry, Max Planck Institute, Tuebingen, Germany
            22
               Centre for Youth Mental Health, The University of Melbourne, Melbourne, Australia

            *Correspondence to:
            Tiffany C. Ho, Ph.D.
            Department of Psychiatry & Behavioral Sciences
            Stanford University
                                                                 Ho & Gutman, 1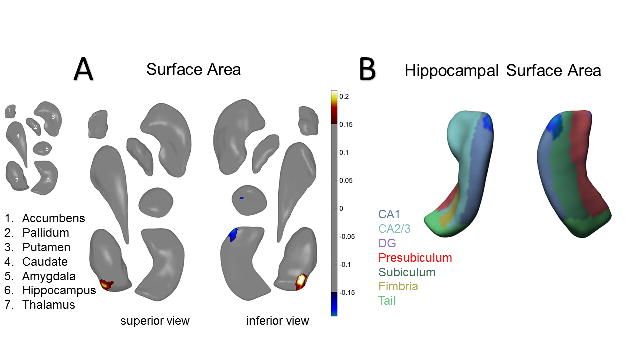
bioRxiv preprint first posted online Feb. 1, 2019; doi: http://dx.doi.org/10.1101/534370. The copyright holder for this preprint (which
       was not peer-reviewed) is the author/funder, who has granted bioRxiv a license to display the preprint in perpetuity.
                                       All rights reserved. No reuse allowed without permission.

            Stanford, CA 94503
            E-mail: tiffnie@stanford.edu

            OR

            Boris Gutman, Ph.D.
            Department of Biomedical Engineering
            Illinois Institute of Technology
            Chicago, IL 60616
            E-mail: bgutman1@iit.edu

            Abstract Word Count: 247
            Full Text Word Count: 5192
            Figures: 3
            Tables: 1
            Supplement: 1

            Key Words: Major Depressive Disorder (MDD); hippocampus; amygdala; nucleus
            accumbens; shape analysis; ENIGMA

                                                                 Ho & Gutman, 2
bioRxiv preprint first posted online Feb. 1, 2019; doi: http://dx.doi.org/10.1101/534370. The copyright holder for this preprint (which
       was not peer-reviewed) is the author/funder, who has granted bioRxiv a license to display the preprint in perpetuity.
                                       All rights reserved. No reuse allowed without permission.

            Abstract

            Alterations in regional subcortical brain volumes have been widely investigated as part of the

            efforts of an international consortium, ENIGMA, to determine reliable structural brain

            signatures for Major Depressive Disorder (MDD). Given that subcortical structures are

            comprised of distinct subfields, we sought to build significantly from prior work to precisely

            map localized MDD-related differences in subcortical regions using shape analysis. In this

            meta-analysis of subcortical shape from the ENIGMA-MDD working group, we compared

            1,781 patients with MDD and 2,953 healthy controls (CTL) on individual measures of shape

            metrics (thickness and surface area) on the surface of seven bilateral subcortical structures:

            nucleus accumbens, amygdala, caudate, hippocampus, pallidum, putamen, and thalamus.

            Harmonized data processing and statistical analyses were conducted locally at each site,

            and findings were aggregated by meta-analysis. Relative to CTL, patients with MDD had

            lower surface area in the subiculum of the hippocampus, the basolateral amygdala, and the

            nucleus accumbens shell. Relative to CTL, patients with adolescent-onset MDD (≤ 21 years)

            had lower thickness and surface area of the subiculum of the hippocampus and the

            basolateral amygdala. Relative to first-episode MDD, recurrent MDD patients had lower

            thickness and surface area in the CA1 of the hippocampus and the basolateral amygdala.

            Our results suggest that previously reported MDD-associated volumetric differences may be

            localized to specific subfields of these structures that have been shown to be sensitive to the

            effects of stress, with important implications for mapping treatments to patients based on

            specific neural targets and key clinical features.

                                                                 Ho & Gutman, 3
bioRxiv preprint first posted online Feb. 1, 2019; doi: http://dx.doi.org/10.1101/534370. The copyright holder for this preprint (which
was not peer-reviewed) is the author/funder, who has granted bioRxiv a license to display the preprint in perpetuity.
All rights reserved. No reuse allowed without permission.
Introduction
Major Depressive Disorder (MDD) is one the leading causes of disability worldwide, with
relatively high rates of lifetime prevalence and recurrence (World Health 2017). MDD is often
triggered by stressful experiences and is commonly associated with various affective
symptoms (e.g., abnormalities in emotion regulation, reduced motivation in the face of
positive incentives, sustained experiences of negative affect (Davidson et al 2002; Woody
and Gibb 2015), as well as with cognitive deficits (e.g., attention, learning, working memory,
processing speed, motor functioning (McIntyre et al 2013)). Several subcortical regions –
particularly the hippocampus, amygdala, and structures of the striatum – through their
connections with one another and with cortical structures, are important for supporting a
number of these cognitive and affective processes that are disturbed in MDD (Davidson et
al., 2002). In a recent multi-site effort, we examined morphological alterations at the level of
subcortical gray matter volumes in MDD (Schmaal et al 2016), and found lower total
hippocampal volumes, mainly driven by patients with recurrent episodes and by patients with
a relatively early age of onset (i.e., prior to age 21). Despite the large study sample size and
homogeneous analysis protocols, no statistically significant group differences emerged for
any of the other subcortical structures. It is possible, however, that such aggregate measures
of volume are either insensitive to local volumetric effects or that they obscure
heterogeneous local effects by averaging out more complex shape effects. In this respect,
the analysis of shape parameters may represent a more sensitive approach. Beyond this,
local variations in shape measures are highly heritable, and specific genetic variants may
affect only localized regions of the structure (Hibar et al 2015; Roshchupkin et al 2016), but
also to provide insight into the anatomical relation with important clinical variables, such as
illness onset and recurrence, as well as the ability to detect fine-grained changes that may be
particularly helpful in the context of monitoring intervention targets with more specificity.
Ho & Gutman, 4bioRxiv preprint first posted online Feb. 1, 2019; doi: http://dx.doi.org/10.1101/534370. The copyright holder for this preprint (which
was not peer-reviewed) is the author/funder, who has granted bioRxiv a license to display the preprint in perpetuity.
All rights reserved. No reuse allowed without permission.
Indeed, all of the subcortical structures that have been implicated in MDD contain functionally
distinct subregions (Roddy et al 2018). For example, the hippocampus is not a singular unit,
but consists of several subregions, including the cornu ammonis subfields (CA) 1-4, dentate
gyrus (DG), and the subiculum (SUB). While the more dorsal regions are involved in memory
formation and spatial cognition, the ventral regions subserve affective processing (Fanselow
and Dong 2010). Most hippocampal subregions are sensitive to effects of glucocorticoids and
psychosocial stress (Teicher et al 2012; Wang et al 2013), with reported reductions in
individuals with MDD compared to healthy controls, particularly in CA1, CA3, DG, and SUB
(Bearden et al 2009; Boldrini et al 2010; Han et al 2016; Treadway et al 2015). Importantly,
there is evidence from both functional and structural imaging that these stress-sensitive
subfields of the hippocampus are especially vulnerable to environmental factors that
influence their development (Teicher et al 2012). In this context, early life stress may explain
prior reports of reduced hippocampal volume in MDD (Frodl et al 2016; Schmaal et al 2016)
by influencing hippocampal development to increase risk for MDD.
Similarly, the amygdala contains functionally distinct subregions. Based on anatomical
tracing studies and cellular architecture, two primary nuclei subpopulations in the amygdala
have been identified: the basolateral and centromedial amygdala (BLA, CMA) (Mosher et al
2010; Sah et al 2003). The CMA, with its reciprocal connections with the basal ganglia,
midbrain, and brain stem, appears to be involved in allocating attention and generating the
appropriate autonomic responses to environmental stimuli. In contrast, the BLA, with its
connections to the CMA and with extensive cortical regions, is primarily involved in
evaluating the emotional content of sensory inputs and plays a major role in threat responses
(Mosher et al 2010; Terburg et al 2018). Although some post mortem evidence suggests that
MDD selectively affects the receptors and number of nuclei in the BLA (Karolewicz et al
2009; Rubinow et al 2016), it is not clear if MDD is associated with larger or smaller BLA
volume. Several confounding variables related to disease burden (e.g., age of illness onset,
recurrence, medication usage) likely contribute to these discrepant results (Hamilton et al
Ho & Gutman, 5bioRxiv preprint first posted online Feb. 1, 2019; doi: http://dx.doi.org/10.1101/534370. The copyright holder for this preprint (which
was not peer-reviewed) is the author/funder, who has granted bioRxiv a license to display the preprint in perpetuity.
All rights reserved. No reuse allowed without permission.
2008; Kronenberg et al 2009; Rubinow et al 2016; van Eijndhoven et al 2009). Another
possibility is that associations of MDD with amygdala volumes are specific to certain
subdivisions and are not easily detected when the total amygdala volume is used (Schmaal
et al 2016).
Finally, the striatum is comprised of the dorsal striatum (caudate, putamen) and ventral
striatum (nucleus accumbens; NAcc). Cytoarchitectural, histological, and functional imaging
evidence suggests that the caudate head is more strongly related to affective and cognitive
processes, whereas the caudate body/tail is more centrally involved with processing sensory
inputs to shape perception and action (Robinson et al 2011). Similarly, the ventral putamen
has a more prominent role in processing emotions in a motivational context, whereas the
dorsal putamen, along with other nuclei in the basal ganglia, is primarily responsible for
motor learning (Haber 2016; Haber and Knutson 2010). The NAcc – situated adjacent to the
medial and ventral parts of the caudate and putamen – contains a shell (NAcc-s) and a core.
The nuclei of the NAcc-s are structurally distinct from those in the core and have different
functional roles (Bertran-Gonzalez et al 2008; Heimer et al 1991). While neurons in the core
project to the pallidum, substantia nigra, and other motor areas, NAcc neurons project to the
extended amygdala and ventral tegmental area that are involved in processing pleasure
signals, motivational salience, and reward-based reinforcement (Richard et al 2013).
Aversive stressful events may lead to striatal dopamine release, underscoring a role of the
striatum in stress-related diseases including MDD (Richard et al 2013). Structural alterations
in these striatal subregions have also been associated with motivation- and reward-related
disturbances – ranging from blunted responses to positive reinforcers and biases towards
negative feedback – in patients with MDD (Francis et al 2015; Martin-Soelch 2009; Pizzagalli
et al 2009).
MDD is most likely characterized by specific associations with functionally distinct subregions
within the hippocampus, amygdala, striatum, and other subcortical structures (e.g.,
Ho & Gutman, 6bioRxiv preprint first posted online Feb. 1, 2019; doi: http://dx.doi.org/10.1101/534370. The copyright holder for this preprint (which
was not peer-reviewed) is the author/funder, who has granted bioRxiv a license to display the preprint in perpetuity.
All rights reserved. No reuse allowed without permission.
thalamus). It is important to note, however, that characterizing local patterns in subcortical
surfaces has traditionally been challenging due to the lack of identifiable surface landmarks
that are more common in cortical surfaces (e.g., deep sulcal patterns). Further, relying on
smaller samples from individual sites may not provide sufficient statistical power to detect
subtle effects in subcortical shape or to reliably overcome variation due to methodological
(e.g., preprocessing pipeline, scanner idiosyncrasies) or clinical factors (e.g., age of illness
onset, recurrence, and medication exposure). In this context, the lack of detectable
volumetric differences in the amygdala, caudate, putamen, and NAcc between MDD and
CTL in our previous meta-analytic study may be due to the fact that we did not use shape
analyses to examine these important subdivisions (Schmaal et al 2016).
To address these knowledge gaps, we conducted a multi-site meta-analytic investigation to
test whether MDD patients, and whether specific subgroups of MDD based on important
clinical characteristics, show differences from controls in subcortical shape. Specifically, we
applied meta-analytic models on effect sizes generated from 10 study cohorts from 6
different countries participating in the MDD Working Group of the international ENIGMA
consortium. Each study site applied a well-validated harmonized preprocessing pipeline and
conducted statistical models on high-resolution T1-weighted MRIs, yielding site-level
summary statistics of volume and shape for seven bilateral subcortical regions from 1,781
patients diagnosed with MDD and 2,953 healthy controls (CTL).
Guided by findings from our prior meta-analysis in which we reported that the most robust
difference between individuals with MDD and CTL was smaller hippocampal volume
(Schmaal et al., 2015), and from recent work indicating that CA1, CA3, DG, and SUB are
associated with exposure to aversive stressful experiences (Teicher et al 2012) and MDD
(Han et al 2016; Treadway et al 2015), we hypothesized that patients with MDD would exhibit
reductions in these hippocampal subregions. Given previously documented effects of age of
illness onset and recurrence of illness on subcortical volumes (primarily the amygdala and
Ho & Gutman, 7bioRxiv preprint first posted online Feb. 1, 2019; doi: http://dx.doi.org/10.1101/534370. The copyright holder for this preprint (which
was not peer-reviewed) is the author/funder, who has granted bioRxiv a license to display the preprint in perpetuity.
All rights reserved. No reuse allowed without permission.
hippocampus; Hamilton et al 2008; Schmaal et al 2016), we also sought to stratify groups
according to these clinical characteristics: early (prior to age 21) versus later (after age 21)
onset MDD and first-episode versus recurrent-episode. We also report additional exploratory
analyses of medicated and non-medicated patients (each compared separately to CTL) and
dimensional associations between subcortical shape and depression severity (clinician-rated
as well as self-reported) among patients with MDD.
Materials and Methods
Samples
Ten participating sites in the MDD Working Group of ENIGMA consortium (Schmaal et al
2017; Schmaal et al 2016; Thompson et al 2014) applied harmonized preprocessing and
statistical models on structural T1-weighted MRIs, yielding site-level summary statistics of
subcortical volume and shape from a total of 4,734 participants (1,781 patients with MDD
and 2,953 CTL). Detailed demographics, clinical characteristics, and exclusionary criteria for
study enrollment for each site are presented in supplemental Table S1. All participating sites
obtained approval from their respective local institutional review boards and ethics
committees. All study participants provided written consent at their local site.
Clinical variables of interest
We selected specific clinical variables of interest based on prior work demonstrating their
effects on aggregate subcortical volumes in MDD (Hamilton et al 2008; Schmaal et al 2016).
These variables included: age of illness onset, number of episodes, and the severity of
depressive symptoms at the time of scan as measured by the clinician-rated 17-item
Hamilton Depression Rating Scale (HDRS-17; Hamilton 1960) or the 21-item self-report Beck
Depression Inventory (BDI; Beck et al 1961). Consistent with our prior work, we considered
participants with earlier or adolescent onset (EO) to be those who developed first episodes at
or before age 21, and participants with later or adult onset (LO) to be those who developed
Ho & Gutman, 8bioRxiv preprint first posted online Feb. 1, 2019; doi: http://dx.doi.org/10.1101/534370. The copyright holder for this preprint (which
was not peer-reviewed) is the author/funder, who has granted bioRxiv a license to display the preprint in perpetuity.
All rights reserved. No reuse allowed without permission.
first episodes after age 21 (Schmaal et al 2016). We defined recurrent-episode MDD
(RECUR) to be those who experienced more than one major depressive episode (Schmaal
et al 2016). As a supplemental analysis (because the majority of sites did not include detailed
information on lifetime medication usage, dosage, or adherence), we also compared MDD
groups on the basis of antidepressant medication usage at the time of scan.
Image processing and analysis
All participating sites collected anatomical T1-weighted MRI brain scans locally at each site,
where they were analyzed using the fully-automated and validated segmentation software
FreeSurfer version 5.3 (Fischl 2002), with the exception of 3 sites which used version 5.0 or
5.1 (see Table S1). A subset of these subcortical measures have been previously published
(Frodl et al 2016; Renteria et al 2017; Schmaal et al 2016); however, none of these prior
meta-analyses from the MDD Working Group of ENIGMA conducted shape analyses. Image
acquisition parameters and software descriptions for each sample are presented in
supplemental Table S1. The 7 bilateral subcortical segmentations were: the nucleus
accumbens, amygdala, caudate, hippocampus, pallidum, putamen, and thalamus (as well as
lateral ventricles and total intracranial volume, ICV). All segmentations were visually
inspected for accuracy following standardized protocols
(http://enigma.ini.usc.edu/protocols/imaging-protocols/).
We analyzed shape using the ENIGMA-Shape protocol
(http://enigma.usc.edu/ongoing/enigma-shape-analysis/), for which test-retest reliability has
been previously validated (Hibar et al., 2017). Briefly, shapes were extracted using the
FreeSurfer 5.3 parcellation, followed by a topological correction and mild smoothing based
on the topology-preserving level set algorithm (Gutman et al 2015). As in prior work, after
registering shapes to standardized templates, we then defined two vertex-wise measures of
space morphometry which facilitated comparisons of subcortical shape: radial distance, as
derived from the medial model (Gutman et al 2015; Gutman et al 2012), which yields a
measure of “shape thickness,” and the Jacobian determinant, as derived from tensor based
Ho & Gutman, 9bioRxiv preprint first posted online Feb. 1, 2019; doi: http://dx.doi.org/10.1101/534370. The copyright holder for this preprint (which
was not peer-reviewed) is the author/funder, who has granted bioRxiv a license to display the preprint in perpetuity.
All rights reserved. No reuse allowed without permission.
morphometry (TBM; Gutman et al 2015; Wang et al 2011), which yields a metric of localized
tissue reduction or enlargement of surface area (relative to the respective template shape).
Because the Jacobian represents the ratio of the area in the individual shape relative to the
area in the template at the corresponding vertex – and because this is not Gaussian in
distribution – we used the logarithm of the Jacobian in all analyses examining shape surface
area, as this tends to be closer to Gaussian. A useful feature of the ENIGMA-Shape pipeline
is that results are based on bilateral shape measures (i.e., templates for corresponding left
and right regions are vertex-wise registered after reflecting one of them, and summed vertex-
wise). Importantly, our registration algorithm provides a unique and stable matching between
datasets, allowing us to efficiently meta-analyze the effects of MDD across datasets (as in
Roshchupkin et al 2016). See “Image processing and analysis” under the Supplemental
Information for more details on the pipeline for subcortical shape analysis and on quality
control procedures.
Each of the 10 study sites applied the subcortical shape pipeline and ran a priori statistical
models (for details, see “Statistical framework for meta-analyses”, below) that were guided
by discussions with ENIGMA-MDD members and previous work (Schmaal et al 2017;
Schmaal et al 2016) to generate summary statistics for inclusion in our meta-analyses.
Site-specific statistical models
To harmonize analyses across sites, a set of standardized scripts to compute mass
univariate statistics was distributed to all participating sites via the ENIGMA-Git page
(https://github.com/ENIGMA-git/ENIGMA/tree/master/WorkingGroups). Each study site
performed mass univariate (per-vertex, per-measure) analysis for all the linear models
proposed in the present study (see Table 1). Specifically, for our primary statistical models of
interest, subcortical shape measures of thickness (radial distance) and surface area (log of
the Jacobian determinant) were the outcome variables, and a binary group indicator variable
(e.g., 0=CTL, 1=MDD) was the predictor of interest, with age, sex (as a factor), and total ICV
as covariates. Secondary analyses included the following planned comparisons: early onset
Ho & Gutman, 10bioRxiv preprint first posted online Feb. 1, 2019; doi: http://dx.doi.org/10.1101/534370. The copyright holder for this preprint (which
was not peer-reviewed) is the author/funder, who has granted bioRxiv a license to display the preprint in perpetuity.
All rights reserved. No reuse allowed without permission.
MDD (EO) vs. CTL; later onset MDD (LO) vs. CTL; EO vs. LO; recurrent episode MDD
(RECUR) vs. CTL; first episode MDD (FIRST) vs. CTL; RECUR vs. FIRST. We also tested
for associations with HDRS-17 and BDI scores (separately) within the MDD group only. Our
exploratory analyses included comparing groups based on antidepressant usage at the time
of scan (MED vs. CTL, and NON vs. CTL), as well as testing whether sex and age
significantly interacted with diagnostic group in the primary analysis (MDD vs. CTL) to
explain variation in subcortical shape measurements.
Meta-analytic framework and correction for multiple comparisons
The resulting group-level maps of effect sizes (i.e., Cohen’s d for the group comparisons and
Pearson’s r for the dimensional analyses), regression parameters, and confidence intervals,
as well as basic site information, were aggregated for mass univariate meta-analysis. As
performed in Schmaal et al 2017; Schmaal et al 2016, we conducted meta-analyses which
pooled each site’s effect sizes, for each region, using an inverse variance-weighted random-
effects model as implemented in the R package metafor (version 1.9-1) and fit with REML
(https://cran.r-project.org/). One advantage of random effects models is that they allow effect
sizes to vary across studies due to study-specific differences (e.g., mean age); random
effects models therefore weight within-study as well as between-study variance in the pooled
effect size estimates to mitigate bias or undue influence from the largest samples in the
meta-analysis (Borenstein et al 2010).
Maps of p-values resulting from the meta-analysis were corrected for multiple comparisons
using a modified searchlight false discovery rate (FDR) procedure set to pbioRxiv preprint first posted online Feb. 1, 2019; doi: http://dx.doi.org/10.1101/534370. The copyright holder for this preprint (which
was not peer-reviewed) is the author/funder, who has granted bioRxiv a license to display the preprint in perpetuity.
All rights reserved. No reuse allowed without permission.
simultaneously; in the local case, we interpret each region’s regression analysis for each
measure independently of all other regions. See “Meta-analytic framework and correction for
multiple comparisons” in the Supplement for more details.
Results
We conducted analyses using a conservative global FDR-correction (i.e., correction across
the surfaces of all structures assessed, see previous section). However, we also report local
FDR-correction (i.e., correction across the surface for a single structure), which is more
appropriate for examining effects within specific structures that we hypothesized would yield
MDD-related effects based on previous independent investigations: hippocampus, amygdala,
and striatum. Nevertheless, for comprehensiveness, we conducted and report below local
FDR-corrected results from all seven bilateral subcortical structures.
Global FDR-corrected effects
MDD versus CTL (and interaction effects with age and sex)
There were no significant differences between MDD and CTL, and no significant interactions
between diagnostic group and age or sex.
EO versus CTL
Relative to CTL, EO had lower thickness in the hippocampus (Cohen’s d = -0.17) and
amygdala (Cohen’s d = -0.16), and smaller surface area in the hippocampus (Cohen’s d = -
0.18) and amygdala (Cohen’s d = -0.17). The strongest effects were primarily in the surface
area of the SUB, CA2/3, and BLA. See Table 1 and Figure 1 for more details.
LO versus CTL
There were no significant differences between LO and CTL.
Ho & Gutman, 12bioRxiv preprint first posted online Feb. 1, 2019; doi: http://dx.doi.org/10.1101/534370. The copyright holder for this preprint (which
was not peer-reviewed) is the author/funder, who has granted bioRxiv a license to display the preprint in perpetuity.
All rights reserved. No reuse allowed without permission.
EO versus LO
There were no significant differences between EO and LO.
RECUR versus CTL
There were no significant differences between RECUR and CTL.
FIRST versus CTL
There were no significant differences between FIRST and CTL.
RECUR versus FIRST
Relative to FIRST, RECUR had lower thickness in the hippocampus (Cohen’s d = -0.17) and
amygdala (Cohen’s d = -0.17), and smaller surface area in the hippocampus (Cohen’s d = -
0.17) and amygdala (Cohen’s d = -0.18). These effects were primarily in the surface area of
the CA1 and BLA. Relative to FIRST, RECUR also had both greater thickness (Cohen’s d =
0.18) and greater surface area (Cohen’s d = 0.18) in the medial posterior thalamus. See
Table 1 and Figure 2 for more details.
Associations with Depression Severity
There were no significant associations with depressive symptom severity using HDRS-17 or
BDI scores in any subcortical structural outcome measures.
Local FDR-corrected effects
MDD versus CTL (and interaction effects with age and sex)
Relative to CTL, MDD exhibited lower caudate thickness (Cohen’s d = -0.20) and smaller
hippocampal (Cohen’s d = -0.11), amygdala (Cohen’s d = -0.11), and NAcc (Cohen’s d = -
0.12) surface area. These effects were found for the surface area of SUB, BLA, and NAcc-s.
Ho & Gutman, 13bioRxiv preprint first posted online Feb. 1, 2019; doi: http://dx.doi.org/10.1101/534370. The copyright holder for this preprint (which
was not peer-reviewed) is the author/funder, who has granted bioRxiv a license to display the preprint in perpetuity.
All rights reserved. No reuse allowed without permission.
See Table 1 and Figure 3 for more details. We found no significant interaction effects of
diagnostic group with either age or sex.
EO versus CTL
Relative to CTL, EO exhibited lower hippocampal (Cohen’s d = -0.17) thickness, and smaller
hippocampal (Cohen’s d = -0.17) and amygdala (Cohen’s d = -0.17) surface area. These
effects were found primarily in the SUB and BLA, consistent with the global FDR-corrected
results. See Table 1 and Figure S1 for more details.
LO versus CTL
Relative to CTL, LO exhibited smaller nucleus accumbens (Cohen’s d = -0.13) and caudate
(Cohen’s d = -0.17) surface area. These effects were found in the NAcc-s and caudate body.
See Table 1 and Figure S1 for more details.
EO versus LO
There were no significant differences between EO and LO.
RECUR versus CTL
Relative to CTL, RECUR exhibited lower amygdala (Cohen’s d = -0.13) thickness, and
smaller amygdala (Cohen’s d = -0.13) and NAcc (Cohen’s d = -0.13) surface area. These
effects were found primarily in the BLA and NAcc-s. See Table 1 and Figure S2 for more
details.
FIRST versus CTL
Relative to CTL, FIRST exhibited smaller hippocampal (Cohen’s d = -0.17) and caudate
(Cohen’s d = -0.15) surface area. These effects were found primarily in the CA2/3 regions
and caudate head. See Table 1 and Figure S3 for more details.
Ho & Gutman, 14bioRxiv preprint first posted online Feb. 1, 2019; doi: http://dx.doi.org/10.1101/534370. The copyright holder for this preprint (which
was not peer-reviewed) is the author/funder, who has granted bioRxiv a license to display the preprint in perpetuity.
All rights reserved. No reuse allowed without permission.
RECUR versus FIRST
Relative to FIRST, RECUR exhibited lower amygdala (Cohen’s d = -0.17) as well as greater
thalamic thickness (Cohen’s d = 0.17), and enlarged thalamic surface area (Cohen’s d =
0.16). These effects were found primarily in BLA amygdala and the medial posterior
thalamus. See Table 1 and Figure S4 for more details.
Supplemental results of group comparisons based on antidepressant usage
Please see Table 1 for a summary of these results at both global and local FDR-corrected
thresholds, and the Supplemental Information and Figures S5-S7 for more details.
Discussion
The present study represents the largest investigation of subcortical shape in MDD to date.
We identified reductions in the thickness and surface area of the subiculum (SUB) of the
hippocampus and the basolateral amygdala (BLA) that appear to be driven by groups of
patients with an adolescent age of onset (i.e., prior to age 21 years). Further, recurrence of
depression (i.e., more than one episode of MDD), respectively. Our results address
limitations in our current understanding of neural substrates of MDD, revealing group
differences that are manifested in nuanced changes in subcortical morphometry. These
patterns may offer insight into important clinical influences on the brain basis of MDD.
In our initial study from the ENIGMA-MDD Working Group, we found significant reductions in
hippocampal volume that were primarily driven by patients who had an age of onset of
depression prior to 21 years (and/or patients experiencing recurrent episodes of MDD;
Schmaal et al 2016). Our present finding that smaller surface area of the SUB differs
between early-onset MDD and CTL suggests that stress plays a key role in the development
of MDD, consistent with broader theoretical literature (Hammen 2005). The SUB receives
input from other subfields of the hippocampus (especially CA1), has reciprocal connections
Ho & Gutman, 15bioRxiv preprint first posted online Feb. 1, 2019; doi: http://dx.doi.org/10.1101/534370. The copyright holder for this preprint (which
was not peer-reviewed) is the author/funder, who has granted bioRxiv a license to display the preprint in perpetuity.
All rights reserved. No reuse allowed without permission.
with the hypothalamic nuclei, and sends projections to several subcortical and cortical
targets, making it a key structure that regulates the HPA axis (Lowry 2002; O'Mara 2005).
Post mortem data further indicate that human SUB may contain a higher density of
glucocorticoid binding sites than CA1–4 or even the DG (Kim et al 2015; Sarrieau et al 1986).
In this context, our results are consistent with preclinical and clinical models of MDD that
posit that environmental stressors trigger depressive episodes through stress-induced
increases in glucocorticoid levels that, in turn, shrink dendrites and reduce the number of
spines in the hippocampus, resulting in atrophy (Frodl et al 2008; McEwen et al 2015; Tata
and Anderson 2010). Given evidence that the SUB is especially vulnerable to environmental
input early in life such that there may be sensitive or critical windows of development in this
structure (Teicher et al 2012), our findings are also consistent with the idea that the effects of
early-onset MDD on hippocampal volume may be partially explained by exposure to stress,
including childhood adversity, which is strongly associated with an earlier age of MDD onset
(Kessler et al 2010; McLaughlin et al 2010). Future longitudinal studies are needed to
examine whether reductions in the hippocampus, and specifically in the SUB, mediate links
between childhood maltreatment and the development of (early-onset) MDD.
In our present study, we report that patients with recurrent MDD exhibited reduced
basolateral amygdala (BLA), reduced caudate body, reduced shell of the NAcc (NAcc-s), and
enlarged medial posterior thalamus. Our finding of reduced BLA in patients with recurrent
MDD relative to those in their first episode – as well as lower BLA in patients with recurrent
MDD relative to CTL (in regional analyses) – clarifies conflicting data in the extant literature
on the effects of MDD on amygdala volume and is consistent with the role of the BLA in
responding to threats and stressors in the environment (Terburg et al 2018). Indeed,
previous studies have documented that age of onset, number of episodes, and
antidepressant medication affect amygdala volume in people with MDD (Hamilton et al 2008;
Kronenberg et al 2009; Rubinow et al 2016; Schmaal et al 2016; van Eijndhoven et al 2009).
Interestingly, in our supplemental analyses examining patients who were medicated (at the
Ho & Gutman, 16bioRxiv preprint first posted online Feb. 1, 2019; doi: http://dx.doi.org/10.1101/534370. The copyright holder for this preprint (which
was not peer-reviewed) is the author/funder, who has granted bioRxiv a license to display the preprint in perpetuity.
All rights reserved. No reuse allowed without permission.
time of scan) and also those who were not medicated versus CTL, we did not find evidence
of enlarged amygdala volume, as was reported in a meta-analysis from a decade ago
(Hamilton et al 2008). Given some overlap in sites and samples, it is not surprising our
results are more aligned with our prior meta-analysis of aggregate subcortical volumes,
where we reported a trend that individuals with MDD exhibit reduced amygdala volume
compared to healthy controls (Schmaal et al 2016). Thus, the use of shape analysis in this
well-powered meta-analysis allowed us to not only detect more nuanced effects of MDD on
amygdala morphometry but also to discover that recurrence of MDD is an important clinical
characteristic associated with this neural marker.
In our prior meta-analysis of aggregate subcortical volumes in MDD, we did not detect
differences between MDD and CTL in striatal volumes (Schmaal et al 2016). In contrast, in
the regional analyses of the present meta-analysis, we detected smaller caudate body and
shell of the NAcc (NAcc-s) in MDD compared to CTL and smaller NAcc-s in recurrent MDD
compared to CTL. The NAcc-s receives projections primarily from other limbic structures,
including the hippocampus and amygdala, and is regarded by several researchers to
comprise, in part, mesolimbic pathways (Deutch and Cameron 1992) and the extended
amygdala (Alheid and Heimer 1988). Work in animals has demonstrated that, compared to
the NAcc core, the NAcc-s contains higher concentrations of both dopamine and serotonin;
these two divisions of the NAcc also responded differentially to pharmacological and
environmental challenges, with haloperidol (an antipsychotic) affecting dopamine metabolism
more in the core but stress (via an immobilization paradigm) selectively increasing dopamine
release in the NAcc-s (Deutch and Cameron 1992; Scheggi et al 2002). Interestingly,
injecting phencyclidine into the NAcc-s – but not the core – results in reward activity,
suggesting that the NAcc-s is specifically implicated in reward effects (Carlezon and Wise
1996). Growing evidence indicates that neurons in the NAcc-s are involved in several
processes that are disturbed in MDD, including encoding pleasure signals, integrating
motivational salience, and supporting reward-based reinforcement learning (Heller et al
Ho & Gutman, 17bioRxiv preprint first posted online Feb. 1, 2019; doi: http://dx.doi.org/10.1101/534370. The copyright holder for this preprint (which
was not peer-reviewed) is the author/funder, who has granted bioRxiv a license to display the preprint in perpetuity.
All rights reserved. No reuse allowed without permission.
2009; Misaki et al 2016; Whitton et al 2015). While more research in this area is clearly
needed, our results are consistent with neurobiological models of anhedonia and melancholic
MDD that implicate mesolimbic dysfunction and suggest that the NAcc-s – along with the
BLA – may be candidate treatment targets or biomarkers.
Finally, our finding of greater thalamic thickness and surface area in recurrent patients with
MDD relative to first-episode patients is an intriguing result that requires more research.
While one study of postmortem samples reported more neurons in the mediodorsal and
anteromedial nuclei of the thalamus in people diagnosed with MDD relative to CTL (Young et
al 2004), others have reported larger thalamic volumes in first-episode treatment-naïve
patients with MDD (Qiu et al 2014; Zhao et al 2014). Interestingly, in a meta-analysis by Bora
et al., late-life depression was associated with smaller thalamic volume (Bora et al 2012).
Lithium usage is associated with larger thalamic volumes in patients with bipolar disorder
(Lopez-Jaramillo et al 2017; Lyoo et al 2010), but it is unclear from our data as well as in the
current literature what the role of mood stabilizing medications are on brain structure in
patients with MDD. As we report in the Supplementary Information, patients receiving
antidepressant treatment at the time of scan did not differ, on average, in thalamus thickness
or surface area compared to CTL. It will be important for future research to carefully consider
the role of the thalamus in MDD and determine how illness recurrence and/or medication
usage affects morphometry of this structure.
It is worth noting some nuances in interpreting results from the two FDR-correction
approaches in light of our global analyses indicating smaller CA1 in patients with recurrent
depression versus first-episode depression but no differences in hippocampal shape
between these two clinical groups in our regional analyses. Generally, local-FDR correction
is more permissive: if some location in one of the regions passes the global-FDR threshold
for significance, then some location in one of the regions will pass that region’s local
threshold. However, these two regions may or may not be the same. For example, suppose
Ho & Gutman, 18bioRxiv preprint first posted online Feb. 1, 2019; doi: http://dx.doi.org/10.1101/534370. The copyright holder for this preprint (which
was not peer-reviewed) is the author/funder, who has granted bioRxiv a license to display the preprint in perpetuity.
All rights reserved. No reuse allowed without permission.
there are two regions, one of which exhibits a greater overall effect than the other. That is,
the local critical p-value will be higher (i.e., more permissive) for the first and lower (i.e., more
stringent) for the second, while the global critical p-value will lie somewhere between the two
localized values. Now, suppose some location in the first meets significance at the global
threshold, but no location for the second region meets significance at its respective local
threshold. In this instance, when viewing these results from the basis of a global-FDR
correction only, the first region would appear to exhibit a more significant effect (even though
it actually has a relatively smaller effect compared to the second region). Thus, both
correction methods provide opportunity for valid inferences in the sense of controlling for
FDR; we therefore tested and report results from both global-FDR and local-FDR correction
thresholds.
Overall, our effect sizes are small; nevertheless, they are comparable to what we have
reported in prior meta-analytic investigations comparing MDD and CTL in subcortical and
cortical regions (Schmaal et al 2017; Schmaal et al 2016). Further, for several of our
analyses, the percentage of surface area or thickness of the subcortical structure
demonstrating significant effects was sizable; for instance, relative to controls, patients with
early-onset MDD showed a reduction of over 22% of hippocampal surface area. Given the
heterogeneity of MDD as a disorder and the likely clinical heterogeneity across the different
study sites (e.g., illness duration, medication usage), it may be that several of the findings we
report here represent nuanced yet core variations in subcortical subregions as a function of
clinical characteristics in MDD (e.g., early-onset depression, recurrent depression, etc).
Strengths, limitations, and future directions
As the first multi-site meta-analytic study of subcortical shape in MDD, major strengths of our
investigation include the large number of observations sampled from several sites across the
world combined with the use of harmonization and standardized quality control across all of
these sites. Our large sample size provided us adequate statistical power to detect nuanced
Ho & Gutman, 19bioRxiv preprint first posted online Feb. 1, 2019; doi: http://dx.doi.org/10.1101/534370. The copyright holder for this preprint (which
was not peer-reviewed) is the author/funder, who has granted bioRxiv a license to display the preprint in perpetuity.
All rights reserved. No reuse allowed without permission.
effects of MDD on subcortical shape and also allowed us to include and correct for all 7
subcortical structures in our analyses.
Despite the harmonized preprocessing protocols and statistical analyses, one limitation of
our meta-analytic investigation is that because we combined pre-existing data across
worldwide samples, data collection protocols (e.g., scan sequences, depression
measurements) were not harmonized. Therefore, there may be important sources of
heterogeneity in both imaging acquisition protocols and in clinical assessments that will need
to be considered in future investigations. Finally, as we alluded to previously, investigating
the effects of antidepressant medication was challenging in the present study, as the majority
of sites did not collect detailed information on history, duration/adherence, type, and dosage
of antidepressant treatment. Future research studies focused on collecting detailed
information on lifetime, as well as current, medication usage in patients with MDD are
needed, to better understand how various antidepressants affect brain structure.
Conclusions
We identified reductions in stress-sensitive subfields of the hippocampus, particularly in the
subiculum, and in the basolateral amygdala in patients MDD compared to CTL; these effects
were driven by patients with an earlier onset of depression. Examining nuances in subcortical
shape may help disentangle the complex clinical influences on the brain basis of MDD and
potentially identify intervention more precise intervention targets or more sensitive
biomarkers of treatment response.
Ho & Gutman, 20bioRxiv preprint first posted online Feb. 1, 2019; doi: http://dx.doi.org/10.1101/534370. The copyright holder for this preprint (which
was not peer-reviewed) is the author/funder, who has granted bioRxiv a license to display the preprint in perpetuity.
All rights reserved. No reuse allowed without permission.
Table 1. List of primary (bolded) and supplemental statistical analyses. All site-specific
analyses included age, sex (as a factor), and intracranial volume (ICV) as covariates and all
meta-analytic models pooled each sample’s effect sizes (i.e., d or r) using an inverse
variance-weighted random effects model. For more information on each study site, please
see Table S1. Thickness is measured by radial distance and surface area is measured using
tensor-based morphometry. See Figures 1-2 for more details on results from the primary
analyses surviving global-FDR correction, Figures 3 and S1-S4 for more details of results
from the primary analyses surviving local-FDR correction, and Figures S5-S7 for results on
the supplemental analyses. MDD=Major Depressive Disorder; CTL=healthy controls;
EO=early-onset MDD (≤ 21 years old); LO=later-onset MDD (> 22 years old); FIRST=first-
episode MDD; RECUR=recurrent-episode MDD; MED=medicated at time of scan; NON=not
medicated at time of scan; HDRS-17=Hamilton Depression Rating Scale (17 items);
BDI=Beck’s Depression Inventory; n.s.=no significant effects; †interactions between age and
sex (separately) were also tested; # indicates dimensional analyses conducted within MDD
only.
Statistic # of # of Global-FDR Global-FDR Local-FDR Local-FDR
al MDD / # sites Correction Correction Correction Correction
Model of CTL / Results for Results for Results for Results for
total Thickness Surface Area Thickness Surface Area
sample (Cohen’s d / (Cohen’s d / (Cohen’s d / (Cohen’s d /
size % affected) % affected) % affected) % affected)
MDD v. 1781 / 10 n.s. n.s. Caudate: - Hipp: -0.113 /
CTL† 2953 / 0.199 / 0.80% 1.55%
4734 Amyg: -0.108 /
4.87%
NAcc: -0.124 /
8.64%
EO v. 476 / 9 Hipp: -0.172 / Hipp: -0.180 / Hipp: -0.173 / Hipp: -0.167 /
CTL 2879 / 4.51% 22.52% 3.70% 32.20%
3355 Amyg: -0.164 / Amyg: -0.168 / Amyg: -0.169 /
4.23% 6.01% 5.49%
LO v. 1028 / 9 n.s. n.s. n.s. NAcc: -0.129 /
CTL 2879 / 1.41%
3907 Caudate: -
0.172 / 5.51%
EO v. 1028 / 9 n.s. n.s. n.s. n.s.
LO 476 /
1504
RECUR 1273 / 10 n.s. n.s. Amyg: -0.126 / Amyg: -0.127 /
Ho & Gutman, 21bioRxiv preprint first posted online Feb. 1, 2019; doi: http://dx.doi.org/10.1101/534370. The copyright holder for this preprint (which
was not peer-reviewed) is the author/funder, who has granted bioRxiv a license to display the preprint in perpetuity.
All rights reserved. No reuse allowed without permission.
v. CTL 2953 / 4.27% 5.09%
4226 NAcc: -0.125 /
10.10%
FIRST 500 / 9 n.s. n.s. n.s. Hippocampus:
v. CTL 2879 / -0.172 / 1.72%
3379 Caudate: -
0.154 / 7.63%
RECUR 1174 / 9 Hipp: -0.173 / Hipp: -0.174 / Amyg: -0.168 / Thal: 0.159 /
v. 500 / 1.61% 1.94% 4.81% 14.80%
FIRST 1674 Amyg: -0.174 / Amyg: -0.183 / Thalamus:
3.45% 0.52% 0.171 / 8.82%
Thal: 0.177 / Thal: 0.176 /
6.79% 7.68%
MED v. 976 / 9 Hipp: -0.139 / Hipp: -0.136 / Caudate: - Hippocampus:
CTL 2879 / 2.99% 9.32% 0.125 / -0.133 / 9.93%
3855 Caudate: - Caudate: - 16.40% NAcc: -0.140 /
0.133 / 9.73% 0.140 / 2.31% 26.90%
NAcc: -0.143 /
22.10%
NON v. 797 / 9 n.s. n.s. n.s. Amyg: -0.135 /
CTL 2933 / 13.90%
3730
HDRS- 720 4 n.s. n.s. n.s. n.s
17#
BDI# 760 6 n.s. n.s. n.s. n.s
Ho & Gutman, 22bioRxiv preprint first posted online Feb. 1, 2019; doi: http://dx.doi.org/10.1101/534370. The copyright holder for this preprint (which
was not peer-reviewed) is the author/funder, who has granted bioRxiv a license to display the preprint in perpetuity.
All rights reserved. No reuse allowed without permission.
Figure 1. Global-FDR Corrected Results for EO v. CTL. A) Surface area effects in the
amygdala and hippocampus from a superior view (left) and an inferior view (right) B) Surface
area effects overlaid on the FreeSurfer v. 5.3 hippocampal subfield atlas (mirrored). Colored
bars correspond to range of effect sizes (Cohen’s d). All results are based on bilateral shape
measures (i.e., templates for corresponding left and right regions are vertex-wise registered
after reflecting one of them, and summed vertex-wise). See Table 1 in the main text for more
information.
Ho & Gutman, 23bioRxiv preprint first posted online Feb. 1, 2019; doi: http://dx.doi.org/10.1101/534370. The copyright holder for this preprint (which
was not peer-reviewed) is the author/funder, who has granted bioRxiv a license to display the preprint in perpetuity.
All rights reserved. No reuse allowed without permission.
Figure 2. Global-FDR Corrected Results for RECUR v. FIRST. A) Surface area effects in
the amygdala, hippocampus, and thalamus from a superior view (left) and an inferior view
(right) B) Surface area effects overlaid on the FreeSurfer v. 5.3 hippocampal subfield atlas.
Color bars correspond to range of effect sizes (Cohen’s d). All results are based on bilateral
shape measures (i.e., templates for corresponding left and right regions are vertex-wise
registered after reflecting one of them, and summed vertex-wise). See Table 1 in the main
text for more information.
Ho & Gutman, 24bioRxiv preprint first posted online Feb. 1, 2019; doi: http://dx.doi.org/10.1101/534370. The copyright holder for this preprint (which
was not peer-reviewed) is the author/funder, who has granted bioRxiv a license to display the preprint in perpetuity.
All rights reserved. No reuse allowed without permission.
Figure 3. Local-FDR Corrected Results for MDD v. CTL. A) Surface area effects in the
amygdala, hippocampus, and nucleus accumbens from an inferior view (right) B) Surface
area effects overlaid on the FreeSurfer v. 5.3 hippocampal subfield atlas. Color bars
correspond to range of effect sizes (Cohen’s d). All results are based on bilateral shape
measures (i.e., templates for corresponding left and right regions are vertex-wise registered
after reflecting one of them, and summed vertex-wise). See Table 1 in the main text for more
information.
Ho & Gutman, 25bioRxiv preprint first posted online Feb. 1, 2019; doi: http://dx.doi.org/10.1101/534370. The copyright holder for this preprint (which
was not peer-reviewed) is the author/funder, who has granted bioRxiv a license to display the preprint in perpetuity.
All rights reserved. No reuse allowed without permission.
Acknowledgments & Funding
This work was supported by NIH grants U54 EB020403 to PMT and R01 MH116147 to PMT.
The Study of Health in Pomerania (SHIP) is part of the Community Medicine Research net
(CMR) (http://www.medizin.uni-greifswald.de/icm) of the University Medicine Greifswald,
which is supported by the German Federal State of Mecklenburg- West Pomerania. MRI
scans in SHIP and SHIP-TREND have been supported by a joint grant from Siemens
Healthineers, Erlangen, Germany and the Federal State of Mecklenburg-West Pomerania.
The FOR2107 cohort was supported by the German Research Foundation (DFG, grant
FOR2107 DA1151/5-1 and DA1151/5-2 to UD; SFB-TRR58, Projects C09 and Z02 to UD;
grant FOR2107 KR 3822/7-2 to AK; FOR2107 KI 588/14-2 to TK, FOR2107 NE 2254/1-2 to
IN and FOR2107 JA 1890/7-2 to AJ), the Interdisciplinary Center for Clinical Research (IZKF)
of the medical faculty of Münster (grant Dan3/012/17 to UD).
DIP-Groningen cohort was supported by the Gratama Foundation, the Netherlands (2012/35
to NG).
The CODE cohort was collected from studies funded by Lundbeck and the German
Research Foundation (WA 1539/4-1, SCHN 1205/3-1, SCHR443/11-1).
The Magdeburg-Sexpect cohort was supported by the German Research Foundation (DFG-
SFB779/TPA06).
LS is supported by a NHMRC Career Development Fellowship (1140764). TCH is supported
by NIH grant K01 MH117442. NJ is supported by NIH grants R01 MH117601, R01
AG059874, and U54 EB020403. PMT is supported in part by NIH grants U54 EB020403,
R01 MH116147, R56 AG058854, R01 MH111671 and P41 EB015922. HJG is supported in
Ho & Gutman, 26bioRxiv preprint first posted online Feb. 1, 2019; doi: http://dx.doi.org/10.1101/534370. The copyright holder for this preprint (which
was not peer-reviewed) is the author/funder, who has granted bioRxiv a license to display the preprint in perpetuity.
All rights reserved. No reuse allowed without permission.
part by the German Research Foundation (DFG), the German Ministry of Education and
Research (BMBF), the DAMP Foundation, Fresenius Medical Care, the EU Joint Programme
Neurodegenerative Disorders (JPND) and the European Social Fund (ESF). IHG is
supported in part by NIH grant R37 MH101495. PGS is supported in part by the German
Research Foundation (DFG, SA 1358/2-1) and the Max Planck Institute of Psychiatry,
Munich.
HJG has received travel grants and speakers honoraria from Fresenius Medical Care and
Janssen Cilag. KS has consulted for Roche Pharmaceuticals and Servier Pharmaceuticals.
PMT has received partial research support from Biogen, Inc. unrelated to the topic of this
manuscript. All other authors declare no biomedical conflicts of interest.
The funding agencies played no role in the design and conduct of the study; collection,
management, analysis, and interpretation of the data; and preparation, review, or approval of
the manuscript.
Ho & Gutman, 27bioRxiv preprint first posted online Feb. 1, 2019; doi: http://dx.doi.org/10.1101/534370. The copyright holder for this preprint (which
was not peer-reviewed) is the author/funder, who has granted bioRxiv a license to display the preprint in perpetuity.
All rights reserved. No reuse allowed without permission.
References
Alheid GF, Heimer L (1988): New perspectives in basal forebrain organization of special
relevance for neuropsychiatric disorders: the striatopallidal, amygdaloid, and
corticopetal components of substantia innominata. Neuroscience 27:1-39.
Bearden CE, Thompson PM, Avedissian C, Klunder AD, Nicoletti M, Dierschke N, et al
(2009): Altered hippocampal morphology in unmedicated patients with major
depressive illness. ASN Neuro 1.
Beck AT, Ward CH, Mendelson M, Mock J, Erbaugh J (1961): An inventory for measuring
depression. Arch Gen Psychiatry 4:561-571.
Bertran-Gonzalez J, Bosch C, Maroteaux M, Matamales M, Herve D, Valjent E, et al (2008):
Opposing patterns of signaling activation in dopamine D1 and D2 receptor-expressing
striatal neurons in response to cocaine and haloperidol. The Journal of neuroscience
: the official journal of the Society for Neuroscience 28:5671-5685.
Boldrini M, Santiago AN, Hen R, Dwork AJ, Rosoklija GB, Tamir H, et al (2010):
Hippocampal granule neuron number and dentate gyrus volume in antidepressant-
treated and untreated major depression. Neuropsychopharmacology 38:1068-1077.
Bora E, Harrison BJ, Davey CG, Yucel M, Pantelis C (2012): Meta-analysis of volumetric
abnormalities in cortico-striatal-pallidal-thalamic circuits in major depressive disorder.
Psychol Med 42:671-681.
Borenstein M, Hedges LV, Higgins JP, Rothstein HR (2010): A basic introduction to fixed-
effect and random-effects models for meta-analysis. Res Synth Methods 1:97-111.
Carlezon WA, Jr., Wise RA (1996): Rewarding actions of phencyclidine and related drugs in
nucleus accumbens shell and frontal cortex. The Journal of neuroscience : the official
journal of the Society for Neuroscience 16:3112-3122.
Davidson RJ, Pizzagalli D, Nitschke JB, Putnam K (2002): Depression: perspectives from
affective neuroscience. Annu Rev Psychol 53:545-574.
Deutch AY, Cameron DS (1992): Pharmacological characterization of dopamine systems in
the nucleus accumbens core and shell. Neuroscience 46:49-56.
Fanselow MS, Dong HW (2010): Are the dorsal and ventral hippocampus functionally distinct
structures? Neuron 65:7-19.
Fischl B (2002): FreeSurfer. Neuroimage 62:774-781.
Francis TC, Chandra R, Friend DM, Finkel E, Dayrit G, Miranda J, et al (2015): Nucleus
accumbens medium spiny neuron subtypes mediate depression-related outcomes to
social defeat stress. Biol Psychiatry 77:212-222.
Frodl T, Janowitz D, Schmaal L, Tozzi L, Dobrowolny H, Stein DJ, et al (2016): Childhood
adversity impacts on brain subcortical structures relevant to depression. J Psychiatr
Res 86:58-65.
Frodl TS, Koutsouleris N, Bottlender R, Born C, Jager M, Scupin I, et al (2008): Depression-
related variation in brain morphology over 3 years: effects of stress? Arch Gen
Psychiatry 65:1156-1165.
Gutman BA, Jahanshad N, Ching CR, Wang Y, Kochunov PV, Nichols TE, et al (2015):
Medial Demons Registration Localizes The Degree of Genetic Influence Over
Subcortical Shape Variability: An N= 1480 Meta-Analysis. Proc IEEE Int Symp
Biomed Imaging 2015:1402-1406.
Gutman BA, Wang Y, Rajagopalan P, Toga AW, Thompson PM (2012): Shape matching with
medial curves and 1-D group-wise registration. Biomedical Imaging (ISBI), 2012 9th
IEEE International Symposium on: IEEE, pp 716-719.
Haber SN (2016): Corticostriatal circuitry. Dialogues Clin Neurosci 18:7-21.
Haber SN, Knutson B (2010): The reward circuit: linking primate anatomy and human
imaging. Neuropsychopharmacology 35:4-26.
Hamilton JP, Siemer M, Gotlib IH (2008): Amygdala volume in major depressive disorder: a
meta-analysis of magnetic resonance imaging studies. Mol Psychiatry 13:993-1000.
Hamilton M (1960): A rating scale for depression. Journal of neurology, neurosurgery, and
psychiatry 23:56.
Hammen C (2005): Stress and depression. Annu Rev Clin Psychol 1:293-319.
Ho & Gutman, 28You can also read