Left superior temporal sulcus morphometry mediates the impact of anxiety and depressive symptoms on sleep quality in healthy adults
←
→
Page content transcription
If your browser does not render page correctly, please read the page content below
Social Cognitive and Affective Neuroscience, 2021, 1–10
doi: 10.1093/scan/nsab012
Advance Access Publication Date: 29 January 2021
Original Manuscript
Left superior temporal sulcus morphometry mediates
Downloaded from https://academic.oup.com/scan/advance-article/doi/10.1093/scan/nsab012/6123709 by guest on 28 April 2021
the impact of anxiety and depressive symptoms on
sleep quality in healthy adults
Yanlin Wang,1,* Ping Jiang,1,* Shi Tang,1 Lu Lu,1 Xuan Bu,1
Lianqing Zhang,1 Yingxue Gao,1 Hailong Li,1 Xinyu Hu,1 Song Wang,1
Zhiyun Jia,1 Neil Roberts,2 Xiaoqi Huang,1,3,4 and Qiyong Gong1,3,4
1
Huaxi MR Research Center (HMRRC), Department of Radiology, West China Hospital of Sichuan University,
Chengdu, Sichuan 610041, China, 2 School of Clinical Sciences, The Queen’s Medical Research Institute (QMRI),
University of Edinburgh, Edinburgh EH164TJ, UK, 3 Research Unit of Psychoradiology, Chinese Academy of
Medical Sciences, Chengdu, Sichuan 610041, China, and 4 Functional and Molecular Imaging Key Laboratory of
Sichuan Province, Chengdu, Sichuan 610041, China
Correspondence should be addressed to Xiaoqi Huang, Huaxi MR Research Center (HMRRC) and Department of Radiology, West China Hospital of
Sichuan University, Chengdu, Sichuan 610041, China. E-mail: julianahuang@163.com.
*These authors contributed equally to this study.
Abstract
Anxiety and depressive symptoms may predispose individuals to sleep disturbance. Understanding how these emotional
symptoms affect sleep quality, especially the underlying neural basis, could support the development of effective treatment.
The aims of the present study were therefore to investigate potential changes in brain morphometry associated with poor
sleep quality and whether this structure played a mediating role between the emotional symptoms and sleep quality. One
hundred and forty-one healthy adults (69 women, mean age = 26.06 years, SD = 6.36 years) were recruited. A structural mag-
netic resonance imaging investigation was performed, and self-reported measures of anxiety, depressive symptoms and sleep
quality were obtained for each participant. Whole-brain regression analysis revealed that worse sleep quality was associated
with thinner cortex in left superior temporal sulcus (STS). Furthermore, the thickness of left STS mediated the association
between the emotional symptoms and sleep quality. A subsequent commonality analysis showed that physiological compo-
nent of the depressive symptoms had the greatest influence on sleep quality. In conclusion, thinner cortex in left STS may
represent a neural substrate for the association between anxiety and depressive symptoms and poor sleep quality and may
thus serve as a potential target for neuromodulatory treatment of sleep problems.
Key words: sleep quality; depressive symptoms; anxiety; superior temporal sulcus (STS); magnetic resonance imaging (MRI)
Received: 6 July 2020; Revised: 21 December 2020; Accepted: 29 January 2021
© The Author(s) 2021. Published by Oxford University Press.
This is an Open Access article distributed under the terms of the Creative Commons Attribution License (http://creativecommons.org/licenses/by/4.0/),
which permits unrestricted reuse, distribution, and reproduction in any medium, provided the original work is properly cited.
1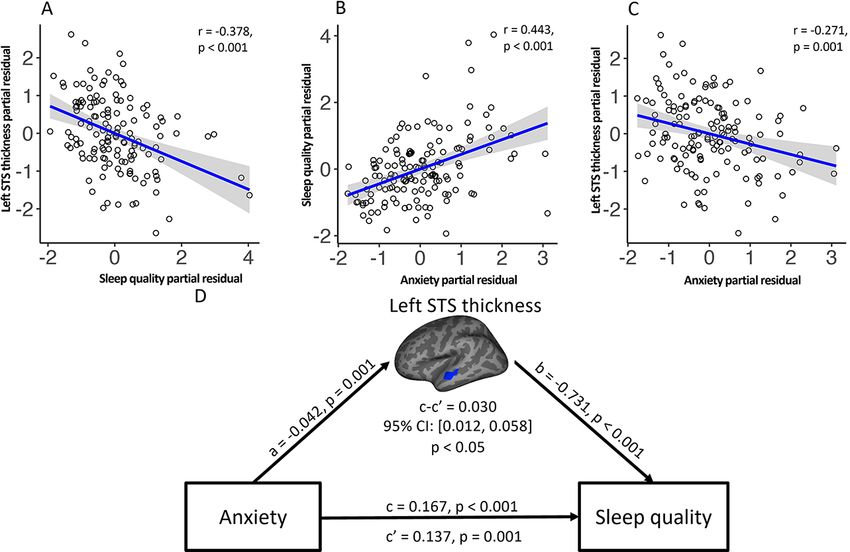
2 | Social Cognitive and Affective Neuroscience, 2021, Vol. 00, No. 00

Introduction                                                            Table 1. Demographic information regarding the study participants

Sleep serves a critical function allowing brain restoration and         Characteristic                                    Mean (s.d.)
repair to ensure metabolic homeostasis, clearance of neurotoxic
waste products (Huang et al., 2016; Fultz et al., 2019) and regula-     Age (years)                                       26.06 (6.36)
tion of endocrine and immune systems (Irwin et al., 2003; Bonnet        Female, no. (%)                                   69 (49%)
and Arand, 2010).                                                       Education level                                   5 (1–6)a
    Poor sleep quality, including difficulties in initiating or main-   SAS                                               35.27 (6.63)
taining sleep and sleep which is non-restorative (Montgomery             Affective component                              7.16 (1.91)
and Dennis, 2004; Buysse, 2013), has been reported to be associ-         Somatic component                                21.19 (4.07)
ated with abnormal emotional symptoms (Ohayon, 2002; Sateia,            SDS                                               38.78 (8)

                                                                                                                                                      Downloaded from https://academic.oup.com/scan/advance-article/doi/10.1093/scan/nsab012/6123709 by guest on 28 April 2021
                                                                         Affective component                              2.77 (0.95)
2009), particularly anxiety and depressive symptoms (Breslau
                                                                         Physiological component                          12.50 (2.79)
et al., 1996; Baglioni et al., 2011). Previous studies have provided
                                                                         Psychological component                          15.69 (3.80)
evidence that anxiety and depressive symptoms may predis-
                                                                        PSQI
pose individuals to sleep disturbance (Vahtera et al., 2007), and
                                                                         PSQI total score                                 4.71 (2.51)
sleep disturbance is an underlying feature of both anxiety and
depressive symptoms (Goldstein-Piekarski et al., 2020). It is pos-      a
                                                                          Encoding for education levels: uneducated = 1, primary school = 2, junior
sible that recurrent emotional symptoms trigger an inadequate           middle school = 3, high school = 4, university = 5, post-graduation = 6.
resolution of emotional distress or biased processing of emo-
tional information resulting in poor sleep quality (Vahtera et al.,
2007; Wassing et al., 2019; Ben Simon et al., 2020). Thus, under-
                                                                        Materials and methods
standing how anxiety and depressive symptoms affect sleep               Participants
quality, especially the underlying neural basis, could provide
an empirical basis for developing new therapeutic interventions         Participants were recruited between August 2018 and September
(Cummings et al., 2014; Klein et al., 2018).                            2019 by means of posters and flyers distributed at West China
    Recently, psychoradiologic studies have been a useful way           Hospital of Sichuan University. A total of 141 healthy adults
to explore relationship between behavior and brain structure or         (69 women and 72 men, mean age = 26.06 years, SD = 6.36 years)
function (Gong, 2020; Sun et al., 2018; Huang et al., 2019), and        who had all completed either high school (level 4), undergrad-
there is evidence that anomalies in brain function may play a           uate school education (level 5) or graduate school education
role in the relationship between emotional symptoms and sleep           (level 6) were enrolled (see Table 1). Each participant com-
quality. In particular, abnormal activation of medial prefrontal        pleted self-reported questionnaires concerning sleep quality,
cortex and altered connectivity with extended limbic regions            anxiety and depression and MRI scanning at the Huaxi Mag-
may underlie the link between anxiety and sleep disturbance             netic Resonance Research Center. Exclusion criteria included
(Ben Simon et al., 2020) and that altered connectivity between          a history of neurological or psychiatric disorders, sleep disor-
the dorso-lateral prefrontal cortex, precuneus and lateral orbito-      der, use of sleep medications or MRI contraindications. The
frontal cortex may underlie the link between depressive symp-           study was approved by the local Research Ethics Committee,
toms and poor sleep quality (Cheng et al., 2018). On the other          and all participants provided fully informed written informed
hand, studies of brain structure have shown widespread atro-            consent.
phy of frontal, temporal and parietal regions in people with poor
                                                                        Behavioral measurement
sleep quality (Sexton et al., 2014) and increased volume of the
rostral anterior cingulate (Winkelman et al., 2013), which are          The sleep quality of each participant was assessed using the
also distinguishing features in patients with anxiety (Pink et al.,     Pittsburgh Sleep Quality Inventory (PSQI), which is a self-
2017a) and depressive symptoms (Szymkowicz et al., 2016; Pink,          reported questionnaire relating to experience during the month
et al., 2017b; Bartlett et al., 2019). However, whether brain mor-      prior to testing. PSQI scores range from 0 to 21, with a higher
phometry plays a role in the link between emotional symptoms            score indicating poorer sleep quality and a total score greater
and sleep disturbance is still unknown.                                 than 5 adjudged as indicating poor sleep quality (Buysse et al.,
    The main objective of the present study was therefore to            1989).
use structural magnetic resonance imaging (MRI) and mediation               Anxiety and depression scores for each participant were
analysis to identify those brain morphometric features under-           obtained using the Self-rating Anxiety Scale (SAS) and the Self-
lying the association of emotional symptoms and poor sleep              rating Depression Scale (SDS). Validation studies have demon-
quality in a cohort of healthy adults. We hypothesized that (i)         strated good acceptability, internal consistency and validity in
poor sleep quality was associated with cortical morphometric            the general population (Shen et al., 2017). The SAS is a 20-item
changes, (ii) poor sleep quality–linked cortical morphometric           questionnaire which includes components relating to affective
changes would also be associated with emotional symptoms                and somatic aspects of anxiety (Zung, 1971). The SDS is also a
and (iii) these cortical morphometric changes may mediate the           20-item self-reporting questionnaire and includes components
associations between emotional symptoms and sleep quality.              relating to affective, psychological and physiological aspects of
In addition, commonality analysis was performed to examine              depression (Zung et al., 1965). For both SAS and SDS, scores in
the unique and shared variance partitions of emotional symp-            each item are added to form a total raw score with range from 20
toms in accounting for sleep problems to further understand             to 80 and which was multiplied by a factor of 1.25 to obtain a so-
the unique and common features of anxiety and depressive                called Index Score with a maximum value of 100. Index scores
symptoms and their effects on sleep quality.                            of more than 50 indicate significant anxiety and/or depressive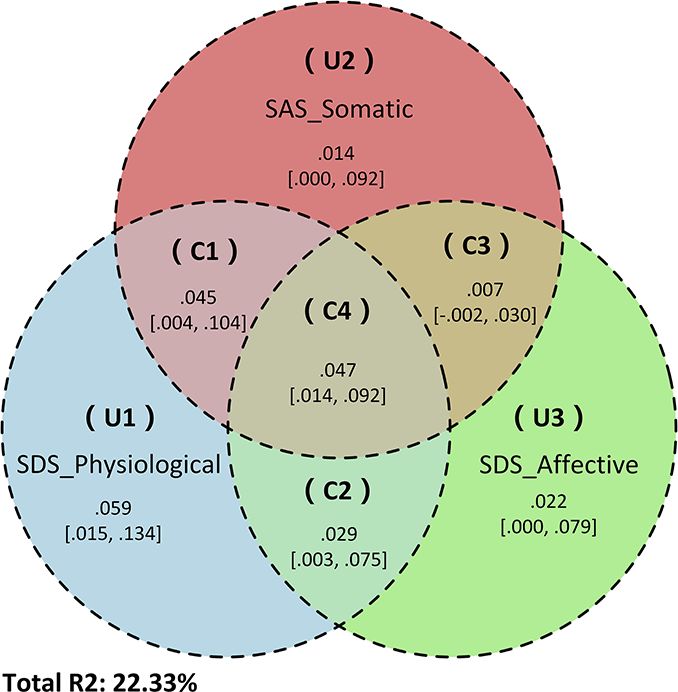
Y. Wang et al. | 3

symptoms, respectively, and higher index scores indicate more         Statistical analyses
severe symptoms (Zung, 1974). A separate analysis was also
                                                                      Relationship between sleep quality and brain
performed of the separate sub-scores of SAS and SDS.
   Cronbach’s α coefficient was computed using psychometric
                                                                      morphometry
package in R-studio (https://CRAN.R-project.org/package=psyc          Vertex-wise maps of cortical thickness, surface area and vol-
hometric) as a measure of the reliability (i.e. internal consis-      ume were generated for each participant using the FreeSurfer
tency) of the behavioral measures. The distribution plots of the      application called Qdec (query, design, estimate, contrast;
PSQI, SAS and SDS as well as the sub-scores of SAS and SDS are        http://surfer.nmr.mgh.harvard.edu). The maps were coregis-
presented in Supplementary Figure S6.                                 tered to a common spherical coordinate system and spatially
                                                                      smoothed with a 10 mm Gaussian kernel. A general linear

                                                                                                                                             Downloaded from https://academic.oup.com/scan/advance-article/doi/10.1093/scan/nsab012/6123709 by guest on 28 April 2021
                                                                      model (GLM) was applied in Qdec to estimate the vertex-wise
Image acquisition
                                                                      correlations of PSQI scores and the morphological parameters
MRI investigations were performed using a 3 T Trio imaging sys-       (i.e. cortical thickness, surface area and volume) of the left and
tem (Siemens Healthineers, Erlangen, Germany). 92 participants        right cerebral hemispheres separately, controlling for age, sex,
were examined with the 32 channels phased-array head coil and         education level and whether data were acquired using the 12-
49 participants with the 12 channels phased-array head coil.          or 32-channel head coil. The vertex-wise maps were threshold
For each participant, a high-spatial-resolution 3D T1-weighted        at P < 0.01 and submitted to Monte Carlo null-z simulation clus-
spoiled gradient recalled image was acquired with repetition          ter analyses with 10 000 iterations, and a cluster-level thresh-
time 1900 ms, echo time 2.26 ms, flip angle 9◦ , matrix size          old of P < 0.01 was used to correct for multiple comparisons
256 × 256, field of view 256 mm × 256 mm and slice thickness          (Scherpiet et al., 2015; Perlman et al., 2017). The clusters that
1.0 mm. The 3D image comprises a total of 176 contiguous slices       remained significant were used in all subsequent analyses
and has a voxel size of 1.0 mm × 1.0 mm × 1.0 mm. In addi-            with locations defined according to the Desikan–Killiany atlas
tion, a standard diagnostic series of T2-weighted MR images           (Desikan et al., 2006). For analysis of sub-cortical (i.e. deep) GM,
were acquired using a fast spin echo sequence to check for inci-      relevant volumes were obtained separately using the FreeSurfer
dental findings and to potentially exclude any participants with      automatic sub-cortical GM segmentation (Fischl et al., 2002).
brain structural abnormalities from inclusion in the analysis.        Eight bilateral structures were studied, namely thalamus, cau-
Earplugs and foam pads were used to protect participants’ hear-       date, putamen, pallidum, hippocampus, amygdala, nucleus
ing and minimize head movement during MR scanning. Images             accumbens and ventral diencephalon. The GLM tests to estimate
were immediately reviewed by a neuroradiologist, and repeat           the relationship between PSQI and the sub-cortical GM volumes
scanning was performed for participants for whom substantial          controlling for age, sex, education level and head coil were per-
motion or other artifacts were present in the original 3D MR          formed by using SPSS software (IBM SPSS 25.0). Partial residuals
image.                                                                of the cortical and sub-cortical GM measures showing signifi-
                                                                      cant associations with sleep quality after regressing out head
                                                                      coil covariance were calculated for use in subsequent correlation
Imaging preprocessing
                                                                      and mediation analyses.
The quality of each T1-weighted image was visually checked
again to guarantee consistent data quality. The T1-weighted
                                                                      Correlation between anxiety and depression scores,
3D MR images were then processed using FreeSurfer software
                                                                      sleep quality and brain morphometry
(version 6.0.0, http://surfer.nmr.mgh.harvard.edu/) (Dale et al.,
1999; Fischl et al., 1999), including skull stripping, alignment to   Partial correlation analysis with age, sex and education level as
Talairach space, intensity normalization, segmentation of gray        confounding variables was used to identify potentially signif-
matter (GM) and white matter (WM), topology correction and            icant relationships between anxiety and depression measures
surface deformation along intensity gradients for optimal place-      [i.e. total and sub-scores of anxiety (SAS) and depression (SDS)]
ment of the borders between cortical GM, WM and cerebrospinal         and (i) the sleep quality measure (PSQI) and (ii) the brain mor-
fluid. The models of the pial surface and boundary between GM         phology clusters significantly associated with PSQI.
and WM were overlaid on the T1-weighted image and inspected
for fidelity to visible tissue class boundaries. When inaccurate
                                                                      Mediation analyses
tissue delineation persisted for six or more consecutive slices,
the result was deemed inaccurate (Iscan et al., 2015) and cor-        Subsequently, a mediation analysis was performed to inves-
rection was performed by appropriate manual editing, includ-          tigate whether the sleep quality–linked brain morphometry
ing addition of control points in WM voxels or removing the           potentially mediated a significant relationship between the
skull and dura when erroneously considered to be part of the          independent variable (IV) being those anxiety and/or depression
brain. Next, a surface-fitting algorithm was iteratively applied      scores which significantly correlated with sleep quality–linked
to fit the GM–WM boundary in the segmented image. This sur-           morphometry, and the dependent variable (DV) of sleep quality
face was inflated constrained by the Laplacian of the image to        index (PSQI), and controlling for age, sex and education level.
generate the pial surface. The GM–WM boundary and pial sur-           Mediation analysis is a path analysis used to statistically eval-
faces were nonlinearly aligned to a symmetric surface template        uate how IVs transmit their causal effects on the DV through
using a spherical registration that guarantees vertex-wise cor-       intervening variables or mediators (Hayes, 2018; Wang et al.,
respondence of each surface across all subjects (Fischl et al.,       2020). The analysis was performed by using the Hayes PRO-
1999).                                                                CESS macro36 with a 10 000 bias-correction bootstrapping pro-
4 | Social Cognitive and Affective Neuroscience, 2021, Vol. 00, No. 00
cedure for significance testing (Preacher and Kelley, 2011) using Correlation between sleep quality, anxiety and
SPSS software (https://www.ibm.com/analytics/spss-statistics- depression res and brain morphometry
software).
Partial correlation analyses with age, sex and education level
as confounding variables were used to investigate the poten-
Exploratory commonality analyses tial relationships between anxiety and depression measures
[i.e. total and sub-scores of anxiety (SAS) and depression (SDS)]
Since 2 of the 20 items (numbers 19 and 20) in the SAS and 1
and (i) the sleep quality measure (PSQI) and (ii) the brain
of the 20 items (number 4) in the SDS were related to the topic
morphology clusters significantly associated with PSQI. Signif-
of sleep quality, the correlation analyses between anxiety and
icant correlations were found between SAS (r = 0.443, P < 0.001)
depression measures [i.e. total and sub-scores of anxiety (SAS)
(Figure 1B), SDS (r = 0.407, P < 0.001) (Supplementary Figure S1)
Downloaded from https://academic.oup.com/scan/advance-article/doi/10.1093/scan/nsab012/6123709 by guest on 28 April 2021
and depression (SDS)] and (i) the sleep quality measure (PSQI)
and PSQI scores. Similarly, significant correlations were found
and (ii) the brain morphology clusters significantly associated
between SAS (r = −0.271, P = 0.001) (Figure 1C), SDS (r = −0.189,
with PSQI, as well as the subsequent mediation analyses, were
P = 0.027) (Supplementary Figure S2) and thickness of the middle
repeated with these tests eliminated to avoid any potential influ-
portion of STS.
ence of collinearity. In addition, to obtain a better appreciation
For the tests for sub-scores of emotional symptoms, signif-
of the nature of the associations between anxiety, depressive
icant correlations were found between all the SAS sub-scores
symptoms and sleep quality, the proportions of unique and
(affective component: r = 0.278, P = 0.001; somatic component:
overlapping partitions among the emotional symptom sub-
r = 0.477, P < 0.001), all SDS sub-scores (affective component:
scores of SAS and SDS showing significant mediating effects
r = 0.340, P < 0.001; psychological component: r = 0.283, P = 0.001;
on sleep quality were assessed using a systematic commonality
physiological component: r = 0.462, P < 0.001) and sleep quality
analysis (Nimon et al., 2008). A Venn diagram was constructed
as measured by PSQI (see Supplementary Figure S1). In addi-
to show the relationship among these factors using the Ven-
tion, significant correlations were found between all the SAS
nDiagram package in R-studio (https://www.rdocumentation.
sub-scores (affective component: r = −0.219, P = 0.009; somatic
org/packages/VennDiagram) (see Supplementary Materials).
component: r = −0.304, P < 0.001), two of the three SDS sub-
scores (i.e. affective component: r = −0.205, P = 0.016; physio-
Results logical component: r = −0.246, P = 0.004) and thickness of the
middle portion of STS (see Figure 2 and Supplementary Figure
The descriptive statistics for participant demographics and S2). No significant correlation was found between the psycho-
sleep quality (PSQI), anxiety (SAS) and depression (SDS) mea- logical component of SDS and STS thickness (P = 0.287).
sures are listed in Table 1 and plotted in Supplementary Figure
S6. Cronbach’s α coefficient analysis showed good reliability
for PSQI (α = 0.74), SAS (α = 0.80) and SDS (α = 0.81) confirming Mediation analysis
that the three behavior measures had a satisfactory discrimi-
nating power (Henson, 2001). Approximately 32% of participants Mediation analysis was performed to investigate whether STS
reached the PSQI cutoff value for poor sleep quality. In addition, thickness could explain the association between sleep quality
while most participants experienced some symptoms of anxi- (DV) and anxiety and depression scores (IV), after controlling
ety and/or depression, only 3% or 6% reached the respective SDS for age, sex and education level. This revealed that left STS
and SAS cutoff values for mild depression and anxiety criteria. thickness significantly mediated the effect of SAS (β = 0.030,
SE = 0.012, P < 0.05), the somatic component of SAS (β = 0.041,
SE = 0.015, P < 0.05), and the affective (β = 0.161, SE = 0.072,
Relationship between sleep quality and brain P < 0.05) and physiological (β = 0.052, SE = 0.020, P < 0.05) com-
morphometry ponents of SDS on PSQI (see Figures 1D and 2, and details in
Supplementary Table S1).
Regression analyses were conducted to detect potential relation-
ships between sleep quality as measured using the PSQI and
brain cortical thickness, surface area and volume. A significant
Exploratory commonality analysis
correlation was found between PSQI and cortical thickness for
a cluster in the middle portion of left superior temporal sulcus After excluding the sleep-related items in SAS (items 19 and 20)
(STS) (Monte Carlo corrected) after controlling for age, sex, edu- and SDS (item 4), all the significant correlations and medi-
cation level and head coil (Table 2). In particular, higher PSQI was ation models described above remained significant (see Sup-
associated with thinner cortex in left STS (r = −0.378, P < 0.001) plementary Figures S3–S5, Supplementary Table S2). Next, an
(Figure 1A). No other clusters were found exhibiting significant exploratory commonality analysis was performed to obtain a
correlation between PSQI and cortical thickness, surface area or better appreciation of the contributions of unique and overlap-
volume. ping partitions among the sub-scores of SAS and SDS which
Table 2. Results of the association between PSQI score and surface-based brain morphometry
Cluster annotationa Measure CWP P value Cluster size VtsMax Talairach coordinates Direction of effect
(90% CI) (mm2 ) (x, y, z)
Left Mid-STS Cortical thickness [0.0077, 0.0101] 504.88 −49.0, −11.4, −12.4 Worse sleep quality,
thinner
Abbreviations: Mid, middle; CI, confidence interval; CWP, cluster-wise probability; VtxMax, no. of peak vertices of the significant cluster.
a
Annotation of clusters according to the FreeSurfer atlas.Y. Wang et al. | 5
Downloaded from https://academic.oup.com/scan/advance-article/doi/10.1093/scan/nsab012/6123709 by guest on 28 April 2021
Fig. 1. Results of mediation analysis of the association between anxiety, sleep quality (PSQI) and sleep quality–linked brain region after controlling for age, sex and
education level. The upper three panels show (A) the negative correlation between cortical thickness of left STS and sleep quality, (B) the positive correlation between
sleep quality and anxiety score and (C) the negative correlation between cortical thickness of left STS and anxiety score revealed by the partial correlation analysis.
The lower panel (D) shows the results of the mediation analysis with a path diagram showing the strength of the associations whereby anxiety affects sleep quality
through the thickness of the left STS. All data are standardized partial residuals after controlling for age, sex and education level. The indirect effect (c–c′ or a × b) was
significant (for detailed information, see Supplementary Table S1).
showed significant mediating effects through left STS thickness sex and education level. Furthermore, commonality analyses
on sleep quality, namely the somatic component of SAS and the revealed that the physiological component of SDS accounted for
affective and physiological components of SDS, with the sleep- the largest part of the variance in sleep quality. Taken together,
related items excluded from both. Overall, the combination of these findings suggest that left STS may mediate the influence of
the three abovementioned SAS and SDS sub-scores accounted anxiety and depressive symptoms, especially the physiological
for 22.33% of the variance in PSQI. The physiological compo- component of depression, on sleep quality.
nent of SDS alone accounted for 18.01% of the variance, and the The observation that poor sleep quality is associated with
combination of the somatic component of SAS and physiological thinner cortex in the middle portion of left STS is consistent
component of SDS accounted for 4.5% of the variance. The phys- with a previous longitudinal study in which it was reported that
iological component of SDS accounted for an additional 5.91% poor sleep quality was associated with atrophy of left tempo-
of the variation in PSQI. In contrast, the somatic component of ral cortex, including STS (Sexton et al., 2014) and in line with
SAS, affective component of SDS and the combination of the lat- several other studies in which increased cortical atrophy and
ter two only accounted for 1.4%, 2.22% and 0.7% of the variation reduced cortical thickness was reported in people with sleep dis-
in PSQI, respectively. These findings are illustrated in Figure 3 turbances (Mander et al., 2013; Dai et al., 2018; Pereira et al., 2019).
and summarized in Supplementary Table S3. The size, density and arrangement of neurons, neuroglia and
nerve fibers can all influence the thickness of the cerebral cortex
(Narr et al., 2005; Geuze et al., 2008), and cortical thinning in STS
Discussion
may be related to decreased neuron number, neuron shrinkage,
In the current study, the brain structural variation underlying reduction in synaptic density or changes in myelination (Gogtay
sleep quality and the association of sleep quality with measures et al., 2004; Shaw et al., 2006). A prime function of sleep is to allow
of anxiety and depressive symptoms has been investigated. A repair and restoration of brain function, and sleep has recently
significant correlation was observed between poor sleep quality been shown to be associated with increased expression of genes
and the thickness of the cerebral cortex in the middle por- involved in the formation and maintenance of myelin (Bellesi
tion STS. Furthermore, the thickness of the cerebral cortex in et al., 2013). Thus, poor sleep quality may be expected to pro-
this brain region was found to mediate the association between duce microstructural changes in the brain and have an impact
anxiety, and especially the somatic component of anxiety, as on brain structure, and one possibility is that the directional-
measured by SAS and the physiological and affective compo- ity of the effect observed in the present study is that poor sleep
nents of depression as measured by SDS and poor sleep quality. quality leads to reduced myelination and thinner cerebral cortex
All of these results remained significant after accounting for age, especially in left STS. However, it is of course also possible that6 | Social Cognitive and Affective Neuroscience, 2021, Vol. 00, No. 00
Downloaded from https://academic.oup.com/scan/advance-article/doi/10.1093/scan/nsab012/6123709 by guest on 28 April 2021
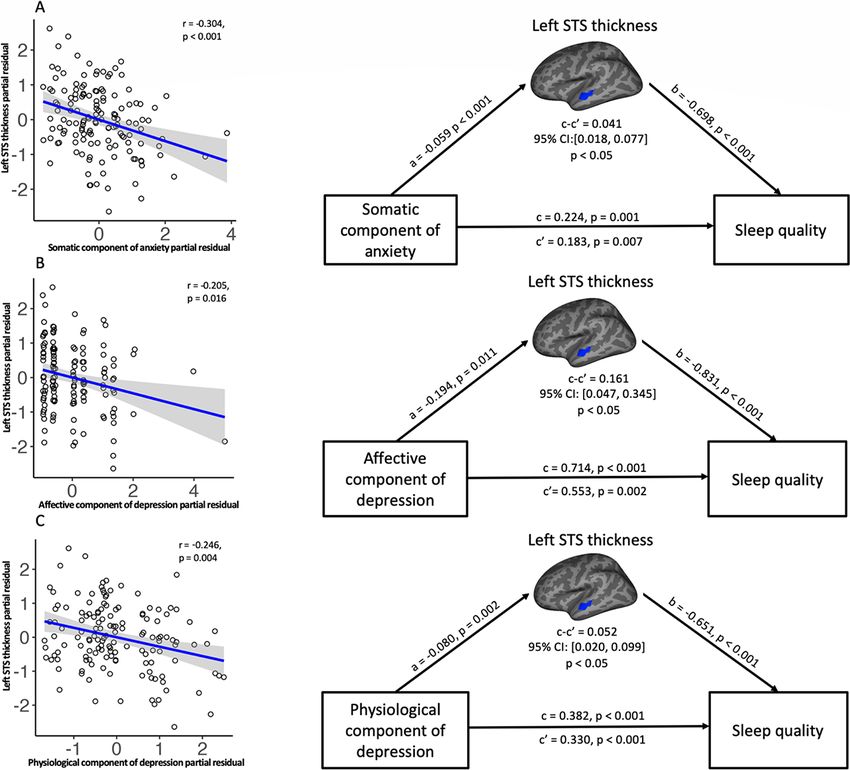
Fig. 2. Results of mediation analysis of the association between results of SAS and SDS sub-scores, sleep quality (PSQI) and sleep quality–linked brain region, after
controlling for age, sex and education level. The upper, middle and lower rows, respectively, refer to (A) the somatic component of the SAS, (B) the affective component
of the SDS and (C) the physiologic component of the SDS, which all show negative correlation with cortical thickness of left STS as shown in the left panels. Path
diagrams of the mediation analysis are shown in the corresponding right panels. All data are standardized partial residuals after controlling for age, sex and education
level. All indirect effects (c–c′ or a × b) were significant.
thinner cortex in left STS is a pre-existing trait in subjects with in understanding, reacting to and managing their emotional
poor sleep quality. Further longitudinal studies are needed to experiences, and it is possible that the level of emotion dys-
more fully understand the brain structure–function relationship regulation could effectively predict the presence of anxiety
that has been observed. disorder or symptoms (Mennin et al., 2005). Similarly, people
There is evidence from functional neuroimaging studies that who are depressed exhibit anomalies in emotional responses
the middle portion of left STS is involved in processing aspects to positive and negative stimuli, such as pleasant and sad
of human social communication, such as speech (Binder et al., films, and a lower degree of sadness reactivity is associated
2000; Jäncke et al., 2002) and vocalization (Belin et al., 2000; with greater psychosocial impairment in depressed individuals
Fecteau et al., 2004), integration of auditory and visual sensory (Rottenberg et al., 2002). From the treatment perspective, emo-
information (Balk et al., 2010), and emotion perception, including tion regulation strategies, such as reappraisal of emotionally
processing of non-verbal emotional signals and emotional facial evocative stimuli and mindfulness-based stress reduction, have
expressions (Kreifelts et al., 2009; Robins et al., 2009; Said et al., been reported to reduce negative affect in patients with anxi-
2010). People with anxiety and depressive symptoms exhibit ety and depressive symptoms (Koszycki et al., 2007; Ehring et al.,
deficits in social competence and emotional functioning, includ- 2010; Goldin and Gross, 2010) and in healthy people (Chiesa
ing perception and regulation of emotions (Fisher-Beckfield and and Serretti, 2009). Given the posited function of left STS and
McFall, 1982; Campbell-Sills et al., 2006; Ehring et al., 2010; abovementioned features of emotional symptoms, the results
Zilverstand et al., 2017), and have been reported to have of the present study suggest that reduction in cortical thick-
impairments in recognition of facial expressions of emotion ness in left STS may be a potential neural substrate underlying
(Fecteau et al., 2004; Surguladze et al., 2004). In particu- emotional dysfunction in people with anxiety and depressive
lar, people with anxiety symptoms commonly have difficulty symptoms.Y. Wang et al. | 7
provides evidence for high concurrent comorbidity of anxiety
and depressive symptoms (Sivertsen et al., 2012; Kahn et al., 2013;
Cummings et al., 2014; Hertenstein et al., 2019). Nevertheless,
anxiety and depressive symptoms are different mental disor-
ders with distinct features (Eysenck and Fajkowska, 2018), and
both symptoms are likely to contribute to sleep quality distur-
bance in different ways. Commonality analysis was therefore
used to explore the unique and shared contributions of the three
different sub-scores of the anxiety and depression to sleep qual-
ity. The physiological component of depression was found to
Downloaded from https://academic.oup.com/scan/advance-article/doi/10.1093/scan/nsab012/6123709 by guest on 28 April 2021
account for the largest portion of the variation in sleep quality
and may thus be the main cause of the debilitating effect that
emotional distress has on sleep quality. Attention should thus
be given to studying the neurobiological mechanisms that might
account for physiological symptoms often seen in people who
suffer from those problems.
The mediating role in the association of emotional symp-
toms and poor sleep quality revealed for left STS in the present
study may underlie the comorbidity of poor sleep and emotional
symptoms in general population (Cheng et al., 2018). Recently,
there have been reports that alterations in brain structure and
function underlie the association between sleep problems and
emotional symptoms in major depressive disorders (Yu et al.,
Fig. 3. Exploratory commonality analysis using sub-scores of the somatic com- 2018; Zhu et al., 2020; Yang et al., 2020). Although there is increas-
ponent of SAS, affective component and physiologic component of SDS with
ing evidence of comorbidity of sleep problems and emotional
sleep-related items excluded as predictors and PSQI as outcomes. The upper,
middle and lower rows, respectively, refer to (A) the somatic component of the
symptoms in the general population, few have assessed the dif-
SAS, (B) the physiologic component of the SDS and (C) the affective compo- ferences after removing patients who had at some time been
nent of the SDS, which all show negative correlation with cortical thickness of diagnosed with depression (Cheng et al., 2018).
left STS as shown in the left panels. Path diagrams of the mediation analysis The present study has several limitations. Firstly, the study
are shown in the corresponding right panels. All data are standardized partial population comprises healthy participants rather than patients
residuals after controlling for age, sex and education level. All indirect effects
with formally diagnosed emotional disorders. Secondly, self-
(c–c′ or a × b) were significant.
reported questionnaires were used to measure sleep quality and
levels of anxiety and depressive symptoms. The finding of a
In the present study, cortical thickness of left STS has been
highly significant association between sleep quality and emo-
observed to serve as a mediator between sleep quality and
tional symptoms is, however, consistent with other studies in
especially the somatic component of anxiety, and the affective
patient cohorts. Thirdly, to increase sample size, investigations
and, especially, the physiological components of depression.
performed with two different types of head coils were combined.
There have been several reports that chronic sleep problems
Fourthly, the cross-sectional design makes it difficult to draw
are associated with inappropriate physiological arousal, includ-
firm conclusions regarding the potential cause of the signifi-
ing elevated heart rate and brain activity and increased whole
cant relationship between sleep quality and levels of anxiety and
body and global brain metabolism (Nofzinger et al., 2004; Bonnet
depressive symptoms in the adult population studied. Further
and Arand, 2010). Attempts have been made to disentangle
studies are needed to elucidate the causal relationships between
the potential causality between physiological hyperarousal and
anxiety and depressive symptoms and sleep quality (Pillai and
sleep problems, and it has been reported that a range of phys-
Drake, 2015).
iological stressors, especially unresolved emotional distress,
which serve as a predisposing factor to produce physiological
hyperarousal, will increase the likelihood of insomnia (Cano Conclusion
et al., 2008; Wassing et al., 2016). Anxiety and depressive symp-
toms are both strongly associated with general distress and Cortical thickness of left STS has been identified as a potential
negative affect (Watson, 2009; Eysenck and Fajkowska, 2018) and neural substrate mediating the link between poor sleep quality
marked by changes in the autonomic nervous and endocrine and symptoms of anxiety and depression. In addition, the phys-
system, and a variety of somatic and physiological symptoms, iological components of depressive symptoms were observed to
such as faster heartbeat, sweating and fatigue (Lopez et al., play a key role in sleep problems. Left STS may be a potential
2018). People with thinner cortex in left STS may experience target region for guiding clinical treatment of sleep problems.
heightened emotional misperception and dysregulation asso-
ciated with symptoms of anxiety and depression and more
Funding
readily accumulate emotional distress leading to physiological
hyperarousal and impairment in sleep quality. This study was supported by the National Natural Science
The results of the mediation analyses revealed that varia- Foundation of China (grant nos. 81171488, 81671669 and
tions in the thickness of the middle portion of STS can explain 81820108018), the National Natural Science Foundation (grant
the association between sleep quality and three different nos. 81621003, 82027808) and Science and Technology Project of
sub-scores of the anxiety and depression measures. This Sichuan Province (grant no. 2017JQ0001).8 | Social Cognitive and Affective Neuroscience, 2021, Vol. 00, No. 00
Conflict of interest Dai, X.J., Jiang, J., Zhang, Z., et al. (2018). Plasticity and suscep-
tibility of brain morphometry alterations to insufficient sleep.
All authors report no interest conflict.
Frontiers in Psychiatry, 9, 266.
Dale, A.M., Fischl, B., Sereno, M.I. (1999). Cortical surface-based
Data availability statement analysis. I. Segmentation and surface reconstruction. NeuroIm-
The data that support the findings of this study are available age, 9, 179–94.
from the corresponding author upon reasonable request. Desikan, R.S., Segonne, F., Fischl, B., et al. (2006). An automated
labeling system for subdividing the human cerebral cortex on
MRI scans into gyral based regions of interest. NeuroImage, 31,
Supplementary data 968–80.
Downloaded from https://academic.oup.com/scan/advance-article/doi/10.1093/scan/nsab012/6123709 by guest on 28 April 2021
Supplementary data are available at SCAN online. Ehring, T., Tuschen-Caffier, B., Schnülle, J., Fischer, S., Gross,
J.J. (2010). Emotion regulation and vulnerability to depression:
spontaneous versus instructed use of emotion suppression
References
and reappraisal. Emotion, 10, 563–72.
Baglioni, C., Battagliese, G., Feige, B., et al. (2011). Insomnia as Eysenck, M.W., Fajkowska, M. (2018). Anxiety and depression:
a predictor of depression: a meta-analytic evaluation of lon- toward overlapping and distinctive features. Cognition and
gitudinal epidemiological studies. Journal of Affective Disorders, Emotion, 32, 1391–400.
135, 10–9. Fecteau, S., Armony, J.L., Joanette, Y., Belin, P. (2004). Is voice
Balk, M.H., Ojanen, V., Pekkola, J., Autti, T., Sams, M., Jaaske- processing species-specific in human auditory cortex? An
lainen, I.P. (2010). Synchrony of audio-visual speech stim- fMRI study. NeuroImage, 23, 840–8.
uli modulates left superior temporal sulcus. Neuroreport, 21, Fischl, B., Sereno, M.I., Dale, A.M. (1999). Cortical surface-based
822–6. analysis. II: inflation, flattening, and a surface-based coordi-
Bartlett, E.A., Klein, D.N., Li, K., DeLorenzo, C., Kotov, R., nate system. NeuroImage, 9, 195–207.
Perlman, G. (2019). Depression severity over 27 months in ado- Fischl, B., Salat, D.H., Busa, E., et al. (2002). Whole brain segmen-
lescent girls is predicted by stress-linked cortical morphology. tation: automated labeling of neuroanatomical structures in
Biological Psychiatry, 86, 769–78. the human brain. Neuron, 33, 341–55.
Belin, P., Zatorre, R.J., Lafaille, P., Ahad, P., Pike, B. (2000). Voice- Fisher-Beckfield, D., McFall, R.M. (1982). Development of a
selective areas in human auditory cortex. Nature, 403, 309–12. competence inventory for college men and evaluation of
Bellesi, M., Pfister-Genskow, M., Maret, S., Keles, S., Tononi, G., relationships between competence and depression. Journal of
Cirelli, C. (2013). Effects of sleep and wake on oligodendrocytes Consulting and Clinical Psychology, 50, 697–705.
and their precursors. The Journal of Neuroscience, 33, 14288–300. Fultz, N.E., Bonmassar, G., Setsompop, K., et al. (2019). Coupled
Ben Simon, E., Rossi, A., Harvey, A.G., Walker, M.P. (2020). Over- electrophysiological, hemodynamic, and cerebrospinal fluid
anxious and underslept. Nature Human Behaviour, 4, 100–10. oscillations in human sleep. Science, 366, 628–31.
Binder, J.R., Frost, J.A., Hammeke, T.A., et al. (2000). Human Geuze, E., Westenberg, H.G., Heinecke, A., de Kloet, C.S.,
temporal lobe activation by speech and nonspeech sounds. Goebel, R., Vermetten, E. (2008). Thinner prefrontal cortex in
Cerebral Cortex, 10, 512–28. veterans with posttraumatic stress disorder. NeuroImage, 41,
Bonnet, M.H., Arand, D.L. (2010). Hyperarousal and insomnia: 675–81.
state of the science. Sleep Medicine Reviews, 14, 9–15. Gogtay, N., Giedd, J.N., Lusk, L., et al. (2004). Dynamic mapping of
Breslau, N., Roth, T., Rosenthal, L., Andreski, P. (1996). Sleep human cortical development during childhood through early
disturbance and psychiatric disorders: a longitudinal epi- adulthood. Proceedings of the National Academy of Sciences of the
demiological study of young adults. Biological Psychiatry, 39, United States of America, 101, 8174–9.
411–8. Goldin, P.R., Gross, J.J. (2010). Effects of mindfulness-based stress
Buysse, D.J., Reynolds, C.F., 3rd, Monk, T.H., Berman, S.R., reduction (MBSR) on emotion regulation in social anxiety dis-
Kupfer, D.J. (1989). The Pittsburgh Sleep Quality Index: a new order. Emotion, 10, 83–91.
instrument for psychiatric practice and research. Psychiatry Goldstein-Piekarski, A.N., Holt-Gosselin, B., O’Hora, K.,
Research, 28, 193–213. Williams, L.M. (2020). Integrating sleep, neuroimaging, and
Buysse, D.J. (2013). Insomnia. JAMA, 309, 706–16. computational approaches for precision psychiatry. Neuropsy-
Campbell-Sills, L., Barlow, D.H., Brown, T.A., Hofmann, S.G. chopharmacology, 45, 192–204.
(2006). Acceptability and suppression of negative emotion in Gong, Q. (2020). Psychoradiology, Neuroimaging Clinics of North
anxiety and mood disorders. Emotion, 6, 587–95. America, 30, 1–123. New York: Elsevier Inc.
Cano, G., Mochizuki, T., Saper, C.B. (2008). Neural circuitry of Hayes, A.F. (2018). Introduction to Mediation, Moderation, and Con-
stress-induced insomnia in rats. The Journal of Neuroscience, 28, ditional Process Analysis: A Regression-based Approach. 2nd edn.
10167–84. New York: Guilford Press.
Cheng, W., Rolls, E.T., Ruan, H., Feng, J. (2018). Functional con- Henson, R.K. (2001). Understanding internal consistency reli-
nectivities in the brain that mediate the association between ability estimates: a conceptual primer on coefficient alpha.
depressive problems and sleep quality. JAMA Psychiatry, 75, Measurement and Evaluation in Counseling and Development, 34,
1052–61. 177–89.
Chiesa, A., Serretti, A. (2009). Mindfulness-based stress reduc- Hertenstein, E., Feige, B., Gmeiner, T., et al. (2019). Insomnia as a
tion for stress management in healthy people: a review predictor of mental disorders: a systematic review and meta-
and meta-analysis. Journal of Alternative and Complementary analysis. Sleep Medicine Reviews, 43, 96–105.
Medicine, 15, 593–600. Huang, V., Peck, K., Mallya, S., Lupien, S.J., Fiocco, A.J. (2016).
Cummings, C.M., Caporino, N.E., Kendall, P.C. (2014). Comorbid- Subjective sleep quality as a possible mediator in the relation-
ity of anxiety and depression in children and adolescents: 20 ship between personality traits and depressive symptoms in
years after. Psychological Bulletin, 140, 816–45. middle-aged adults. PLoS One, 11, e0157238.Y. Wang et al. | 9
Huang, X, Gong, Q, Sweeney, JA, and Biswal, BB. (2019). Progress in a clinical treatment study. Human Brain Mapping, 38,
in Psychoradiology, the clinical application of psychiatric neu- 4370–85.
roimaging. The British Journal of Radiology, 92(1101), 20181000. Pillai, V., Drake, C.L. (2015). Sleep and repetitive thought: the role
Irwin, M., Clark, C., Kennedy, B., Gillin, J.C., Ziegler, M. (2003). of rumination and worry in sleep disturbance. In: Feldner, M.,
Nocturnal catecholamines and immune function in insomni- Babson, K., editors. Sleep and Affect: Assessment, theory, & clinical
acs, depressed patients, and control subjects. Brain, Behavior, implications (pp. 201 - 226). London: Elsevier.
and Immunity, 17, 365–72. Pink, A., Przybelski, S.A., Krell-Roesch, J., et al. (2017a). Cor-
Iscan, Z., Jin, T.B., Kendrick, A., et al. (2015). Test-retest reliability tical thickness and depressive symptoms in cognitively nor-
of freesurfer measurements within and between sites: effects mal individuals: the mayo clinic study of aging. Journal of
of visual approval process. Human Brain Mapping, 36, 3472–85. Alzheimer’s Disease, 58, 1273–81.
Downloaded from https://academic.oup.com/scan/advance-article/doi/10.1093/scan/nsab012/6123709 by guest on 28 April 2021
Jäncke, L., Wüstenberg, T., Scheich, H., Heinze, H.J. (2002). Pho- Pink, A., Przybelski, S.A., Krell-Roesch, J., et al. (2017b). Cor-
netic perception and the temporal cortex. NeuroImage, 15, tical thickness and anxiety symptoms among cognitively
733–46. normal elderly persons: the mayo clinic study of aging.
Kahn, M., Sheppes, G., Sadeh, A. (2013). Sleep and emotions: The Journal of Neuropsychiatry and Clinical Neurosciences, 29,
bidirectional links and underlying mechanisms. International 60–6.
Journal of Psychophysiology, 89, 218–28. Preacher, K.J., Kelley, K. (2011). Effect size measures for media-
Klein, A.M., de Voogd, L., Wiers, R.W., Salemink, E. (2018). Biases tion models: quantitative strategies for communicating indi-
in attention and interpretation in adolescents with varying rect effects. Psychological Methods, 16, 93–115.
levels of anxiety and depression. Cognition and Emotion, 32, Robins, D.L., Hunyadi, E., Schultz, R.T. (2009). Superior tempo-
1478–86. ral activation in response to dynamic audio-visual emotional
Koszycki, D., Benger, M., Shlik, J., Bradwejn, J. (2007). Ran- cues. Brain and Cognition, 69, 269–78.
domized trial of a meditation-based stress reduction program Rottenberg, J., Kasch, K.L., Gross, J.J., Gotlib, I.H. (2002). Sad-
and cognitive behavior therapy in generalized social anxiety ness and amusement reactivity differentially predict concur-
disorder. Behaviour Research and Therapy, 45, 2518–26. rent and prospective functioning in major depressive disorder.
Kreifelts, B., Ethofer, T., Shiozawa, T., Grodd, W., Wildgruber, D. Emotion, 2, 135–46.
(2009). Cerebral representation of non-verbal emotional per- Said, C.P., Moore, C.D., Engell, A.D., Todorov, A., Haxby, J.V. (2010).
ception: fMRI reveals audiovisual integration area between Distributed representations of dynamic facial expressions in
voice- and face-sensitive regions in the superior temporal the superior temporal sulcus. Journal of Vision, 10, 11.
sulcus. Neuropsychologia, 47, 3059–66. Sateia, M.J. (2009). Update on sleep and psychiatric disorders.
Lopez, R.B., Denny, B.T., Fagundes, C.P. (2018). Neural mecha- Chest, 135, 1370–9.
nisms of emotion regulation and their role in endocrine and Scherpiet, S., Herwig, U., Opialla, S., et al. (2015). Reduced
immune functioning: a review with implications for treatment neural differentiation between self-referential cognitive and
of affective disorders. Neuroscience and Biobehavioral Reviews, emotional processes in women with borderline personality
95, 508–14. disorder. Psychiatry Research, 233, 314–23.
Mander, B.A., Rao, V., Lu, B., et al. (2013). Prefrontal atro- Sexton, C.E., Storsve, A.B., Walhovd, K.B., Johansen-Berg, H.,
phy, disrupted NREM slow waves and impaired hippocampal- Fjell, A.M. (2014). Poor sleep quality is associated with
dependent memory in aging. Nature Neuroscience, 16, 357–64. increased cortical atrophy in community-dwelling adults.
Mennin, D.S., Heimberg, R.G., Turk, C.L., Fresco, D.M. (2005). Neurology, 83, 967–73.
Preliminary evidence for an emotion dysregulation model of Shaw, P., Lerch, J., Greenstein, D., et al. (2006). Longitudinal
generalized anxiety disorder. Behaviour Research and Therapy, mapping of cortical thickness and clinical outcome in children
43, 1281–310. and adolescents with attention-deficit/hyperactivity disorder.
Montgomery, P., Dennis, J. (2004). A systematic review of non- Archives of General Psychiatry, 63, 540–9.
pharmacological therapies for sleep problems in later life. Shen, M., Hu, M., Sun, Z. (2017). Development and validation of
Sleep Medicine Reviews, 8, 47–62. brief scales to measure emotional and behavioural problems
Narr, K.L., Bilder, R.M., Toga, A.W., et al. (2005). Mapping corti- among Chinese adolescents. BMJ Open, 7, e012961.
cal thickness and gray matter concentration in first episode Sivertsen, B., Salo, P., Mykletun, A., et al. (2012). The bidi-
schizophrenia. Cerebral Cortex, 15, 708–19. rectional association between depression and insomnia: the
Nimon, K., Lewis, M., Kane, R., Haynes, R.M. (2008). An R package HUNT study. Psychosomatic Medicine, 74, 758–65.
to compute commonality coefficients in the multiple regres- Sun, H, Chen, Y, Huang, Q, Lui, S, Huang, X, Shi, Y, Xu,
sion case: an introduction to the package and a practical X, Sweeney, JA, and Gong, Q. (2018). Psychoradiologic Util-
example. Behavior Research Methods, 40, 457–66. ity of MR Imaging for Diagnosis of Attention Deficit Hyper-
Nofzinger, E.A., Buysse, D.J., Germain, A., Price, J.C., activity Disorder: A Radiomics Analysis. Radiology, 287(2),
Miewald, J.M., Kupfer, D.J. (2004). Functional neuroimaging 620–630.
evidence for hyperarousal in insomnia. The American Journal Surguladze, S.A., Young, A.W., Senior, C., Brébion, G., Travis, M.J.,
of Psychiatry, 161, 2126–8. Phillips, M.L. (2004). Recognition accuracy and response bias
Ohayon, M.M. (2002). Epidemiology of insomnia: what we know to happy and sad facial expressions in patients with major
and what we still need to learn. Sleep Medicine Reviews, 6, depression. Neuropsychology, 18, 212–8.
97–111. Szymkowicz, S.M., McLaren, M.E., Kirton, J.W., et al. (2016).
Pereira, J.B., Weintraub, D., Chahine, L., Aarsland, D., Depressive symptom severity is associated with increased cor-
Hansson, O., Westman, E. (2019). Cortical thinning in patients tical thickness in older adults. International Journal of Geriatric
with REM sleep behavior disorder is associated with clinical Psychiatry, 31, 325–33.
progression. npj Parkinson’s Disease, 5(1), 1–8. Vahtera, J., Kivimäki, M., Hublin, C., et al. (2007). Liability to anx-
Perlman, G., Bartlett, E., DeLorenzo, C., et al. (2017). Cor- iety and severe life events as predictors of new-onset sleep
tical thickness is not associated with current depression disturbances. Sleep, 30, 1537–46.10 | Social Cognitive and Affective Neuroscience, 2021, Vol. 00, No. 00
Wang, S., Zhao, Y., Li, J., Lai, H., Qiu, C., Pan, N., and Gong, Q. Yu, S., Shen, Z., Lai, R., et al. (2018). The orbitofrontal
(2020). Neurostructural correlates of hope: dispositional hope cortex gray matter is associated with the interaction
mediates the impact of the SMA gray matter volume on between insomnia and depression. Frontiers in Psychiatry, 9,
subjective well-being in late adolescence. Social Cognitive and 651.
Affective Neuroscience, 15(4), 395–404. Zhu, D.M., Zhang, C., Yang, Y., et al. (2020). The relationship
Wassing, R., Benjamins, J.S., Dekker, K., et al. (2016). Slow between sleep efficiency and clinical symptoms is mediated
dissolving of emotional distress contributes to hyperarousal. by brain function in major depressive disorder. Journal of Affec-
Proceedings of the National Academy of Sciences of the United States tive Disorders, 266, 327–37.
of America, 113, 2538–43. Zilverstand, A., Parvaz, M.A., Goldstein, R.Z. (2017). Neuroimag-
Wassing, R., Schalkwijk, F., Lakbila-Kamal, O., et al. (2019). ing cognitive reappraisal in clinical populations to define
Downloaded from https://academic.oup.com/scan/advance-article/doi/10.1093/scan/nsab012/6123709 by guest on 28 April 2021
Haunted by the past: old emotions remain salient in insomnia neural targets for enhancing emotion regulation. A systematic
disorder. Brain, 142, 1783–96. review. NeuroImage, 151, 105–16.
Watson, D. (2009). Differentiating the mood and anxiety disor- Zung, W.W., Richards, C.B., Short, M.J. (1965). Self-rating
ders: a quadripartite model. Annual Review of Clinical Psychol- depression scale in an outpatient clinic: further val-
ogy, 5, 221–47. idation of the SDS. Archives of General Psychiatry, 13,
Winkelman, J.W., Plante, D.T., Schoerning, L., et al. (2013). 508–15.
Increased rostral anterior cingulate cortex volume in chronic Zung, W.W. (1971). A rating instrument for anxiety disorders.
primary insomnia. Sleep, 36, 991–8. Psychosomatics, 12, 371–9.
Yang, Y., Zhu, D.M., Zhang, C., et al. (2020). Brain structural and Zung, W.W. (1974). The measurement of affects: depres-
functional alterations specific to low sleep efficiency in major sion and anxiety. Modern Problems of Pharmacopsychiatry, 7,
depressive disorder. Frontiers in Neuroscience, 14, 50. 170–88.You can also read