Water quality guidelines for the management of pond fish culture
←
→
Page content transcription
If your browser does not render page correctly, please read the page content below
INTERNATIONAL JOURNAL OF ENVIRONMENTAL SCIENCES Volume 3, No 6, 2013

             © Copyright by the authors - Licensee IPA- Under Creative Commons license 3.0

Research article                                                                    ISSN 0976 – 4402

      Water quality guidelines for the management of pond fish culture
                               Anita Bhatnagar, Pooja Devi
         Department of Zoology, Kurukshetra University, Kurukshetra, India-136119
                                anitabhatnagar@gmail.com
                            doi: 10.6088/ijes.2013030600019

ABSTRACT

The Optimum fish production is totally dependent on the physical, chemical and biological
qualities of water to most of the extent. Hence, successful pond management requires an
understanding of water quality. Water quality is determined by variables like temperature,
transparency, turbidity, water colour, carbon dioxide, pH, alkalinity, hardness, unionised
ammonia, nitrite, nitrate, primary productivity, BOD, plankton population etc. In the present
chapter water quality management principles in fish culture have been reviewed to make
aware the fish culturist and environmentalist about the important water quality factors that
influence health of a pond and are required in optimum values to increase the fish yields to
meet the growing demands of present day scenario of the world, when the food resources are
in a state of depletion and the population pressure is increasing on these resources.

Keywords: Assessment and Monitoring, Culture, Fish productivity, Parameters, Water
quality

1. Introduction

Fish is an inexpensive source of protein and an important cash crop in many regions of world
and water is the physical support in which they carry out their life functions such as
feeding, swimming, breeding, digestion and excretion (Bronmark and Hansson, 2005). Water
quality is determined by various physico-chemical and biological factors, as they may
directly or indirectly affect its quality and consequently its suitability for the distribution and
production of fish and other aquatic animals (Moses, 1983). Many workers have reported the
status of water bodies (lentic and lotic) after receiving various kinds of pollutants altering
water quality characteristics (physical, chemical and biological). All living organisms have
tolerable limits of water quality parameters in which they perform optimally. A sharp drop or
an increase within these limits has adverse effects on their body functions (Davenport, 1993:
Kiran, 2010). So, good water quality is very essential for survival and growth of fish. As we
know fish is an important protein rich food resource and there has been sharp increase in
demand of fish products due to increasing population pressure in this century. Thus to meet
the demand of present food supply, water quality management in fish ponds is a necessary
step that is required to be taken up.

In most of the countries, fishes are cultivated in ponds (lentic water) but unfortunately such
culturists are not so aware of importance of water quality management in fisheries. If they are
properly guided and make aware about water quality management practices, they can get
maximum fish yield in their ponds to a greater extent through applying low input cost and
getting high output of fish yield. The role of various factors like temperature, transparency,
turbidity, water colour, carbon dioxide, pH, alkalinity, hardness, ammonia, nitrite, nitrate,
primary productivity, biochemical oxygen demand (BOD), plankton population etc. can’t be
overlooked for maintaining a healthy aquatic environment and for the production of sufficient

Received on March 2013 Published on June 2013                                           1980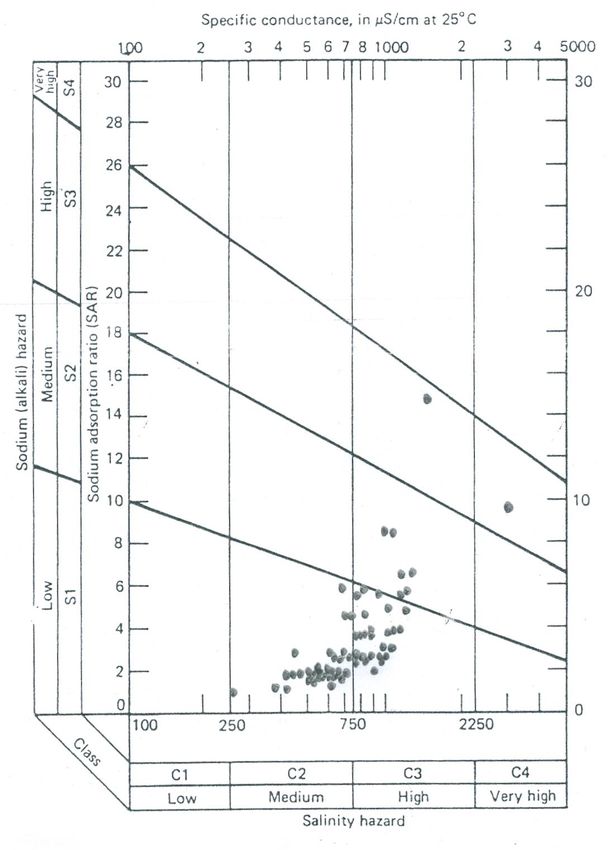
Water quality guidelines for the management of pond fish culture

fish food organisms in ponds for increasing fish production. Therefore, there is the need to
ensure that, these environmental factors are properly managed and regulated for good
survival and optimum growth of fish. The objective of the present chapter is to review and
present a concise opinion regarding the optimum levels of water quality characteristics
required for maximum fish production.

2. Discussion

Fish do not like any kind of changes in their environment. Any changes add stress to the fish
and the larger and faster the changes, the greater the stress. So the maintenance of all the
factors becomes very essential for getting maximum yield in a fish pond. Good water quality
is characterised by adequate oxygen, proper temperature, transparency, limited levels of
metabolites and other environmental factors affecting fish culture. The initial studies of water
quality of a fish pond in India were probably conducted by Sewell (1927) and Pruthi (1932).
After that many workers have studied the physico-chemical condition of inland waters either
in relation to fish mortality or as part of general hydrological survey (Alikunhi et al., 1952:
Upadhyaya, 1964). The details of various pond ecosystems also have been studied by
workers (Mumtazuddin et al., 1982: Delince, 1992: Garg and Bhatnagar, 1999: Bhatnagar,
2008). Bhatnagar and Singh (2010) studied the pond fish culture in relation to water quality
in Haryana. However, the present chapter would provide the basic guidelines, parameter wise
for the fish farmers in obtaining high fish yield in low input via maintaining water quality of
their ponds.

Temperature is defined as the degree of hotness or coldness in the body of a living organism
either in water or on land (Lucinda and Martin, 1999). As fish is a cold blooded animal, its
body temperature changes according to that of environment affecting its metabolism and
physiology and ultimately affecting the production. Higher temperature increases the rate of
bio-chemical activity of the micro biota, plant respiratory rate, and so increase in oxygen
demand. It further cause decreased solubility of oxygen and also increased level of ammonia
in water. However, during under extended ice cover, the gases like hydrogen sulphide, carbon
dioxide, methane, etc. can build up to dangerously high levels affecting fish health.

Desirable limits

According to Delince (1992) 30-350C is tolerable to fish, Bhatnagar et al. (2004) suggested
the levels of temperature as 28-320C good for tropical major carps;  350C- lethal to maximum number of fish species and
according to Santhosh and Singh (2007) suitable water temperature for carp culture is
between 24 and 300C.

Remedies

   1. By water exchange, planting shady trees or making artificial shades during summer’s
         thermal stratification can be prevented.

   2. Mechanical aeration can prevent formation of ice build-up in large areas of the pond.

Turbidity

                                      Anita Bhatnagar, Pooja Devi                         1981
                   International Journal of Environmental Sciences Volume 3 No.6, 2013
Water quality guidelines for the management of pond fish culture

Ability of water to transmit the light that restricts light penetration and limit photosynthesis is
termed as turbidity and is the resultant effect of several factors such as suspended clay
particles, dispersion of plankton organisms, particulate organic matters and also the pigments
caused by the decomposition of organic matter.

Desirable limits

Boyd and Lichtkoppler (1979) suggested that the clay turbidity in water to 30 cm or less may
prevent development of plankton blooms, 30 to 60 cm and as below 30 cm - generally
adequate for good fish production and there is an increase in the frequency of dissolved
oxygen problems when values above 60 cm, as light penetrates to greater depths encourage
underwater macrophyte growth, and so there is less plankton to serve as food for fish.
According to Bhatnagar et al. (2004) turbidity range from 30-80 cm is good for fish health;
15-40 cm is good for intensive culture system and < 12 cm causes stress. According to
Santhosh and Singh (2007) the secchi disk (fig.1) transparency between 30 and 40 cm
indicates optimum productivity of a pond for good fish culture.

Remedies

Addition of more water or lime (CaO, alum Al2(SO4)314H2O at a rate of 20 mg L-1 and
gypsum on the entire pond water at rate of 200 Kg/ 1000m3 of pond can reduce turbidity

                     Figure 1: Measurement of turbidity using Secchi disc.

Water Colour

The colour of an object is defined by the wavelengths of visible light that the object reflects.

Desirable limits

National Agricultural Extension and Research (1996) states pale colour, light greenish or
greenish waters suitable for fish culture and according to Bhatnagar et al. 2004 dark brown
colour is lethal for fish/shrimp culture, light green colour- good for fish/shrimp culture, dark
green colour is not ideal for fish/shrimp culture and clear water is unproductive for
fish/shrimp culture. Delince (1992) stated that the abundance of phytoplankton and
zooplankton is responsible for the determination of colour of an aquatic body and Green,
bluish green/ brown greenish colour of water indicates good plankton population hence, good
for fish health.

Remedies
                                      Anita Bhatnagar, Pooja Devi                            1982
                   International Journal of Environmental Sciences Volume 3 No.6, 2013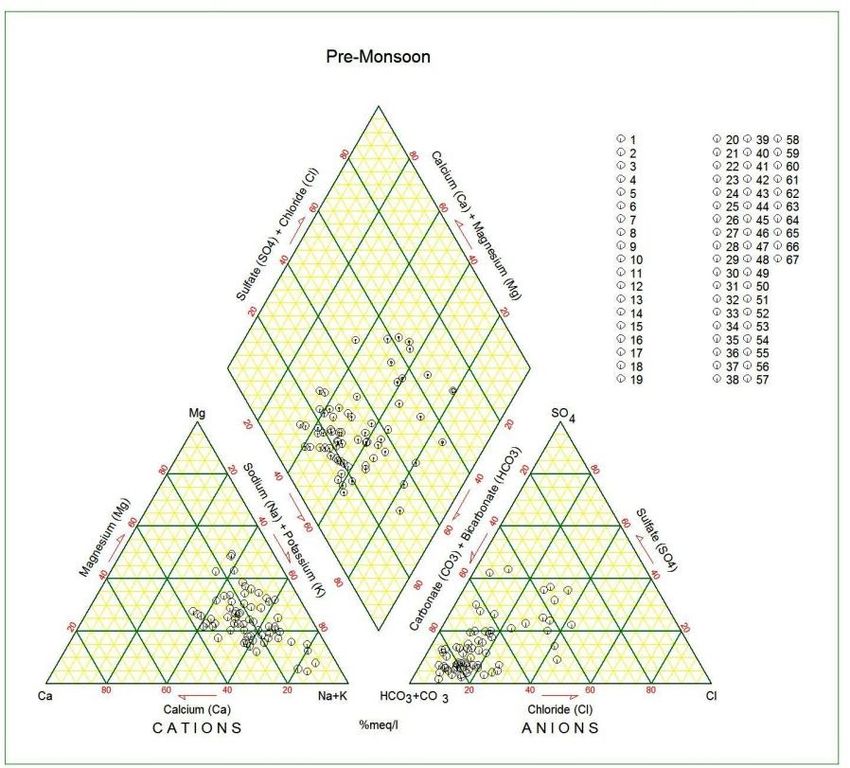
Water quality guidelines for the management of pond fish culture

Application of organic and inorganic fertilizers in clear water ponds may increase
productivity.

Dissolved Oxygen (DO)

Dissolved oxygen affects the growth, survival, distribution, behaviour and physiology of
shrimps and other aquatic organisms (Solis, 1988). The principal source of oxygen in water is
atmospheric air and photosynthetic planktons. Obtaining sufficient oxygen is a greater
problem for aquatic organisms than terrestrial ones, due to low solubility of oxygen in water
and solubility decreases with factors like- increase in temperature; increase in salinity; low
atmospheric pressure, high humidity, high concentration of submerged plants, plankton
blooms. Oxygen depletion in water leads to poor feeding of fish, starvation, reduced growth
and more fish mortality, either directly or indirectly (Bhatnagar and Garg, 2000).

Indication of low Dissolved oxygen

If fish comes to the surface of water (figure 2) and secchi disk reading falls below 20 cm, fish
swim sluggishly and are weakened.

              Figure 2: Stressed fishes due to low DO levels at surface of water

Desirable limits

According to Banerjea (1967) DO between 3.0-5.0 ppm in ponds is unproductive and for
average or good production it should be above 5.0 ppm. It may be incidentally mentioned that
very high concentration of DO leading to a state of super saturation sometimes becomes
lethal to fish fry during the rearing of spawn in nursery ponds (Alikunhi et al., 1952) so for
oxygen, the approximate saturation level at 50° F is 11.5 mg L-1, at 70° F., 9 mg L-1, and at
90° F., 7.5 mg L-1. Tropical fishes have more tolerance to low DO than temperate fishes.
According to Bhatnagar and Singh (2010) and Bhatnagar et al. (2004) DO level >5ppm is
essential to support good fish production. Bhatnagar et al. (2004) also suggested that 1-3 ppm
has sublethal effect on growth and feed utilization; 0.3-0.8 ppm is lethal to fishes and >14
ppm is lethal to fish fry, and gas bubble disease may occur. DO less than 1- Death of Fish,
Less than 5 -Fish survive but grow slowly and will be sluggish, 5 and above- Desirable.
According to Santhosh and Singh (2007) Catfishes and other air breathing fishes can survive
in low oxygen concentration of 4 mg L-1. Ekubo and Abowei (2011) recommended that fish
can die if exposed to less than 0.3 mg L-1 of DO for a long period of time, minimum
concentration of 1.0 mg L-1 DO is essential to sustain fish for long period and 5.0 mg L-1 are
adequate in fishponds.

Remedies (i) Avoid over application of fertilizers and organic manure to manage DO level
(ii) Physical control aquatic plants and also management of phytoplankton biomass (iii)
Recycling of water and use of aerators. (iv) Artificially or manually beating of water. (v)
                                      Anita Bhatnagar, Pooja Devi                         1983
                   International Journal of Environmental Sciences Volume 3 No.6, 2013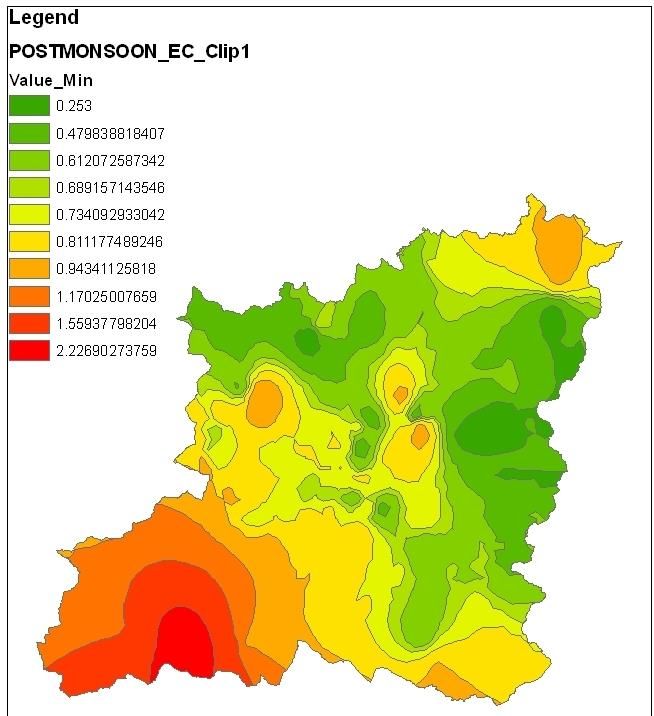
Water quality guidelines for the management of pond fish culture

Avoid over stocking of fishes. (vi) Introduction of the hot water gradually with pipes to
reduce if DO level is high.

Biochemical oxygen demand (BOD)

BOD is the measurement of total dissolved oxygen consumed by microorganisms for
biodegradation of organic matter such as food particles or sewage etc. The excess entry of
cattle and domestic sewage from the non point sources and similarly increase in phosphate in
the village ponds may be attributed to high organic load in these ponds thus causing higher
level of BOD.

Desirable limits

Clerk (1986) reported that BOD range of 2 to 4 mg L-1 does not show pollution while levels
beyond 5 mg L-1 are indicative of serious pollution. According to Bhatnagar et al. (2004) the
BOD level between 3.0-6.0 ppm is optimum for normal activities of fishes; 6.0-12.0 ppm is
sublethal to fishes and >12.0 ppm can usually cause fish kill due to suffocation. Santhosh and
Singh (2007) recommended optimum BOD level for aquaculture should be less than 10 mg L-
1
  but the water with BOD less than 10-15 mg L-1 can be considered for fish culture.
Bhatnagar and Singh (2010) suggested the BOD
Water quality guidelines for the management of pond fish culture

ppm provided DO concentrations are high and water supporting good fish populations
normally contain less than 5 ppm of free CO2. According to Ekubo and Abowei (2011)
tropical fishes can tolerate CO2 levels over 100 mg L-1 but the ideal level of CO2 in fishponds
is less than 10 mg L-1. Bhatnagar et al. (2004) suggested 5-8 ppm is essential for
photosynthetic activity; 12-15 ppm is sublethal to fishes and 50-60 ppm is lethal to fishes.
The free carbon dioxide in water supporting good fish population should be less than 5 mg L-
1
  (Santhosh and Singh, 2007).

Remedies

     1. Proper aeration can “blow” off the excess gas
     2. Check organic load and reduce the same by adding more water (no fish) and add
        Muriatic acid (swimming pool acid) to adjust the pH to about 5 or if possible remove
        the matter by repeated nettings.
     3. Use of lime (CaCO3) or sodium bicarbonate (NaHCO3) (iv) Application of potassium
        permanganate at the rate 250 g for 0.1 hectare.

pH

pH is measured mathematically by, the negative logarithm of hydrogen ions concentration.
The pH of natural waters is greatly influenced by the concentration of carbon dioxide which
is an acidic gas (Boyd, 1979).

Desirable limits

Fish have an average blood pH of 7.4, a little deviation from this value, generally between 7.0
to 8.5 is more optimum and conducive to fish life. pH between 7 to 8.5 is ideal for biological
productivity , fishes can become stressed in water with a pH ranging from 4.0 to 6.5 and 9.0
to 11.0 and death is almost certain at a pH of less than 4.0 or greater than 11.0 (Ekubo and
Abowei, 2011). According to Santhosh and Singh (2007) the suitable pH range for fish
culture is between 6.7 and 9.5 and ldeal pH level is between 7.5 and 8.5 and above and below
this is stressful to the fishes. Ideally, an aquaculture pond should have a pH between 6.5 and
9 (Wurts and Durborow, 1992: Bhatnagar et al., 2004). Bhatnagar et al. (2004) also
recommended that 10.5 is lethal to fish/shellfish culture; 7.5-8.5 is highly congenial
for P.monodon; 7.0-9.0 is acceptable limits; 9.0 -10.5 is sublethal for fish culture.

                       Figure 3: Suitable pH range for pond fish culture.

Remedies

1.      Add gypsum (CaSO4) or organic matter (cowdung, poultry droppings etc.) and initial
        pre-treatment or curing of a new concrete pond to reduce pH levels.
2.      Use of quicklime (CaO) to rectify low pH of aquatic body.

                                      Anita Bhatnagar, Pooja Devi                        1985
                   International Journal of Environmental Sciences Volume 3 No.6, 2013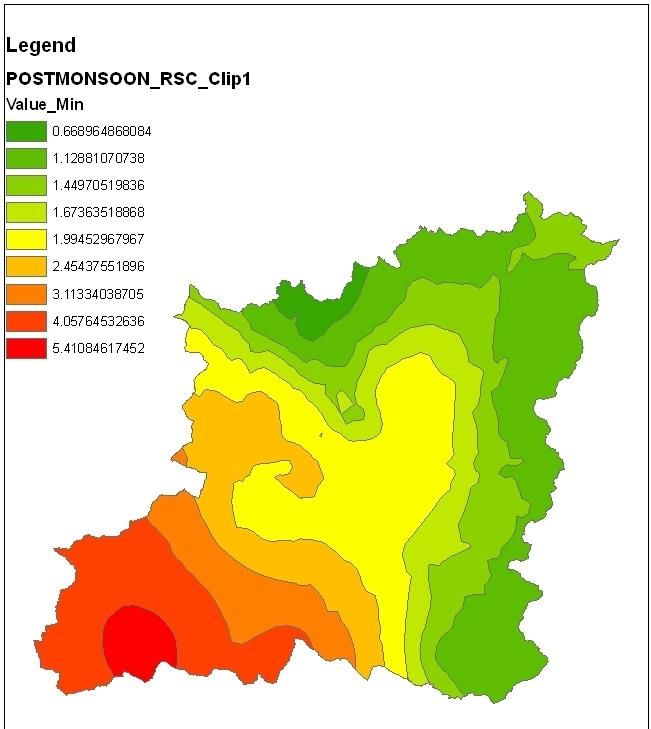
Water quality guidelines for the management of pond fish culture

Alkalinity

Alkalinity is the water’s ability to resist changes in pH and is a measure of the total
concentration of bases in pond water including carbonates, bicarbonates, hydroxides,
phosphates and borates, dissolved calcium, magnesium, and other compounds in the water.
Lime leaching out of concrete ponds or calcareous rocks, photosynthesis, denitrification and
sulphate reduction is mainly responsible for increasing alkalinity while respiration,
nitrification and sulphide oxidation decrease or consume alkalinity (Stumn and Morgan,
1981: Cook et al., 1986) and to a lesser degree it increases due to evaporation and
decomposing organic matter. But if the alkalinity is low, it indicates that even a small amount
of acid can cause a large change in our pH.

Desirable limits

Moyle (1946) gave the range of total alkalinity as 0.0 - 20.0 ppm for low production, 20.0 -
40.0 ppm- low to medium, 40.0 - 90.0 ppm- medium to high production and above 90.0 ppm-
productive. Boyd and Lichtkoppler (1979) suggested that water with total alkalinities of 20 to
150 mg L-1 contain suitable quantities of carbon dioxide to permit plankton production for
fish culture. According to Wurts and Durborow (1992) alkalinity between 75 to 200 mg L-1,
but not less than 20 mg L-1 is ideal in an aquaculture pond. Swann (1997) recommended total
alkalinity values of at least 20 ppm for catfish production and for good pond productivity.
Bhatnagar et al. (2004) suggested that 300 ppm is
undesirable due to non- availability of CO2. Stone and Thomforde (2004) suggested 50-150
mg L-1 (CaCO3) as desirable range; an acceptable range of above 20 mg L-1 and less than 400
mg L-1 for ponds and above 10 mg L-1 for hatchery water. According to Santhosh and Singh
(2007) the ideal value for fish culture is 50-300 mg L-1.

Remedies

   1. Fertilize the ponds to check nutrient status of pondwater
   2. Alkalinity can be increased by calcium carbonate, concrete blocks, oyster shells,
      limestone, or even egg shells depending upon soil pH and buffering capacity.

Hardness

Hardness is the measure of alkaline earth elements such as calcium and magnesium in an
aquatic body along with other ions such as aluminium, iron, manganese, strontium, zinc, and
hydrogen ions. Calcium and magnesium are essential to fish for metabolic reactions such as
bone and scale formation.

Desirable limits

The recommended ideal value of hardness for fish culture is at least 20 ppm (Swann, 1997)
and a range of 30-180 mg L-1 (Santhosh and Singh, 2007). According to Stone and
Thomforde (2004) the desirable Range is 50-150 mg L-1 as CaCO3 and acceptable Range is
above 10 mg L-1 as CaCO3. According to Bhatnagar et al. (2004) hardness values less than
20ppm causes stress, 75-150 ppm is optimum for fish culture and >300 ppm is lethal to fish
life as it increases pH, resulting in non-availability of nutrients. However, some euryhaline
species may have high tolerance limits to hardness.

                                      Anita Bhatnagar, Pooja Devi                        1986
                   International Journal of Environmental Sciences Volume 3 No.6, 2013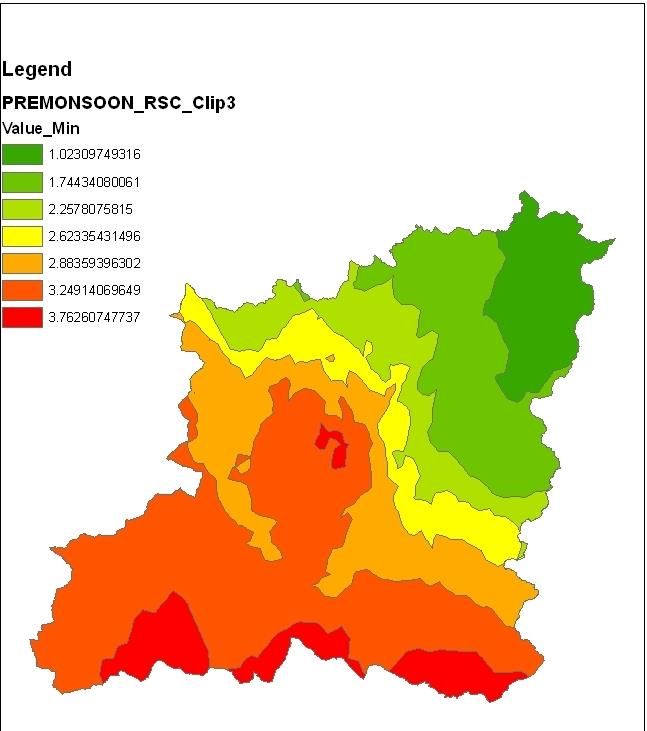
Water quality guidelines for the management of pond fish culture

Remedies

   1. Add quicklime/alum/both and add zeolite to reduce hardness.
   2. During heavy rainfall avoid the runoff water to bring lot of silt into the fish pond.

Calcium

Calcium is generally present in soil as carbonate and most important environmental, divalent
salt in fish culture water. Fish can absorb calcium either from the water or from food.

Desirable limits

Wurts and Durborow (1992) recommended range for free calcium in culture waters is 25 to
100 mg L-1 (63 to 250 mg L-1 CaCO3 hardness) and according to them Channel catfish can
tolerate minimum level of mineral calcium in their feed but may grow slowly under such
conditions. Water with free calcium concentrations as low as 10 mg L-1 if pH is above 6.5
can be tolerated by Rainbow trout, 40 to 100 mg L-1 range (100 to 250 mg L-1 as CaCO3
hardness) are desirable for striped bass, red drum or crawfish.

Conductivity

Conductivity is an index of the total ionic content of water, and therefore indicates freshness
or otherwise of the water (Ogbeibu and Victor, 1995). Conductivity can be used as indicator
of primary production (chemical richness) and thus fish production. Conductivity of water
depends on its ionic concentration (Ca2+, Mg2+, HCO3-, CO3-, NO3- and PO4-), temperature
and on variations of dissolved solids. Distilled water has a conductivity of about 1 µ mhos/cm
and natural waters have conductivity of 20-1500 µ mhos/cm (Abowei, 2010). Conductivity of
freshwater varies between 50 to 1500 hs/cm (Boyd, 1979), but in some polluted waters it may
reach 10,000 hs/cm and seawater has conductivity around 35,000 hs/cm and above.

Desirable limits

As fish differ in their ability to maintain osmotic pressure, therefore the optimum
conductivity for fish production differs from one species to another. Sikoki and Veen (2004)
described a conductivity range of 3.8 -10 hs/cm as extremely poor in chemicals, Stone and
Thomforde (2004) recommended the desirable range 100-2,000 mSiemens/cm and acceptable
range 30-5,000 mSiemens/cm for pond fish culture.

Salinity

Salinity is defined as the total concentration of electrically charged ions (cations – Ca++, Mg++,
K+, Na+ ; anions – CO3-, HCO3-, SO4-, Cl- and other components such as NO3-, NH4+ and PO4-
). Salinity is a major driving factor that affects the density and growth of aquatic organism’s
population (Jamabo, 2008).

Desirable limits

Fish are sensitive to the salt concentration of their waters and have evolved a system that
maintains a constant salt ionic balance in its bloodstream through the movement of salts and
water across their gill membranes. According to Meck (1996) fresh and saltwater fish species
generally show poor tolerance to large changes in water salinity. Often salinity limits vary

                                      Anita Bhatnagar, Pooja Devi                             1987
                   International Journal of Environmental Sciences Volume 3 No.6, 2013
Water quality guidelines for the management of pond fish culture

species to species level. Garg and Bhatnagar (1996) have given desirable range 2 ppt for
common carp; however, Bhatnagar et al. (2004) gave different ideal levels of salinity as 10-
20 ppt for P. monodon; 10-25 ppt for euryhaline species and 25-28 ppt for P. indicus. Barman
et al. (2005) gave a level of 10 ppt suitable for Mugil cephalus and Garg et al. (2003)
suggested 25 ppt for Chanos chanos (Forsskal)

Remedies

   1. Salinity is increased or diluted by replenishment of water.
   2. Aeration is essential to equalise the water salinity all over the water column.

Chloride

Chlorine (Cl-) is a gas which is added in water as a disinfectant to control harmful bacteria
and Chloride is the same element found in the form of a salt, both have dramatically different
chemical properties. Chloride is a common component of most waters and is useful to fish in
maintaining their osmotic balance.

Desirable limits

According to Stone and Thomforde (2004) the desirable range of chlorides for commercial
catfish production is above 60 mg L-1 and acceptable range is 10 times the nitrite
concentration. Chloride (in the form of salt) is required at a minimum concentration of 60 mg
L-1 and a ratio of chloride to nitrite of 10:1 reduces nitrite poisoning as catfish are susceptible
to “brown blood” disease (caused by excess nitrite in the water). It becomes a matter of
concern if chloride levels become high as above 100 mg L-1 in the waters because even in
very small concentrations, it burns the edges of the gills with long term after effects and its
acceptable range is 0. However, chloride content of water is also dependent on Salinity level.

Ammonia (NH3)

Ammonia is the by-product from protein metabolism excreted by fish and bacterial
decomposition of organic matter (fig- 4) such as wasted food, faeces, dead planktons, sewage
etc. The unionized form of ammonia (NH3) is extremely toxic while the ionized form (NH4+)
is not and both the forms are grouped together as “total ammonia”.

Effect

Ammonia in the range >0.1 mg L-11tends to cause gill damage, destroy mucous producing
membranes, “sub- lethal” effects like reduced growth, poor feed conversion, and reduced
disease resistance at concentrations that are lower than lethal concentrations, osmoregulatory
imbalance, kidney failure. Fish suffering from ammonia poisoning generally appear sluggish
or often at the surface gasping for air.

Desirable limits

The toxic levels for un-ionized ammonia for short-term exposure usually lie between 0.6 and
2.0 mg L-1 for pond fish, and sublethal effects may occur at 0.1 to 0.3 mg L-1 (EIFAC, 1973;
Robinette, 1976). Maximum limit of ammonia concentration for aquatic organisms is 0.1 mg
L-1 (Meade, 1985: Santhosh and Singh, 2007). According to Swann (1997) and OATA (2008)
the levels below 0.02 ppm were considered safe. Stone and Thomforde (2004) stated the
                                      Anita Bhatnagar, Pooja Devi                            1988
                   International Journal of Environmental Sciences Volume 3 No.6, 2013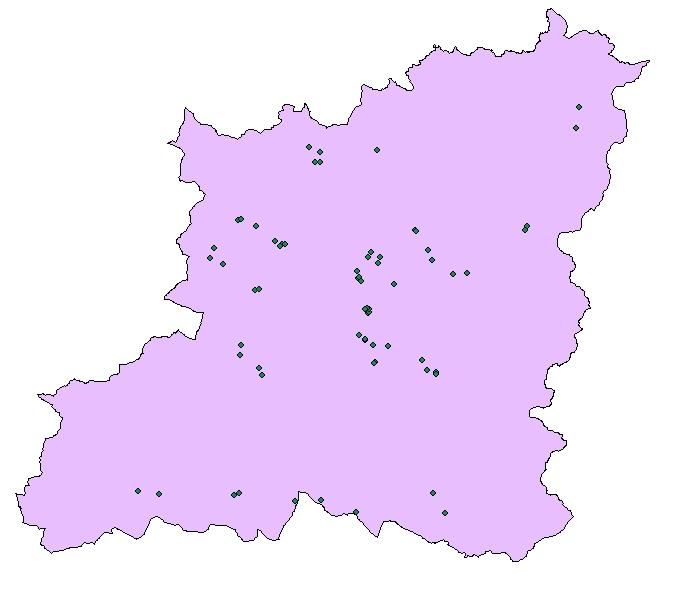
Water quality guidelines for the management of pond fish culture

desirable range as Total NH3-N: 0-2 mg L-1 and Un-ionized NH3-N: 0 mg L-1 and acceptable
range as Total NH3-N: Less than 4 mg L-1 and Un-ionized NH3-N: Less than 0.4 mg L-1.
Bhatnagar et al. (2004) suggested 0.01-0.5 ppm is desirable for shrimp; >0.4 ppm is lethal to
many fishes & prawn species; 0.05-0.4 ppm has sublethal effect and
Water quality guidelines for the management of pond fish culture

Reducing the level of Nitrite

 1. Reduction of stocking densities, Improvement of feeding, biological filtration and
    general husbandry procedures, Increase aeration to maximum, Stop feeding.
 2. Addition of small amounts of certain chloride salts, regular water change out.
 3. Use of biofertilizers to accelerate nitrification.

Nitrate (NO3)

Where ammonia and nitrite were toxic to the fish, Nitrate is harmless and is produced by the
autotrophic Nitrobacter bacteria combining oxygen and nitrite (fig.4). Nitrate levels are
normally stabilized in the 50-100 ppm range.

Desirable limits

Meck (1996) recommended that its concentrations from 0 to 200 ppm are acceptable in a fish
pond and is generally low toxic for some species whereas especially the marine species are
sensitive to its presence. According to Stone and Thomforde (2004) nitrate is relatively
nontoxic to fish and not cause any health hazard except at exceedingly high levels (above 90
mg L-1). Santhosh and Singh (2007) described the favourable range of 0.1 mg L-1 to 4.0 mg L-
1
  in fish culture water. However, OATA (2008) recommends that nitrate levels in marine
systems never exceed 100 mg L-1.

Reducing the level of Nitrate

Dilution by water change (ensure water used for change has a lower nitrate level), Use of ion
exchange materials, Increase plant density and by the use of denitrifying biological filtration
nitrate concentration can be reduced.

Phosphorus

Almost all of the phosphorus (P) present in water is in the form of phosphate (PO4) and in

surface water mainly present as bound to living or dead particulate matter and in the soil is
found as insoluble Ca3(P04)2 and adsorbed phosphates on colloids except under highly acid
conditions. It is an essential plant nutrient as it is often in limited supply and stimulates plant
(algae) growth and its role for increasing the aquatic productivity is well recognized.

Desirable limits

Soil phosphorus (unit- mg of P2O5 per 100gm of soil) level below 3 might be considered
indicative of poor production, between 3 and 6 of average production and ponds having
available phosphorus above 6 are productive (Banerjea, 1967). According to Stone and
Thomforde (2004) the phosphate level of 0.06 mg L-1 is desirable for fish culture. Bhatnagar
et al. (2004) suggested 0.05-0.07 ppm is optimum and productive; 1.0 ppm is good for
plankton / shrimp production.

Remedies

Use inorganic fertilizers to increase phosphorus level (N: P=15:30).

                                      Anita Bhatnagar, Pooja Devi                            1990
                   International Journal of Environmental Sciences Volume 3 No.6, 2013
Water quality guidelines for the management of pond fish culture
Primary productivity
This is the rate at which photosynthesis takes place. The most commonly used index of
productivity is the DO content of the water. Primary productivity may be reported as net or
gross. Net primary productivity represents the total amount of new organic matter
synthesized by photosynthesis less the amount the organic matter used for respiration.
Primary productivity by light and dark bottles is possible methods of measuring
phytoplankton abundance.
Desirable limits
Bhatnagar et al. (2004) recommended 1.60-9.14 mg C L-1 D-1 (GPP)—as optimum status and
20.3 mg C L-1 D-1 (GPP)—as poor productivity of a pond culture. Santhosh and
Singh (2007) has given the ideal value of primary productivity is 1000-2500 mg C M-3d-1
(=1.0-2.0 mg C L-1 d-1). A fish pond can be considered good in productivity if it is slight
green in colour, with no scum on the surface and having a transparency of about one foot.
According to Trifonova (1989) primary productivity can be estimated by measuring the
chlorophyll (ch) ‘a’ from the algal biomass. If the productivity value is less than 0.5 g m -3
(10 g m-3 (>25 mg ch‘a’m-3) as
highly eutrophic.
Remedies
1. Productivity can be improved by use of organic/inorganic fertilizers in ponds.
2. In case of plankton bloom / swarm; feed/manure application can be suspended for
some time.
Plankton
Those aquatic pelagic organisms, which are carried about by the movement of the water
rather than their own ability to swim are called planktons. The plant components are called
as phytoplankton and animal components as zooplanktons and they serve as fish food
organisms (fig. 5). For enumeration they are collected using plankton net (fig. 6). As
plankton is at the base of the food web, there is a close relationship between plankton
abundance and fish production (Smith, and Swingle, 1938).
Plankton blooms and fish kill
Fertilization may not be the only reason for eutrophication or excessive growth of planktons
in pond water surface. The growth of certain species of blue green algae form dense scums
in surface waters, cause shallow thermal stratification, less availability of soluble phosphate
in the top layer and prevents the penetration of light for photosynthesis to depths below 1m
so leading to anoxic conditions in the deep areas (lack of oxygen and high concentration of
free carbon dioxide) resulting in fish kills.
Desirable limits
Bhatnagar and Singh (2010) suggested the optimum plankton population (approximately
3000-4500 Nos. L -1) in pond fish culture.
Anita Bhatnagar, Pooja Devi 1991
International Journal of Environmental Sciences Volume 3 No.6, 2013Water quality guidelines for the management of pond fish culture
Significance
1. The main objective to maximise the plankton production in optimum quantity is to
maintain the standing crop and optimum fertilisation also reduce the probability of algal
crash.
2. Dense phytoplankton helps in producing 10 times more oxygen than it consumes, so have
an important role in compensating for respiratory loss without adding further energy
expenditure.
3. Exploiting primary production is a cheap method of producing fish. Planktons also
prevent the development of macrophytes that are undesirable for fish.
Plankton net
Figure 5: Planktons as fish food organisms Figure 6: Method of plankton collection
Control and treatment
1. Water circulation should be proper to avoid the appearance of anaerobic microzones
and large sized inedible phytoplankton species.
2. Biological control of phytoplankton scum using herbivores (plankton feeding fishes
such as silver carp) that reduces the blue green algae and total phytoplankton biomass
appear more promising.
3. When plankton scums appear, DO should be measured daily to ensure that oxygen is
present in depths below 1.3 m. Light penetration and distribution of DO in ponds can
be facilitated with copper tetraoxosulphate (CuSO4) in one or two applications, a
week. The quantity of CuSO4 in waters with 25ppm hardness is 800 g/ha surface area.
Disadvantage is that, it adds to the total Biochemical Oxygen Demand (BOD) in the
water. Nutrients may later recycle and may cause heavy scum.
How to detect pond water of poor quality
The following guidelines are given to a fish farmer to know when pond water is deteriorating
in quality and therefore not suitable for fish growth.
1. Clear water indicates very low or absence of biological production- not fertile enough
and fish will not grow well in it.
Anita Bhatnagar, Pooja Devi 1992
International Journal of Environmental Sciences Volume 3 No.6, 2013Water quality guidelines for the management of pond fish culture
2. Muddy water (that is a lot of clay particles are present), fish can have their gills
blocked by the soil particles and this can result in death - not good for fish culture.
3. Deep green water indicates over-production of planktons that serve as food for fish
but occur as a result of application of more than enough fertilizers, manure or nutrient
rich feeds to a pond.
4. When a fish pond gives an offensive odour, it indicates pollution of pond water.
Sources of pollution include application of excess food stuff to the pond, or inflow of
water from polluted rivers. Pollution can also result from application of chemicals to
arable crops around the pond site.
5. In an already stocked fishpond, if a farmer noticed the fish always struggling at the
pond water surface to get oxygen, then there is low DO content in the water (fig. 2).
The optimum range of various water quality parameters are summarised in Table-1.
Table 1: Suggested water-quality criteria for pond water fishery for getting high yield via
applying minimum input.
Sr.N Parameter Acceptable Desirable Stress
o range range
1. Temperature (0C) 15-35 20-30 35
2. Turbidity (cm) 30-80 80
3. Water colour Pale to light Light green to Clear water, Dark
green light brown green &Brown
4. Dissolved oxygen (mg L- 3-5 5 8
1
)
5. BOD (mg L-1 ) 3-6 1-2 >10
6. CO2 (mg L-1 ) 0-10 12
7. pH 7-9.5 6.5-9 11
8. Alkalinity (mg L-1 ) 50-200 25-100 300
9. Hardness (mg L-1 ) >20 75-150 300
10. Calcium (mg L-1 ) 4-160 25-100 250
11. Ammonia (mg L-1 ) 0-0.05 0- 0.3
12. Nitrite (mg L-1 ) 0.02-2 0.2
13. Nitrate (mg L-1 ) 0-100 0.1-4.5 >100, 3
15. H2S (mg L-1 ) 0-0.02 0.002 Any detectable level
16. Primary productivity (C 1-15 1.6-9.14 20.3
L-1 D-1)
17. Plankton (No. L-1) 2000-6000 3000-4500 7000
These precautions and above mentioned guidelines if taken will not only raise productivity
and economic benefits but will also help the farmers in maintaining ecofriendly ponds
environment required for sustainable fish culture / aquaculture.
3. References
1. Abowei, J. F. N., (2010), Salinity, Dissolved Oxygen, pH and surface water
temperature conditions in Nkoro River, Niger Delta, Nigeria, Advance journal of food
science and technology, 2(1), pp 16-21.
Anita Bhatnagar, Pooja Devi 1993
International Journal of Environmental Sciences Volume 3 No.6, 2013Water quality guidelines for the management of pond fish culture
2. Alikunhi, K. H., Ramachandra, V. and Chaudhuri, H., (1952), Mortality of carp fry
under supersaturation of dissolved oxygen in water, Proceedings of the national
institute of sciences of India, 17 (4), pp 261-264.
3. Banerjea, S. M., (1967), Water quality and soil condition of fishponds in some states
of India in relation to fish production, Indian journal of fisheries, 14, pp 115-144.
4. Barman, U. K., Jana, S.N., Garg, S. K., Bhatnagar, A. and Arasu, A.R.T., (2005),
Effect of inland water salinity on growth feed conversion efficiency and intestinal
enzyme activity in growing grey mullet, Mugil cephalus (Lin.): Field and laboratory
studies, Aquaculture international, 13(3), pp 241-256.
5. Bhatnagar, A. and Garg, S.K., (2000), Causative factors of fish mortality in still water
fish ponds under sub-tropical conditions, Aquaculture, 1(2), pp 91-96.
6. Bhatnagar, A. and Singh, G., (2010), Culture fisheries in village ponds: a multi-
location study in Haryana, India. Agriculture and Biology Journal of North America,
1(5), pp 961-968.
7. Bhatnagar, A., (2008), Productivity and fish biodiversity of selected ponds of
Haryana, Project Report submitted to Department of fisheries Government of
Haryana.
8. Bhatnagar, A., Jana, S.N., Garg, S.K. Patra, B.C., Singh, G. and Barman, U.K.,
(2004), Water quality management in aquaculture, In: Course Manual of
summerschool on development of sustainable aquaculture technology in fresh and
saline waters, CCS Haryana Agricultural, Hisar (India), pp 203- 210.
9. Boyd, C. E., (1979), Water Quality in Warmwater Fish Ponds, Agriculture
Experiment Station, Auburn, Alabama, pp 359.
10. Boyd, C.E and Lichtkoppler, F., (1979), Water Quality Management in Fish Ponds.
Research and Development Series No. 22, International Centre for Aquaculture
(J.C.A.A) Experimental Station Auburn University, Alabama, pp 45-47.
11. Bronmark, C. and Hansson, L. A., (2005), The biology of lakes and ponds, Oxford
University Press, Oxford, pp 285.
12. Clerk, R.B., (1986), Marine Pollution. Clarandon Press, Oxford, pp 256.
13. Cook, R.B., Kelly, C.A., Schindler, D. W. and Turner, M. A., (1986), Mechanisma of
hydrogen ion neutralization in an experimentally acidified lake, Limnology and
Oceanography, 31, pp 134-148.
14. Davenport, Y., (1993), Responses of the Blennius pholis to fluctuating salinities,
Marine Ecology Progress Series, 1, pp 101 – 107.
15. Delince, G., (1992), The ecology of the fish pond ecosystem, Kluwer Acadmic
Publisers London, pp 230.
Anita Bhatnagar, Pooja Devi 1994
International Journal of Environmental Sciences Volume 3 No.6, 2013Water quality guidelines for the management of pond fish culture
16. Ekubo, A. A. and Abowei, J. F. N., (2011), Review of some water quality
management principles in culture fisheries, Research Journal of Applied Sciences,
Engineering and Technology, 3(2), pp 1342-1357.
17. European Inland Fisheries Advisory Commission (EIFAC) , (1973), Water Quality
Criteria for European Freshwater Fish, Report on Ammonia and Inland Fisheries,
Water Resources., 7, pp1011-1022.
18. Garg, S. K. and Bhatnagar, A., (1996). Effect of varying doses of organic and
inorganic fertilizers on plankton production and fish biomass in brackish water ponds,
Aquaculture Research (The Netherlands), 27, pp 157-166.
19. Garg, S. K. and Bhatnagar, A., (1999), Effect of different doses of organic fertilizer
(cowdung) on pond productivity and fish biomass in still water ponds. Journal of
Applied Ichthyology, 15, pp 10-18.
20. Garg, S.K., Jana, S.N. and Bhatnagar, A., (2003), Effect of inland groundwater
salinity on digestibility and other aspects of nutrition physiology in Mugil cephalus
and Chanos chanos (Forsskal), In: Fish production using brackish water in arid
ecosystem (eds. Garg, S.K. and Arasu, A.R.T.), Ankush Printers, Hisar, pp 53-59.
21. Jamabo, N.A., (2008), Ecology of Tympanotonus fuscatus (Linnaeus, 1758) in the
Mangrove Swamps of the Upper Bonny River, Niger Delta, Nigeria. Ph.D. Thesis,
Rivers State University of Science and Technology, Port Harcourt, Nigeria, pp 231.
22. Kiran, B. R., (2010), Physico-chemical characteristics of fish ponds of Bhadra project
at Karnataka, RASĀYAN Journal of Chemistry, 3(4), pp 671-676.
23. Lucinda, C. and Martin, N., (1999), Oxford English Mini- Dictionary Oxford
University Press Inc, New York, pp 200-535.
24. Meade, J.W., (1985), Allowable ammonia for fish culture, Progressive Fish culture,
47, pp 135-145.
25. Meck Norm., (1996), Pond water chemistry, San Diego, Koi Club,
Http://users.vcnet.com/rrenshaw/h2oquality.html Revised on July 31, 1996.
26. Moses, B.S., (1983), Introduction to Tropical Fisheries, Ibadan University Press,
UNESCO/ICSU, Part, pp: 102-105.
27. Moyle, J.B., (1946), Some indices of lake productivity, Transactions of the American
Fisheries Society, 76, pp 322-334.
28. Mumtazuddin, M., Rahman, M. S. and Mostafa, G., (1982), Limnological studies of
four selected rearing ponds at the aquaculture experiment station, Mymenshingh.
Bangladesh Journal of Fisheries Research, 2-5 (1-2), pp 83-90.
29. National Agricultural Extension and Research, 1996, Water Quality Management in
Fish Culture, Extension Bulletin No. 98 Fisheries Series No 3 Published by Liaison
Services Ahmadu Bello University, Zaria.
Anita Bhatnagar, Pooja Devi 1995
International Journal of Environmental Sciences Volume 3 No.6, 2013Water quality guidelines for the management of pond fish culture
30. Ogbeibu, A. E. and Victor, R., (1995), Hydrological studies of water bodies in the
okomu forest reserves (sanctuary) in Southern Nigeria, physico-chemical hydrology,
Tropical Freshwater Biology, 4, pp 83-100.
31. Ornamental Aquatic Trade Association (OATA), (2008), Water Quality Criteria-
ornamental fish. Company Limited by Guarantee and Registered in England No
2738119 Registered Office Wessex House, 40 Station Road, Westbury, Wiltshire,
BA13 3JN, UK,
info@ornamentalfish.org www.ornamentalfish.org. Version 2.0 March 2008
32. Pruthi, H.S., (1932), Investigations regarding a recent epidemic of fish mortality in
the tank in the Indian museum compound with remarks on the causation of such
epidemics in general. Review of Hydrobiology Hydrographic, 26, pp 242-257.
33. Robinette, H. R., (1976), Effect of Selected Sublethal Levels of Ammonia on the
Growth of Channel Catfish (Ictalurus punctatus), Progressive Fish Culturist, 38, pp
26-29.
34. Santhosh, B. and Singh, N.P., (2007), Guidelines for water quality management for
fish culture in Tripura, ICAR Research Complex for NEH Region, Tripura Center,
Publication no.29
35. Sewell, R.B.S., (1927), On mortality of fishes, Journal of the Asiatic Society of
Bengal, 22, pp 177-204.
36. Sikoki, F.D. and J.V. Veen, (2004), Aspects of Water Quality and the Potential for
Fish Production of Shiroro Reservoir Nigeria, Living System Sustainable
development, 2, pp 7.
37. Smith, E. V. and Swingle. H. S., (1938), The Relationship Between Plankton
Production and Fish Production in Ponds. Transactions of the American Fisheries
Society, 68, pp 309-315.
38. Solis, N.B., (1988), The Biology and Culture of Penaeus Monodon, Department
Papers. SEAFDEC Aquaculture Department, Tigbouan, Boilo Philippines, pp 3-36.
39. Stone, N. M. and Thomforde H. K., (2004), Understanding Your Fish Pond Water
Analysis Report. Cooperative Extension Program, University of Arkansas at Pine
Bluff Aquaculture / Fisheries.
40. Stumn, W. and Morgan, J.J., (1981), An introduction imphasizing chemical equlibria
in natural waters, Aquatic chemistry. 2ND Ed., John Wiley and Sons, New York, pp
780.
41. Swann, L.D., (1997), A Fish Farmer’s Guide to Understanding Water Quality,
Aquaculture Extension Illinois, Purdue University, Indiana Sea Grant Program Fact
Sheet AS-503.
Anita Bhatnagar, Pooja Devi 1996
International Journal of Environmental Sciences Volume 3 No.6, 2013Water quality guidelines for the management of pond fish culture
42. Trifonova, I. S., (1989), Change in community structure and productivity of
phytoplankton as indicator of lake reservoir eutrophication, Archiv für
Hydrobiologie–Beiheft Ergebnisse der Limnologie, 33, pp 363- 371.
43. Upadhyaya, M.P., (1964), Seminar on inland fisheries development in U. P., pp 127-
135.
44. Wurts, W.A. and Durborow, R. M., (1992), Interactions of pH, Carbon Dioxide,
Alkalinity and Hardness in Fish Ponds Southern Regional Aquaculture Center, SRAC
Publication No. 464.
**************
Karnal district (Latitude: 29025’05”- 29059’20” N and Longitude: 76027’40” - 77013’08” E)
falls in the north-east part of the Haryana State. The river Yamuna, which marks the eastern
boundary of the Haryana State as well as Karnal district, provides the major drainage in the
area. About 70% of the net irrigated area is covered through ground water, with rice- wheat
being the major crop rotation. The district is characterized by semiarid climate and is a part of
Indo- Gangetic alluvial plains which contribute a large share of food grains to national buffer
stock. The overexploitation of hitherto fresh groundwater in the district is leading to not only
alarming decline in watertable but also deterioration in quality in certain pockets. The current
average water table depth in the district is about 20 m and deep submersible tubewells at 50-
100 m depth have replaced the centrifugal pumps in almost entire district.Water samples were
collected from 67 locations during pre and post-monsoon seasons of the year 2011, and were
subjected to analysis for chemical characteristics. The type of water that predominates in the
study area was of sodium-calcium bicarbonate and magnesium bicarbonate type during pre
and post-monsoon seasons of the year 2011 respectively, based on hydro-chemical facies.
Based on chemical analysis, the pre and post monsoon water samples were classified as per
different standard irrigation criteria to study the chemical changes resulting due to rain and
natural recharge.
Keywords: Groundwater, chemical characters, chemical classification, SAR, RSC, USSL
diagram.
1. Introduction
Water quality analysis is one of the most important aspects in groundwater studies.
Determination of physico-chemical characteristics of water is essential for assessing the
suitability of water for various purposes like drinking, domestic, industrial and irrigation. The
groundwater quality may also vary with seasonal changes and is primarily governed by the
extent and composition of dissolved solids. Water quality is influenced by natural and
anthropogenic effects including local climate, geology and irrigation practices. A number of
techniques and methods have been developed to interpret the chemical data. Zaporozee
(1972) has summarized the various modes of data representation and has discussed their
possible uses. Presentation of chemical analysis in graphical form makes understanding of
complex groundwater system simpler and quicker. Methods of representing the chemistry of
water like Collin’s bar diagram, radiating vectors of Maucha (1940), and parallel and
Anita Bhatnagar, Pooja Devi 1997
International Journal of Environmental Sciences Volume 3 No.6, 2013Water quality guidelines for the management of pond fish culture
horizontal axes of Stiff(1940), have been used in many parts of the world to show the
proportion of ionic concentration in individual samples. Subramanian (1994) followed a
series of methods to interpret and classify the chemistry of groundwater in hard rock,
including coastal zones in the southern parts of India.
In India about 50 per cent of the total cultivated area under irrigation is dependent upon
groundwater and of this, about sixty per cent of irrigated food production depends on
groundwater wells (Shah et al., 2000; CWC, 2000). In the present study, the area, i.e. Karnal
District of Haryana state also uses mostly groundwater through shallow tube wells. Ground
water contributes 95 % of the total need for agriculture. CGWB (2007) reported that chemical
analysis of water samples from shallow aquifers indicates that ground water is alkaline in
nature and is moderately saline. The ground water is mixed Cation-HCO3 type. The stage of
ground water development for the district is 137% and all the six blocks fall in over-exploited
categories. That means that the ground water is under stress and the ground water level is
declining. There is no scope for further ground water development. Only measures should be
taken to reduce on the dependence on ground water and to enhance the ground water
resources. Though some discrete, hydro chemical data are available for the region,
comprehensive seasonal variation of groundwater quality has never been studied so far. In
this paper an attempt has been made to study the affect of monsoon on groundwater quality
for irrigation.
2. Materials and method
2.1 Study area
Karnal is located in the northwestern corner of Haryana state between North latitudes
29025’05” and 29059’20” and East longitudes 76027’40” and 77013’08” covering an area of
2520 sq.km. The district covers 5.69% area of the state. The district is one of the most
densely populated districts of the state. The total population of the district as per 2001 census
is 12, 74,183. The population density is 506 persons per sq.km against the State average of
478 persons per sq.km. The district falls in the Upper Yamuna Basin. The river Yamuna
which marks the eastern boundary of the Haryana State as well as Karnal district provides the
major drainage in the area. Irrigation in the district is done by surface water as well as ground
water. 70% of the net irrigated area is covered through ground water
Figure 1: Study area
Anita Bhatnagar, Pooja Devi 1998
International Journal of Environmental Sciences Volume 3 No.6, 2013Water quality guidelines for the management of pond fish culture
2.2 Collection of water samples
Groundwater samples were collected from 67 tubewells located in different parts of the
district during pre-monsoon (May/June 2011) and post-monsoon (October/November 2011)
period. The collected water samples were transferred into precleaned polythene container for
analysis of chemical characters. Chemical analyses were carried out using the standard
procedures (APHA-2002). Each of ground water samples were analyzed for pH, electrical
conductivity (EC), major cations and major anions. Among variable parameters, pH and EC
were measured immediately by using portable meters (Eutech, ECTestr11+). Total hardness
and calcium were determined by ethylenediaminetetraacetic acid titimetric method.
Magnesium was estimated as difference in Total Hardness and Calcium. Total alkalinity,
carbonate and bicarbonate and chloride were estimated by using titimetric method. Sodium
and Potassium were estimated by flame photometer.Sulphate was estimated by gravimetric
method. Total dissolved solids, RSC, % Sodium, SAR were determined by calculation. The
analytical data was used to classify the utilitarian purpose of water and for ascertaining
various factors on which the chemical characteristics of water depend. In this paper Piper,
Back and Hanshaw, Wilcox, Eaton, Todd and USSL (US Salinity Laboratory) classification
have been used to characterize the hydrochemical characteristics of groundwater of Karnal
District.
Figure 2: Sampling location map
2.3 Piper diagram
The Piper-Hill diagram (1953) is used to infer hydro-geochemical facies. These plots include
two triangles, one for plotting cations and the other for plotting anions (figure 3). The cations
and anion fields are combined to show a single point in a diamond-shaped field, from which
inference is drawn on the basis of hydro-geochemical facies concept. These tri-linear
diagrams are useful in bringing out chemical relationships among groundwater samples in
more definite terms rather than with other possible plotting methods. Chemical data of
representative samples from the study area is presented by plotting them on a Piper-tri-linear
diagram for pre-and post-monsoon (figures 4 and 5).These diagrams reveal the analogies,
Anita Bhatnagar, Pooja Devi 1999
International Journal of Environmental Sciences Volume 3 No.6, 2013Water quality guidelines for the management of pond fish culture
dissimilarities and different types of waters in the study area. The concept of hydrochemical
facies was developed to understand and identify the water composition in different classes.
Facies are recognizable parts of different characters belonging to any genetically related
system. Hydrochemical facies are distinct zones that possess action and anion concentration
categories. To define composition class, Back and co-workers (1965) suggested subdivisions
of the tri-linear diagram (figure 3). The interpretation of distinct facies from the 0 to 10% and
90 to 100% domains on the diamond shaped cation to anion graph is more helpful than using
equal 25% increments. It clearly explains the variations or domination of cation and anion
concentrations during pre-monsoon and post-monsoon.
Legend
A- Calcium type,B-No Dominant type,C- Magnesium type,D- Sodium and potassium
type,E- Bicarbonate type,F- Sulphate type,G- Chloride type
Figure 3: Classification diagram for anion and cation facies in the form of major-ion
percentages (Piper, 1953; Back and Hanshaw, 1965; Sadashivaiah et al., 2008)
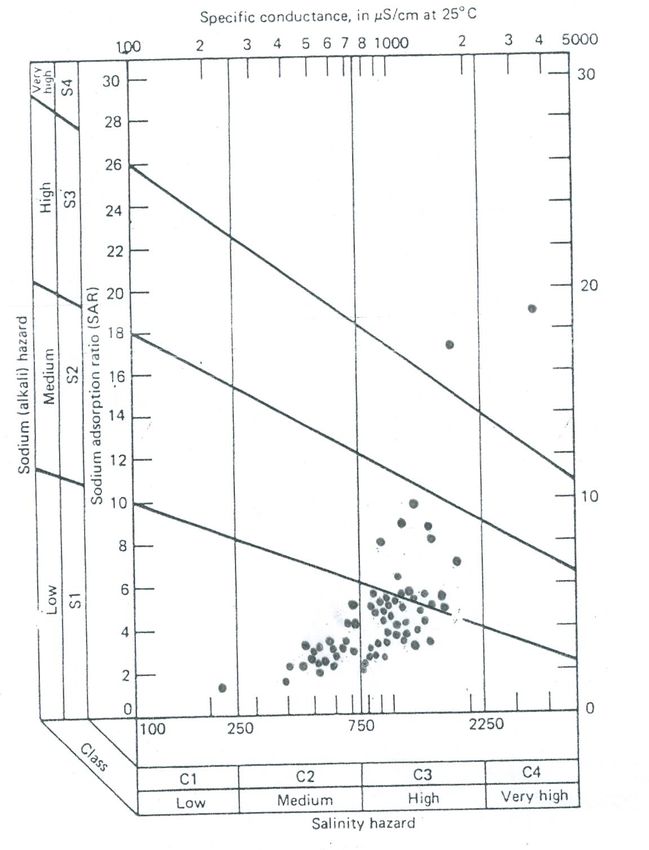
Wilcox (1995) classified groundwater for irrigation purposes based on per cent sodium and
Electrical conductivity. Eaton (1950) recommended the concentration of residual sodium
carbonate to determine the suitability of water for irrigation purposes. The US Salinity
Laboratory of the Department of Agriculture adopted certain techniques based on which the
suitability of water for agriculture is explained. The sodium in irrigation waters is usually
denoted as per cent sodium and can be determined using the following formula.
% Na = (Na+) X 100/ (Ca2+ + Mg2+ + Na+ + K+)
Anita Bhatnagar, Pooja Devi 2000
International Journal of Environmental Sciences Volume 3 No.6, 2013Water quality guidelines for the management of pond fish culture
Where the quantities of Ca2+ Mg2+ Na+ and K+ are expressed in milliequivalents per litre
(meq/l).
In waters having high concentration of bicarbonate, there is tendency for calcium and
magnesium to precipitate as the water in the soil becomes more concentrated. As a result, the
relative proportion of sodium in the water is increased in the form of sodium carbonate. RSC
is calculated using the following equation.
RSC = (HCO3- + CO32-) – (Ca2+ + Mg2+)
Where all ionic concentrations are expressed in equivalent per mole.
According to the US Department of Agriculture, water having more than 2.5 epm of RSC is
not suitable for irrigation purposes.
The most important characteristics of irrigation water in determining its quality are: (i) Total
concentration of soluble salts; ii) Relative proportion of sodium to other principal cations;
(iii) Concentration of boron or other element that may be toxic, and (iv) Under some
condition, bicarbonate concentration as related to the concentration of calcium plus
magnesium. These have been termed as the salinity hazard, sodium hazard, boron hazard and
bicarbonate hazard. In the past, the sodium hazard has been expressed as per cent sodium of
total cations. A better measure of the sodium hazard for irrigation is the SAR which is used to
express reactions with the soil.
SAR is computed as
Where all ionic concentrations are expressed in equivalent per mole.
For the purpose of diagnosis and classification, the total concentration of soluble salts
(salinity hazard) in irrigation water can be expressed in terms of specific
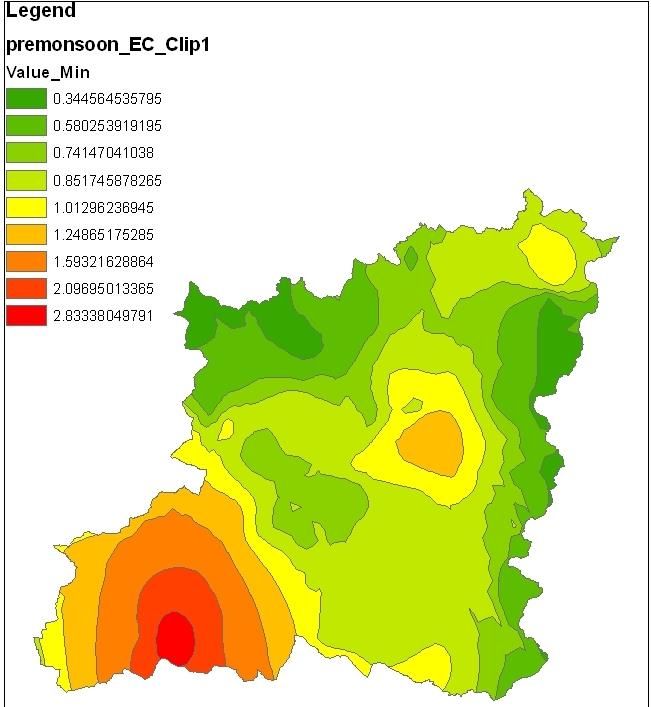
conductance.Thematic maps of Electrical Conductivity (EC) and Residual Sodium Carbonate
(RSC) were created for both Pre-monsoon and Post-monsoon seasons using Arc GIS 10.0
software.
3. Results and discussion
Piper diagrams are an example of water quality diagrams which are probably the most
frequently used today. The subdivisions of the trilinear or piper diagram depict that Na-Ca-
HCO3 type of water was dominated during pre-monsoon. The percentage of samples falling
under NaCa-HCO3 type of water was 45% in pre-monsoon season(Table 1). Mg-HCO3 type
of water was predominated during post-monsoon with 57% water samples. For anion
concentration, HCO3-type of water was predominated in pre-monsoon with 83.6% samples
while in post monsoon season 94% samples were of HCO3–type water. The appreciable
change in the hydro-chemical facies was noticed during the study period (pre- and post-
monsoon), which was might be due to the leaching of alkali salts through
precipitation.Thussu (2004) reported that in Karnal, the water in general is Ca-Mg- HCO3
type. The changes in chemical composition have taken place along the present day palaeo-
Anita Bhatnagar, Pooja Devi 2001
International Journal of Environmental Sciences Volume 3 No.6, 2013Water quality guidelines for the management of pond fish culture
bank of Yamuna river and Chautang nala. Primary saline water with conspicuous primary
salinity occurs at Jalmana, while the water with secondary salinity occurs at Kinana.
Changes have taken place in the waters, which were CaMg HCO3 to Na-Ca-HCO3 type at
Assand, and to NaHCO3 at Nisang; NaHCO3 to mixed to NaCI at Munak and mixed to
CaMgHCO3 at Shahpur. The geology of Karnal district is alluvium in nature having
appreciable content of sand in underground layers and water is generally found in the sandy
zone.
Table 1: Characterization of groundwater of Karnal District of Haryana on the basis of Piper
tri-linear diagram
Characteristics of Percentage of samples
Subdivision
corresponding in this category
of the
subdivisions of
diamond
diamond-shaped Pre-Monsoon Post-Monsoon
fields
1 Alkaline earth 37.3 58.2
(Ca+Mg) Exceed
alkalies (Na+K)
2 Alaklies exceeds 62.7 41.8
alkaline earths
3 Weak acids 83.6 91
(C03+HCO3)
exceed
Strong acids
(SO4+Cl)
4 Strong acids 16.4 9
exceeds
weak acids
5 Magnesium 40.3 56.7
bicarbonate type
6 Calcium-chloride - -
Type
7 Sodium-chloride 13.4 6
Type
8 Sodium-Bicarbonate 1.5 1.5
Type
9 Sodium calcium- 44.8 35.8
Bicarbonate type
10 Calcium - -
Magnesium-
Chloride Type
Anita Bhatnagar, Pooja Devi 2002
International Journal of Environmental Sciences Volume 3 No.6, 2013Water quality guidelines for the management of pond fish culture
Figure 4: Post-monsoon Groundwater Samples Plotted in Piper-Trilinear diagram
Figure 5: Pre-monsoon Groundwater Samples Plotted in Piper-Trilinear diagram
The classification of groundwater samples with respect to per cent sodium is shown in Table
2. It is observed that about 89.6% of samples fall under permissible to doubtful category
during premonsoon while 85.1% samples are reported in this category during post- monsoon.
Similarly, 7.5% and 4.5% samples fall under unsuitable category during pre and post
monsoon season respectively.
Anita Bhatnagar, Pooja Devi 2003
International Journal of Environmental Sciences Volume 3 No.6, 2013You can also read