A COST-BENEFIT ANALYSIS OF THE FISH FARMING ENTERPRISE PRODUCTIVITY PROGRAM PROJECT IN KENYA. THE CASE OF IMPLEMENTATION OF THE AQUACULTURE ...
←
→
Page content transcription
If your browser does not render page correctly, please read the page content below
unuftp.is Final Project 2015

A COST–BENEFIT ANALYSIS OF THE FISH FARMING ENTERPRISE
 PRODUCTIVITY PROGRAM PROJECT IN KENYA.
 THE CASE OF IMPLEMENTATION OF THE AQUACULTURE
 DEVELOPMENT COMPONENT IN MERU COUNTY.
 Moses Mwangangi Wambua
 County Government of Meru, Kenya
 Kenya
 wambua.moses@gmail.com

 Supervisor:

 Sigurður Jóhannesson
 University of Iceland
 sjz@hi.is

 ABSTRACT

Since 2004 Kenya has experienced a dramatic increase in aquaculture production. Over a 10-
year period, aquaculture production increased twenty-fold from 2004 to 2013, from about
1000 tons to more than 23000 tons. The government of Kenya has seen aquaculture as a
viable option to stimulate economic growth in the country. Part of that view was the
establishment in 2009 of the Fish Farming Enterprise and Productivity Program (FFEPP). The
objectives of the program were manifold, not only aiming for economic return but also aiming
at unemployment and better quality of food. Much effort was put into building ponds and
offering support to farmers. The aim of this study is to provide an economic analysis of the
FFEPP project as it was implemented in Meru county in Kenya and make recommendations
based on the outcome of the cost-benefit analysis. The cost-benefit analysis was based on
calculation of NPV, Benefit-Cost Ratio (BCR), and IRR. At the end a sensitivity analysis was
performed to assess the uncertainty around the assumptions in the model. The data was
acquired from Meru Fisheries Office and the National Aquaculture Secretariat in Nairobi. The
results indicate that the project has and will produce significant economic gains for the Meru
communities. The study also finds that the objectives of the FFEPP project have been
achieved for Maru county but before the FFEPP is scaled up it is recommended that the
government should better examine the costs vs benefits in other areas of Kenya taking into
consideration climatic and geographic factors as well and social and cultural factors. The
success has attracted the private sector’s attention which is an encouraging sign for the future
development of aquaculture.

This paper should be cited as:
Wambua, M.M. 2018. A cost–benefit analysis of the fish farming enterprise productivity program project in Kenya. The case
of implementation of the aquaculture development component in Meru County. United Nations University Fisheries Training
Programme, Iceland [final project].
http://www.unuftp.is/static/fellows/document/moses15prf.pdf
Wambua

 TABLE OF CONTENTS

1 INTRODUCTION............................................................................................................. 4
 1.1 Background .................................................................................................................. 4
 1.2 Status of aquaculture in Kenya .................................................................................... 4
 1.3 Fisheries and Economic Development in Kenya ......................................................... 6
 1.4 Fish Farming Enterprise Productivity Program (FFEPP) ............................................ 6
 1.5 Study Area; Meru County............................................................................................ 7
 1.6 Research Problem ........................................................................................................ 7
 1.7 General Research Objectives ....................................................................................... 7
2 LITERATURE REVIEW ................................................................................................ 8
 2.1 World Aquaculture ...................................................................................................... 8
 2.2 Cost-benefit considerations in development projects .................................................. 9
3 RESEARCH METHOD ................................................................................................. 10
 3.1 Criteria for Evaluation in a Cost Benefit Analysis .................................................... 10
 3.2 Data Collection .......................................................................................................... 11
 3.2.1 Components of the FFEPP ................................................................................. 12
 3.2.2 Production Characteristics of FFEPP Ponds and Basic Assumptions ................ 14
 3.3 Framework for Analysis ............................................................................................ 16
4 RESULTS ........................................................................................................................ 17
 4.1 The referent groups .................................................................................................... 17
 4.2 The portfolio of project options ................................................................................. 17
 4.3 Costs and benefits expected without the FFEPP ....................................................... 17
 4.4 The costs and benefits of the FFEPP over its expected life....................................... 17
 4.5 Monetization of the outputs and impacts of the project ............................................ 18
 4.6 The NPV, BCR and IRR of the project ..................................................................... 19
 4.7 Sensitivity Analysis ................................................................................................... 21
 4.7.1 Effects of changes in the pond production on the NPV ..................................... 21
 4.7.2 Effects of changes in the dropout rate on the NPV ............................................ 21
 4.7.3 Effects of changes in the fingerling prices on the NPV ..................................... 22
 4.7.4 Effects of changes in the market price of fish on the NPV ................................ 22
 4.7.5 Effects of changes in the discount rate on the NPV ........................................... 22
 4.7.6 Effects of changes in the cost of feed on the NPV ............................................. 23
 4.7.7 Summary of the sensitivity analysis ................................................................... 23
5 DISCUSSION .................................................................................................................. 24
6 CONCLUSIONS AND RECOMMENDATIONS ........................................................ 26
ACKNOWLEDGEMENTS ................................................................................................... 28
LIST OF REFERENCES ...................................................................................................... 29
APPENDICES ........................................................................................................................ 32

UNU – Fisheries Training Programme 2
Wambua

LIST OF FIGURES

Figure 1: Kenya Aquaculture Production Trends 2004-2013 (State Department of Fisheries,
2013)........................................................................................................................................... 5
Figure 2: Position of Meru County in Kenya: (Meru County Government, 2013) .................... 8
Figure 3: Effects of Changes in the Pond Productivity on the NPV. ....................................... 21
Figure 4: Effects of Changes in the Dropout Rate on the NPV. .............................................. 21
Figure 5: Effects of Changes in Fingerlings Prices on the NPV. ............................................. 22
Figure 6: Effects of Changes in Market Price on the NPV. ..................................................... 22
Figure 7: Effects of Changes in Discount Rate on the NPV. ................................................... 23
Figure 8: Effects of Changes in the Cost of Feeds on the NPV ............................................... 23
Figure 9: Accumulated Costs, Benefits and NPV over Project Period .................................... 36
Figure 10: Annual FFEPP Fish Production from Meru County............................................... 38
Figure 11: Progression of FFEPP Net Benefits into Infinity ................................................... 38

LIST OF TABLES

Table 1: FFEPP Support to Benefitting Farmers ..................................................................... 12
Table 2: Government of Kenya FFEPP Expenditure ............................................................... 13
Table 3: Production Characteristics of the FFEPP Ponds ........................................................ 14
Table 4: Requirements of FFEPP Ponds per Production Cycle ............................................... 16
Table 5: NPV of the FFEPP Project ......................................................................................... 20
Table 6: Summary of Sensitivity Analysis ............................................................................... 24
Table 7: Labour Estimates for FFEPP Fish Farmer ................................................................. 32
Table 8: FFEPP Farmer Costs and Income Estimates .............................................................. 32
Table 9: Cereals (Maize) Profits for one acre in Meru ............................................................ 33
Table 10: Annual FFEPP Production from Meru County (kg) ................................................ 34
Table 11: Accumulated Costs and Benefits of the FFEPP Program ........................................ 35
Table 12: Predicted NPV Values for Recurring 15 Year Periods ............................................ 36
Table 13: Prediction of NPV to Infinity ................................................................................... 37

UNU – Fisheries Training Programme 3
Wambua

1 INTRODUCTION

1.1 Background

In the course of half a century, aquaculture has expanded from being almost negligible to fully
comparable with capture production of fish in terms of providing the world population with
food (FAO, 2012). Aquaculture production continues to grow in the new millennium, albeit at
a slower rate than in the 1980s and 1990s.

In 2012, aquaculture set another all-time production high and now provides almost half of all
fish for human consumption (FAO, 2014). The total human consumption of fish as food stands
at 136.2 million tons. Because of population growth, it is estimated that the world will consume
at least another 23 million tonnes of food fish by 2030. This demand needs to be met by
aquaculture since many of the world fisheries are at or close to their limits (FAO, 2012).

Aquaculture plays an important role in food security and poverty alleviation worldwide because
of its ability to provide freshwater fish, which, although mainly consisting of low-value species
in terms of market value, provide food on the table and increases nutritional variety.
Aquaculture could play an important role in meeting the needs of people in terms of food now
and in the future.

In Kenya, fish farming can be traced back to the 1890s with the introduction of trout for sport
fishing. Later, small scale aquaculture was started in the 1940s (Kaliba et al., 2007). It further
expanded in the 1960s through the “Eat more fish campaigns” of the Government of Kenya
(Rothuis et al., 2011). Subsequently, the growth was slow; aquaculture was mainly a
subsistence activity among the rural folk until the Government of Kenya (GOK) started subsidy
programs in 2007. These programs were intended to promote aquaculture with the goals of
creating employment, improving food security and raising the standards of living in rural areas.

Fish farming is mainly practiced by smallholders with an average production in 2011 of around
3 tons/ha (Rothuis et al., 2011). The number of farmers practising aquaculture on a commercial
and intensive scale is expected to rise as the government continues to encourage adoption of
aquaculture as an income generating activity.

1.2 Status of aquaculture in Kenya

Aquaculture production in Kenya is insignificant on a global scale and has not seen the same
rapid growth the sector has undergone worldwide. However, the demand for fish is constantly
growing while supply lags behind because of declining natural fish stocks. This provides an
opportunity for further aquaculture development.

Kenya is endowed with good natural resources such as land and water (rivers, lakes and the
sea) that can support an increased aquaculture production. Although most parts of Kenya are
suitable for aquaculture, by 2011 only about 0.014% of the potential aquaculture sites were
being used for aquaculture. Furthermore, about 95% of fish farming was still on a small-scale
basis (Otieno, 2011). According to the Kenyan State Department of Fisheries, the area under
aquaculture to date is estimated to be about 2% of the potential aquaculture sites.

According to the Ministry of Fisheries Development (2010), Kenya has 9.5 million ha of high
potential areas and over 40.5 million ha of medium potential areas suitable for fish farming in

UNU – Fisheries Training Programme 4
Wambua

the country. If this potential was fully utilized, the production from aquaculture could possibly
be increased to 11 million tons per annum. This would increase the production value to over
750 billion shillings creating, in the long run, an industry employing and supporting a
substantial percentage of the Kenyan population as fish farmers, fish feed manufactures, fish
processors, traders and providers of services to the sector.

Over the last ten years, aquaculture production has increased from 1,035 tons produced in 2004
to 23,501 tons in 2013 (Figure 1). This current aquaculture production is from 69,194 ponds
with an area of 2,076 ha, including 161 tanks measuring 2.3 ha and 124 reservoirs with an area
of 74.4 ha spread throughout the country (State Department of Fisheries, 2013).

 Production 2004 - 2013 in tons
 25.000 23.501
 21.487
 19.585
 Quantities in tons

 20.000

 15.000 12.153
 10.000
 4.245 4.452 4.895
 5.000
 1.035 1.047 1.012
 0
 2004 2005 2006 2007 2008 2009 2010 2011 2012 2013
 Year

Figure 1: Kenya Aquaculture Production Trends 2004-2013 (State Department of
Fisheries, 2013)

The majority of fish farms in Kenya and in particular in the Meru region are small-scale and
practise either extensive or semi-intensive fish farming. For most, fish farming is done as a part-
time and secondary activity to other farm activities. However, the number of farmers who have
taken up fish farming on an intensive scale is growing, although the precise number is unknown
since there adequate statistics are not available.

Despite political support, lack of awareness concerning returns on aquaculture investments has
significantly slowed growth of the aquaculture sector in Kenya. The farmers see fish farming
as a marginal and risky investment (Ngugi & Manyala, 2004).

Since the fisheries sector is driven by many stakeholders, a crucial element of the fisheries
policy development has been to provide guidance on the sectoral framework by facilitating
coordination and harmonization of the sector’s mandate, programmes and implementation of
plans of action to achieve sustainable development. The overall objective of the fisheries policy
in Kenya is to: facilitate a vibrant industry based on sustainable resource exploitation; provide
optimal and sustainable economic benefits, alleviating poverty and create wealth, while also
taking into account gender equity (Ngugi & Manyala, 2008).

UNU – Fisheries Training Programme 5
Wambua

1.3 Fisheries and Economic Development in Kenya

The Kenya Vision 2030 Development blueprint aims to transform Kenya into a newly
industrialised, “middle-income country providing a high-quality life to all its citizens by the
year 2030”.

The Fisheries Development and Management project has been one of the Vision 2030 flagship
projects as from 2012. The overall objective of the project is to increase national fish production
by at least 10% per annum from 154,000 tons to 450,000 tons by 2030. The State Department
of Fisheries plans to actualize this by focusing on the following components: Increased
aquaculture development; capture fisheries development and management; promote fish safety,
value addition and marketing (Ministry of Agriculture, Livestock and Fisheries Development,
2014).

Fisheries play an important role in the economic and social development of Kenya. Currently,
the industry contributes about 0.5% to the national GDP. This is based on ex-vessel value of
fish landings. The contribution could be higher if the estimation is based on the value of final
goods and services. At the community level, aquaculture provides a source of subsistence and
livelihood to the rural poor within the vicinity of their farming areas. However, the actual socio-
economic contribution of the sector has not been accurately quantified (Ngugi & Manyala,
2008).

1.4 Fish Farming Enterprise Productivity Program (FFEPP)

Viewing aquaculture as one viable option for stimulating economy growth, the Kenyan
Government initiated Economic Stimulus Programs (ESP) in 2009. One component of that
program entailed strengthening fish farming in two thirds of the country and especially in areas
with high unemployment rates in the program called Fish Farming Enterprise and Productivity
Program (FFEPP).

Although the FFEPP targeted fish farming in the whole country, the main focus was on areas
that were the most suitable for aquaculture. The program aimed at enhancing aquaculture
development by increasing production of farmed fish from 4,000 tons to over 20,000 tons in
the medium term and to more than 100,000 tons by the year 2030 (State Department of
Fisheries, 2013).

The FFEPP comprised of six components namely;

 i. Strengthening of aquaculture institutions and capacity building
 ii. Enhancement of fish production and productivity along the value chain within
 aquaculture parks
 iii. Aquaculture extension services and outreach programs
 iv. Aqua-businesses and market development
 v. Quality assurance for aquaculture products
 vi. Participatory monitoring and evaluation.

In the first year of the project (2008/2009), 200 fish ponds were constructed in 140
constituencies, totalling over 27,000 fish ponds nationally. In the second year, 100 more fish
ponds were constructed in the initial 140 constituencies and a further 300 new ponds in 20 new
constituencies that were added to the program. In the third and fourth years, a total of 25 fish

UNU – Fisheries Training Programme 6
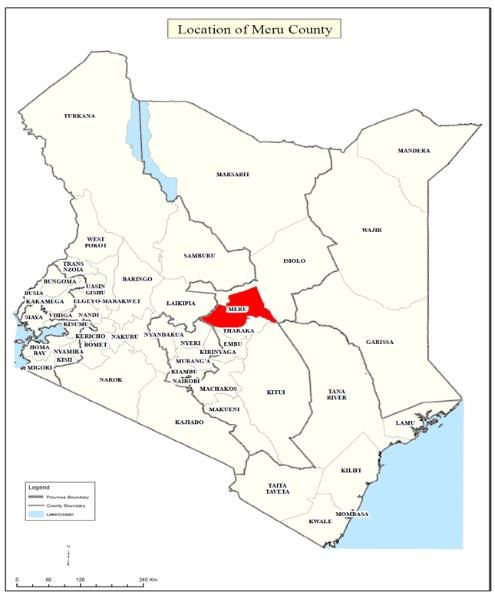
Wambua

ponds were constructed in 160 constituencies. In total, over 52,000 fish ponds of over 15,360
ha were constructed across the country. These ponds were located in areas that ranked high on
the surveys for aquaculture suitability.

The Ministry of Fisheries Development adopted a common format for the production units in
all the benefitting areas. The ponds were each constructed with a surface area of 300 m2. They
were all supplied with an equal amount of the production inputs and were to adopt similar pond
management strategies.

1.5 Study Area; Meru County

Meru County lies in the eastern region of Kenya, approximately 225 km northeast of the capital
Nairobi. Meru lies to the east of Mt. Kenya whose peak cuts through the southern boundary of
the county (Figure 2). The county has a total area of 6,936.2 km2 out of which 1,776 km2 is a
gazetted forest (Meru County Government, 2013).

The climate in Meru is generally temperate. Temperatures ranges between 16oC during the cold
season and 23oC in the warm season. Meru receives an annual rainfall of between 500 mm and
2600 mm each year. The drainage pattern in the county is characterised by rivers and streams
originating from catchment areas such as Mt. Kenya and the Nyambene ranges in the north.
The rivers cut through the hilly terrain on the upper zones to the lower zones and drain into the
Indian Ocean via the Tana and Uaso Nyiro Rivers.

Due to its good climatic attributes, Meru was one of the areas that has been classified as highly
suitable for aquaculture production. Consequently, during the FFEPP, Meru received over
2,000 fish ponds. These ponds are distributed across all the county. The major types of fish
found in this region are Nile tilapia (Oreochromis niloticus), catfish (Clarias gareipinus) and
the rainbow trout (Oncorhynchus mykiss).

1.6 Research Problem

Those with responsibility for spending public money need to know that they are choosing the
best option (FAO, 1986). Before massive expansion of the FFEPP project is implemented,
various economic assessments should be made in order to answer vital questions. It is important
to first identify potential costs and benefits as well as possible challenges met in the initial
phases of the project. The project should only continue if its long-term benefits outweigh the
costs.

To this end, a Cost Benefit Analysis (CBA) was conducted for this project. It provides a
valuation of the project as implemented in Meru County; adds to the existing knowledge on the
performance of the FFEPP project, and perhaps points out areas for improvements as the project
continues. The Meru case offers a sound basis on which to make inferences on the performance
of the FFEPP in the entire country.

1.7 General Research Objectives

The main objective of this study is to provide an economic analysis of the FFEPP project as
implemented in Meru County and make recommendations based on the outcomes of the cost
benefit analysis.

UNU – Fisheries Training Programme 7
Wambua

Figure 2: Position of Meru County in Kenya: (Meru County Government, 2013)

2 LITERATURE REVIEW

2.1 World Aquaculture

All over the world, aquaculture production has grown rapidly, which is largely attributable to
technological advances in fish production, e.g., hybridization, genetic engineering, formulated
diets, and biofloc technology used in ponds, cages, tanks, and recirculation systems (FAO,
2012). However, the rate of growth of global aquaculture differs across the continents. Asia has
become the giant in aquaculture production whereas Africa has yet to report any significant
quantities of aquaculture on the global scale despite the availability of natural resources in the
region (FAO, 2010).

Africa contributes only 2.2% of the global aquaculture production (FAO, 2014), and although
impressive strides have been made in African aquaculture, Africa is still far from achieving its

UNU – Fisheries Training Programme 8
Wambua

full aquaculture potential (AU, 2014). The promotion of aquaculture for rural development has
a poor record in Africa where sufficient attention has not been paid to its role in the livelihood
or farming system of the intended beneficiaries the result being poor adoption by one of the
intended target groups, the rural poor ( FAO, 2002).

Most development efforts by the former colonial administrations, and subsequently by
independent African governments backed by donor aid, were directed at introducing
aquaculture into the small-scale farming sector which constitutes the backbone of Africa’s rural
economy (Britz & Rouhani, 2004). These efforts, which span half a century, have largely failed.
In recent times a number of analysts have tried to explain the reasons for this. They include the
following:

 • There is a lack of appreciation and awareness for the need to integrate aquaculture
 development with overall and comprehensive rural development programmes.
 • In some instances, aquaculture has been promoted in regions that are unsuitable for
 aquaculture because of unfavourable climate, infrastructure or market.
 • Major technological constraints such as inadequate supply of quality and affordable fish
 feed ingredients, prohibitive transport costs and a lack of juveniles for stocking ponds.
 • Administrative failures that include a lack of coordination between development and
 research, limited availability of finances, inadequate collaboration within and between
 administrative departments, a lack of stability of institutional frameworks and
 inefficient rural extension systems.
 • Social constraints that include an absence of a traditional culture of fish farming in sub-
 Saharan Africa, limited availability of well-trained senior personnel, security issues
 such as theft of equipment and poaching of stock, and poorly trained extension officers.

In many developing countries nevertheless, aquaculture has had significant positive effects on
rural and urban food supply and on income and employment. However, increasing demand for
fish in global markets and the complex networks that affect the supply and prices of fish are
influencing aquaculture production both at national and local levels. Countries are now faced
with challenges to improve efficiency and effectiveness of their production. Therefore, there
are both opportunities and challenges which need to be addressed (Mwamunye et al., 2012).

Although an increasing number of developing countries are turning to aquaculture, all its
beneficial attributes are often overlooked or ignored. It is vital that both its potential benefits
and challenges are identified by agricultural and rural development professionals, policy makers
as well as by the local farmers (Mwamunye et al., 2012).

2.2 Cost-benefit considerations in development projects

A Cost Benefit Analysis is a methodology used to measure the economic efficiency of
allocating resources to meet certain human needs. The CBA for an aquaculture development
project involves comparing the costs, both the initial start-up costs and on-going operational
expenses, to the stream of revenues and other benefits that accrues over time.

CBAs help decision makers make investments, assess regulations, and weigh difficult public
policy trade-offs. The methodology has been around for over 50 years as an essential economic
tool for evaluating projects benefits and is performed in evaluations of policies, programmes
and projects, environmental impact assessments and the management of natural resources (US
EPA, 2000).

UNU – Fisheries Training Programme 9
Wambua

A CBA provides a subjective and systematic way to view policy decisions, which often lack in
the world of politics. It forces decision makers to consider who the beneficiaries and losers are,
both presently and in the future (Pearce et al., 2006).

There is an implicit assumption in the CBA of any governmental policy: a policy ought to result
in an improvement on the overall welfare or well‐being of the society. To assess this, we need
to measure the total costs and benefits wherever they fall in the society and compare them.
Projects or policies for which the total benefits exceed the total costs are considered worth
promoting (Denne et al., 2007).

3 RESEARCH METHOD

3.1 Criteria for Evaluation in a Cost Benefit Analysis

Several criteria are used in a CBA to determine whether or not an investment policy, project or
programme is economically efficient. The following criteria have been used in this study:

Net Present Value (NPV)
This measures the present value of the net benefits of the development project. The formula for
calculating an NPV is:

 ( − )
 = ∑
 (1 + ) − 0
 = 0

 =∑ −∑
 ( 1 + ) 0
 − (1 + ) − 0
 = 0 = 0

Where Bt is the benefit at time period t and Ct is the cost at period t. The project period or
terminal year is T which can equal infinity, the start time to while the discount rate is r.

For a project to be acceptable on economic grounds, the NPV should be positive. This assumes
that all costs and all benefits are taken into account and given a monetary value. A positive
NPV means that the option produces net economic benefits, assessed in terms of present values.
Where there are mutually exclusive options between any two projects, the option with the
highest NPV is preferred. Any project that has a negative NPVs is economically undesirable
(James & Predo, 2015).

Benefit–Cost Ratio (BCR)

This is the ratio of the present value of benefits to the present value of costs. The ratio
determines the return per every unit of investment made. The formula for calculating the BCR
is:
 T
 Bt ⁄(1 + r)t−t0
 BCR = ∑
 Ct ⁄(1 + r)t−t0
 t=t0

UNU – Fisheries Training Programme 10
Wambua

If the BCR of a project exceeds 1, the present value of benefits is greater than the present value
of costs; thus, the project is acceptable in terms of economic efficiency. If the BCR is less than
1, the project is not economically viable. This is the case if and only if the NPV is positive.
Where there are options and choices to be made, the BCR should not be used to rank mutually
exclusive options, however, as it can lead to rankings that are inconsistent with those obtained
using NPV as the ranking criterion.

Internal Rate of Return (IRR)

The IRR is the rate of discount that equates the present value of benefits with the present value
of costs. IRR appears as the ‘unknown’ i in the following equation:
 T
 (Bt − Ct )
 ∑ =0
 (1 + )t
 t=t0
This equation has no closed-form solution for the value of i and can only be solved using
numerical methods.

The IRR is typically used to compare the internal financial productivity of a project with the
official interest rate or cost of funds, to see whether the project is desirable as a financial
investment. The IRR should not be used to rank mutually exclusive options, as it can also result
in a ranking that is inconsistent with a ranking based on NPV.

A distinction is sometimes drawn between an economic IRR and financial IRR. The difference
is that for an economic IRR, all values for benefits and costs comprise economic rather than
financial values (James & Predo, 2015).

Sensitivity Analysis

The economic desirability of any particular project depends on particular choice of values,
which are often estimated for the various categories of benefits and costs, as well as the discount
rate that is adopted. In reality, most of these values are subject to uncertainty. Risk and
uncertainty are features of most business and government activities and need to be understood
to ensure rational investment decisions (Pickering & Johnston, 2003).

A sensitivity analysis is applied to assess the uncertainty that surrounds these assumptions
relating to prediction of variables and their values in the future.

3.2 Data Collection

This study was done based on data and information on aquaculture management and production
from the Meru Fisheries Office and the National Aquaculture Secretariat in Nairobi. These data
sources include; implementation guidelines for the FFEPP, monthly and annual productions of
the project ponds from 2009 to end of 2015, government expenditure records on the project in
Meru region, results from on-farm pond surveys and experiments, recurrent farm expenditure
estimates for Meru farmers, guidelines for aquaculture practises in Kenya and aquaculture
production characteristics in Meru region, and other relevant data available from these offices.
Additional information was obtained from reports and records in the Meru County agricultural
offices.

UNU – Fisheries Training Programme 11
Wambua

3.2.1 Components of the FFEPP

During the implementation of the project, extension officers identified farmers that were in
areas that met the requirements for suitable aquaculture siting. This selection depended on the
suitability of the farm sites and the willingness of the beneficiaries to adopt the new enterprise
and demonstrate commitment to run it as a small-scale business after the government withdraws
its support. The government paid all the costs for pond construction, the provision of tilapia
fingerlings, fish feeds for one production cycle and the cost of training on the aspects of fish
farming, fish marketing and basic business practises. The project was implemented in four
phases, each lasting one financial year. During the third phase, the government provided high-
density polyethylene (HDPE) and polyvinyl chloride (PVC) pond liners for areas that had
pervious soils. These FFEPP support to farmers are listed in Table 1 below.

Table 1: FFEPP Support to Benefitting Farmers
 PHASE ONE 2008/2009
 Support Unit Cost Units Total (KSh)

 Casual Labour 250 100 25,000.00
 Fingerlings 10 1,000 10,000.00
 Feeds (kg) 200 24,000.00
 Total 59,000.00
 PHASE TWO 2009/2010
 Support Unit Cost Units Total (KSh)

 Casual Labour 250 100 25,000.00
 Fingerlings 7 1,000 7,000.00
 Feeds (kg) 200 24,000.00
 Total 56,000.00
 PHASE THREE 2010/2011
 Support Unit Cost Units Total (KSh)

 Pond Liner 1 105,000 105,000.00
 Casual Labour 250 100 25,000.00
 Fingerlings 7 1,000 7,000.00
 Feeds (kg) 200 27,958.00
 Total 164,958.00
 PHASE FOUR 2011/2012
 Support Unit Cost Units Total (KSh)

 Casual Labour 250 100 25,000.00
 Fingerlings 7 1,000 7,000.00
 Feeds (kg) 200 27,958.00
 Total 59,958.00
 Source: FFEPP Implementation guidelines

Table 2 shows the distribution of costs for the pond construction, stocking and training expenses
in the different phases of the project. These are the cost that this CBA assumes were incurred
by the Government of Kenya.

UNU – Fisheries Training Programme 12
Wambua

Table 2: Government of Kenya FFEPP Expenditure
 Year Cost Item Cost/ Ponds/ Cost/ Constituency Ponds/Region Region Year
 Pond Constituency Sub-Total Total
 (KSh) (KSh) (KSh) (KSh)
 2008/2009 Ponds Construction and Supplies 59,000 200 1,800,000 1,400 82,600,000
 Farmer Training 150,000 1,050,000 83,650,000

 2009/2010 Pond Construction and Supplies 56,000 100 5,600,000 700 39,200,000
 Farmer Training 150,000 1,050,000 40,250,000

 2010/2011 Pond Construction and Supplies 164,958 20 3,299,160 140 23,094,120
 Farmer Training 55,620 389,340 23,483,460

 2011/2012 Pond Construction and Supplies 59,958 5 299,790 35 2,098,530
 Farmer Training 55,620 389,340 2,487,870

 TOTAL 149,871,330
 FFEPP Ponds 146,992,650
 Training 2,878,680
Source: FFEPP Implementation guidelines for each corresponding year

UNU – Fisheries Training Programme 13
Wambua

Total government expenditure on the project in the four years is KSh 149.8 million: KSh 146.9
million as the cost of pond construction and supplies for production while KSh 2.8 million the
cost of farmer training.

All the FFEPP ponds were constructed to a standard size of 300 m2. They were supplied with
equal amounts of production supplies as indicated in Table 1. The benefiting farmers organized
into cluster groups near their localities. Each cluster comprised of 15-100 farmers. The clusters
are used for capacity building, sharing experiences on fish farming, sharing of equipment like
nets, making on-farm fish feeds and in some cases marketing of the harvest.

The fisheries office, through its extension staff, offers support to ensure that all the farmers
follow similar if not better aquaculture production practises throughout the region.

3.2.2 Production Characteristics of FFEPP Ponds and Basic Assumptions

Table 3 below summarises the production characteristics of the FFEPP ponds.

 Table 3: Production characteristics of the FFEPP ponds
 Parameter Characteristic

 Stocking size of tilapia 2g-3g
 Stocking rate of tilapia 3/m2
 Stocking rate of catfish 10% of tilapia
 FCR 1.5 - 2.0
 Minimum feeds required per cycle 200 kg
 Crude protein content in feeds 26%-28%
 Fertilization/ manure rate 50 g/m2/ week
 Liming rate 20 kg/100 m2/cycle
 Survival rate per production cycle ~80%
 Minimum average production 0.6 kg/m2
 Harvest weight tilapia 350 g
 Harvest weight catfish 500 g
 Market prices/ kg KSh 350
 Consumption per capita household 24 kg/annum
 Dropout rate from program 1.16%
 Length of production cycle 9 months
 Lead time to market 1 months
 Pond treatment period (between cycles) 1 month
 Fallow period (refill and restock) 1 month

The stocking rate of tilapia applied in Meru is 3/m2, each pond is stocked with 1000 fingerlings.
The extra 100 are usually expected to compensate for mortality during handling, transport and
stocking. The sizes of tilapia fry supplied by hatcheries is 2g-3g. Experiences from Meru
fisheries office are that farmers prefer stocking ponds with mono-sex tilapia. In the FFEPP
project, catfish are recommended for polyculture; where farmers have stocked mixed sex
tilapia. The recommended stocking rate of catfish to tilapia is 1/100 respectively. There is no
FFEPP farmer practicing catfish monoculture.

The survival rate is assumed to be approximately equal to 80% based on Opiyo et al. (2014)
who argue that Nile tilapia has a survival rate of up to 83% when fed daily.

UNU – Fisheries Training Programme 14
Wambua

The length of production cycle for most of the FFEPP ponds in Meru is 9 months. Besides that,
farmers set apart at most one month prior to the next production cycle to repair the pond dykes,
leaks and treat the ponds with lime. The liming rate used by farmers is 20 kg/100 m2/cycle.
Most fish farmers let their ponds lie idle (fallow) for some time during which period they refill
their ponds with water and source fingerlings for the next stocking. Fingerlings are often not
readily available since demand for fingerlings is higher than the hatcheries can supply. From
the author’s experience, it can take up to 1 month to refill ponds with water and restock them.
Farmers use naturally produced in-pond feeding and supplemental feeds. According to results
from on-farm pond experiments and farm surveys in Meru, 200 kg of formulated fish pellets
are required as supplemental feeds for every production cycle. This study assumed that 200 kg
is the required amount of supplemental feeds per production cycle.

An FCR of 1.5-2.0 is assumed based on the work of Githukia et al. (2015) who argue that Nile
tilapia (Oreochromis niloticus) grown in earthen ponds in Kenya can achieve FCRs of 1.5 for
mono-sex and 2.0 for mixed sex when fed on 28% crude protein supplemental feeds. Locally
available fish pellets are required to have a crude protein content of 26%-28% (Munguti et al.,
2014). Majority of the farmers use compost manure for natural pond fertilization since it is
readily available. The applicable fertilization rate with farm compost manure is 50 g/m2/week
or 15 kg per week for each pond.

The average production of the FFEPP ponds in Meru based on the annual production data for
2013 up to 2015 is 188.2 kg. This is a pond production of 0.63 kg/m2. According to the Meru
fisheries office annual periodic reports, the common harvest weights for fish from the FFEPP
ponds is 350 g and 500 g for tilapia and catfish respectively. The market prices of whole tilapia
fish in Meru region averages KSh 350/kg. The prices of catfish are however varied across the
region and often depend on haggling between buyers and sellers. These prices range between
KSh 300/kg to Ksh 400/kg. This study assumes the same price of KSh 350 for catfish and
tilapia.

The demand for fish in Meru is great but there are no developed marketing chains. In order to
sell their fish, farmers must either rely on brokers and middlemen or source markets for
themselves. The duration between having a ready harvest to finally delivering it to a prospective
buyer often takes 1 month.

According to the surveys on fish farmers by the Meru fisheries office, the per capita
consumption of fish for households in Meru is 24 kg/year.

The dropout rate of farmers in Meru is currently 1.16% of the existing farmers. This is based
on the actual drop out trends from 2014 to 2015 as presented in annual fisheries reports from
Meru. This study assumes that 2015 being the 7th year of implementation of the program,
farmers have had opportunity to gain sufficient information about the program and are able to
make sound decisions on whether to continue or not. This study adopts the same dropout rate
of 1.16% for future periods. A sensitivity analysis is nevertheless conducted to investigate the
effects of changes in the dropout rate of fish farmers on the NPV.

The costs of all labour needed by the farmer in one production cycle according to this study is
valued as KSh 6,000. Table 7 in the Appendix shows the estimation of these costs of labour for
pond treatment, routine maintenance, harvest of fish and the entire pond management. Actual
wage rates are used to calculate this cost.

UNU – Fisheries Training Programme 15
Wambua

Table 4 below summarizes the supplies for production required by a Meru fish farmer in the
course of one production cycle. These are based on the standard extension recommendations
given to farmers in Meru. Actual market prices of these items have been used in Table 4.

Table 8 in the Appendix shows the estimates of the FFEPP farmer operation costs and expected
returns per production cycle.

Table 4: Requirements of FFEPP Ponds per Production Cycle
 Item Unit Requirement Cost Value (KSh)
 Tilapia fingerlings number 900 10 9,000.00
 Catfish fingerlings number 100 10 1,000.00
 Fish feeds kg 200 120 24,000.00
 Manure kg 180 2 900.00
 Lime kg 60 50 300.00
 Water KSh/month 12 100 1,200.00

 Labour/ Maintenance KSh 24 250 6,000.00
 TOTAL 42,400.00

3.3 Framework for Analysis

This study examines the scenario of implementing the FFEPP project against the usual scenario
where the local communities of Meru region continue to use their land for alternative farm
activities. This CBA is premised on the following:
 • The lifespan of the project is assumed to be 15 years. This presumes that the 15-year
 period is long enough to highlight all of the consequences of changes in land use that
 promote aquaculture, including evidence that the project may yield significant benefits
 to local communities, improve their livelihoods and increase food security. During this
 time, local stakeholders and communities living in Meru County should have an
 opportunity to gain a clearer understanding of the aquaculture project. The 15-year
 period is also the estimated lifespan of the HDPE and PVC liner material used for the
 FFEPP ponds that require liners.
 • This study does also develop an alternate model with an infinite lifespan in which the
 project is assumed to continue after the initial 15 years but with periodic maintenance
 costs.
 • Kenya Shillings (KSh) have been used to monetize all values in the calculations.
 Adjustments are made for inflation and all amounts expressed in their latest value
 (2016).
 • The estimated total amount of funding that was invested in the project is KSh 149
 million.
 • A social discount rate averaged at 7% after adjustment for inflation is used to calculate
 the NPV of this project. This discount rate is equivalent to the real interest rate on
 Kenya’s sovereign debt. The rationale for applying this approach in discounting is that
 it would significantly correspond to the borrowing cost of the government that would,
 in most cases, be responsible for funding the project (Warusawitharana, 2014). By using
 the sovereign borrowing rate as the social discount rate enables one to match the
 projected cash inflows from the project to the cash outflows for the government
 responsible for financing it.

UNU – Fisheries Training Programme 16
Wambua

4 RESULTS

4.1 The referent groups

The two main referent groups are (1) the local farmers in Meru County and (2) the Government
of Kenya. These two groups were the main ones involved in implementing the project.

4.2 The portfolio of project options

There are two scenarios for this project. The base-scenario is where there is no intervention by
the Government other than the normal condition. In this case the assumption is that the locals
would put their land in to use by practising the most preferred and profitable agricultural activity
in the region which is cereals (maize) production. The value of this production is given in Table
9 in Appendix as KSh 5,115/annum for a land size equivalent to that taken up by a fish pond
which in this case is 400 m2 comprising of the pond area and the approximate area of the dykes.
This is the assumed opportunity cost of agricultural land for the second scenario.

The second is the FFEPP scenario in which the aquaculture project is implemented. Data is
available on the number of farmers recruited into the FFEPP project as well as the monthly and
annual harvest data from these farmers. The revenues from the project are assumed to be
generated by direct sales of the harvested fish at market prices.

4.3 Costs and benefits expected without the FFEPP

The assumption of this study is that locals would continue to enjoy the benefits that they derive
from agricultural activities such as cereal production, livestock production and other forms of
agricultural activities practised in the region. Based on this assumption, the value of their
production would remain lower if compared to the alternative returns from other enterprises
like fish farming. Further, throughout the next 15 years there would be no significant
improvement in the food security, poverty, employment and the status of the regional economy.

4.4 The costs and benefits of the FFEPP over its expected life

The project is anticipated to provide direct economic benefits to beneficiaries by improving
their livelihoods through creating a new source of income from revenues of harvests sold. It is
also expected to improve food security among the locals and in the region from the alternative
source of food offered by the fish from the ponds. Table 10 in the Appendix shows production
of fish from FFEPP.

Indirect economic benefits to the locals are expected through creation of new job opportunities
in the aquaculture enterprises, hatchery production, and trade of fish as well as value addition
activities along the value chain.

Furthermore, the FFEPP scenario is expected to enhance social cohesion among the Meru
region beneficiaries, encouraging farmers to work together. This is supposed to happen through
the clusters formed for training and ease of extension service delivery during the FFEPP
implementation and through the Aquaculture Association of Farmers in Kenya (AAK) that links
fish farmers together and offers them a platform to share their experiences.

UNU – Fisheries Training Programme 17
Wambua

Indirect benefits are also expected through integrating the aquaculture enterprises with other
on-farm practises. These benefits include improved drainage of once swampy areas,
opportunity for cultivation of crops on the outer walls of the pond dykes, use of the pond water
as a reservoir for irrigation of crops, and such other benefits that would increase the farms
production.

Benefits to the Government are expected as the project spurs the Meru region’s economy
through the revenues and trade of the harvested fish. This production of fish in large scale is
expected to create and attract new enterprises handling processing of fish for onwards
marketing. Support enterprises such as aqua-shops and businesses supplying aquaculture
production inputs such as fish feeds, nets, cooler boxes and various water quality equipment
are expected to start and thrive as well.

Some of these benefits are already evident by the increase in harvest and activities of the FFEPP.
The government has financed the construction of a fish processing factory in Kanyakine area
of Meru. This cold chain fish processing factory is capable of handling 15 tonnes of fish weekly
and is expected to start operations in 2016. The factory is managed by the Meru County
Development Corporation. As part of support to the aquaculture enterprises, the Meru County
Government in 2015 launched a new program to promote fish farming in the region. This was
implemented through the ongoing establishment of two hatcheries, the establishment of a model
trout farm for the region, the acquisition of a cold storage truck to serve the fish processing
factory and acquisition of cooler boxes and deep freezers to aid in transport, handling and
storage of harvested fish. Furthermore, the County has also purchased fish feed mills and
pelletizers for farmer cluster groups.

The increase in fish farming has attracted private investors to the region. There is an increase
in the number of fish feed processors operating in the region. New private hatcheries have been
established. A large scale private fish processing factory; the Mt. Kenya Fish Factory was
established in 2015 in the adjacent Tharaka County. This factory targets to process the fish
being harvested from Tharaka County, Meru County and the greater Mount Kenya Region.
These developments are ultimately expected to elevate the quality of life of the local community
and spur regional economic growth.

The private sector has followed the initiative of the government and now there are examples
where the whole value chain is produced by the private sector, from the private hatcheries to
private fish farms down to private processors and end users, such as hotels and residents. This
confidence from the private sector is a great sign that the benefits of this projects can be greater
than the cost and that aquaculture can potentially provide a viable path for future prosperity.
The beneficiaries are expected to incur the opportunity cost of agricultural land required to
construct the ponds on their farms and the new costs to operate and manage the fish enterprises.
These include all operational costs after the first production cycle and any other costs needed
to revamp the ponds in the long run.

The government met all the initial costs of establishing the fish farms and is not expected to
incur any additional costs on the project.

4.5 Monetization of the outputs and impacts of the project

In this study, real market prices are used to derive the monetary values used in the calculations.

UNU – Fisheries Training Programme 18
Wambua

Increase in income for the region and the beneficiaries have been monetized from the values of
the streams of revenues that arise from the sales of harvested fish. Improvement of livelihoods
of the fish farmers is monetized from the value of the annual average consumption of
households in Meru.

The costs of government expenditure and farmer operations are based on their actual market
values.

The cost of farm labour is calculated using the actual costs of labour in Meru. The opportunity
cost of using the agricultural land is taken to be equivalent to the net income of cereal production
in Meru region. Maize production is the most preferred alternative land use in the region.

Due to lack of available data, this study has not valued the indirect costs and benefits of the
entire program such as new businesses related to the fish farming boom. It also does not evaluate
the entire value chain of the fish from the project.

4.6 The NPV, BCR and IRR of the project

The projects’ NPV, BCR and IRR are calculated using the standard formulas. The present value
of the net benefits (NPV) of the FFEPP project expected in its 15-year lifespan is KSh 59
million, the Benefits to Cost Ratio (BCR) is 1.05 while the Internal Rate of Return is 10%.
Table 5 summarizes the results. The payback period of the project is 11 years, occurring in 2019
as shown in Table 11 in the Appendix.

If the project is left to continue to infinity, assuming that all factors remain constant and that
there would be periodic costs every 15 years to revamp the remaining ponds, the project would
reach a terminal NPV of KSh 197.9 million with a terminal IRR of 13.2%. Table 12, 13 and
Figure 11 in the Appendix show the predicted values of the FFEPP benefits past the initial 15
years.

Figure 9 and Table 11 in the Appendix show the flow of accumulated costs and accumulated
benefits for the 15-year period.

UNU – Fisheries Training Programme 19
Wambua
Table 5: NPV of the FFEPP Project
YEAR NPV 2008 2009 2010 2011 2012 2013 2014 2015 2016 2017 2018 2019 2020 2021 2022 2023
Time 0 1 2 3 4 5 6 7 8 9 10 11 12 13 14 15
HARVEST (kg) 205,155 326,587 358,291 373,932 385,511 391,613 388,574 379,223 374,894 370,566 366,237 361,909 357,768 353,628 349,487

CONSUMPTION 32,496 48,384 50,784 50,952 50,208 49,512 48,936 48,360 47,808 47,256 46,704 46,152 45,624 45,096 44,568
(kg)
SALES INCOME 172,659 278,203 307,507 322,980 335,303 342,101 339,638 330,863 327,086 323,310 319,533 315,757 312,144 308,532 304,919
(kg)
BENEFITS

CONSUMPTION 19,476,654 27,894,344 25,677,944 23,554,524 21,953,672 20,258,806 17,127,600 16,926,000 16,732,800 16,539,600 16,346,400 16,153,200 15,968,400 15,783,600 15,598,800
(KSh)
SALES REVENUE 103,484,111 160,389,594 155,484,946 149,309,943 146,612,731 139,977,337 118,873,300 115,802,050 114,480,240 113,158,430 111,836,620 110,514,810 109,250,470 107,986,130 106,721,790
(KSh)
COSTS
GOK COST 156,470,906 68,925,876 38,681,955 3,594,123
(KSh)
FARMER COSTS 110,170,623 157,785,683 145,248,513 133,237,287 124,181,989 114,594,903 96,883,085 95,742,725 94,649,880 93,557,035 92,464,190 91,371,345 90,326,015 89,280,685 88,235,355
(KSh)

TOTAL BENEFITS 122,960,766 188,283,937 181,162,890 172,864,467 168,566,403 160,236,144 136,000,900 132,728,050 131,213,040 129,698,030 128,183,020 126,668,010 125,218,870 123,769,730 122,339,590
(KSh)
TOTAL COST 156,470,906 179,096,499 196,467,639 148,842,636 133,237,287 124,181,989 114,594,903 96,883,085 95,742,725 94,649,880 93,557,035 92,464,190 91,371,345 90,326,015 89,280,685 88,235,355
(KSh)
NET BENEFITS - 156,470,906 - 56,135,733 - 8,183,701 32,320,254 39,627,180 44,384,413 45,641,241 39,117,815 36,985,325 36,563,160 36,140,995 35,718,830 35,296,665 34,892,855 34,489,045 34,104,235
(KSh)

PV TOTAL 1,346,779,480 114,916,604 164,454,483 147,882,883 131,877,474 120,185,515 106,772,108 84,694,525 77,248,934 71,371,200 65,931,902 60,898,829 56,242,111 51,961,379 48,000,035 44,341,497
BENEFITS (KSh)
PV TOTAL COSTS 1,287,184,975 156,470,906 167,379,906 171,602,444 121,499,928 101,646,089 88,540,042 76,359,423 60,333,916 55,723,138 51,483,263 47,559,653 43,929,071 40,569,970 37,482,085 34,624,589 31,980,553
(KSh)

PV NET BENEFITS - 156,470,906 - 52,463,302 - 7,147,962 26,382,955 30,231,386 31,645,473 30,412,686 24,360,609 21,525,796 19,887,936 18,372,249 16,969,759 15,672,141 14,479,294 13,375,446 12,360,944
(KSH)

NPV (KSH) 59,594,505
BCR 1.05
IRR 10%

UNU – Fisheries Training Programme 20
Wambua

4.7 Sensitivity Analysis

A sensitivity analysis is carried out in relation to the discount rate, cost of fish feeds, market
price of fish, average pond production, cost of fingerlings and annual drop-out rate of farmer.
In all the cases, the allowable margin of error or fluctuation, that is, changes in parameter’s
value beyond which the NPV becomes negative, were examined.

4.7.1 Effects of changes in the pond production on the NPV

Figure 3 below shows the effects of changes in the pond production on the NPV. The NPV
increases with increase in the average pond production and decreases with the same. NPV is
directly proportional to the average pond production. NPV becomes zero at an average pond
production of 164.6 kg and subsequently becomes negative with further reduction. The point
marker on the graph indicates the current pond production and NPV.
 400
 300
 200
 NPV (million KSh)

 100
 0
 - 100 0 25 50 75 100 125 150 175 200 225 250 275 300 325

 - 200
 - 300
 - 400
 - 500
 Pond production (kg)

Figure 3: Effects of changes in the pond productivity on the NPV

4.7.2 Effects of changes in the dropout rate on the NPV

The NPV is inversely proportional to the dropout rate of the fish farmers (Figure 4). If the
dropout rate of farmers is increased to 46.2% NPV becomes zero and becomes negative if the
dropout rate is higher than that. The point marker on the graph indicates the current dropout
rate of 1.16%.
 80

 60
 NPV (million KSh)

 40

 20

 0
 0% 10% 20% 30% 40% 50% 60% 70% 80%
 - 20

 - 40
 Dropout Rate

Figure 4: Effects of changes in the dropout rate on the NPV

UNU – Fisheries Training Programme 21
Wambua

4.7.3 Effects of changes in the fingerling prices on the NPV

The NPV is inversely proportional to the fingerlings prices (Figure 5). A fingerling price of
KSh 13 produces a zero NPV. Subsequent increase of price produces a negative NPV. Point on
the graph indicates the current fingerling price of KSh 10.
 300
 250
 200
 NPV (million KSh)

 150
 100
 50
 0
 - 50 0 5 10 15 20 25
 - 100
 - 150
 - 200
 Fingerling price (KSh)

Figure 5: Effects of changes in fingerlings prices on the NPV

4.7.4 Effects of changes in the market price of fish on the NPV

The NPV is directly proportional to the market prices of fish. If the market price falls to KSh
334, the NPV becomes zero. Below that, the NPV becomes negative. Figure 6 below shows the
results of the effects of change in market prices of fish on the NPV. Point marker indicates
current price.

 250
 NPV (million KSh)

 150

 50

 - 50 250 270 290 310 330 350 370 390

 - 150

 - 250

 - 350
 Market price (KSh)

Figure 6: Effects of changes in market price on the NPV

4.7.5 Effects of changes in the discount rate on the NPV

The NPV is inversely proportional to the discount rate (Figure 7). If the discount rate increases
to 11%, the NPV becomes zero beyond that, any further increase in the discount rate produces
a negative NPV. The applied discount rate of 7% is indicated by the point marker.

UNU – Fisheries Training Programme 22
You can also read