COMPANY OVERVIEW United States' Largest Silver Producer - RESPONSIBLE. SAFE. INNOVATIVE.
←
→
Page content transcription
If your browser does not render page correctly, please read the page content below
COMPANY
OVERVIEW

United States’ Largest
Silver Producer

August 2021

                         RESPONSIBLE. SAFE. INNOVATIVE.

NYSE: HL
CAUTIONARY STATEMENTS

 Cautionary Statement Regarding Forward Looking Statements

 This presentation contains “forward-looking statements” within the meaning of Section 27A of the Securities Act of 1933, as amended, and Section 21E of the Securities Exchange Act of
 1934, as amended, which are intended to be covered by the safe harbor created by such sections and other applicable laws, including Canadian securities laws. When a forward-looking
 statement expresses or implies an expectation or belief as to future events or results, such expectation or belief is expressed in good faith and believed to have a reasonable basis.
 However, such statements are subject to risks, uncertainties and other factors, which could cause actual results to differ materially from future results expressed, projected or implied by
 the forward-looking statements. Forward-looking statements often address our expected future business and financial performance and financial condition and often contain words such as
 “anticipate,” “intend,” “plan,” “will,” “could,” “would,” “estimate,” “should,” “expect,” “believe,” “project,” “target,” “indicative,” “preliminary,” “potential” and similar expressions. Forward-looking
 statements in this presentation may include, without limitation: : (i) expected increase in Lucky Friday’s silver production to approximately 5 million ounces by 2023; (ii) new mining
 methods being tested at Lucky Friday to better manage seismicity and potentially increase productivity; (ii) Green Creek's estimated 2021 silver production of 9.5 - 10.2 million ounces is
 unchanged and gold production increased to 43 - 45 thousand ounces, estimate for 2021 cost of sales updated to $222 million, estimated cash cost and AISC, each per silver ounce
 updated to ($1.00)-$1.00 and $3.25-$4.00, respectively; (iii) Casa Berardi's estimated 2021 gold production is increased to 128 - 132 thousand ounces, estimate for 2021 cost of sales
 updated to $220 million, estimated cash cost and AISC, each per gold ounce updated to $1,000-$1,125 and $1,200-$1,325, respectively; (iv) Lucky Friday's estimated 2021 silver
 production of 3.4 - 3.8 million ounces is unchanged, estimate for 2021 cost of sales updated to $103 million, estimated cash cost and AISC, each per silver ounce updated to $7.60-$8.50
 and $14.25-$16.25, respectively; (v) business improvement activities at Casa Berardi are expected to reduce costs and increase cash flow over next two years; and (vi) Company-wide
 estimates of future production, sales, costs of sales, cash cost, after by-product credits, AISC, after by-product credits, as well as estimated spending on capital, exploration and pre-
 development for 2021.The material factors or assumptions used to develop such forward-looking statements or forward-looking information include that the prices assumed in the
 calculation of cash cost and AISC will occur and the Company’s plans for development and production will proceed as expected and will not require revision as a result of risks or
 uncertainties, whether known, unknown or unanticipated, to which the Company’s operations are subject.
 .
 Estimates or expectations of future events or results are based upon certain assumptions, which may prove to be incorrect, which could cause actual results to differ from forward-looking
 statements. Such assumptions, include, but are not limited to: (i) there being no significant change to current geotechnical, metallurgical, hydrological and other physical conditions; (ii)
 permitting, development, operations and expansion of the Company’s projects being consistent with current expectations and mine plans; (iii) political/regulatory developments in any
 jurisdiction in which the Company operates being consistent with its current expectations; (iv) the exchange rate for the USD/CAD and USD/MXN, being approximately consistent with
 current levels; (v) certain price assumptions for gold, silver, lead and zinc; (vi) prices for key supplies being approximately consistent with current levels; (vii) the accuracy of our current
 mineral reserve and mineral resource estimates; (viii) the Company’s plans for development and production will proceed as expected and will not require revision as a result of risks or
 uncertainties, whether known, unknown or unanticipated; (ix) counterparties performing their obligations under hedging instruments and put option contracts; (x) sufficient workforce is
 available and trained to perform assigned tasks; (xi) weather patterns and rain/snowfall within normal seasonal ranges so as not to impact operations; (xii) relations with interested parties,
 including Native Americans, remain productive; (xiii) economic terms can be reached with third-party mill operators who have capacity to process our ore; (xiv) maintaining availability of
 water rights; (xv) factors do not arise that reduce available cash balances; and (xvi) there being no material increases in our current requirements to post or maintain reclamation and
 performance bonds or collateral related thereto.

NYSE: HL                                                                                                                                                                   RESPONSIBLE. SAFE. INNOVATIVE. l 2
CAUTIONARY STATEMENTS (cont’d)
Cautionary Statement Regarding Forward Looking Statements (Cont’d)
In addition, material risks that could cause actual results to differ from forward-looking statements include, but are not limited to: (i) gold, silver and other metals price volatility; (ii) operating
risks; (iii) currency fluctuations; (iv) increased production costs and variances in ore grade or recovery rates from those assumed in mining plans; (v) community relations; (vi) conflict
resolution and outcome of projects or oppositions; (vii) litigation, political, regulatory, labor and environmental risks; (viii) exploration risks and results, including that mineral resources are not
mineral reserves, they do not have demonstrated economic viability and there is no certainty that they can be upgraded to mineral reserves through continued exploration; (ix) the failure of
counterparties to perform their obligations under hedging instruments; (x) we take a material impairment charge on our Nevada operations; (xi) we are unable to remain in compliance with
all terms of the credit agreement in order to maintain continued access to the revolver, and (xii) we are unable to refinance the maturing senior notes. For a more detailed discussion of such
risks and other factors, see the Company’s 2020 Form 10-K, filed on February 18, 2021, with the Securities and Exchange Commission (SEC), as well as the Company’s other SEC filings.
The Company does not undertake any obligation to release publicly revisions to any “forward-looking statement,” including, without limitation, outlook, to reflect events or circumstances after
the date of this news release or to reflect the occurrence of unanticipated events, except as may be required under applicable securities laws. Investors should not assume that any lack of
update to a previously issued “forward-looking statement” constitutes a reaffirmation of that statement. Continued reliance on “forward-looking statements” is at investors’ own risk.

Cautionary Note Regarding Estimates of Measured, Indicated and Inferred Resources
The disclosures herein regarding mineral reserves and resources are as of December 31, 2020. For disclosures prior to January 1, 2021, the SEC permits mining companies, in their filings with the
SEC, to disclose only those mineral deposits that a company can economically and legally extract or produce. We use certain terms in this presentation, such as “resource,” “measured resources,”
“indicated resources,” and “inferred resources” that are recognized by Canadian regulations, but that prior to January 1, 2021, SEC guidelines generally prohibited U.S. registered companies from
including in their filings with the SEC. U.S. investors are urged to consider closely the disclosure in our most recent Form 10-K and Form 10-Q. You can review and obtain copies of these filings from
the SEC’s website at www.sec.gov.

Qualified Person (QP) Pursuant to Canadian National Instrument 43-101
Kurt D. Allen, MSc., CPG, Vice President - Exploration of Hecla Mining Company and Keith Blair, MSc., CPG, Chief Geologist of Hecla Limited, who serve as a Qualified Person under National
Instrument 43-101("NI 43-101"), supervised the preparation of the scientific and technical information concerning Hecla’s mineral projects. Information regarding data verification, surveys and
investigations, quality assurance program and quality control measures and a summary of analytical or testing procedures for the Greens Creek Mine are contained in a technical report titled
“Technical Report for the Greens Creek Mine” effective date December 31, 2018, and for the Lucky Friday Mine are contained in a technical report titled “Technical Report for the Lucky Friday Mine
Shoshone County, Idaho, USA” effective date April 2, 2014, for Casa Berardi are contained in a technical report titled "Technical Report on the mineral resource and mineral reserve estimate for Casa
Berardi Mine, Northwestern Quebec, Canada" effective date December 31, 2018 (the "Casa Berardi Technical Report"), and for the San Sebastian Mine, Mexico, are contained in a technical report
prepared for Hecla titled “Technical Report for the San Sebastian Ag-Au Property, Durango, Mexico” effective date September 8, 2015 . Also included in these four technical reports is a description of
the key assumptions, parameters and methods used to estimate mineral reserves and resources and a general discussion of the extent to which the estimates may be affected by any known
environmental, permitting, legal, title, taxation, socio-political, marketing, or other relevant factors. Information regarding data verification, surveys and investigations, quality assurance program and
quality control measures and a summary of sample, analytical or testing procedures for the Fire Creek Mine are contained in a technical report prepared for Klondex Mines, dated March 31, 2018; the
Hollister Mine dated May 31, 2017, amended August 9, 2017; and the Midas Mine dated August 31, 2014, amended April 2, 2015. Copies of these technical reports are available under Hecla's and
Klondex's profiles on SEDAR at www.sedar.com. Mr. Allen and Mr. Blair reviewed and verified information regarding drill sampling, data verification of all digitally collected data, drill surveys and
specific gravity determinations relating to all the mines. The review encompassed quality assurance programs and quality control measures including analytical or testing practice, chain-of-custody
procedures, sample storage procedures and included independent sample collection and analysis. This review found the information and procedures meet industry standards and are adequate for
Mineral Resource and Mineral Reserve estimation and mine planning purposes.

Mr. Allen and Mr. Blair reviewed and verified information regarding drill sampling, data verification of all digitally-collected data, drill surveys and specific gravity determinations relating to the Casa
Berardi Mine. The review encompassed quality assurance programs and quality control measures including analytical or testing practice, chain-of-custody procedures, sample storage procedures and
included independent sample collection and analysis. This review found the information and procedures meet industry standards and are adequate for Mineral Resource and Mineral Reserve
estimation and mine planning purposes.

Cautionary Note Regarding Non-GAAP measures
Cash cost per ounce of silver and gold, net of by-product credits, EBITDA, adjusted EBITDA, AISC, after by-product credits, and free cash flow represent non-U.S. Generally Accepted Accounting
Principles (GAAP) measurements. A reconciliation of these non-GAAP measures to the most comparable GAAP measurements can be found in the Appendix.

NYSE: HL                                                                                                                                                                    RESPONSIBLE. SAFE. INNOVATIVE. l 3
Hecla: Unique Precious Metals Miner

NYSE: HL                                    RESPONSIBLE. SAFE. INNOVATIVE. l 4
WHY INVEST IN HECLA?
Hecla is unique to other silver miners, ETFs and physical silver
Primarily U.S. based operations – the right jurisdiction
for risk and ESG
Two of the largest and highest-grade silver mines in
the world
Silver dominates reserves and cash flow
Long-lived mines with decades ahead of us
Silver production is growing
Consistent dividend payments and only dividend
linked to silver price
Brand value – 130 years and over 50 years on NYSE
NYSE: HL RESPONSIBLE. SAFE. INNOVATIVE. l 5
ESG: SMALL FOOTPRINT, LARGE BENEFIT
Environment, Community and Safety are three pillars of our ESG program

        Small Environment
                                                                                            Large Community Benefit                                   Safety
            Footprint

• Global footprint less than 3,900 acres but                                             • Typically, largest employer and taxpayer   • Well-established safety culture reflected
  supports 2,300 families                                                                  in areas we operate                          by Casa Berardi being awarded the
• Very low energy use and greenhouse gas                                                                                                John T. Ryan Safety Award** for the
  emissions with low tonnage but high-grade                                              • Community support with multiple
  underground operations                                                                   programs and Hecla Charitable                lowest reportable injury frequency rate
• Produced over 473 silver equivalent ounces                                               Foundation                                   in the Quebec/Maritime region
  per ton of GHG emission compared to our                                                • Alaska Chamber’s Large Business of         • Safe and efficient management of
  peers* who produce 200 silver equivalent                                                 the Year                                     COVID-19 with safety protocols across
  ounces per ton of GHG emissions                                                                                                       all operations and offices.
• Low water use – use less water per ounce                                                                                            • Safety of our people is foundational
  produced (63 gallons) than an average
  person/day (100 gallons)                                                                                                              to running our business
• Key achievement focus is the Troy tailings
  reclamation (300 acres)

  Hecla is mining metals for a renewable energy future
  •   Silver and copper are the essential metals for a renewable energy future
  •   The U.S. imports 60% of silver and 30% of copper needs
  •   Hecla produces 40% of U.S. silver and is the largest U.S. silver producer
  •   Our Montana assets, which are the third largest undeveloped copper deposit in the world, host >2.5 billion pounds of copper and >300
      million ounces of silver in resources

            * Peers for comparison include Coeur Mining, Pan American Silver, First Majestic Silver and Newmont
NYSE: HL    ** John T. Ryan award is a CIM (Canadian Institute of Mining, Metallurgy, and Petroleum) award.                                       RESPONSIBLE. SAFE. INNOVATIVE. l 6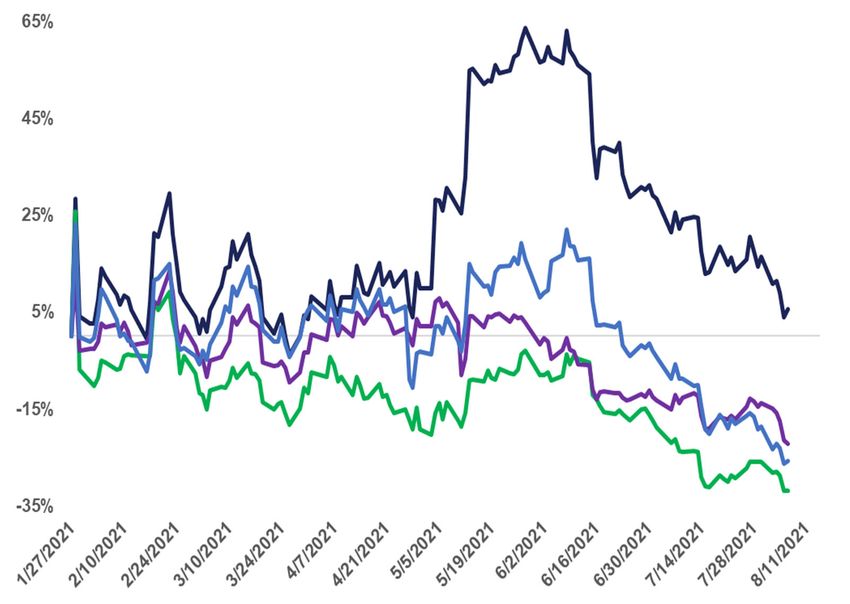
HECLA MINES >40% OF ALL SILVER PRODUCED IN THE USA
Half of the world’s production is from Mexico, Peru and China; U.S. production is scarce

                  2020 U.S. Silver Production                                                   Hecla’s Share of U.S. Production
                             (Moz)

    13.5                                                                                                               43%

                                                                                                        57%

                                                                                                              Hecla    Other

                        6.5                                                             3 Countries. Produce ~50% of World Production
                                                                                                       U.S. Produces 4%

                                                    3.2
                                                            2.2                                                       22%
                                                                           0.9                         48%
                                                                                                                       13%
    Hecla               Teck                     Coeur    Rio Tinto   Americas Gold &
                                                                          Silver                                    13%

                                                                                                               4%
                                                                                              Mexico   Peru     China        USA     ROW
            Source: Silver Institute; Company Reports

NYSE: HL                                                                                                               RESPONSIBLE. SAFE. INNOVATIVE. l 7
HIGH-GRADE SILVER MINES OF SIZE ARE SCARCE
Hecla’s world’s second and seventh largest silver mines have the highest silver equivalent grade
400   AgEq*                                                                                                                                  AgEq Grade      40
      (Moz)                                                                                                                                     (opt)
350                                                                                                                                                          35

300                                                                                                                                                          30

250                                                                                                                                                          25

200                                                                                                                                                          20

150                                                                                                                                                          15

100                                                                                                                                                          10

50                                                                                                                                                           5

 0                                                                                                                                                           0
      Cannington       Greens Creek     Fresnillo           Saucito     Rochester      Ying       Lucky Friday   La Colorada    San Julian     Uchucchacua

           Fresnillo      Hecla       South32       Coeur       Pan American    Compañía de Minas Buenaventura     Silvercorp Metals      Ag (opt)

              *AgEq based on equivalency factors of 82 Au, 6 Cu, 20 Pb, 17 Zn
NYSE: HL      Source: S&P Global Market Intelligence                                                                                   RESPONSIBLE. SAFE. INNOVATIVE. l 8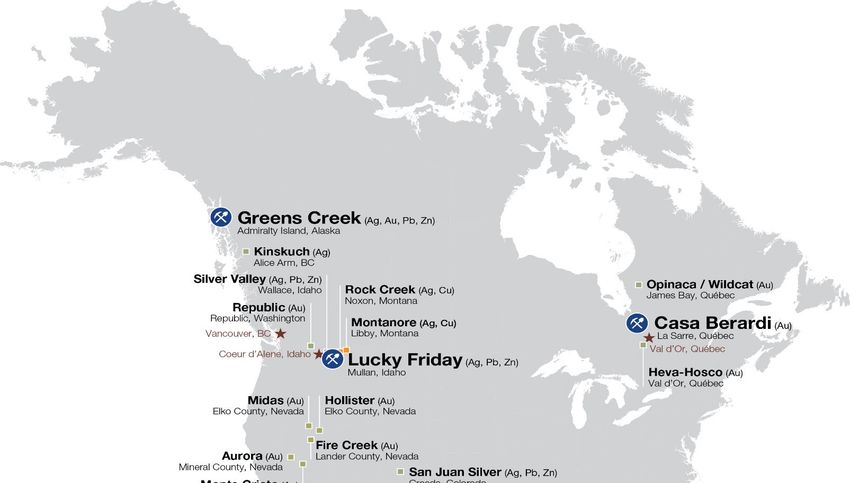
HECLA IS INCREASING SILVER PRODUCTION
Lucky Friday production tripled over last year, expected to be 75% more in 2021 and 5 million
ounces by 2023, 2.5 times 2020 production

                                                                                    30 Vein - *AgEq Grade (opt)
             20 Years
             Past Mining
                                                                                                   < 10
                                                                                                   10 - 20
                                                                 Almost                            20 - 30
                  6500 Level                                                                       30 - 35
                                                                 1000 feet
                                                                                                   > 35
                                                                 @ +35
                                                                                               Oct. 12, 2020
                                                                 AgEq
                                                                                      *Ag Equivalent Values Based on
                       7500 Level                                                     metal prices of $16.50/oz
                                                                                      Ag, $0.85/lb Pb, and $1.00/lb Zn
                                                                                      ** Cutoff grade 11 AgEq
                                                                                      *** 2020 average grade 25 AgEq

                                     #4 Shaft             1000 Feet
                                                          Looking North
 NYSE: HL                                                                          RESPONSIBLE. SAFE. INNOVATIVE. l 9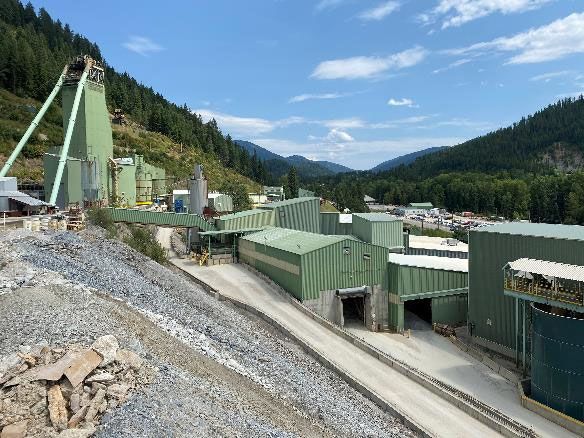
LEADING DIVIDEND POLICY IS IMPROVED FURTHER
More cash returned to shareholders as dividend yield increases synchronously with silver prices

                      At $25/oz realized price, an implied dividend yield of 7.4% of silver price
 $9.0                                                                                                                                                                                                        17.5%           20.00%
 $8.0                                                                                                                                                                        15.4%                                           18.00%
 $7.0                                                                                                                                                                                                                        16.00%
                                                                                                                                       12.6%                                                                                 14.00%
 $6.0
                                                                                                                                                                                                                             12.00%
 $5.0                                                                                             9.0%
                                                            7.4%                                                                                                                                                             10.00%
 $4.0
                                                                                                                                                                                                                             8.00%
 $3.0                                                                                                                                                                                                                        6.00%
 $2.0                                                                                                                                                                                                                        4.00%
 $1.0                                                                                                                                                                                                                        2.00%
                                                            $2.0                                  $2.9                                  $4.7                                  $6.5                           $8.3
 $0.0                 $0.7                                                                                                                                                                                                   0.00%
REDDIT SILVER SQUEEZE DEMONSTRATED BRAND VALUE
Highest performer with a small short position and continued outperformance
Share Price Performance on February 1st & Share Price Performance January 29th – August 10th
Shares Short as a % of Total Float*
30% 28% 25.0%
26%
25% 23%
21.8% 20.0%
20%
15.0%
15%
Hecla: +6%
12%
10.0%
10%
2.8% 5.0% Pan American
5% 2.1% 2.0% Silver: -22%
Coeur: -26%
First Majestic
0% 0.0% Silver: -32%
Hecla First Coeur Pan
Majestic American
Silver
*Source: Bloomberg, Share price performance shown as February 1st close over January 29th close
NYSE: HL RESPONSIBLE. SAFE. INNOVATIVE. l 11A VERY SHORT HISTORY OF SILVER DEMAND
Despite declining photography demand, silver industrial and investment demand has been in a
secular bull market since 2000 and is stronger in 2021 and the future
Five distinct periods of silver demand, three that are strengthening
• Monetary by governments (2000 BC to 1800 AD)
• Photographic (1900 to 1999)
• Industrial (1940 - )
• Investment (2000 - )
• Energy (2010 - )
20 YEAR CHANGE IN DEMAND
Million Ounces
1999 2019 % Increase If the decrease in
Industrial 343 511 49% photographic demand is
removed, silver demand
Photography 246 34 -86% increases 441 million
Jewelery/Silverware 260 260 0% ounces or 61%
Investment 26 268 931%
Total 875 1073 23%
Source – World Silver Survey 2020
NYSE: HL RESPONSIBLE. SAFE. INNOVATIVE. l 12SILVER – WIDENING GAP BETWEEN SUPPLY & DEMAND
Gap expected to increase with continued trend of industrial demand growth of 2.0%
• 2019 saw a total supply of 1,023 Moz and total demand of 1,074 Moz
• Silver’s total demand in 2030 is expected to reach ~1,147 Moz if demand stays on the last
decade trend and no increase in silver’s investment demand
• Supply needs to grow by ~70 Moz per year to meet the on trend additional demand
expected in 2030
Silver Supply & Demand: 2019 and 2030E 1,147
Million Ounces
Supply shortfall of 50 Moz in
2019 was filled by above 1,074
ground stocks
1,023
Total Supply Total Demand Demand Expected, Based on 10 Year Growth
2019 2019 Rate
2030F*
* Demand assumptions: CAGR for industrial demand over the past 10 years has been 2.0%. Assume no increase or decrease in investment, jewelry or silverware demand.
NYSE: HL RESPONSIBLE. SAFE. INNOVATIVE. l 13Financial NYSE: HL RESPONSIBLE. SAFE. INNOVATIVE. l 14
NEAR-RECORD SECOND QUARTER: 2nd BEST ON MULTIPLE METRICS
Strong prices, production and cost management led to performance; guidance improved

           Near-Record          • Second highest Sales of $218.0 million, Gross Profit of $59.3 million,
                                  Adjusted EBITDA(1) of $84.0 million, Cash Flow from Operations of $86.3
               Quarter            million (highest in 5 years)

   Silver Revenue &             • Record Realized Silver Margin(2) of $19.60 per ounce with silver contributing
   Margin Expansion               40% of quarterly revenues.

              Guidance          • Lowering consolidated silver cash cost(3) and all-in sustaining silver
           Improvement            cash cost(4) guidance to a midpoint of $1.50 and $10 per ounce, respectively

                                • Strong balance sheet, $181 million in cash, > $400 million in liquidity; $54.4
  Financial Strength              million of quarterly free cash flow(5)

                                • 16% of YTD 2021 free cash flow(5) returned to stockholders as dividends.
    Leading Dividend            • 39 consecutive quarters of dividend payments (Paid $72 million in common
               Policy             dividends since 2011, 6% of our cash flow from operations)

                                • Greens Creek recognized as Large Business of the Year in Alaska,
                                  Efficient and safe COVID-19 management with company-wide vaccination
   ESG Commitment                 rates higher than the U.S. average, Published our 2020 sustainability report
                                  “Small Footprint, Large Benefit”

NYSE: HL                                                                               RESPONSIBLE. SAFE. INNOVATIVE. l 15
FINANCIAL STRENGTH AND FLEXIBILITY
More than doubled last year’s cash balance through solid free cash flow generation, leverage at 1.2x
Cash Balance Net Debt/Adjusted EBITDA(6)
Available liquidity of $411.5 million(*) Fourth quarter of meeting target of ≤ 2.0x
($ millions)
181.5
2.5x
139.8
129.8 2.0x
1.8x
98.7
1.4x
75.9 1.2
Q2 2020 Q3 2020 Q4 2020 Q1 2021 Q2 2021 Trailing 12 6/30/2020 9/30/2020 12/31/2020 3/31/2021 6/30/2021
months ending
Solid Silver Margins Free Cash Flow(5)
Record realized silver margin Generated $175 million in Free Cash Flow since Q2/2020
Cost of $73.1 $78.5 $86.0 $76.1 $83.4 Cash flow from
$37.5 $73.4 $64.9 $37.9 $86.3
Sales(7) Operations
54.4
$9.81 49.7
$9.11 $13.79
$18.45 $19.60
26.7 28.3
$15.35 16.5
$9.33 $11.53
$7.21 $7.54
Q2 2020 Q3 2020 Q4 2020 Q1 2021 Q2 2021 Q2 2020 Q3 2020 Q4 2020 Q1 2021 Q2 2021
(4) (2)
Silver AISC Realized Price Margin
* Liquidity of $411.5 million calculated as $250 million in available credit facility less $19.8 million in Letters of Credit plus $181.5 million in cash equivalents on June 30, 2021.
NYSE: HL RESPONSIBLE. SAFE. INNOVATIVE. l 16SILVER IS THE LARGEST REVENUE CONTRIBUTOR
Hecla produces >40% of U.S. silver, #1 silver and #3 lead and zinc producer in the U.S
Silver Production: 3.5 Moz
Cost of Sales(7): $83.9 M
13% Cash Cost, after by-product credits(3): $0.18/oz
AISC, after by-product credits(4): $7.54oz
Realized Price: $27.14/oz
10%
40% Gold Production: 59.1 Koz
Cost of Sales(7): $70.4 M
Q2 2021 Margins(2) Cash Cost, after by-product credits(3): $1,254/oz
Silver Margin: $19.60/oz AISC, after by-product credits(4): $1,419/oz
Gold Margin: $406/oz Realized Price: $1,825/oz
Lead Production: 11.5 Ktons
37% Realized Price: $1.04/lb
Zinc Production: 17.2 Ktons
Silver Gold Lead Zinc Realized Price: $1.35/lb
Greens Creek Casa Berardi Lucky Friday
12%
20%
100%
8% 29%
54% 59%
18%
100%
52% of Hecla Revenue 26% of Hecla Revenue 18% of Hecla Revenue
* As used herein, cost of sales refers to cost of sales and depreciation, depletion and amortization.
** Cash Cost after by-product credits, AISC after by-product credits and Margins are non-GAAP measures. Reconciliation to GAAP is provided in the appendix. Silver Margin for Q2 2021 is calculated as Realized
NYSE: HL .
Silver Price of $27.14/oz less AISC, after by-product credits of $7.54/oz. Gold Margin for Q2 2021 is calculated as Realized Gold Price of $1,825/oz less AISC, after by-product credits of $1,419/oz. RESPONSIBLE. SAFE. INNOVATIVE. l 17GENERATING SUBSTANTIAL MARGINS
Silver AISC expected to be lower in 2021 with Lucky Friday in full production
Silver Margins(2) Gold Margins(2)
4%
22%
39% 26% 27%
44%
72% 72%
54%
49%
Cost of Sales (000s)7 AISC, After By-Product Credits, per Ag-Au/Oz4
2021 2021
Q2 2020 Q3 2020 Q4 2020 Q1 2021 Q2 2021 Q2 2020 Q3 2020 Q4 2020 Q1 2021 Q2 2021
Outlook Outlook
Silver $73,137 $78,517 $85,967 $76,069 $83,390 $325,000 Silver $9.33 $11.53 $15.35 $7.21 $7.54 $9.00 - $11.00
Gold $59,139 $67,698 $56,159 $69,971 $75,333 $263,000 Gold $977 $1,855 $1,330 $1,284 $1,419 $1,250 - $1,350
*Cost of sales and AISC, after by-product credits, are non-GAAP measures, please refer to appendix for reconciliation to GAAP.
NYSE: HL RESPONSIBLE. SAFE. INNOVATIVE. l 18VERY LIQUID – VERY LONG-DATED DEBT
Liquidity, tenor and coverage have improved
Liquidity Position Long Dated Debt Net Debt/Adjusted EBITDA(6)
At 03/31/21
1
Revolver IQ Notes 7.25%Senior Notes 2.5x
Revolver $475
$250 2.0x
1.8x
Cash 1.4x
$181 1.2x
~$431 M
$250
$37
2021 2022 2023 2024 2025 2026 2027 2028 Q2 2020 Q3 2020 Q4 2020 Q1 2021 Q2 2021
*Net Debt/Adjusted EBITDA is a non-GAAP measure and reconciliation to GAAP is shown in the appendix.
NYSE: HL RESPONSIBLE. SAFE. INNOVATIVE. l 19Operations NYSE: HL RESPONSIBLE. SAFE. INNOVATIVE. l 20
OPERATIONAL REVIEW
Continued performance despite COVID-19 challenges

NYSE: HL                                            RESPONSIBLE. SAFE. INNOVATIVE. l 21
DIVERSE ASSET PORTFOLIO IN MINING FRIENDLY JURISDICTIONS
Significant value in the fundamental operations, moving projects toward becoming fundamental
operations
                                                                                                               Fundamental Operations
                                                 Greens Creek                                                     Casa Berardi                                                     Lucky Friday

  Location/Fraser Ranking1                         5 - Alaska, USA                                               6 - Quebec, Canada                                                  9 - Idaho, USA
      Primary Product                                    Silver                                                           Gold                                                             Silver
      2020 % Revenue
                                                         47 %                                                             30%                                                               9%
        Contribution
     2020 2P Reserves                              111.1 Moz silver                                                  1.5 Moz gold                                                    77.0 Moz silver
      2020 Production                        10.5Moz Ag / 48.5Koz Au                                         121.5Koz Au / 24.1Koz Ag                                                   2.0Moz Ag
   2020 Cash provided by
                                                       $182.6 M                                                         $68.5 M                                                           $4.8 M
    operating activities2
     2020 Cost of Sales3                               $217.1 M                                                         $203.4 M                                                         $56.7 M
                          4
      2020 Cash Cost                                $5.49 / oz Ag                                                   $1,131 / oz Au                                                    $9.34 / oz Ag
                      4
        2020 AISC                                   $8.57 / oz Ag                                                   $1,436 / oz Au                                                   $18.22 / oz Ag
   2020 Sustaining Capex                                $28.8 M                                                         $34.4 M                                                           $7.2 M
           2020 FCF4                                   $159.6 M                                                         $27.6 M                                                           $(21 M)
       Start-Up Year                                     1989                                                             1989                                                             1942
    Mine Life at Start-up                               7 years                                                          6 years                                                          2 years
  Remaining Reserve Life                               11 years                                                         13 years                                                         17 years

                                             Hecla’s flagship mine: ~$1bn in                                  Doubled tonnage for economies
                                                                                                                                                                               Achieved full production fourth
                                             cumulative free cash flow over                                       of scale with open pit
                                                                                                                                                                                      quarter of 2020
                                                       last 10 years                                           supplementing underground

             ¹ Location ranking based on Fraser Institute Annual Survey of Mining 2020 Report (77 companies ranked - Lower is Better).
             2 Cash used by operating activities for Lucky Friday includes $2.4 million for suspension costs incurred during the ramp-up to historical production levels. Cash provided (used)

                by operating activities for the operating segments excludes exploration expense, as it is a discretionary expenditure and not a component of the mines’ operating
                performance. Consolidated cash provided by operating activities for the twelve months ended December 31, 2020 includes exploration expense of $0.4 million for Greens
                Creek, $2.9 million for Casa Berardi, $6.5 million for Nevada Operations, and $3.5 million for San Sebastian.
             3 Cost of sales and other direct production costs and depreciation, depletion and amortization.
NYSE: HL     4 Cash Costs and AISC, after by-product credits, per produced silver/gold ounce. AISC and FCF are non-GAAP measures; please refer to appendix for reconciliation to GAAP.            RESPONSIBLE. SAFE. INNOVATIVE. l 22
SAFETY: STEADY FOCUS, EXCELLENT SAFETY RECORD
2020 lowest AIFR in Hecla’s history; improvements despite pandemic distractions
Hecla All Injury Frequency Rate (AIFR)
69% reduction
7 since SHMS
6.06 inception
6
5.35 5.41
5
4.57
Frequency Rate
4
3.42
3 2.76
2.00 1.90
2 1.61
1.22
1
0
2012* 2013 2014 2015 2016 2017 2018 2019 2020 YTD
6/30/21
*2012 Safety & Health Management System (SHMS) initiated.
NYSE: HL RESPONSIBLE. SAFE. INNOVATIVE. l 23LARGE RESERVES DESPITE CONSERVATIVE VALUATION
Hecla among the lowest marginal ounce in 2020 at $16.00 silver price
Price assumption is at the discretion of management
$18.00 $18.00 $18.25 HL Reserve
$17.00 $17.00 $17.00 $17.00 $17.00 Year
$16.00 $16.00 $16.00 Prices
2012 $26.50
2013 $20.00
Silver
2014 $17.25
2015 $14.50
2016 $14.50
2017 $14.50
2018 $14.50
2019 $14.50
Hecla Eldorado Goldcorp/ Agnico Fresnillo* First Coeur Endeavour Pan SSR Mining* Fortuna* 2020 $16.00
Newmont Eagle Majestic* Silver American
HL Reserve
$1,350 $1,400 Year
$1,250 $1,250 $1,250 $1,275 $1,300 $1,300 $1,300 $1,320 Prices
$1,200
2012 $1,400
2013 $1,300
Gold
2014 $1,225
2015 $1,100
2016 $1,200
2017 $1,200
2018 $1,200
2019 $1,300
Goldcorp/ Agnico Fresnillo* SSR Mining* Endeavour Eldorado Hecla Pan Fortuna* First Coeur 2020 $1,300
Newmont Eagle Silver American Majestic*
*Reserve prices updated Jun-30-2019; All others updated Dec-31-20; Peer assumptions are based on 2020 public filings.
NYSE: HL RESPONSIBLE. SAFE. INNOVATIVE. l 24SILVER/GOLD RESERVES GROWTH
Despite being more conservative: growth with low price assumptions is exceptional
Silver Reserves Growth (millions of ounces) Gold Reserves Growth (millions of ounces)
131.0
2.0
1.5 2.4
188.4
(90.2)
147.7
250%**
0.7
(1.8)
645%***
2013 Beginning Reserves Silver 2020 Ending 2013 Beginning Reserves added Gold Produced Additions through 2020 Ending
Reserves added (2013- Produced Reserves Reserves (2013-2020)** (2013-2020) acquisitions Reserves
2020)* (2013-2020)
$16.00/oz $1,400/oz $1,300/oz
$26.50/oz
* Silver reserves include approximately 139 Koz acquired through Klondex acquisition in July 2018
** Klondex acquisition in July 2018, Aurizon Mines acquired in June 2013
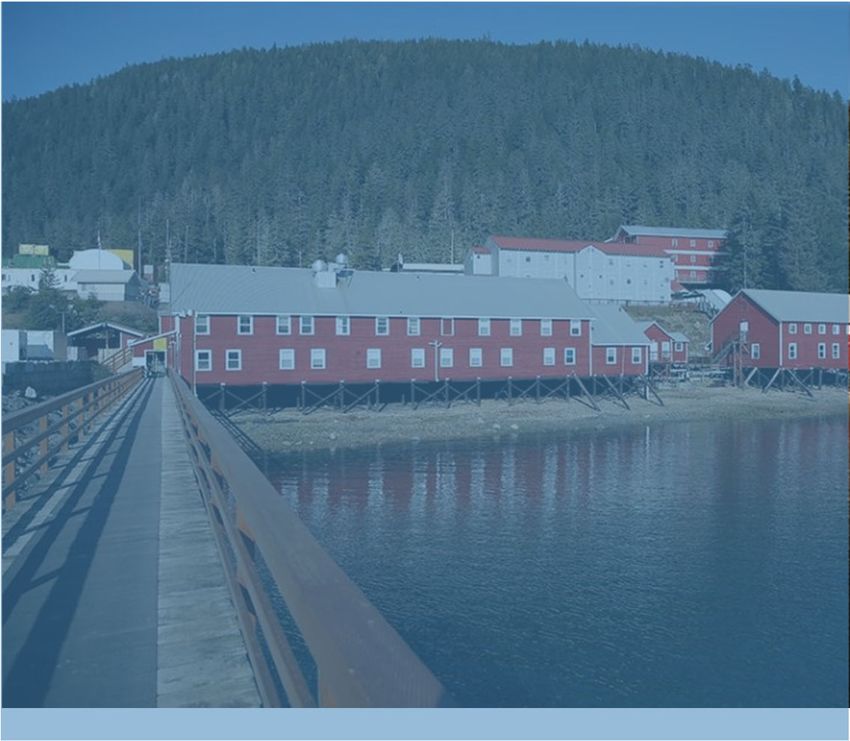
NYSE: HL *** Percentage growth calculated as: Beginning Reserves plus new reserves plus mining depletion divided by beginning reserves RESPONSIBLE. SAFE. INNOVATIVE. l 25GREENS CREEK: CONSISTENT, STRONG PERFORMANCE
Cash flow from operations of $276 million and Free Cash Flow $255 million in the last 5 quarters
• Fourth highest quarterly free cash flow of $63.5 million since 2008
• Benefiting from higher silver, zinc and lead prices
• Despite lower grades, we are lowering guidance for Cash Cost and
AISC again due to higher by-product credits, lower production costs
and favorable changes in smelter terms
• Cost of sales $222 million
• Cash Cost* at ($1.00) - $1.00
• AISC* at $3.25 - $4.00
• Increasing gold production guidance due to higher than modeled
grades
• Workforce is nearly 90% vaccinated
Silver AISC per ounce and Margins per ounce Free Cash Flow(5)
Cost of $57.7 $51.1 $59.2 $53.2 $55.5 Cash Flow
from $37.8 $67.1 $58.3 $44.3 $68.5
Sales(7):
Operations:
($ millions)
($ millions)
61.9 63.5
51.1
$13.11 42.7
$17.62
$26.46 36.4
$11.33 $24.07
$12.05
$7.11 $7.70 $1.59 $0.68
2Q 2020 3Q 2020 4Q 2020 1Q 2021 2Q 2021
Q2 2020 Q3 2020 Q4 2020 Q1 2021 Q2 2021
(4) (2)
AISC* Realized Price Margin
NYSE: HL * Cash Cost and All-in sustaining cost (AISC) is a non-GAAP measure, reconciliation to GAAP is shown in appendix. RESPONSIBLE. SAFE. INNOVATIVE. l 26HECLA’S STRONGEST MINE - GREENS CREEK IS GROWING
13.5 Moz silver production, $181.1 M in cash flow
Cumulative Gross Profit and Cumulative Net Cash Flow* Greens Creek Throughput has Grown 15% Since Purchase in 2008
Cumulative Gross Profit and Net Cash Flow Greens Creek Production and Reserves
900 16
$ millions
1,666 14
1,526
1,425
1,351 12
1,257
1,167 800
1,127
10
Ore Production (kt)
Ore Reserves (Mt)
1,060 Hecla
982 became
operator
827 8
637
6
470
700
370
250 4
119
(10)
122 216 324 504 698 812 875 941 983 1,061 1,156 1,235 1,336 1,491 2
(118) (11)
600 0
2005
2006
2007
2008
2009
2010
2011
2012
2013
2014
2015
2016
2017
2018
2019
2020
2006
2007
2008
2009
2010
2011
2012
2013
2014
2015
2016
2017
2018
2019
2020
Cumulative
Until 2005
Net Cash Flow* Gross Profit
• Automation drive beginning in 2017 leads to further efficiencies
• Consistent exploration success enables reserves to be
*Net cash flow is a non-GAAP measure and reconciliation to Gross Profit (GAAP) is shown maintained
in the Appendix.
NYSE: HL RESPONSIBLE. SAFE. INNOVATIVE. l 27GREENS CREEK – DISTRICT AND NEAR MINE GROWTH POTENTIAL
In-mine mineralization open for expansion and district potential for new deposits
Continuation of resource expansion
along mineralized trends
• Ore tons have doubled in the past 15
years
• Pace is driven by development access
• 5250 exploration is accessed from surface
• Multiple years of exploration planned
District targets have potential for a new
deposit
• VMS deposits often are in clusters
• Multiple untested mineralized targets
NYSE: HL RESPONSIBLE. SAFE. INNOVATIVE. l 28LUCKY FRIDAY: POSITIONED FOR LONG TERM VALUE
On track to increase production to approximately 5 million ounces in 2023
• Historical production rates achieved with a successful
ramp-up
• Tightening cash cost and AISC per ounce guidance, 2021
production expected to exceed guidance of 3.4 million oz
• Cost of sales $103 million
• Cash Cost* at $7.50 - $8.50
• AISC* at $14.25 - $16.25
• Continue to test and optimize new mining methods to
improve safety and increase productivity
Silver Production - Returned to historical production levels Free Cash Flow(5)
($ millions)
(Koz) 864 913
830 Cash Flow from $10.9 $19.7
Operations:
636 ($ millions) 14.0
470
5.0
96
1Q 2020 2Q 2020 3Q 2020 4Q 2020 1Q 2021 2Q 2021 Q1 2021 Q2 2021
NYSE: HL * Cash Cost and All-in sustaining cost (AISC) is a non-GAAP measure, reconciliation to GAAP is shown in appendix. RESPONSIBLE. SAFE. INNOVATIVE. l 29LABOR RELATIONS MUCH IMPROVED Employee productivity and training increasing • Smooth transition during the ramp-up • Training all employees on conflict resolution and setting expectations made an impact • Improved communication and working relationship with local union • More production than planned with 10% fewer employees • 40% of hourly employees have progressed to a higher skill level NYSE: HL RESPONSIBLE. SAFE. INNOVATIVE. l 30
HECLA IS INCREASING SILVER PRODUCTION
Lucky Friday production tripled over last year, expected to be 75% more in 2021 and 5 million
ounces by 2023, 2.5 times 2020 production

                                                                                    30 Vein - *AgEq Grade (opt)
             20 Years
             Past Mining
                                                                                                   < 10
                                                                                                   10 - 20
                                                                 Almost                            20 - 30
                  6500 Level                                                                       30 - 35
                                                                 1000 feet
                                                                                                   > 35
                                                                 @ +35
                                                                                               Oct. 12, 2020
                                                                 AgEq
                                                                                      *Ag Equivalent Values Based on
                       7500 Level                                                     metal prices of $16.50/oz
                                                                                      Ag, $0.85/lb Pb, and $1.00/lb Zn
                                                                                      ** Cutoff grade 11 AgEq
                                                                                      *** 2020 average grade 25 AgEq

                                     #4 Shaft             1000 Feet
                                                          Looking North
 NYSE: HL                                                                         RESPONSIBLE. SAFE. INNOVATIVE. l 31
CASA BERARDI: OPTIMIZED PRODUCTION, NOW COST FOCUS
Process improvement is focused on costs after delivering production improvements
• Higher costs in Q2 due to costs associated with higher throughput,
mill contractor costs related to maintenance and optimization
activities, and underground maintenance costs
• Business improvement activities continue in 2021; expected to
reduce costs and increase cash flow over next two years
• Increasing production guidance to 128 – 132 Koz.
• Cost of sales $220 million
• Cash Cost* guidance $1,000 - $1,125 per ounce
• AISC* guidance $1,200 - $1,325 per ounce
Production and Throughput Free Cash Flow(5)
(Production in Koz)
37.6 Cash Flow from
36.2 $27.2 $25.0 $27.8 $30.9 $15.8
Operations:
30.8 31.3 ($ millions)
26.4 23.5
382,981 368,403 374,683
18.6
280,420 288,682 14.0
9.3
2.8
Q2 2020 Q3 2020 Q4 2020 Q1 2021 Q2 2021 Q2 2020 Q3 2020 Q4 2020 Q1 2021 Q2 2021
Production Tons Ore Milled
NYSE: HL * Cash Cost and AISC per gold ounce, after by-product credits. All-in sustaining cost (AISC) is a non-GAAP measure, reconciliation to GAAP is shown in appendix. RESPONSIBLE. SAFE. INNOVATIVE. l 32CASA BERARDI: FOCUSED ON LONG-TERM OPERATIONAL IMPROVEMENT
Investments in 2020 are yielding results
Broke monthly Mill throughput records for three consecutive
months with >90% availability
~10% increase in UG active time, leading to improved
productivity
Reduced UG maintenance backlog by 2.5 weeks, translates to
higher equipment availability
Launched training for UG operators to improve pre/post-op
(equipment reliability)
Increased operator accountability to decrease operator driven
downtime
~10% Support Costs reduction ready to implement (in 2021)
Open Pits and Explosives RFP process well underway paves
way to reduced external spend
NYSE: HL RESPONSIBLE. SAFE. INNOVATIVE. l 33CASA BERARDI – NEW DISCOVERY IN THE 160 ZONE New intercept is 500 feet from current resource blocks and open in all directions NYSE: HL RESPONSIBLE. SAFE. INNOVATIVE. l 34
Exploration/Pre-development

NYSE: HL                                 RESPONSIBLE. SAFE. INNOVATIVE. l 35
HECLA’S EXPLORATION AND DEVELOPMENT ASSETS

NYSE: HL                                     RESPONSIBLE. SAFE. INNOVATIVE. l 36
NEVADA: FOCUS ON LONG-TERM VALUE CREATION
Bulk sample test nearing completion

   • Q2 gold production of 14,125 ounces from
     stockpiled ore and bulk sample of refractory
     material
   • Approximately 10,000 tons of refractory
     material expected to be processed in H2
     2021 as a test at a third-party autoclave
     facility
           • Ounces processed are anticipated to be
             recognized as production at that time
   • Nevada operations placed on care &
     maintenance in Q2/2021
   • Activities focused on Hollister development
     for Hatter Graben and Midas exploration

NYSE: HL                                              RESPONSIBLE. SAFE. INNOVATIVE. l 37
ROCK CREEK & MONTANORE
Final stages of permitting, expecting to advance subject to further litigation
Permitting Overview Site Overview
• Rock Creek ROD* for evaluation remanded by district court on ESA
procedural issue
• Will step back at Rock Creek and focus on Montanore
• Montanore final EIS and ROD for evaluation were expected mid-2021
• U.S. Fish and Wildlife Service will now revise Biological Opinion
based on RC decision – early 2022 likely to be completed
• Montanore infrastructure in place for evaluation drilling so no
significant environmental impacts
• Evaluation drilling at Montanore can also inform Rock Creek
planning
Inferred Resources (at 12/31/20) Overview
Rock Creek Montanore Metric Rock Creek Montanore
Potential Mine Life 20 – 30 Years each
148.7 million oz. Silver 183 million oz. Silver Hecla Stock Acquisition Cost $19 M $54 M
1.3 billion lbs. Copper 1.5 billion lbs. Copper Advanced Permitting ROD* Final SEIS**
Well Located 50 miles from Lucky Friday
Combined, the projects are as large as Hecla’s current
Land Position Great Exploration Potential
reserves
*Record of Decision for underground resource evaluation and data collection.
**Supplemental Environmental Impact Statement
NYSE: HL RESPONSIBLE. SAFE. INNOVATIVE. l 38HECLA EXPLORATION DRILLING
Mine/project exploration drilling expected to add mineral reserves and resources
Mine/Project Results/Expectations
Casa Berardi, Quebec Will continue to add Mineral Resources to both underground and open-pit
mining areas
Mexico Further define two new vein discoveries south of the San Sebastian Mine –
test a fully preserved mineralized vein system northeast of the mine
Midas, Nevada Follow-up to encouraging results from 2020 drilling and test new targets on
this large land position
Heva-Hosco, Quebec Test the trend of high-grade gold mineralization at depth below current open-
pit resources
Kinskuch, BC Focus on confirming and extending the currently known mineral trends to over
2 miles in length
Creede, Colorado Update 3-D district geology model and rank exploration targets
Republic, Washington Continue district-wide reconnaissance of exploration targets and rank for
follow-up work - update 3-D district geology model
Silver Valley, Idaho Continue detailed target modeling and exploration ranking in collaboration with
Lucky Friday geology staff
NYSE: HL RESPONSIBLE. SAFE. INNOVATIVE. l 39Guidance NYSE: HL RESPONSIBLE. SAFE. INNOVATIVE. l 40
GUIDANCE 2021-2023
Silver production to increase 2021 to 2023
Production Outlook                                               Silver Production (Moz)            Gold Production (Koz)            Silver Equivalent (Moz)8              Gold Equivalent (Koz)8

                                                                  Original       Current            Original        Current           Original          Current           Original         Current

Greens Creek*                                                    9.5 – 10.2     9.5 – 10.2           40 – 43        43 - 45          20.5 – 21.5        22 - 23           227 – 237       244 – 253.5

Lucky Friday*                                                     3.4 – 3.8      3.4 – 3.8             n/a            n/a             6.2 – 6.4         6.2 – 6.4          67 – 70          67 – 70

Casa Berardi                                                        n/a             n/a           125 – 128        128 - 132         11.5 – 11.7    11.7 – 12.1           125 – 128        128 - 132

Nevada Operations                                                   n/a             n/a              20 – 22        20 – 21           1.8 – 2.0         1.8 – 1.9          20 – 22          20 – 21

 2021 Total                                                     12.9 – 14.0     12.9 – 14.0       185 - 193        191 - 198         40.0 – 41.6    41.7 – 43.3           439 - 457       459 – 476.5

 2022 Total                                                     13.7 – 14.5     13.7 – 14.5       173 - 181        173 - 181         40.1 – 42.5    40.1 – 42.5           430 – 450        430 – 450

 2023 Total                                                     14.2 – 15.0     14.2 – 15.0       177 - 186        177 - 186         42.5 – 44.5    42.5 – 44.5           467 – 485        467 – 485
*Equivalent ounces include lead and zinc production.

                                                                   Costs of Sales and other direct                Cash cost, after by-product                 AISC, after by-product credits, per
Cost Outlook                                                    production (“Cost of Sales”) (million)7          credits, per silver/gold ounce3                 produced silver/gold ounce4

                                                                     Original                Current               Original               Current                   Original             Current

Greens Creek                                                          $213                    $222               $1.50 - $2.25        ($1.00) - $1.00         $6.50 - $7.25            $3.25 - $4.00

Lucky Friday                                                           $91                    $103               $775 - $9.75          $7.50 - $8.50         $13.75 - $16.50          $14.25 - $16.25

 Total Silver                                                         $304                    $325               $3.25 - $4.25         $1.00 - $2.00         $10.75 - $12.50          $9.00 - $11.00

Casa Berardi                                                          $212                    $220               $900 - $975          $1,000 - $1,125        $1,185 - $1,275          $1,200 - $1,325

Nevada Operations                                                      $41                    $43               $1,300 - $1,425       $1,300 - $1,425        $1,385 - $1,525          $1,385 - $1,525

 Total Gold                                                           $253                    $263              $950 - $1,050          $1,050-$1,200         $1,200 - $1,300          $1,250 - $1,350

Capital and Exploration Outlook
 (in millions)                                                                                Original              Current

 2021E capital expenditures9 (excluding capitalized interest)                                          $110                 $110

 2021E exploration expenditures9 (includes corporate development)                                        $30                  $30

 2021E pre-development expenditures9                                                                     $4.5                 $8.5
NYSE: HL                                                                                                                                                                                 RESPONSIBLE. SAFE. INNOVATIVE. l 41
ESG NYSE: HL RESPONSIBLE. SAFE. INNOVATIVE. l 42
RESPONSIBLE. SAFE. INNOVATIVE.
Believe in earning and maintaining our social license to operate

• We must be responsible operators in the communities where we
  live and work
     • We provide career jobs for our 1,500 employees
     • Create a culture where safety is non-negotiable
     • Protect and partner with the community
     • Generate shareholder return
     • Work every day to safeguard the environment
• Our goal is to be responsible, safe and innovative in everything we
  do and everywhere we operate

NYSE: HL                                                                RESPONSIBLE. SAFE. INNOVATIVE. l 43
ESG COMMITMENT: COMMUNITIES AND EDUCATION Investing in future generations and communities, COVID-19 relief Charitable Donations and Volunteerism • More than $3.7 million in Hecla Charitable Foundation contributions since 2009 • Foundation is focused on four areas: education, community programs, youth activities, and health services • Culture of Volunteerism—our employees volunteer as firefighters, coaches, school board members • Sponsoring youth programs • Support local communities during COVID-19 with initial commitment of $125,000 NYSE: HL RESPONSIBLE. SAFE. INNOVATIVE. l 44
OUR PRIORITY:
ESG
Implement SASB Standards on ESG

•   Our core values of being responsible, safe and innovative
    are reflected in our commitment to operating as a
    responsible, ethical and sustainable business
•   Utilize the industry-specific SASB standards to report on
    the ESG aspects of our company
•   Continue to integrate ESG factors into Hecla that will bring
    value and positively impact environmental, social and
    governance areas

                                                                   ENVIRONMENT   l SOCIAL l GOVERNANCE

NYSE: HL                                                                                   RESPONSIBLE. SAFE. INNOVATIVE. l 45
OUR COMMITMENT:
ENVIRONMENT
Reducing greenhouse gas emissions and conserving energy
• 60% less diesel fuel consumption at Greens Creek
through the use of interruptible hydropower
• The biomass heating project installed at the Casa
Berardi Mine is expected to reduce 2,732 tonnes
of greenhouse gas emissions per year by using
biomass instead of propane
• More than $1 million in annual energy savings at
Greens Creek due to on-demand ventilation
• Autonomous haulage at Casa Berardi increased
payloads by 8% and decreased energy use 17%
per vehicle
• Track on-site consumption of carbon-based fuels
at all operating properties
Autonomous
haulage increased
payloads by 8%
NYSE: HL RESPONSIBLE. SAFE. INNOVATIVE. l 46OUR COMMITMENT: TAILINGS MANAGEMENT Emphasis on safety and stability • Design, construct, operate, decommission and close our tailings facilities to ensure stability • Approximately half of the tailings produced is used as backfill at Greens Creek, Lucky Friday, and Casa Berardi • Early adopter of the dry-stack method of tailings management at the Greens Creek Mine • Dry-stack method minimizes tailings surface footprint, reduces amount of water retained in the tailings and lessens consequences for any potential failure • Completed independent tailings stewardship reviews at both Casa Berardi and Midas Mines in 2018 NYSE: HL RESPONSIBLE. SAFE. INNOVATIVE. l 47
OUR COMMITMENT:
RECLAMATION
Every mine begins with a reclamation plan

  • Begin each mine with a reclamation plan to restore the land to
    its natural state for productive uses
  • More than $180 million committed to ensuring mined lands are
    successfully reclaimed following operations
  • Completed reclamation of the 570-acre Grouse Creek Mine in
    2013 and saw the return of the financial assurance
    demonstrating governmental agencies’ acceptance of the site
                                                                                Before
    reclamation works
  • Reclamation on track at the former Troy Mine in Montana,
    where more than 97% of tailings have been covered or top
    soiled and seeded
  • Partnered with the Western Shoshone Tribe in concurrent
    reclamation at Hollister Mine – and in siting exploration pads to
    minimize disturbance

                                                                                  After

                                                                                After
NYSE: HL                                                                RESPONSIBLE. SAFE. INNOVATIVE. l 48
OUR COMMITMENT: WATER MANAGEMENT Robust program of sampling, quality analysis and audits • All water output must meet applicable federal and state (or provincial) water quality permit conditions • More than 95 percent of the process plant water needs at our Casa Berardi Mine are met by recycling water from the tailings pond • Conduct water audits to understand usage, find opportunities to reduce consumption, and reduce the associated volume of treated water to ensure that natural waters are protected NYSE: HL RESPONSIBLE. SAFE. INNOVATIVE. l 49
OUR COMMITMENT:
SAFETY
Safety is non-negotiable at Hecla

• Practice continuous improvement where we
  adapt/change to minimize risks of injury or an accident   SAFETY IS EMBEDDED IN OUR CULTURE

• Goal is always 0 injuries/fatalities
• First hardrock mining company to achieve NMA’s
  CORESafety certification (2016)
• Casa Berardi Mine in Quebec was the first international
  mine to receive certification under the CORESafety
  system (2018)
• In 2019, employees worked more than 5.7 million man-
  hours and received more than 59,000 hours of safety
  and health training.
• Lucky Friday Mine Rescue Team earned first place in the
  2019 Central Mine Rescue Competition and the Greens
  Creek’s Mine Rescue Team took second

NYSE: HL                                                                            RESPONSIBLE. SAFE. INNOVATIVE. l 50
OUR COMMITMENT:
COMMUNITIES AND EDUCATION
Investing in future generations and communities

Education and Training
• $900,000 toward sustainable career development
  programs at Greens Creek Mine since 2011
• More than $1 million in donations toward student
  scholarships by the Hecla UQAT Foundation in Quebec
  since 2009
• Pathways in Alaska program begins with middle school
  tours and runs through high school with job shadowing
  and instruction
• In 2014, we hired the first two successful certification
  graduates, both of whom started in our Pathway
  program in middle school

NYSE: HL                                                     RESPONSIBLE. SAFE. INNOVATIVE. l 51
OUR COMMITMENT:
INDIGENOUS PEOPLES
We partner with First Nations in local communities

• In 2020, Hecla Quebec finalized a Cooperation Agreement
  with the Council of the Abitibiwinni First Nation providing
  participation in the Casa Berardi Mine through training
  programs, employment and advancement opportunities,
  business opportunities, environmental protection measures,
  and other practices
• Hecla Quebec and the Gitanyow Band in upper British
  Columbia have entered into an exploration agreement that
  addresses mutual benefits from future exploration activity in
  the area – including employment, contracting, environment,
  and permitting
• Hecla Quebec has signed a Memorandum of Understanding
  with the Pikogan First Nations that could guide development
  of a collaboration agreement
• Working with the Western Shoshone Tribe and the Te-Moak
  Council in Nevada on cultural and environmental matters,
  including siting and reclamation of exploration drill sites
• Our Greens Creek Mine, in partnership with the University of
  Alaska, hosted community workshops to educate and
  address questions on sustenance fisheries and the impacts
  of global mercury releases to the environment

NYSE: HL                                                          RESPONSIBLE. SAFE. INNOVATIVE. l 52
Silver Market

NYSE: HL                   RESPONSIBLE. SAFE. INNOVATIVE. l 53
SILVER – WIDENING GAP BETWEEN SUPPLY & DEMAND
Gap expected to increase with continued trend of industrial demand growth of 2.0%

• 2019 saw a total supply of 1,023 Moz and total demand of 1,074 Moz
• Silver’s total demand in 2030 is expected to reach ~1,147 Moz if demand stays on the last decade
  trend and no increase in silver’s investment demand
• Supply needs to grow by ~70 Moz per year to meet the on trend additional demand expected in
  2030

                                                                 Silver Supply & Demand: 2019 and 2030E                                                                         1,147
                                                                                                         Million Ounces

                                Supply shortfall of 50 Moz in
                                 2019 was filled by above                                                  1,074
                                      ground stocks

                                    1,023

                               Total Supply                                                          Total Demand                                    Demand Expected, Based on 10 Year Growth
                                  2019                                                                   2019                                                         Rate
                                                                                                                                                                     2030F*
           * Demand assumptions: CAGR for industrial demand over the past 10 years has been 2.0%. Assume no increase or decrease in investment, jewelry or silverware demand.
NYSE: HL                                                                                                                                                                          RESPONSIBLE. SAFE. INNOVATIVE. l 54
FEDERAL RESERVE’S GROWING BALANCE SHEET
Monetary policy expected to remain accommodative bullish for gold
Fed Balance Sheet 2007 - February 2021
.
“Fair“Fair
to sayto you
say simply flooded
you simply the system
flooded with with
the system money?” “Yes.“Yes.
money?”
We print it. Weit.are
We print Wenot
areout
notofout
ammunition …there’s
of ammunition reallyreally
…there’s no no
limit…we can move
limit…we to make
can move policy
to make moremore
policy accommodative.”
accommodative.”
JeromeJerome
Powell 5/17/20
Powell 5/17/20
Fed Balance Sheet as a % of GDP
35 31%
30
25
20
15 19%
10 16%
5
8%
0
1/1/2007
5/1/2007
9/1/2007
1/1/2008
5/1/2008
9/1/2008
1/1/2009
5/1/2009
9/1/2009
1/1/2010
5/1/2010
9/1/2010
1/1/2011
5/1/2011
9/1/2011
1/1/2012
5/1/2012
9/1/2012
1/1/2013
5/1/2013
9/1/2013
1/1/2014
5/1/2014
9/1/2014
1/1/2015
5/1/2015
9/1/2015
1/1/2016
5/1/2016
9/1/2016
1/1/2017
5/1/2017
9/1/2017
1/1/2018
5/1/2018
9/1/2018
1/1/2019
5/1/2019
9/1/2019
1/1/2020
Source: Bloomberg
NYSE: HL RESPONSIBLE. SAFE. INNOVATIVE. l 55TRILLIONS OF GOVERNMENT SPENDING AND GROWING
Current programs are three times greater than the 2008-9 programs
$1.9 trillion $350bn: Aid to state & local governments, $225 bn: stimulus checks, $130 bn: school funding,
Stimulus bill: Additional jobless benefits, Vaccine tracing and testing, Health insurance subsidies
Source: Morgan Stanley Research US economics team
NYSE: HL RESPONSIBLE. SAFE. INNOVATIVE. l 56SIGNIFICANT MONETARY GROWTH COMPARED TO 1970s
M2 money supply is highly correlated with inflation
US M2 year over year % change, Q1/1960 – Q4/2020
Source: Reuters Eikon, Incrementum AG
NYSE: HL RESPONSIBLE. SAFE. INNOVATIVE. l 57GOLD MARKETS SINCE NIXON CLOSED THE GOLD WINDOW
Last Bull market driven by the Dot.com bust, 9/11 and Global Financial Crisis
Gold Bull and Bear Markets 01/1971-05/2020
10
49 months
512%
125 months
583%
31 months
218%
13 months 34 months
94% 62% 53 months
59%
1
4 months
-21% 20 months 160 months 51 months
-40% 53 months -46% -40%
-56%
0
1971 1978 1985 1992 1999 2006 2013 2020
Recession Bull Bear
Source: Reuters Eikon, Incrementum AG
NYSE: HL RESPONSIBLE. SAFE. INNOVATIVE. l 580
100
200
300
400
500
600
12/1/2001
NYSE: HL
3/1/2002
6/1/2002
9/1/2002
12/1/2002
3/1/2003
6/1/2003
Source: Bloomberg
9/1/2003
12/1/2003
3/1/2004
6/1/2004
9/1/2004
12/1/2004
3/1/2005
REPLAYING THE PAST
6/1/2005
9/1/2005
12/1/2005
• 1/1/2000 to 3/31/2004 – 50% appreciation
3/1/2006
6/1/2006
9/1/2006
12/1/2006
• 1/1/2009 to 3/31/2011 – 230% for Silver, 62% for gold
3/1/2007
Silver
6/1/2007
9/1/2007
12/1/2007
Gold 3/1/2008
Two major periods of monetary and fiscal stimulus – 2001 and 2008
Very strong silver and gold performance from 2000 to 2011
6/1/2008
9/1/2008
12/1/2008
3/1/2009
Percentage Increase In Gold and Silver
6/1/2009
9/1/2009
12/1/2009
3/1/2010
6/1/2010
9/1/2010
12/1/2010
3/1/2011
6/1/2011
9/1/2011
12/1/2011
3/1/2012
6/1/2012
9/1/2012
12/1/2012
RESPONSIBLE. SAFE. INNOVATIVE. l 59GOLD AND SILVER LINKED THROUGHOUT HISTORY
Highest known ratio in last 300 years, close in 1941
120
100
80
60 2020: G/S ratio = 108
~ 3x above average
40 ~ 5x above median
20
0
1718 1738 1758 1778 1798 1818 1838 1858 1878 1898 1918 1938 1958 1978 1998 2018
Gold/Silver ratio Average Median
Source: Nick Laird, goldchartsrus.com, Incrementum AG
NYSE: HL World Bank, Wheaton Precious Metals RESPONSIBLE. SAFE. INNOVATIVE. l 60RISING INFLATION IS NEGATIVE FOR MOST ASSET CLASSES
Gold and mining shares are among the best performers in inflation regimes
Compound annual growth rates of different asset classes in different inflation regimes
Source: Wellington Asset Management, Incrementum AG
NYSE: HL RESPONSIBLE. SAFE. INNOVATIVE. l 61SILVER SUPPLY COMES FROM MINE PRODUCTION & RECYCLING
Significant disruptions expected in mine supply in 2020
Mine production accounts for 80-85% of total silver supply
• 2019 saw lower mine production due to grade declines and temporary mine suspensions due to community action
• Greater challenges expected in 2020 due to COVID-19 pandemic. Per World Silver Survey, 6.5% decline expected as a
result of temporary mine closures
Decline in recycling expected in 2020 due to COVID-19 and lower silver prices
million ounces
1057.8 1032.1 1016.7 1021.3 976.2 1056.2
Net Hedging Supply
Recycling
Mine Production
NYSE: HL Source: Bloomberg, Metals Focus RESPONSIBLE. SAFE. INNOVATIVE. l 62SILVER MINE PRODUCTION DECLINING FOR FOURTH YEAR
Despite strong U.S. dollar, silver production has peaked
Million
Ounces
Source: World Silver Survey 2020
NYSE: HL RESPONSIBLE. SAFE. INNOVATIVE. l 63SILVER MINE SUPPLY DEPENDENT ON OTHER METALS
Over half of supply is a by-product of copper, lead and zinc mines
100%
90%
80%
70%
60%
50%
40%
30%
20%
31% 32% 32% 30% 30% 31% 31%
26% 28% 29% 27% 27% 28%
10% 23% 22% 23%
0%
2005 2006 2007 2008 2009 2010 2011 2012 2013 2014 2015 2016 2017 2018 2019 2020e
Silver Zinc & Lead Copper Gold Polymetallic, Other
Source: The Silver Institute, Incrementum AG
NYSE: HL RESPONSIBLE. SAFE. INNOVATIVE. l 64SILVER MINE SUPPLY HAS JURISDICTION RISK
50% from four countries – 4% from the U.S.
Troy Ounces mn
Source: The Silver Institute, Incrementum AG
NYSE: HL RESPONSIBLE. SAFE. INNOVATIVE. l 65SILVER DEMAND HAS THREE MAIN COMPONENTS
Green energy demand is new and growing
Silver Demand Consumer Products/Industrial
Other
64.3 Moz
13%
Investment
267.8 Moz
25%
Photovoltaics
98.7 Moz
Consumer Products/ 19%
Electronics
Industrial* 297.6 Moz
544.6 Moz 58%
Jewelry & 51%
Silverware
261.1 Moz Brazing Alloys
24% 50.3 Moz
10%
* Industrial demand includes photography
demand Source: World Silver Survey 2020
NYSE: HL Source: Bloomberg, Metals Focus RESPONSIBLE. SAFE. INNOVATIVE. l 66SILVER HAS BEEN OUTPERFORMING MANY METALS
Overshot gold in August, weaken since mid-June, copper and zinc increasing
Price Performance since Jan 2, 2020
Copper +55%
Zinc +32%
Silver +29%
Lead +24%
Gold +13%
Source: Bloomberg
NYSE: HL RESPONSIBLE. SAFE. INNOVATIVE. l 67You can also read