Examination of the cost of healthy eating and specialised diets for a single individual in Ireland 2013 Update - Prepared for the Department of ...
←
→
Page content transcription
If your browser does not render page correctly, please read the page content below
Examination of the cost of healthy eating and
  specialised diets for a single individual in
               Ireland 2013 Update

     Prepared for the Department of Social Protection
                           By the
            Irish Nutrition and Dietetic Institute.

                      September 2013

                               1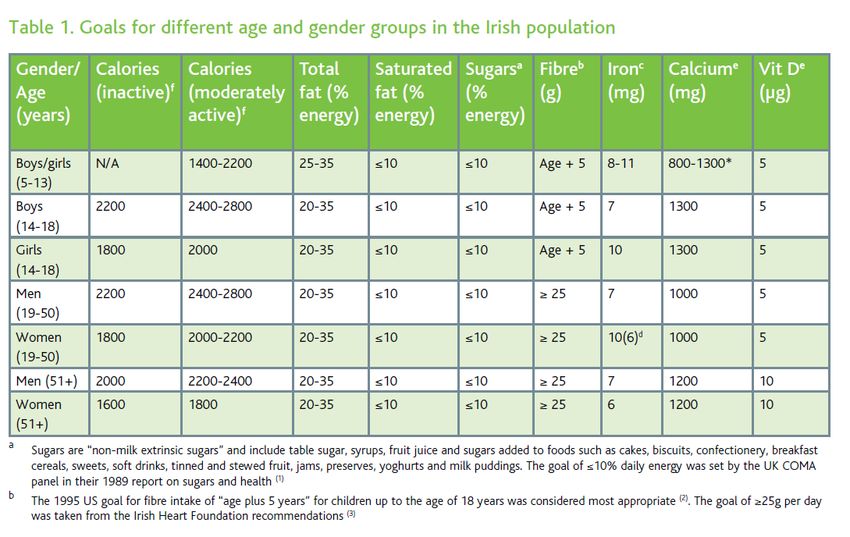
Table of Contents
                                                            Page

Acknowledgements                                             5

Background & Terms of Reference                              6

Introduction                                                 13

Methodology                                                  19

Stage 1: examination of the cost of a healthy eating diet    24

Stage 2: examination of the costs for specialised diets      25

- High Protein, High Calorie Diet                            30

- Gluten Free Diet                                           33

- Low Lactose, Milk Free Diet                                37

- Liquidised (Altered Consistency) Diet                      39

Discussion & Conclusion                                      42

Recommendations                                              49

References                                                   52

                                      2
Figures, Tables and Appendices
Figures
Figure Title Page
Figure 1 The Food Pyramid 26
Tables
Table Title Page
Table 1 Calorie requirements for age & gender groups 21
Table 2 Cost of a healthy eating diet and percentage of 28
welfare allowance spent.
Table 3 Average cost of a High Protein, High Calorie Diet, 31
percentage of welfare allowance spent, cost of
healthy eating (HE) diet and additional cost
above that of HE diet.
Table 4 Average cost of a Gluten Free diet, percentage of 33
welfare allowance spent, cost of HE diet and
additional cost above that of HE diet.
Table 5 Average cost of a Low Lactose, Milk Free diet, 38
percentage of welfare allowance spent, cost of
HE diet and additional cost above that of HE diet.
Table 6 Average cost of a Liquidised (Altered Consistency) 40
diet, percentage of welfare allowance spent, cost
of HE diet and additional cost above that of HE
diet.
Table 7 Summary of costs of all diets examined 41
Table 8 Average cost of special diets versus HE diet 42
Table 9 2013 diet cost ranges 46
3Appendices
Appendix Title Page
Appendix 1 Letter of Introduction 59
Appendix Specialised diets menu plans 61
2-6
4Authors
- Ms. Deirdre McCormack, Department of Clinical Nutrition and
Dietetics, St. James’ Hospital
- Ms. Suzanne Seery, Department of Clinical Nutrition and Dietetics, St.
James’ Hospital
- Ms. Muireann Cullen, M.I.N.D.I
Acknowledgements
We would like to take this opportunity to thank a number of people, whom
without their support this project would not have been so smooth running.
-
- Ms. Karen Byrne, Department of Social Protection.
- Ms. Josephine Monaghan, Department of Social Protection.
- Ms. Jackie Harrington, Department of Social Protection.
- Ms. Richelle Flanagan, President, Irish Nutrition and Dietetic Institute.
- Ms. Philomena Flood, Vice - President, Irish Nutrition and Dietetic
Institute.
- Ms. Patricia O’ Connor, Department of Clinical Nutrition and Dietetics,
Sligo General Hospital.
- Ms. Siobhán Healy, Department of Clinical Nutrition and Dietetics,
Tallaght Hospital.
- Ms. Carmel O’ Hanlon, Department of Clinical Nutrition and Dietetics,
Beaumont Hospital.
- Ms. Catherine Keenan, Department of Clinical Nutrition and Dietetics,
St. Luke’s Hospital, Kilkenny.
- Irish Nutrition and Dietetic Institute.
- Dr. Shane Colgan.
- The Management and staff of the establishments that were visited.
5Background & Terms of Reference
Summary Note on Diet Supplement Arrangements
Background
In 2004, the Department of Social and Family Affairs commissioned the Irish
Nutrition and Dietetic Institute (INDI) to examine a number of issues in
relation to its dietary supplement allowance namely:
1) Examine the various types of diets then prescribed and the extent
of the need for a special diet over a nutritionally balanced diet.
2) Examine the costs of the specialised food items which form the
various diets consumed by specific categories of patients, having
regards to any other forms of support available to these individuals
(i.e. medical cards).
3) The average cost of a proper, nutritionally balanced healthy
eating diet and to establish how this corresponds to the current
measure of costs i.e. one third of a single person’s basic social
welfare payment.
The review examined the cost to an individual receiving social welfare
payment of consuming a healthy diet and then examined the additional
cost to consume a diet required for a specific dietary condition. A report
entitled ‘The Examination of the Cost of Healthy Eating and Specialised
Diets’ was published in January 2006.
2006 Diet Regulations
In April 2006, revised regulations on the dietary supplement allowance
came into effect. These regulations reflected the findings of the 2006 INDI
report and also the objective that all social welfare recipients, including
those with special dietary needs, should be able to purchase an
appropriate diet at a cost of no more than one third of their income. The
2006 INDI report priced the costs of diets in a variety of outlets from the
6cheapest (large discount stores) to the more expensive (local
convenience) stores. The diet levels for the purposes of the Diet Supplement
were set by the Department of Social Protection at the highest prices
surveyed (those at convenience stores).
2007 Diet Regulations
The Diet Regulations were revised in January 2007 to take account of:
1) An increase of 4.4% in the overall rate of inflation as measured by the
Consumer Price Index over the twelve months to November 2006 and
2) An increase in welfare rates announced in Budget 2007.
The increase of 4.4% in the overall rate of inflation on current diets resulted
in an increase of €3.16 in the dietary supplement allowance to all diets. This
increase of €3.16 is based on the highest increase in dietary costs as a result
of the increase in inflation.
From January 2007, the new arrangements were applicable to all new
claims for the dietary supplement allowance. The legislative provisions on
the current Diet Supplement are set out in Part 4 of the Social Welfare
(Consolidated Supplementary Welfare Allowance) Regulations 2007 to
2011.
In 2013, the Irish Nutrition and Dietetics Institute won the tender for a review
of the diet costing’s applicable to the Diet Supplement Scheme.
7Terms of Reference for 2013 Project
It is proposed to carry out an updating exercise in 2013 on the diets outlined
in the previous reports to ensure that the prescribed diets remain valid and
that the rates of Diet Supplement payments are appropriate. It will involve
revisiting the costing exercises undertaken by the INDI in 2004 and 2007 to
see if there has been significant change in the cost of diets. The study will
feed into a review of the current Diet Supplement scheme policy and
regulations.
Project Responsibility and Project Lead
Deirdre McCormack, Suzanne Seery and Dr Muireann Cullen undertook this
project on behalf of the Irish Nutrition and Dietetic Institute (INDI), with the
support of other INDI members as required. The INDI assumed overall
responsibility for the project.
Key Tasks
1. Assessment of and updating the literature available in the Irish
context, where feasible with regards to food availability, insecurity
and poverty, the long term health impact of same and support
provided through the dietary supplement allowance scheme.
2. Assessment of and updating of the 4 specialised diets currently
supported under the diet supplement scheme and outlined in the
2006 and 2007 diet reports to ensure nutritional adequacy and to
take account of any changes that have occurred in dietary advice
due to recent evidence.
3. Carry out a thorough assessment of the costs incurred to consume a
nutritionally balanced and healthy diet.
4. Advise the Department of Social Protection as to whether the current
types of specialised diets eligible for the dietary supplement
allowance remain relevant.
85. Carry out a thorough assessment of the additional costs incurred to
consume each of the 4 specified specialised diets.
6. Advise the Department of Social Protection of any recommended
revisions to existing diet supplement provisions arising from the
examination of the diets and costs incurred.
7. Attend meetings as required with Department of Social Protection to
provide overview of progress and outline plans to ensure all targets in
relation to the management and control of the project are achieved
by contract end.
8. Liaise with the INDI on a regular basis to provide overview of progress
and outline plans to ensure all targets in relation to the management
and control of the project are achieved by contract-end.
Key Deliverables
1. A draft report to be submitted to the Department of Social Protection
by 16th August 2013.
2. A final report to be submitted to the Department of Social Protection
by 13 September 2013.
Payment Conditions
Payment to the INDI will be made on delivery of the final report to the
Department of Social Protection, on production of an invoice and valid tax
clearance certificate.
9General Note on Diet Supplement
Summary
Under the Supplementary Welfare Allowance Scheme, a person who has
additional dietary needs may qualify for a weekly supplement to assist with
the cost of those needs. Diet supplements are available for a number of
prescribed diets which must be certified by an appropriate medical
practitioner. The rate of payment is based on a set diet cost for each of the
4 prescribed diets.
Relevant Legislation
Section 198 of the Social Welfare Consolidation Act 2005 (No. 26 of 2005)
contains the legal provisions for payment of all supplements under the
supplementary welfare allowance scheme.
Part 4 of the Consolidated Supplementary Welfare Allowance Regulations
2007 (S.I. 412 of 2007) refers specifically to diet supplements.
2006 INDI Diet Cost Report
In 2004, the Department of Social Protection commissioned the INDI to
examine a number of issues in relation to its diet supplement. The review
examined the cost to an individual receiving social welfare payment to
consume a healthy diet and then examined the additional cost to
consume a diet required for a specific condition and a report entitled ‘The
Examination of the Cost of Healthy Eating and Specialised Diets’ was
published in January 2006.
2006 Diet Regulations
In April 2006 revised regulations on diet supplements came into effect.
These regulations reflected the findings of the INDI report and the objective
that all social welfare recipients, including those with special dietary needs,
10should be able to purchase an appropriate diet at a cost of no more than
one-third of their income. The diet report priced the cost of diets in a variety
of outlets from the cheapest - large discount stores - to the more expensive
local convenience stores. The diet levels for the purposes of the Diet
Supplement were set by the Department of Social Protection at the highest
prices surveyed – those at convenience stores.
In 2006, the Regulations prescribed a new range of specialised diets and
diet costs, as recommended by (INDI), as follows:
2006 Diet Costs
1. High protein, high calorie €68.27
2. Gluten free diet €65.27
3. Low lactose, milk free €62.27
4. Liquidised (altered consistency) €71.77
2007 Diet Regulations
The Diet Regulations were revised in January 2007 to take account of
an increase of 4.4% in the overall rate of inflation as measured by the
Consumer Price Index over the twelve months to November 2006,
and
an increase in welfare rates announced in Budget 2007.
The increase of 4.4% on current diets resulted in increases of between €2.74
and €3.16 per diet. In order to achieve round figures in calculation of the
supplement, the Department of Social Protection increased all diet rates by
€3.16. This decision was the most favourable to the customer as:
(i) It was the increase on the highest cost diet – Altered Consistency
Liquidised (€71.77 x 4.4% = €3.16), and
(ii) The base figure for the diet was based on the highest costs
surveyed in the INDI Report – those in convenience stores.
In 2007, the Regulations updated the diet costs, as follows:
112007 Diet Costs
1. Low-lactose, milk-free €65.43
2. Gluten-free €68.43
3. High-protein, high calorie €71.43
4. Altered consistency (liquidised) €74.93
The amounts of supplement payable are based on the above diet costs
and reduced by one-third of the relevant 2007 social welfare single rate or
one-sixth of the 2007 rate for a couple. For example, a single person on
Jobseeker’s Allowance with a requirement for a Gluten-free diet would
receive a diet supplement of €6.50 (Gluten Free Diet cost of €68.43 less
€61.93, one-third of his/her equivalent 2007 social welfare rate of €185.80).
2007 INDI Diet Report Update
In 2007, the INDI were commissioned to carry out an update of the 2006
report. The updated report was provided to the Department in November
2007. On the basis of the costs for specialised diets as identified in that
update, it was decided by the Department of Social Protection that Diet
Supplement rates were adequate and that there was no justification at that
time for a change in the Diet Supplement levels.
Note - Since 2007, the policy on diet supplements has been that diet
supplement calculations continue to be based on the diet costs as per the
2006 INDI Report adjusted for inflation in 2007 and equivalent 2007 social
welfare rates.
12Introduction
13Diet plays a very prominent role in determining nutritional status and
inequalities in health outcomes, such as premature death from a number of
dietary related chronic health conditions including cardiovascular disease,
diabetes and some cancers (James et al, 1997 Pluciński, Ngonghala, Getz,
Bonds 2012). Low income is associated with poor nutrition at all life stages
with poor nutrition during infancy and childhood impacting development of
chronic disease in adulthood. In fact, the burden of obesity in children (with
100,000 already obese), is already seeing the development of chronic
diseases during childhood.
On the other end of the scale, at any time, more than 140,000 adults in
Ireland are malnourished or at risk of malnutrition with half being over 65
years of age. The vast majority of malnourished patients are living in the
community with 1 in 3 patients admitted to Irish hospitals being found to be
at risk of malnutrition and over 75% at high risk ( Rice & Normand 2012; Elia
&Stratton 2009, BAPEN, 2013).Compared with normally nourished patients,
malnourished patients have;
• Threefold greater risk of infection.
• Between two and threefold greater mortality risk, according to age.
• 85% higher risk of hospital admission and re-admission (over 65).
• 30% longer length of hospital stay, on average.
(Schneider et al, 2004; 92(1):105-111; Stratton & Elia (2006); Stratton et al
(2006).
In 2005, the report of the National Taskforce on Obesity (NTO) stated that
while obesity levels have increased across all socio-economic groupings,
these increases are most noticeable in the lower social classes. This is
supported by Halpin, Morales-Suárez-Varela, Martin-Moreno (2010) where
relatively disadvantaged racial, ethnic, and socioeconomic groups show
higher incidence rates of heart disease, stroke, cancer and diabetes. A UK
study recorded purchases made by over 3,000 households over 2006-2009
14and found that while the number of calories consumed fell slightly from
nearly 2,300 to less than 2,200 per day, people switched their purchases
away from nutrient dense and towards energy dense (i.e. sugary and fatty)
foods (Griffith, O’ Connell, Smith, 2012).
Many European countries have used strong welfare policies to narrow the
income gap between the wealthiest and poorest citizens and to extend
access to healthcare across society, yet lung cancer incidence and
mortality is still closely related to socioeconomic status (Halpin, Morales-
Suárez-Varela, Martin-Moreno, 2010).
Food security, regardless of location, depends on food availability; and
households’ ability to access food depends on income as well as food
prices (Cohen and Garrett, 2010). Most people make dietary decisions in
relation to food and not nutrients; thus when shopping food choices are
more likely to be influenced by factors such as price, availability, taste
preference and convenience than by the vitamin and mineral content of
the food. Research has shown that the type of food people buy influences
dietary quality. The food choice differences between socio-economic
groups translate into concomitant differences in nutrient intake (Turrell et al,
2009).
Low income households spend a relatively higher proportion of their income
on food and despite this have a poor diet in terms of nutritional intake.
People in low income households tend to shop at convenience stores
where prices are high and variety is poor. Living in a socioeconomically
deprived area may influence dietary behaviours by limiting access to
supermarkets (through lower servicing of these areas by supermarkets or
lower access to transport) and increasing access to corner/convenience
stores (Morland, Diez Roux, Wing, 2006).Both financial and physical barriers
limit the opportunity of many low income households to purchase healthy
15food. Ensuring that people have sufficient income to access an affordable,
sustainable and healthy diet is a key step in food security (Wilde, 2011).
In a study by Monsivais and Drewnowski (2009), it was found that higher-
quality diets were not only more costly per kilocalorie but were also
consumed by persons of higher educational level. One study showed that
higher intakes of dietary fibre, vitamins A, C, D, E, and B12, beta carotene,
folate, iron, calcium, potassium, and magnesium were associated with
higher diet costs. Conversely, higher intakes of saturated fats, trans
saturated fats and added sugars were associated with lower diet costs.
Lower cost lower quality diets were more likely to be consumed by lower
socio-economic groups (Aggarwal, Monsivais and Drewnowski, 2012).
In a review by Geiskes et al, (2010), weight status was most consistently
associated with features of the environment; residents of areas with greater
access to supermarkets or lower accessibility to takeaway outlets had a
lower prevalence of overweight/obesity compared with those living in
areas with limited supermarket access or a greater accessibility to
takeaway outlets. Residents of socioeconomically deprived areas have a
greater likelihood of obesogenic dietary intakes than their counterparts in
advantaged areas. In addition, poor transportation options and, restricted
access to cooking and storage facilities affect many disadvantaged
groups (Cullen, 2006, Friel and Conlon, 2004). In Ireland it was found, as it
was in the UK, that the foods recommended in the Irish healthy eating
dietary guidelines were often more expensive than the less healthy options
(NTO, 2005).
Food poverty is defined as the inability to access a nutritionally adequate
diet and includes related impacts on health, culture and social
participation (Combat Poverty Agency, 2004) such as educational
attainment and job opportunities (Reynolds and O’ Dwyer, Ireland, 2002).
16Low income households are twice as likely as the whole population to
experience food poverty and almost 50% of lone parent households and
36% of unemployed people experience some sort of food deprivation
(Healthy Food for All, 2009). A 2012 report by safefood estimates that 10% of
people are now living in food poverty, a rise of 3% between 2009 and 2010.
Access to food more consistent with preventing the development of obesity
is reduced in low income areas compared to higher income areas. Based
on the findings of safefood research (2005), low income families on the
island of Ireland are having difficulty in allocating the relatively high
expenditure necessary for healthy living from their weekly budgets.
Even now, urban poor people tend to buy food from local markets or
neighbourhood shops. These are frequently, small and widely scattered
(Cohen and Garrett 2010). This is supported by previous research where the
most common type of retail outlet used by the lower income groups are
local convenience outlets (Wilde, 2011) followed by the local independent
traders. In general, the outlets where socially disadvantaged people
shopped were less likely to carry a good range of healthy foods and when
they did they were more expensive (Friel et al, 2004, Drenowski, 2004, Friel,
Walsh and McCarthy, 2006). In 2012, the FSAI examined the cost of healthy
eating in Ireland (2012) and found that where a family shops influences the
cost of eating healthily with convenience stores tending to be almost twice
as expensive for the foods required to meet a healthy diet.
Large retail outlets often have a greater choice of healthy affordable food,
but may be difficult to access, especially if there is not adequate public
transport (NTO, 2005, Friel et al, 2004). Several of these large retail stores
have introduced ‘value line’ or ‘economy line’ foods to improve their
attractiveness to low income consumers. Economy line foods represent
excellent value for money and are often not nutritionally inferior to the
17branded foods. They have a potentially important role to play in the
promotion of healthy eating, especially amongst low income households
(Cooper and Nelson, 2003, Darmon et al, 2009). Key elements in achieving
good nutrition are ensuring the accessibility and availability of affordable
healthy food (Manandhar et al, 2006). Improving physical access to
supermarkets may be one strategy to deal with the obesity epidemic;
improving economic access to healthy foods is another (Drenowski, 2012).
18Methodology
19Overview
Pricing for a selection of foods based on branded and own label foods was
surveyed in a sample of retail outlets for each diet. A Microsoft Excel
database was used to enter the data collected and analyse the costs of
the diets.
Method
The Diets
The healthy eating menu plan was devised based on the food pyramid
from the Department of Health and Children (2012) and FSAI, 1999 and
2012 recommendation with regards to macro and micronutrients for the
adult male and female Irish population, see Table 1.
The therapeutic diets from the 2006 and 2007 reports were reviewed against
current therapeutic diets in use in Irish hospitals in 2013. Resources used in a
clinical setting to advise patients regarding therapeutic/specialised diet
(e.g. clinical nutrition diet sheets) were used in devising the meal plans. The
diets were planned to provide the patient with nutritious food, to meet their
dietary requirements and to provide variety and flavour. Specialised diets
used in the malnourished population such as liquidised and high protein
high calorie, require higher energy and protein requirements and for the
purposes of the meal plans an additional 500-700kcals were included in the
menu plan to reflect these requirements.
20FSAI, 2012
For specialised diets, in particular the gluten free diet, resources such as the
Coeliac Society of Ireland Food list 2013, were consulted to ensure the
menu plans and food items chosen were appropriate. The gluten free diet
menu plan also took into consideration the higher calcium and iron
requirements, essential micronutrients for good health.
These sample diets are based on average portion sizes and frequency of
consumption so that all nutritional requirements are met for good health.
Alcohol is not included in the diets. Diet analysis software (Nutritics) was
used to verify the nutritional content of each menu plan to ensure
nutritional adequacy.
21Data collection
Data was collected by shop visits in a variety of different social
demographic locations in the greater Dublin area (e.g. Dublin 8, Dublin 4)
between June and July 2013. The head offices of several of the store
categories were contacted regarding pricing outside of the Dublin area
with most stores having a national pricing policy with the exception of some
smaller convenience stores where some indicated 5% uplift on prices due to
lower sales volumes and consequent additional costs in stocking.
Both own label and branded foods were examined. The stores were
subjectively categorised according to size i.e. large stores (e.g. Tesco,
Superquinn, Dunnes Stores), large low cost stores (e.g. Lidl, Aldi), medium
sized stores (e.g. Supervalu, Centra, Tesco Express), and convenience stores
(e.g. Day today, Mace, Spar, Londis, Gala).
A price check was conducted on a range of 2 to 3 stores in each store
category to provide a comprehensive overview of product costs and
availability for each diet. In addition to this where possible at least 2-4
branded and own label price checks were recorded for each food item. In
each store, the manager on duty was contacted and a supporting letter
from the Department of Social Protection was shown.
Branded foods were defined as foods that were stocked by the store but
were not produced in the name of the store itself. Own label foods were
defined as foods that could be found in the store with the brand name of
the store or other similar labelling e.g. Tesco value, Euroshopper, St. Bernard
etc.).
Prices for branded and own label foods were logged for foods that fell
within each food category in the diets. An average cost was calculated for
22each food item and used to calculate the total cost of each diet for
branded and own label foods.
The cost of the food items was examined in large stores, large low cost
stores, medium sized stores as well as convenience stores in order to
determine the difference in costs between shop types. Special offers were
not included in the costs of the diets as the variability in pricing and cost to
the consumer would be difficult to reflect due the transient nature of
discounts and special offers.
The dietary costs were based on average portion usage over a week,
however it must be recognised that an individual may have had to
purchase larger units of food or drink in the shop e.g. 26 teabags used in the
week, however the minimum number of teabags available is 40.
Examples of the diets used over the course of 7 days and their costs can be
found in Appendices 2 – 7.
23Stage 1: Examination of therapeutic diets in 2013
A review of the current dietary guidelines for each specialised diet was
undertaken by the Dietitians involved in this study. Further information
regarding the background to the prescription of each specialised diet is
detailed when assessing the cost of each specialised diet below.
2013 Diets
1. Low-lactose, milk-free
2. Gluten-free
3. High-protein, high calorie
4. Altered consistency (liquidised)
24Stage 2. Examination of the cost of a Healthy Eating Diet.
Healthy Eating Diet
A healthy eating diet can be defined as a well-balanced and nutritious diet
that provides all nutrients in sufficient quantities required by the body to
remain healthy. All members of the general public are advised to consume
such a diet, not only by health professionals but also by government
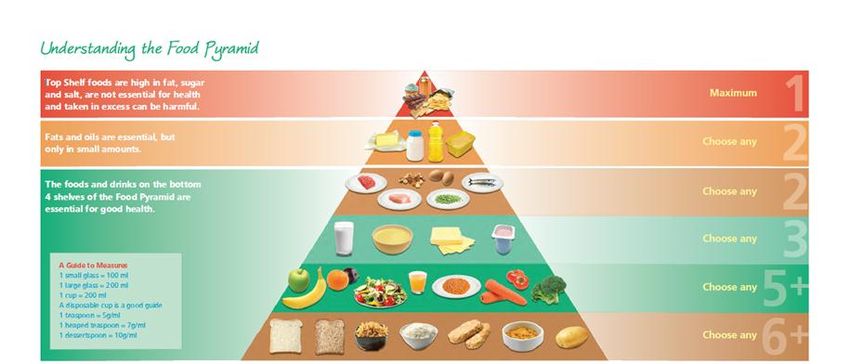
departments e.g. Department of Health. An updated food pyramid (below)
was launched in 2012 with the following changes: in the dairy section,
pregnant women are now recommended to only consume 3 servings a
day instead of 5, oils and fats were differentiated from high fat high sugar
foods and allocated a separate shelf with a recommended intake of 2
servings a day. Whereas previously the top shelf had no servings allocated,
the shelf now advises that food and drinks high in fat, sugar and salt are to
be limited to 1 serving a day.
The Department of Health advise that an average member of the public
consumes per day: 6 or more servings of high fibre varieties of
carbohydrates; 5 or more servings of fruit and vegetables; 3 servings of low
fat dairy foods; 2 servings of protein foods; 2 servings of fats and oils as well
as food and drinks high fat, sugar and salt to be consumed a maximum of 1
serving a day. The food pyramid (Figure 1) outlines this advice.
The seven day menu plan for healthy eating was designed to meet an
average of the recommended dietary allowances for energy, protein and
micronutrients for both male and female adults for the Irish population as
recommended by FSAI, 1999 and the Department of health 2012.
25Figure 1. The Food Pyramid1.
An example of a 7-day healthy eating diet can be found in Appendix 2
1 Reproduced with the kind permission of the Department of Health and Children
26Results
The following table shows the cost of consuming a healthy eating diet
when purchased in a number of different store types.
In the large stores, the cost of a healthy eating diet was
examined both for branded and own label foods.
In large discount stores, where a product was unavailable, the
product price of the large stores was substituted.
In medium sized stores; where a product was unavailable, the
product price of the large stores was substituted
In convenience stores, where a product was unavailable, the
product price of the large stores was substituted.
On average approximately 30% of items had to be sourced in
large stores where they were unavailable in large discount,
medium and convenience stores.
27Table 2. Cost of a healthy eating (HE) diet (€) and percentage (%) of welfare allowance spent
Large Stores Large Discount Stores Medium Stores Convenience Stores
Own Own Own Own
Branded label Average Branded label Average Branded label Average Branded label Average
Cost of HE
diet € 50.24 38.68 44.46 37.90 34.47 36.19 56.49 49.16 52.82 65.78 58.66 62.22
% of
allowance
spent 27 21 24 20 19 19 30 26 28 35 32 33
The minimum weekly social welfare allowance for a single person is €186.One third of this is €62.
Notes on product costing:
1. Where no own label existed for a food, substitution of the branded food for that store category was used as the
consumer may be unable to travel to another store to purchase an own label substitute.
2. Where no food could be purchased, the branded food of the large store was used.
3. Where no branded food existed, substitution of the own label food was used.
28Stage 3: Examination of costs for specialised diets
Specialised diets
The following diets may incur additional financial burden due to the
requirement of particular or specialised foods or foods. These diets are
dealt with individually and examples can be found in the appendices.
High protein, high calorie
Gluten free diet
Low lactose, milk free
Liquidised (altered consistency). Description: A smooth, pouring,
uniform consistency (IASLT, INDI, 2009)
Menu plans for each specialised diet were devised to cover 7 days of
eating in line with advice given by Dietitians and the cost of consuming
each was examined.
Results
Tables 2 - 6 outline the costs of each diet purchased in a number of
different premises. In each store category the cost of each diet was
examined both for branded and own label foods with an average of
between 2-4 items within each product category used in the final
costing.
29High Protein High Calorie diet
At any time, more than 140,000 adults in Ireland are malnourished or at
risk of malnutrition with half being over 65 years of age. The vast
majority of malnourished patients are living in the community with 1 in 3
patients admitted to Irish hospitals being found to be at risk of
malnutrition and over 75% at high risk (Rice & Normand 2012; Elia
&Stratton 2009, BAPEN, 2013)
Compared with normally nourished patients, malnourished patients
have (Schneider et al, 2004; 92(1):105-111; Stratton & Elia (2006);
Stratton et al (2006)
• Threefold greater risk of infection.
• Between two and threefold greater mortality risk, according to age.
• 85% higher risk of hospital admission and re-admission (over 65).
• 30% longer length of hospital stay, on average.
A HPHC diet is based upon fortification of the diet using high protein,
high calorie ingredients and appropriate cooking methods in order to
boost the nutritional value of the foods consumed.
Nutritional support may be required in addition to the HPHC diet
whereby specially formulated nutritional products are taken orally or
administered as liquids via tubes into the stomach or small intestine
(enteral feeding).
An example of a high protein, high calorie diet can be seen in
Appendix 3.
30Table 3. Average cost of a high protein, high calorie (HPHC) diet, percentage (%) of welfare allowance spent, cost of
healthy eating (HE) diet and additional cost above that of HE diet.
Large Stores Large Discount Stores Medium Stores Convenience Stores
Own Own Own Own
Branded label Average Branded label Average Branded label Average Branded label Average
Cost of
HPHC diet
€ 55.06 36.93 45.99 37.80 35.66 36.73 57.49 48.82 53.15 64.31 55.02 59.66
% of
allowance
spent 30 20 25 20 19 20 31 26 29 35 30 32
Cost of HE
diet € 50.24 38.68 44.46 37.90 34.47 36.19 56.49 49.16 52.82 65.78 58.66 62.22
Variance
HE € 4.82 -1.75 1.53 -0.11 1.19 0.54 1.00 -0.34 0.33 -1.48 -3.64 -2.56
Variance
SWA € - -
(€62) -6.94 25.07 -16.01 -24.20 -26.3 -25.27 -4.51 13.18 -8.85 2.31 -6.98 -2.34
The minimum weekly social welfare allowance for a single person is €186.One third of this is €62.
Notes on product costing:
1. Where no own label existed for a food, substitution of the branded food for that store category was used as the
consumer may be unable to travel to another store to purchase an own label substitute.
2. Where no food could be purchased, the branded food of the large store was used.
3. Where no branded food existed, substitution of the own label food was used.
31Gluten free diet
Coeliac Disease is an autoimmune disease and a long term, chronic
condition. It affects 1 in 100 Irish people. It is a condition causing adults
and children to react to the gluten, the protein found in such grains as
wheat, barley and rye. Some people with coeliac disease are also
sensitive to the protein, avenin, found in oats. It is not triggered or
worsened by lifestyle choices, unlike obesity and related conditions
such as high cholesterol, type 2 diabetes or coronary heart disease.
There is no known cure for Coeliac Disease. The only proven treatment
to relieve the symptoms of this disease is strict adherence to a gluten-
free diet.
In untreated coeliac disease, damage to the surface of the small
intestine results in a reduced ability to digest and absorb food and
causes malabsorption of essential nutrients such as iron, folic acid and
calcium.
In infants and children, this can result in health problems such as
faltering growth, unexplained anaemia, chronic diarrhoea and
abdominal distension. In adults, ill health with symptoms of tiredness,
reduced appetite, weight loss, mouth ulcers, abdominal bloating,
diarrhoea and anaemia may occur. In addition, the prevalence of
autoimmune thyroid disease in people with Coeliac Disease is up to 7%
and the prevalence of Type 1 diabetes is between 2 and 10%
Due to the variability of symptoms and the belief that it is not a
common condition, it often goes unrecognised and undiagnosed.
Delayed diagnosis is a concern because of the associated long-term
complications, such as subfertility, osteoporosis, small intestinal
malignancy and lymphoma.
33Basic healthy eating principles still apply with a gluten free (Coeliac)
diet. The substitution of gluten free foods is required where appropriate.
Any food using such ingredients or ingredients based on the grains
listed above are to be avoided, as the only treatment available is
lifelong avoidance of gluten in the diet. Continued vigilance is required
when shopping as ingredients can change without notification.
In order for individuals suffering from Coeliac Disease to meet their
nutritional needs, specialised gluten free foods are substituted for many
of the everyday foods a non-Coeliac would use. These foods can be
homemade or chosen from the variety available in stores. The Coeliac
Society of Ireland produce a booklet on an annual basis listing the
brands of gluten free foods or regular foods that are naturally gluten
free and are suitable for consumption. This booklet acts as a reference
point for their members and was used as a point of reference during
this study.
Enriched, fortified cereal products contribute a large percentage of
iron to the diet. However, gluten-free products tend not to be fortified
and studies have shown that gluten-free cereal products generally
provide lower amounts of iron (Thompson 1999, 2000). Nutritional quality
of gluten-free diets and health of coeliac patients may be
compromised due to limited varieties of ingredients being used (do
Nascimento et al, 2013). In addition, gluten-free foods have poor
availability and are more expensive than their gluten-containing
counterparts. The impact of these findings on dietary compliance and
the quality of life needs to be addressed (Lee et al, 2007, Singh,
Whelan, 2011).
Whilst every effort was made to maintain the same foods as in the
healthy eating diet, this was not always possible due to the lack of the
34gluten free variety of a food being available. Greatest availability was
found in the large and large low cost stores with limited availability in
medium sized and convenience stores. It was also noted that branded
gluten free products contained more fortification with the nutrients
required in greater amounts for good health in coeliac disease and
that these branded products were mainly available in the large stores .
In 2012, the HSE removed all gluten free products from the GMS list,
making them unavailable to patients who qualify for a medical card or
use the drugs payment scheme. Research has shown that coeliac
patients obtain a greater percentage of their intake of nutrients such
as fibre, calcium, iron, carbohydrate and energy from specialist gluten
free products on prescription compared with retail alternatives. The
foods that were cut from the GMS are the staple source of energy in
the diet such as breads, pastas and cereals. Gluten-free products
have been shown to be up to four times more expensive as ordinary
gluten-containing foods.
Studies also show that cost is a major factor in non-compliance with the
diet. The removal of gluten free food on prescription could significantly
impact upon dietary adherence along with nutritional status and result
in an increased risk of long-term health complications such as
osteoporosis, sub-fertility and increased risk of bowel cancer.
It also needs to be borne in mind that patients with Coeliac Disease are
advised to become a member of the Coeliac Society of Ireland and
these results in an additional outlay of €20 which can be substantial for
some.
An example of a gluten free diet can be seen in Appendix 4.
35Table 4. Average cost of a Gluten Free (GF) diet, percentage (%) of welfare allowance spent, cost of healthy eating (HE)
diet and additional cost above that of HE diet.
Large Stores Large Discount Stores Medium Stores Convenience Stores
Own Own Own Own
Branded label Average Branded label Average Branded label Average Branded label Average
Cost of GF
diet € 60.95 51.61 56.28 49.98 46.36 48.17 65.15 58.71 61.93 73.83 69.51 71.67
% of
allowance
spent 33 28 30 27 25 26 35 32 33 40 37 39
Cost of HE
diet € 50.24 38.68 44.46 37.90 34.47 36.19 56.49 49.16 52.82 65.78 58.66 62.22
Variance
HE € 10.71 12.93 11.82 12.08 11.89 11.98 8.67 9.55 9.11 8.05 10.85 9.45
Variance
SWA € -
(€62) -1.05 10.39 -5.72 -12.02 -26.3 -13.83 3.15 -3.29 -0.07 11.83 7.51 9.67
The minimum weekly social welfare allowance for a single person is €186.One third of this is €62.
Notes on product costing:
1. Where no own label existed for a food, substitution of the branded food for that store category was used as the
consumer may be unable to travel to another store to purchase an own label substitute.
2. Where no food could be purchased, the branded food of the large store was used.
3. Where no branded food existed, substitution of the own label food was used.
36Low Lactose, Milk Free Diet
This type of diet is warranted when an individual is either allergic to
dairy foods or intolerant to the sugar contained within i.e. lactose.
Milk allergy is an abnormal response by the body's immune system to
milk and products containing milk. Cow's milk is the usual cause of milk
allergy, but milk from sheep, goats and buffalo also can cause a
reaction (e.g. protein allergy).
It's important to differentiate a true milk allergy from milk protein
intolerance or lactose intolerance. Unlike a milk allergy, intolerance
doesn't involve the immune system. Milk intolerance causes different
symptoms and requires different treatment from a true milk allergy.
Common signs and symptoms of milk protein or lactose intolerance
include digestive problems, such as bloating, gas or diarrhoea, after
consuming milk or products containing milk (Mayo Clinic, 2011). In
children, it is often the case that after a bout of gastroenteritis they can
suffer from a temporary reaction to lactose, however this usually
resolves with time.
Depending on whether a person is allergic or intolerant dictates
whether they need complete avoidance for life or in some more
tolerant cases a reduction in consumption of dairy foods and foods
that contain any ingredients of dairy origin. Presented here is the diet
for complete avoidance. Again, continued vigilance is required when
shopping as ingredients can change without notification.
Whilst every effort was made to maintain the same foods as in the
healthy eating diet, this was not always possible due to the lack of the
dairy free variety of a food being available in all stores. An example of
a low lactose, milk free diet can be seen at Appendix 5.
37Table 5. Average cost of a Low lactose, milk free (LLMF) diet, percentage (%) of welfare allowance spent, cost of healthy
eating (HE) diet and additional cost above that of HE diet.
Large Stores Large Discount Stores Medium Stores Convenience Stores
Own Own Own Own
Branded label Average Branded label Average Branded label Average Branded label Average
Cost of
LLMF diet
€ 51.19 42.81 47.00 38.58 38.01 38.29 55.12 50.60 52.86 65.22 63.35 64.29
% of
allowance
spent 28 23 25 21 20 21 30 27 28 35 34 35
Cost of HE
diet € 50.24 38.68 44.46 37.90 34.47 36.19 56.49 49.16 52.82 65.78 58.66 62.22
Variance
HE € 0.95 4.13 2.54 0.68 3.54 2.11 -1.37 1.45 0.04 -0.56 4.69 2.06
Variance
SWA €
(€62) -10.81 -19.19 -15.00 -23.42 -26.3 -23.71 -6.88 -11.40 -9.14 3.22 1.35 2.29
The minimum weekly social welfare allowance for a single person is €186.One third of this is €62.
Notes on product costing:
1. Where no own label existed for a food, substitution of the branded food for that store category was used as
the consumer may be unable to travel to another store to purchase an own label substitute.
2. Where no food could be purchased, the branded food of the large store was used.
3. Where no branded food existed, substitution of the own label food was used.
38Liquidised (altered consistency) (AC) diet
This diet is used in cases where the individual is no longer able to chew
or swallow normally, this is known as dysphagia. There are many causes
of dysphagia e.g. swallow impairment post stroke, impairment of
swallow post radiotherapy or surgical treatment of cancer of the
mouth, throat, upper oesophagus, or mandible etc. or a neurological
disease such as motor-neuron disease. Candidates for this diet are
seen by the speech and language therapist (SLT) to assess their swallow
and to determine the appropriate altered consistency of the diet.
National guidelines have been published regarding ‘Irish consistency
descriptors for modified fluids and food’ (IASLT, INDI, 2009). A Dietitian
then designs a nutritionally appropriate therapeutic diet. AC diets
generally require fortification in order to meet nutritional requirements
to avoid the malnutrition associated with these conditions.
An example of an AC diet (Texture D) can be seen in appendix 6.
39Table 6. Average cost of an Altered Consistency (AC) diet, Texture D, percentage (%) of welfare allowance spent, cost
of healthy eating (HE) diet and additional cost above that of HE diet.
Large Stores Large Discount Stores Medium Stores Convenience Stores
Own Own Own Own
Branded label Average Branded label Average Branded label Average Branded label Average
Cost of
AC diet € 59.08 43.30 51.19 41.42 39.81 40.62 71.53 61.96 66.75 73.97 65.03 69.50
% of
allowance
spent 32 23 28 22 21 22 38 33 36 40 35 37
Cost of HE
diet € 50.24 38.68 44.46 37.90 34.47 36.19 56.49 49.16 52.82 65.78 58.66 62.22
Variance
HE € 8.85 4.62 6.73 3.52 5.35 4.43 15.04 12.81 13.92 8.19 6.37 7.28
Variance
SWA € -
(€62) -2.92 18.70 -10.81 -20.58 -26.3 -21.38 9.53 -0.04 4.75 11.97 3.03 7.50
The minimum weekly social welfare allowance for a single person is €186.One third of this is €62.
Notes on product costing:
1. Where no own label existed for a food, substitution of the branded food for that store category was used as
the consumer may be unable to travel to another store to purchase an own label substitute.
2. Where no food could be purchased, the branded food of the large store was used.
3. Where no branded food existed, substitution of the own label food was used.
40Table 7. Summary of costs of all diets examined
Large Stores Large Discount Stores Medium Stores Convenience Stores
Own Own Own Own
Branded label Average Branded label Average Branded label Average Branded label Average
Cost of
HE diet € 50.24 38.68 44.46 37.90 34.47 36.19 56.49 49.16 52.82 65.78 58.66 62.22
Cost of
HPHC diet
€ 55.06 36.93 45.99 37.80 35.66 36.73 57.5 48.82 53.15 64.31 55.02 59.66
Cost of
GF diet € 60.95 51.61 56.28 49.98 46.36 48.17 65.15 58.71 61.93 73.83 69.51 71.67
Cost of
LLMF diet
€ 51.19 42.81 47.00 38.58 38.01 38.29 55.12 50.60 52.86 65.22 63.35 64.29
Cost of
AC diet € 59.08 43.30 51.19 41.42 39.81 40.62 71.53 61.96 66.75 73.97 65.03 69.50
The minimum weekly social welfare allowance for a single person is €186.One third of this is €62.
HE = Healthy Eating HPHC = High Protein, High Calorie
GF = Gluten Free LLMF = Low Lactose, Milk Free
AC = Altered Consistency (Liquidised Diet)
41Table 8. Average costs of diets in different store categories versus HE diet
Large Discount
Large Stores Stores Medium Stores Convenience Stores
Average Average
Average % Cost of % Cost of Average %
Cost of increase Brand & increase Brand & % increase Cost of increase
Brand & versus Own versus Own versus HE Brand & versus
Own Label HE diet Label HE diet Label diet Own Label HE diet
Cost of 44.46 36.19 52.82 62.22
HE diet €
Cost of
HPHC diet 45.99 103.44% 36.73 101.49% 53.15 100.6% 59.66
€ 96%
Cost of 56.28 126.59% 48.17 133.10% 61.93 117.25% 71.67
GF diet € 115%
Cost of
LLMF diet 47 105.71% 38.29 105.80% 52.86 100.76% 64.29
€ 103%
Cost of 51.19 115.14% 40.62 112.24% 66.75 126.37% 69.5
AC diet € 112%
The minimum weekly social welfare allowance for a single person is €186.One third of this is €62.
HE = Healthy Eating HPHC = High Protein, High Calorie
GF = Gluten Free LLMF = Low Lactose, Milk Free
AC = Altered Consistency (Liquidised Diet)
42Discussion & Conclusion
43Discussion & Conclusion
As can be seen from the Terms of Reference the aim of this work was to
provide an update of the Diet Report on the Examination of the Cost of
Health Eating and Specialised Diets for a single individual in Ireland –
(published in January 2006 and February 2008).
When shopping for a healthy eating diet, it became apparent that
there were cheaper brands within the branded foods. In the majority of
cases the own label foods were found to be cheaper than the
branded foods. It was also evident in some shops that there were two
types of own label foods, the regular own label food and the “value”
own label foods that were cheaper again.
The Diet Supplement Scheme is based on the assumption that up to
approximately 33% (€62.00) of a weekly social welfare allowance may
be spent on food. The results of the 2004 study showed that an
individual could spend up to 37% of their social welfare allowance on
food for a healthy eating diet. The 2008 publication showed that an
individual in receipt of the minimum social welfare payment could
spend between 18% - 30% of their weekly welfare allowance on foods
for a healthy eating diet. In this 2013 review, an individual could spend
between 19% - 35% of their social welfare allowance on purchasing a
healthy eating diet per week. The range in cost of a healthy eating diet
for an individual was €34.47-€65.78, a difference of €31.31. Similar to the
FSAI findings, the category of store influences greatly the cost of the
diet, the lowest cost was the large discount store and the highest cost
was the convenience store. With the convenience stores being almost
double the cost of the large low cost stores.
Based on the work of the Department of Social and Family Affairs in
implementing the recommendations of the INDI 2006 report and taking
44account of rises in inflation the level of spend by a social welfare
recipient on the foods for their specialised diet has increased from up
to a maximum 35% in 2007 to up to 40% in 2013. From the data shown it
can be seen that a specialised medically prescribed diets such as the
gluten free diet and the liquidised diet do incur additional financial
burden to an individual over and above the cost of a normal healthy
eating diet in an effort to meet their basic nutritional and dietary
requirements.
The 2013 diet costs range as follows:
Table 9: 2013 diet cost ranges
Lowest Store Highest
Diet Cost category cost Store category
Large
Healthy Eating €34.47 discount €65.78 Convenience
High Protein High Large
Calorie €35.66 discount €64.31 Convenience
Large
Gluten Free €46.36 discount €73.83 Convenience
Large
Low Lactose, Milk Free €38.01 discount €64.29 Convenience
Altered Consistency Large
(Liquidised) €39.81 discount €73.97 Convenience
It should be noted that in general choice was limited in the
convenience stores with regard to healthier options e.g. high fibre
breakfast cereals and often significant higher prices were charged for
fresh fruit and vegetables compared with large or discount stores.
Significant variances between own label and branded products were
noted particularly for staple foods such as milk and bread, for example
in a large store 1 litre of branded full fat milk costs €1.15 while
unbranded 0.75 cent. This is particularly evident in convenience stores
where there is a reduced choice in terms of own label products for
staple foods such as milk, spreads, breads, sugar and eggs which
corresponded to significant higher cost for specialised diets requiring
45high fat high sugar foods to increase the energy density of the diet,
e.g. altered consistency (liquidised diet). Furthermore, due to the lack
of the gluten free variety of a food being available it was not always
possible to maintain the same foods as in the healthy eating diet. The
greatest availability for gluten free foods was found in the large stores
and with limited availability in medium sized and convenience stores.
Large discount stores have a significant listing of products in the
coeliac society foods listing book but during this study we found
inconsistency in availability in these stores.
Dietitians in both the community and hospital setting assess patients
nutritional requirements based upon their presenting medical condition
and nutritional consequences of that condition. A major role of the
Dietitian is in providing guidance and adequacy with regard to
specialised diets to enable patients to live as healthy a life as possible.
However, many patients do not have access to a Dietitian in order to
receive the appropriate guidance which may lead to inappropriate
usage of specialised diets.
Changing dietary habits is difficult, especially if the change is imposed
due to a medical diagnosis. Attempts to make changes in the diet can
be affected by many socioeconomic factors including cost of foods,
availability, and accessibility to shops, poor education and lack of
cooking skills. Although outside of the direct scope of this study, the
following factors should be considered with regards to costs of a diet.
Possession of a freezer is an influencing factor as to whether an
individual could avail of the special offers or the cheaper own
label foods. Those living in one-person households have lower
odds of fridge-freezer ownership, as do part-time workers and
those with no education or primary school education only (Leahy
46and Lyons, 2009). It was often the case that larger portions packs
(more than would be sufficient for the week’s intake) of foods
needed to be purchased in order to keep the diet cheaper on a
per unit and per portion basis. Therefore, freezing would be the
only option available to take advantage of such offers without
food wastage.
There is the question to consider as to whether one can take
advantage of such large portion packs due to financial
constraints; therefore the individual may be forced to purchase
the smaller quantities which more often than not work out more
costly overall.
Vigilance and education are required as there are cases where
it would appear to be cheaper to buy double the smaller
quantity rather than the larger pack e.g. 2 x 1 litre carton of milk
could be cheaper than 2-litre carton of the same brand.
The calculations for the cost of each diet do not reflect that a
consumer may need to travel to source food items essential to
the overall improved nutritional profile of their diet. It is noted
that the DSP provides assistance towards travel costs in certain
circumstances and also provides a free travel pass to qualified
persons and their spouses. However, certain circumstances may
impede ability to access public transport and therefore
additional costs may be incurred in accessing private transport.
Dependence on private transport will exacerbate the incidence
of food poverty and the health inequalities consequent upon it
(Morland, Diez Roux, Wing, 2006, Harrington et al, 2008).
47It has been currently and previously found by this study and is
supported by the work of Friel et al, 2004, Wilde, 2011 that by far the
cheapest place to purchase food can be the large low cost stores but
the range of items available there is not exhaustive. The second least
expensive place to purchase foods is in the large stores and is where
the best range of food items is available with both branded and own
label pricing options. Whilst these type of retail outlets have low cost,
health food choices available for purchase, low income groups do not
regularly shop there (Friel et al, 2004, Wilde, 2011). Healthy Food for All
(2009) found that where people shop has a big bearing on the cost of
a healthy diet. It was twice as expensive to purchase a healthy diet in
a local convenience store compared to a multiple supermarket which
corroborates with the research done by the FSAI in 2012 on the cost of
healthy eating in Ireland.
This study also shows that in convenience stores the range of brands
and types of foods available is limited, often without fresh meat, fish,
poultry, vegetables or wholemeal alternatives. The price of foods was
found to be substantially higher when compared to the larger stores
which has been since in several other studies (Cullen, 2006, 2008, Friel et
al, 2004, Healthy Food for All, 2009). One of the biggest issues when
trying to shop for a specialised diet is the lack of availability and range
of foods available to the consumer. Trying to follow the principles of a
specialised diet is difficult as often there is limited variety. It may be
necessary for individuals to find and travel to larger shops or other
areas in order to complete the ingredient list for a diet. This can have a
major financial impact due to the additional costs involved. Friel et al
2004 and Wilde, 2011 found that convenience stores were the most
common type of retail outlet used by the low income groups.
48Specialised foods such as gluten free foods are significantly more
expensive than the ‘regular’ foods, therefore placing an additional
financial burden on individuals that must consume such diets to remain
fit and healthy.
It also needs to be borne in mind that the more specialised the diet
(e.g. Gluten Free); the more the individual is required to frequent the
larger stores in order to be able to purchase the necessary foods.
Typically when purchasing for a specialised diet, one is not able to take
advantage of in store offers for foods, as these are unsuitable for the
diet in question or one does not have the transport options to travel to
the store, has reduced mobility due to age or medical condition.
49RECOMMENDATIONS
50Recommendations
The Dept for Social Protection should consider the following in
examining the diet supplement scheme:
1. The cost of specialised diets in this study ranged from €35.66-
€73.97, which represents a range of 19-40% of weekly social
welfare allowance. The range of costs being influenced mainly
by the shopping location. The cost of the healthy eating diet is
now 35% of the social welfare allowance, based on the highest
cost store (convenience store) and consideration should be
given to the impact this is having on people in the community.
4. The average cost of the gluten free diet is 15-33% more
expensive than a healthy eating diet. As referred to previously, a
healthy diet is composed of a large proportion of high fibre
carbohydrate foods. The removal of the staple carbohydrate
gluten free foods from the GMS scheme has impacted on the
difficulties in sourcing suitable products due to limited availability
and higher costs compared with a regular healthy eating
shopping basket.
5. The average cost of the AC diet is between 12-26% more
expensive than a healthy eating diet. The AC diet is primarily
used in many malnutrition related diseases where swallow is
compromised e.g. post stroke, post radiotherapy or surgical
treatment of cancer of the mouth, throat, upper oesophagus, or
mandible or a neurological disease such as motor-neuron
disease, all of which likely to incur greater costs in general from
the complications arising from malnutrition.
6. This study found that fortification foods used in larger quantities in
the high protein high calorie diet such e.g. full fat milk, cream, fat
51You can also read