FOOD SECURITY AND NUTRITION IN THE WORLD - THE STATE OF IN BRIEF TRANSFORMING FOOD SYSTEMS FOR AFFORDABLE HEALTHY DIETS - Unicef
←
→
Page content transcription
If your browser does not render page correctly, please read the page content below

IN BRIEF

               THE STATE OF
FOOD SECURITY
AND NUTRITION
 IN THE WORLD
   TRANSFORMING FOOD SYSTEMS
  FOR AFFORDABLE HEALTHY DIETS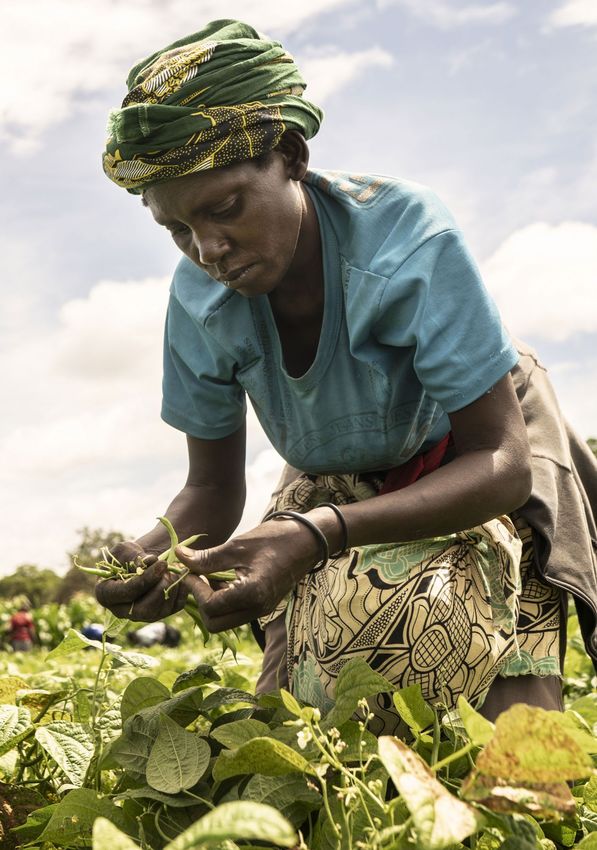
This booklet contains the key messages and content from the publication The State of Food Security and
Nutrition in the World 2020. The numbering of the table and figures corresponds to that publication.
https://doi.org/10.4060/ca9699en

COVER PHOTOGRAPH ©Mint Images
THAILAND. Floating market on a canal in Bangkok, where local boats are laden with fresh food.
                                                                    | 2 |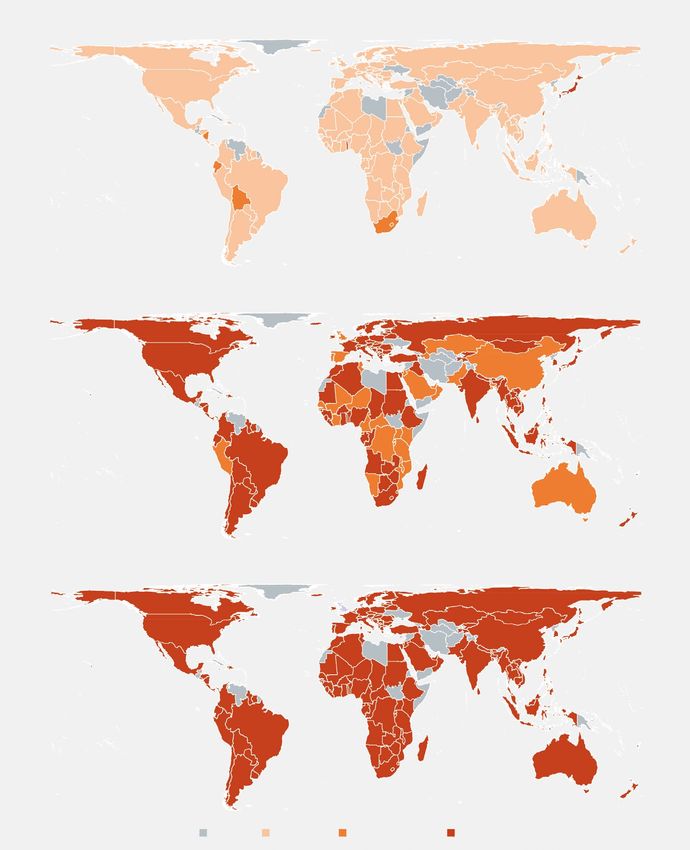
CONTENTS
KEY MESSAGES                                                   4            PART 2
                                                                            TRANSFORMING FOOD SYSTEMS
FOREWORD                                                       7            TO DELIVER AFFORDABLE
                                                                            HEALTHY DIETS FOR ALL                                          23
PART 1
FOOD SECURITY AND NUTRITION                                                 2.1 The cost and affordability of healthy
AROUND THE WORLD IN 2020                                       11           diets around the world                                         23
                                                                                } TABLE 7 The cost of a healthy diet is 60 percent
1.1 Progress towards hunger                                                       higher than the cost of the nutrient adequate diet,
and food insecurity targets                                    11                 and almost 5 times the cost of the energy sufficient
    } FIGURE 1 The number of undernourished people                                diet in 2017                                             27
      in the world continued to increase in 2019. If recent                     } FIGURE 28 A healthy diet is unaffordable for the
      trends are not reversed, the SDG 2.1 Zero Hunger                            poor in every region of the world in 2017                28
      target will not be met                                   12
    } FIGURE 5 If recent trends persist, the distribution                   2.2 The hidden health and environmental
      of hunger in the world will change substantially,                     costs of what we eat                                           29
      making Africa the region with the highest number                          } FIGURE 34 Adoption of any of the four alternative
      of undernourished in 2030                                14                 healthy diet patterns would dramatically decrease
    } FIGURE 7 Moderate or severe food insecurity                                 diet-related health costs by 2030                        31
      affects one quarter of the world population, and it                       } FIGURE 37 Adoption of plant-based dietary patterns
      has been increasing over the past six years. Over half                      would reduce the social cost of GHG emissions by
      of the population in Africa, almost one-third in                            41–74 percent in 2030                                    32
      Latin America and the Caribbean and more than
      one-fifth in Asia are food insecure                      15           2.3 What is driving the cost of nutritious food?               34
                                                                                } FIGURE 39 Protectionary trade policies protect
1.2 Progress towards global nutrition targets                  16                 and incentivize domestic production of staple foods,
    } FIGURE 10 Despite some progress for most indicators,                        such as rice, but often to the detriment of nutritious
      only the 2025 target for exclusive breastfeeding is                         foods in low-income countries                            37
      on track to be achieved. Childhood overweight and
      adult obesity trends need to be reversed                 17           2.4 Policies to reduce the cost of nutritious
                                                                            foods and ensure affordability of healthy diets                38
1.3 The critical link between food security and                                 } FIGURE 41 Policy options to reduce the cost
nutrition outcomes: food consumption                                              of nutritious foods and enhance affordability of
and diet quality                                               19                 healthy diets with complementary policies
    } FIGURE 20 The proportions of different food                                 to promote healthy diets                                 40
      groups available for human consumption differ
      across country income groups: a snapshot of 2017         21
1.4 Conclusions                                                22

                                                                    | 3 |
KEY MESSAGES
è Updates for many countries have made it è The world is not on track to achieve Zero Hunger
possible to estimate hunger in the world with by 2030. If recent trends continue, the number of
greater accuracy this year. In particular, newly people affected by hunger would surpass
accessible data enabled the revision of the entire 840 million by 2030.
series of annual undernourishment estimates for
è A preliminary assessment suggests that the
China back to 2000, resulting in a substantial
downward shift of the series of the number of COVID-19 pandemic may add between 83 and
undernourished in the world. Nevertheless, the 132 million people to the total number of
revision confirms the trend reported in past editions: undernourished in the world in 2020 depending on
the number of people affected by hunger globally the economic growth scenario.
has been slowly on the rise since 2014. è Globally, the burden of malnutrition in all its
è Current estimates are that nearly 690 million forms remains a challenge. According to current
people are hungry, or 8.9 percent of the world estimates, in 2019, 21.3 percent (144.0 million) of
population – up by 10 million people in one year children under 5 years of age were stunted,
and by nearly 60 million in five years. The number 6.9 percent (47.0 million) wasted and 5.6 percent
of people affected by severe food insecurity, which is (38.3 million) overweight.
another measure that approximates hunger, shows a è The world is making progress but is not on
similar upward trend. In 2019, close to 750 million track to achieve the 2025 and 2030 targets for
– or nearly one in ten people in the world – were child stunting and low birthweight, and for
exposed to severe levels of food insecurity. exclusive breastfeeding, is on track only for the
è Considering the total affected by moderate or 2025 target. The prevalence of wasting is notably
severe food insecurity, an estimated 2 billion people above the targets. Most regions are not on track to
in the world did not have regular access to safe, achieve the targets for child overweight. Adult
nutritious and sufficient food in 2019. obesity is on the rise in all regions. Urgent action
is needed to reverse these upward trends.
| 4 |è The nutritional status of the most vulnerable five times more expensive than diets that meet only
population groups is likely to deteriorate further dietary energy needs through a starchy staple.
due to the health and socio-economic impacts of
è The cost of a healthy diet exceeds the
COVID-19.
international poverty line (established at USD 1.90
è Food insecurity can worsen diet quality and purchasing power parity (PPP) per person per day),
consequently increase the risk of various forms of making it unaffordable for the poor. The cost also
malnutrition, potentially leading to undernutrition exceeds average food expenditures in most
as well as overweight and obesity. countries in the Global South: around 57 percent or
more of the population cannot afford a healthy diet
è Low-income countries rely more on staple
throughout sub-Saharan Africa and Southern Asia.
foods and less on fruits and vegetables and animal
source foods than high-income countries. Only in è All diets have hidden costs, which must be
Asia, and globally in upper-middle-income understood to identify trade-offs and synergies
countries, are there enough fruits and vegetables in relation to other SDGs. Two hidden costs that
available for human consumption to be able to are most critical relate to the health (SDG 3) and
meet the FAO/WHO recommendation of climate-related (SDG 13) consequences of our
consuming a minimum of 400 g/person/day. dietary choices and the food systems that
support these.
è While we still face significant challenges in just
accessing food, challenges are even more important è Under current food consumption patterns,
in terms of accessing healthy diets. diet-related health costs linked to mortality and
non-communicable diseases are projected to exceed
è Healthy diets are unaffordable to many people,
USD 1.3 trillion per year by 2030. On the other
especially the poor, in every region of the world. The hand, the diet-related social cost of greenhouse gas
most conservative estimate shows they are emissions associated with current dietary patterns
unaffordable for more than 3 billion people in the is estimated to be more than USD 1.7 trillion per
world. Healthy diets are estimated to be, on average, year by 2030.
| 5 |KEY MESSAGES
è Shifting to healthy diets can contribute to food supply chain, within the food environment,
reducing health and climate-change costs by 2030, and in the political economy that shapes trade,
because the hidden costs of these healthy diets are public expenditure and investment policies.
lower compared to those of current consumption Tackling these cost drivers will require large
patterns. The adoption of healthy diets is projected transformations in food systems with no
to lead to a reduction of up to 97 percent in direct one-size-fits-all solution and different trade-offs
and indirect health costs and 41–74 percent in the and synergies for countries.
social cost of GHG emissions in 2030.
è Countries will need a rebalancing of
è However, not all healthy diets are sustainable agricultural policies and incentives towards more
and not all diets designed for sustainability are nutrition-sensitive investment and policy actions
always healthy. This important nuance is not well all along the food supply chain to reduce food
understood and is missing from ongoing discussions losses and enhance efficiencies at all stages.
and debates on the potential contribution of Nutrition-sensitive social protection policies will
healthy diets to environmental sustainability. also be central for them to increase the purchasing
power and affordability of healthy diets of the
è To increase the affordability of healthy diets, most vulnerable populations. Policies that more
the cost of nutritious foods must come down. The generally foster behavioural change towards
cost drivers of these diets are seen throughout the healthy diets will also be needed.
| 6 |FOREWORD
F
ive years after the world committed to end hunger, food insecurity and all forms
of malnutrition, we are still off track to achieve this objective by 2030. Data tell
us that the world is progressing neither towards SDG target 2.1, of ensuring
access to safe, nutritious and sufficient food for all people all year round, nor towards
target 2.2, of eradicating all forms of malnutrition.
There are many threats to progress. The 2017 and 2018 editions of this report showed
that conf lict and climate variability and extremes undermine efforts to end hunger,
food insecurity and malnutrition. In 2019, the report showed that economic slowdowns
and downturns also undercut these efforts. In 2020, the COVID-19 pandemic, as well as
unprecedented desert locust outbreaks in Eastern Africa, are obscuring global
economic prospects in ways no one could have anticipated, and the situation may only
get worse if we do not act urgently and take unprecedented action.
The most recent estimate for 2019 shows that prior to the COVID-19 pandemic, almost
690 million people, or 8.9 percent of the global population, were undernourished. This
estimate is based on new data on population, food supply and more importantly, new
household survey data that enabled the revision of the inequality of food consumption
for 13 countries, including China. Revising the undernourishment estimate for China
going back to the year 2000 resulted in a significantly lower number of undernourished
people worldwide. This is because China has one-fifth of the global population. Despite
this, the trend reported in past editions of this report still stands: since 2014, the
number of hungry people worldwide has been slowly rising. The new estimate for 2019
has revealed that an additional 60 million people have become affected by hunger since
2014. If this trend continues, the number of undernourished people will exceed
840 million by 2030. Hence, the world is not on track to achieve Zero Hunger, even
without the negative effects that COVID-19 will likely have on hunger. Preliminary
projections based on the latest available global economic outlooks, also presented in
this report, suggest that the COVID-19 pandemic may add an additional 83 to
132 million people to the ranks of the undernourished in 2020.
| 7 |FOREWORD
Beyond hunger, a growing number of people have had to reduce the quantity and quality
of the food they consume. Two billion people, or 25.9 percent of the global population,
experienced hunger or did not have regular access to nutritious and sufficient food in
2019. This situation could deteriorate if we do not act immediately and boldly.
These trends in food insecurity contribute to increasing the risk of child malnutrition,
as food insecurity affects diet quality, including the quality of children’s and women’s
diets, and people’s health in different ways. Hence, as painful as it is to accept, it is
unsurprising that the burden of child malnutrition remains a threat around the world:
in 2019, 21.3 percent (144.0 million) of children under 5 years of age were estimated to
be stunted, 6.9 percent (47.0 million) wasted and 5.6 percent (38.3 million) overweight,
while at least 340 million children suffered from micronutrient deficiencies. The good
news is that between 2000 and 2019, the global prevalence of child stunting declined by
one-third. However, the world is not on track to achieve the global nutrition targets,
including those on child stunting, wasting and overweight by 2030. Furthermore, adult
obesity is on the rise in all regions. Projections for 2030, even without considering a
potential global recession, serve as an added warning that the current level of effort is
not anywhere near enough to end malnutrition in the next decade.
We can still succeed, but only by ensuring all people’s access not only to food, but to
nutritious foods that make up a healthy diet. With this report, all five agencies are
sending a strong message: A key reason why millions of people around the world suffer
from hunger, food insecurity and malnutrition is because they cannot afford the cost of
healthy diets. Costly and unaffordable healthy diets are associated with increasing food
insecurity and all forms of malnutrition, including stunting, wasting, overweight and
obesity. Food supply disruptions and the lack of income due to the loss of livelihoods
and remittances as a result of COVID-19 means that households across the globe are
facing increased difficulties to access nutritious foods and are only making it even more
difficult for the poorer and vulnerable populations to have access to healthy diets.
It is unacceptable that, in a world that produces enough food to feed its entire
population, more than 1.5 billion people cannot afford a diet that meets the required
levels of essential nutrients and over 3 billion people cannot even afford the cheapest
healthy diet. People without access to healthy diets live in all regions of the world; thus,
we are facing a global problem that affects us all.
Current food consumption patterns also generate what this year’s report calls “hidden
costs” related to health costs (SDG 3) and climate-change costs (SDG 13). If current food
consumption patterns continue, diet-related health costs linked to mortality and
diet-related non-communicable diseases are projected to exceed USD 1.3 trillion per
| 8 |T H E S TAT E O F FO O D S ECU RI T Y A N D N U T RI T I O N I N T H E WO RL D 2020 IN BRIEF
year by 2030. The diet-related social cost of greenhouse gas emissions associated with
current dietary patterns is estimated to reach more than USD 1.7 trillion per year by
2030. Both of these hidden costs are a significant underestimation. The environmental
costs do not account for other negative environmental impacts and the health costs do
not account for the negative impacts of undernutrition due to data constraints. In light
of this evidence, it is clear that the adoption of healthy diets that include sustainability
considerations can significantly reduce these hidden costs, generating important
synergies with other SDGs.
We must look throughout the food system to address the factors that are driving up the
cost of nutritious foods. This means supporting food producers – especially small-scale
producers – to get nutritious foods to markets at low cost, making sure people have
access to these food markets, and making food supply chains work for vulnerable people
– from small-scale producers to the billions of consumers whose income is simply
insufficient to afford healthy diets.
Clearly, then, we face the challenge of transforming food systems to ensure that no one
is constrained by the high prices of nutritious foods or the lack of income to afford a
healthy diet, while we ensure that food production and consumption contribute to
environmental sustainability. However, there is no one-size-fits-all solution for
countries, and policymakers will need to assess the context-specific barriers, manage
trade-offs and maximize synergies – such as potential environment gains – to achieve
the required transformations.
We trust that the recommendations in this report, once tailored to each country context,
will help governments to reduce the cost of nutritious foods, make healthy diets
affordable for everyone and enable vulnerable people working in food systems to earn
decent incomes that enhance their own food security. This will set in motion a
transformation of existing food systems that makes them resilient and sustainable.
Areas of policy emphasis should include rebalancing of agricultural policies and
incentives towards more nutrition-sensitive investment; and policy actions all along
food supply chains, with a focus on nutritious foods for healthy diets, to reduce food
losses, create opportunities for vulnerable small-scale producers and others working in
food systems, and enhance efficiencies. Nutrition-sensitive social protection policies will
also be central to increase the purchasing power and affordability of healthy diets by
the most vulnerable populations. An enabling environment should also be promoted by
policies that, more generally, improve the nutritional quality of the food produced and
available on the market, support the marketing of diverse and nutritious food, and
provide education and information for fostering individual and social behaviour change
towards healthy diets.
| 9 |FOREWORD
These policy recommendations are in line with key recommendations under the
United Nations Decade of Action on Nutrition, 2016–2025. We believe that the analysis
conducted and policy recommendations provided in this report will also help set the
agenda for the first UN Food Systems Summit, which will take place in 2021 with the
overarching goal of helping stakeholders better understand and manage complex
choices that affect the future of food systems and their needed transformation to
significantly accelerate progress towards achieving the SDGs by 2030.
Our agencies stand firmly committed to support a shift that makes healthy diets
affordable to all and contributes to the eradication of hunger, food insecurity and all
forms of malnutrition in children and adults. Our efforts shall ensure that this shift
unfolds in a sustainable way, for people and the planet, and creates synergies to spur
progress on other SDGs.
Qu Dongyu Gilbert F. Houngbo Henrietta H. Fore
FAO Director-General IFAD President UNICEF Executive Director
David Beasley Tedros Adhanom Ghebreyesus
WFP Executive Director WHO Director-General
| 10 |PART 1
FOOD SECURITY AND NUTRITION AROUND THE WORLD IN 2020
F
ive years into the 2030 Agenda, resulting in a substantial downward shift of the series
it is time to assess progress and of the number of undernourished in the world.
to question whether continuing Nevertheless, the revision confirms the trend
efforts implemented thus far will allow
reported in past editions of this report: the number of
countries to reach SDG 2 targets. For
people affected by hunger globally has been slowly
this reason, this year’s report
complements the usual assessment of on the rise since 2014.
the state of food security and nutrition è Current estimates are that nearly 690 million
in the world with projections of what
people are hungry, or 8.9 percent of the world
the world may look like in 2030 if
population – up by 10 million people in one year
trends of the last decade continue.
Importantly, as the COVID-19 pandemic and by nearly 60 million in five years.
continues to evolve, this report è Despite the re-assessment of the extent of hunger in
attempts to foresee some of the impacts
China, the majority of the world’s undernourished –
of this global pandemic on food
381 million – are still found in Asia. More than
security and nutrition. However, given
that the full extent of the devastation
250 million live in Africa, where the number of
that COVID-19 will cause is still largely undernourished people is growing faster than in any
unknown, it is important to recognize other region of the world.
that any assessment at this stage is
è The number of people affected by severe food
subject to a high degree of uncertainty
and should be interpreted with caution.
insecurity, which is another measure that approximates
hunger, also shows an upward trend. In 2019, close to
750 million – or nearly one in ten people in the world
1.1 PROGRESS TOWARDS – were exposed to severe levels of food insecurity.
HUNGER AND FOOD
è Considering the total affected by moderate or severe
INSECURITY TARGETS
levels of food insecurity, an estimated 2 billion people in
KEY MESSAGES the world did not have regular access to safe, nutritious
and sufficient food in 2019.
è Updates for many countries have made it
possible to estimate hunger in the world with greater è The world is not on track to achieve Zero Hunger by
accuracy this year. In particular, newly accessible data 2030. If recent trends continue, the number of people
enabled the revision of the entire series of annual affected by hunger will surpass 840 million by 2030,
undernourishment estimates for China back to 2000, or 9.8 percent of the population.
| 11 |PART 1
FIGURE 1 THE NUMBER OF UNDERNOURISHED PEOPLE IN THE WORLD CONTINUED TO INCREASE IN 2019.
IF RECENT TRENDS ARE NOT REVERSED, THE SDG 2.1 ZERO HUNGER TARGET WILL NOT BE MET
20% 1 000
825.6 841.4
15% 678.1 687.8 750
628.9
PERCENTAGE
12.6%
MILLIONS
10% 500
9.8%
8.6% 8.9% 8.9%
5% 250
0% 0
2005 2006 2007 2008 2009 2010 2011 2012 2013 2014 2015 2016 2017 2018 2019* ... 2030**
YEARS
Prevalence of undernourishment (percentage) Number of undernourished (millions)
NOTES: Projected values in the figure are illustrated by dotted lines and empty circles. The shaded area represents projections for the longer period from 2019
to the 2030 target year. The entire series was carefully revised to reflect new information made available since the publication of the last edition of the report;
it replaces all series published previously. * See Box 2 in the report for a description of the projection method. ** Projections to 2030 do not consider the
potential impact of the COVID-19 pandemic.
SOURCE: FAO.
è A preliminary assessment suggests that the COVID-19 prevalence of undernourishment (PoU),
pandemic may add between 83 and 132 million people had unfortunately ended. Additional
to the total number of undernourished in the world in evidence and several important data
updates, including a revision of the
2020. The expected recovery in 2021 would bring the
entire PoU series for China back to 2000,
number of undernourished down but still above what was
shows that almost 690 million people in
projected in a scenario without the pandemic.
the world (8.9 percent of the world
population) are estimated to have been
SDG Indicator 2.1.1 undernourished in 2019 (Figure 1). Revision
Prevalence of undernourishment (PoU) in light of the new data, which results in
The three most recent editions of this a parallel downward shift of the entire
report already presented evidence that global PoU series, confirms the
the decades-long decline in hunger in conclusion of past editions of this report:
the world, as measured using the the number of people affected by hunger
| 12 |T H E S TAT E O F FO O D S ECU RI T Y A N D N U T RI T I O N I N T H E WO RL D 2020 IN BRIEF
in the world continues to increase in 2019. Yet, the PoU in the population
slowly. This trend started in 2014 and for the region is 8.3 percent, below the
extends to 2019. There are nearly world average (8.9 percent), and less
60 million more undernourished people than half of that of Africa. Asia has
now than in 2014, when the prevalence shown progress in reducing the number
was 8.6 percent – up by 10 million of hungry people in recent years, down
people between 2018 and 2019. by 8 million since 2015.
The reasons for the observed increase of In Latin America and the Caribbean, the
the last few years are multiple. Much of PoU was 7.4 percent in 2019, below the
the recent increase in food insecurity can world prevalence of 8.9 percent, which
be traced to the greater number of still translates into almost 48 million
conf licts, often exacerbated by undernourished people. The region has
climate-related shocks. Even in some seen a rise in hunger in the past few
peaceful settings, food security has years, with the number of undernourished
deteriorated as economic slowdowns people increasing by 9 million between
challenge access to food for the poor. 2015 and 2019.
The evidence also reveals that the world In terms of the outlook for 2030, Africa
is not on track to achieve the SDG 2.1 is significantly off track to achieve the
Zero Hunger target by 2030. Combined Zero Hunger target in 2030. If recent
projections of recent trends in the size rates of increase persist, the PoU will
and composition of the population, in the rise from 19.1 to 25.7 percent. Latin
total food availability, and in the degree America and the Caribbean is also off
of inequality in food access point to an track, even though at a much lower level.
increase of the PoU by 1 percentage Mostly due to deterioration in recent
point. As a result, the global number of years, the trend will bring the PoU from
undernourished people in 2030 would 7.4 percent in 2019 to 9.5 in 2030. Asia,
exceed 840 million. while making progress, will also not
achieve the target by 2030 based on
The PoU in Africa was 19.1 percent of recent trends.
the population in 2019, or more than
250 million undernourished people, Overall, and without considering the
up from 17.6 percent in 2014. This effects of COVID-19, projected trends in
prevalence is more than twice the undernourishment would change the
world average (8.9 percent) and is the geographic distribution of world hunger
highest among all regions. dramatically (Figure 5, right chart).
While Asia would still be home to almost
Asia is home to more than half of the 330 million hungry people in 2030, its
total undernourished people in the share of the world’s hunger would shrink
world – an estimated 381 million people substantially. Africa would overtake
| 13 |PART 1
FIGURE 5 IF RECENT TRENDS PERSIST, THE DISTRIBUTION OF HUNGER IN THE WORLD WILL CHANGE
SUBSTANTIALLY, MAKING AFRICA THE REGION WITH THE HIGHEST NUMBER OF UNDERNOURISHED IN 2030
OCEANIA OCEANIA
2.4 (0.4%) 3.4 (0.4%)
NORTHERN AMERICA NORTHERN AMERICA
LATIN AMERICA AND EUROPE LATIN AMERICA AND EUROPE
AND THE CARIBBEAN n.r. (0.9%) AND THE CARIBBEAN n.r. (1.0%)
47.7 (6.9%) 66.9 (7.9%)
AFRICA
250.3 (36.4%)
ASIA AFRICA
329.2 (39.1%) 433.2 (51.5%)
ASIA
381.1 (55.4%)
2019*: TOTAL 687.8 MILLION 2030**: TOTAL 841.4 MILLION
NOTES: Number of undernourished people in millions. * Projected values. ** Projections to 2030 do not consider the potential impact of the COVID-19 pandemic.
n.r. = not reported, as the prevalence is less than 2.5 percent.
SOURCE: FAO.
Asia to become the region with the of undernourished in the world in 2020
highest number of undernourished depending on the economic growth
people, accounting for 51.5 percent scenario (losses ranging from 4.9 to
of the total. 10 percentage points in global GDP
growth). The expected recovery in 2021
At the time of this writing, the would bring the number of
COVID-19 pandemic was spreading undernourished down but still above
across the globe, clearly posing a what was projected in a scenario
serious threat to food security. without the pandemic. It is important to
Preliminary assessments based on the recognize that any assessment at this
latest available global economic stage is subject to a high degree of
outlooks suggest that the COVID-19 uncertainty and should be interpreted
pandemic may add between 83 and with caution.
132 million people to the total number
| 14 |T H E S TAT E O F FO O D S ECU RI T Y A N D N U T RI T I O N I N T H E WO RL D 2020 IN BRIEF
FIGURE 7 MODERATE OR SEVERE FOOD INSECURITY AFFECTS ONE QUARTER OF THE WORLD POPULATION, AND IT
HAS BEEN INCREASING OVER THE PAST SIX YEARS. OVER HALF OF THE POPULATION IN AFRICA, ALMOST ONE-THIRD
IN LATIN AMERICA AND THE CARIBBEAN AND MORE THAN ONE-FIFTH IN ASIA ARE FOOD INSECURE
60
51.4 50.6 51.6
49.4
50
46.3 46.5
40
33.0 32.4 32.6
31.2 32.0 31.6 31.7
PERCENTAGE
29.7 29.7 29.4
30
25.8 25.9 25.1
24.8
23.2 22.6 22.3 22.9
22.4 22.4
20.6
19.4 18.9 18.9 22.7 22.4 22.1
20
21.4
16.4 16.3
16.3
14.1 14.4 15.1 13.5 13.2 18.7
15.8
11.4 11.4 11.8 13.0
9.4 9.4 8.8
10 18.5 18.3 19.0
8.5 7.6 7.9
16.7 16.8 18.2
9.7 8.0 7.6 9.1 8.0 8.0 7.5 7.2
8.3 7.9 8.1 8.6 9.4 7.5 7.1 9.2 8.1 9.3 9.2 9.6 6.7 6.9
7.1 6.4
0 1.4 1.4 1.3 1.2 1.0 1.1
2014
2015
2016
2017
2018
2019
2014
2015
2016
2017
2018
2019
2014
2015
2016
2017
2018
2019
2014
2015
2016
2017
2018
2019
2014
2015
2016
2017
2018
2019
WORLD AFRICA ASIA LATIN AMERICA NORTHERN AMERICA
AND THE CARIBBEAN AND EUROPE
Moderate food insecurity Severe food insecurity
NOTES: Differences in total are due to rounding of figures to the nearest decimal point.
SOURCE: FAO.
SDG Indicator 2.1.2 2019. This is also broadly consistent with
Prevalence of moderate or severe food recent trends in the PoU in the world and
insecurity in the population, based on the FIES across regions, with the partial exception
The latest estimates suggest that of Asia (Figure 7).
9.7 percent of the world population
(slightly less than 750 million people) was While the 746 million people facing
exposed to severe levels of food severe food insecurity are of utmost
insecurity in 2019. In all regions of the concern, an additional 16 percent of the
world except Northern America and world population, or more than
Europe, the prevalence of severe food 1.25 billion people, have experienced
insecurity has increased from 2014 to food insecurity at moderate levels.
| 15 |PART 1
People who are moderately food 1.2 PROGRESS TOWARDS
insecure do not have regular access to GLOBAL NUTRITION TARGETS
nutritious and sufficient food, even if
not necessarily suffering from hunger. KEY MESSAGES
The prevalence of both moderate and è Globally, the burden of malnutrition in all its forms
severe levels of food insecurity (SDG remains a challenge. According to estimates, in 2019,
Indicator 2.1.2) is estimated to be 21.3 percent (144.0 million) of children under 5 years
25.9 percent in 2019 for the world as a of age were stunted, 6.9 percent (47.0 million) wasted
whole. This translates into a total of and 5.6 percent (38.3 million) overweight.
2 billion people. Total food insecurity
è The world is making progress but is not on track to
(moderate or severe) has consistently
increased at the global level since 2014,
achieve the 2025 and 2030 targets for child stunting
mostly because of the increase in and low birthweight, and for exclusive breastfeeding,
moderate food insecurity. is on track only for the 2025 target. The prevalence of
wasting is notably above the targets.
Although Africa is where the highest
è Central Asia, Eastern Asia and the Caribbean have
levels of total food insecurity are
the largest rates of reduction in the prevalence of
observed, it is in Latin America and the
Caribbean where food insecurity is rising
stunting and are the only subregions on track to achieve
the fastest: from 22.9 percent in 2014 to the 2025 and 2030 stunting targets.
31.7 percent in 2019, due to a sharp è Most regions are not on track to achieve the
increase in South America. targets for child overweight. Adult obesity is on the
rise in all regions.
In terms of the distribution of total food
insecure (moderate or severe) people in
the world, out of the 2 billion people Worldwide, the prevalence of child
suffering from food insecurity, stunting was 21.3 percent in 2019, or
1.03 billion are in Asia, 675 million in 144 million children. Although there has
Africa, 205 million in Latin America and been some progress, rates of stunting
the Caribbean, 88 million in Northern reduction are far below what is needed
America and Europe, and 5.9 million in to reach the World Health Assembly
Oceania. At the global level, the (WHA) target for 2025 and the SDG
prevalence of food insecurity at target for 2030. If recent trends continue,
moderate-or-severe level, and severe level these targets will only be achieved in
only, is higher among women than men. 2035 and 2043, respectively (Figure 10).
The gender gap in accessing food
increased from 2018 to 2019, particularly In 2019, more than nine out of ten
at the moderate or severe level. n stunted children lived in Africa or Asia,
representing 40 percent and 54 percent
of all stunted children in the world, »
| 16 |T H E S TAT E O F FO O D S ECU RI T Y A N D N U T RI T I O N I N T H E WO RL D 2020 IN BRIEF
FIGURE 10 DESPITE SOME PROGRESS FOR MOST INDICATORS, ONLY THE 2025 TARGET FOR EXCLUSIVE
BREASTFEEDING IS ON TRACK TO BE ACHIEVED. CHILDHOOD OVERWEIGHT AND ADULT OBESITY TRENDS
NEED TO BE REVERSED
STUNTING OVERWEIGHT WASTING*
60 60 60
40 40 40
AARR = 2.3
20 20 20
AARR = −0.9
0 0 0
2012 2019 2025 2030 2012 2019 2025 2030 2019 2025 2030
PREVALENCE (%)
LOW BIRTHWEIGHT EXCLUSIVE BREASTFEEDING ADULT OBESITY
60 60 60
AARI = 2.5
40 40 40
AARR = 1.0 AARR = −2.6
20 20 20
0 0 0
2012 2015 2025 2030 2012 2019 2025 2030 2012 2016 2025 2030
Trend Target
NOTES: * No projection over time is generated for wasting, as it is an acute condition that can change frequently and rapidly over the course of a calendar
year, not captured by input data available. Average Annual Rate of Reduction (AARR) and Average Annual Rate of Increase (AARI) are calculated using all
data from 2008 onwards for stunting, overweight and low birthweight (recent trend period), and from 2012 (baseline) for the other indicators.
SOURCES: UNICEF, WHO & World Bank. 2020. UNICEF-WHO-World Bank: Joint child malnutrition estimates - levels and trends in child malnutrition: key findings
of the 2020 edition. [online]. data.unicef.org/resources/jme, www.who.int/nutgrowthdb/estimates, data.worldbank.org/child-malnutrition; NCD Risk Factor
Collaboration (NCD-RisC). 2017. Worldwide trends in body-mass index, underweight, overweight, and obesity from 1975 to 2016: a pooled analysis of 2416
population-based measurement studies in 128.9 million children, adolescents, and adults. The Lancet, 390(10113): 2627–2642; UNICEF & WHO. 2019.
UNICEF-WHO Joint Low Birthweight Estimates. [online]. [Cited 28 April 2020]. www.unicef.org/reports/UNICEF-WHO-low-birthweight-estimates-2019;
www.who.int/nutrition/publications/UNICEF-WHO-lowbirthweight-estimates-2019; UNICEF. 2020. UNICEF Global Database on Infant and Young Child
Feeding. In: UNICEF [online]. New York, USA. [Cited 28 April 2020]. data.unicef.org/topic/nutrition/infant-and-young-child-feeding
| 17 |PART 1
» respectively. Most regions have made Globally, as of 2019, it was estimated
some progress in reducing stunting that 44 percent of infants aged less
between 2012 and 2019 but not at the than six months were exclusively
rate needed to achieve the 2025 and 2030 breastfed. Currently, the world is on
targets. Globally, stunting estimates vary track to achieve the 2025 target of at
by wealth. Children from the poorest least 50 percent of babies younger than
wealth quintile had a stunting prevalence six months being exclusively breastfed.
that was more than double that of If additional efforts are not made,
children from the richest quintile. however, the global target for 2030 of
at least 70 percent will not be achieved
The global prevalence of overweight before 2038. Most subregions are
among children under 5 years of age making at least some progress, except
has not improved, going from Eastern Asia and the Caribbean. If the
5.3 percent in 2012 to 5.6 percent, Eastern Africa, Central Asia and
or 38.3 million children, in 2019. Southern Asia subregions maintain
Of these, 24 percent lived in Africa their current rates of progress, they
and 45 percent in Asia. Australia and will reach the targets set for both 2025
New Zealand is the only subregion with and 2030.
a very high prevalence (20.7 percent).
Southern Africa (12.7 percent) and Adult obesity continues to rise, from
Northern Africa (11.3 percent) have 11.8 percent in 2012 to 13.1 percent in
prevalences considered high. 2016 and is not on track to reach the
global target to halt the rise in adult
Globally, 6.9 percent of children under obesity by 2025. If the prevalence
5 (47 million) were affected by wasting continues to increase by 2.6 percent per
in 2019 – a figure significantly above year, adult obesity will increase by
the 2025 target (5 percent) and the 2030 40 percent by 2025, compared to the
target (3 percent) for this indicator. 2012 level. All subregions show
increasing trends in the prevalence of
Worldwide, 14.6 percent of infants adult obesity between 2012 and 2016. n
were born with low birthweight
(less than 2 500 g) in 2015. The trends
for this indicator at global and regional
levels show that some progress has been
made in recent years, but not enough to
achieve the target of a 30 percent
reduction in low birthweight by 2025
or even by 2030.
| 18 |T H E S TAT E O F FO O D S ECU RI T Y A N D N U T RI T I O N I N T H E WO RL D 2020 IN BRIEF
1.3 THE CRITICAL LINK Diet quality comprises four key aspects:
BETWEEN FOOD SECURITY variety/diversity, adequacy, moderation,
AND NUTRITION OUTCOMES: and overall balance. According to WHO,
FOOD CONSUMPTION AND a healthy diet protects against
malnutrition in all its forms, as well as
DIET QUALITY non-communicable diseases (NCDs) such
as diabetes, heart disease, stroke and
KEY MESSAGES cancer. It contains a balanced, diverse
è The exact make-up of a healthy diet varies and appropriate selection of foods eaten
depending on individual characteristics, cultural over a period of time. A healthy diet
context, local availability of foods and dietary customs, ensures that a person’s needs for
macronutrients (proteins, fats and
but the basic principles of what constitutes a healthy
carbohydrates including dietary fibres)
diet remain the same.
and essential micronutrients (vitamins
è There are large discrepancies in the per capita and minerals) are met, specific to their
availability of foods from different food groups across gender, age, physical activity level and
different country income groups. Low-income physiological state. Healthy diets include
countries rely more on staple foods and less on fruits less than 30 percent of total energy intake
from fats, with a shift in fat consumption
and vegetables and animal source foods than
away from saturated fats to unsaturated
high-income countries.
fats and the elimination of industrial
è Only in Asia, and globally in upper-middle-income trans fats; less than 10 percent of total
countries, are there enough fruits and vegetables energy intake from free sugars (preferably
available for human consumption to be able to meet less than 5 percent); consumption of at
the FAO/WHO recommendation of consuming a least 400 g of fruits and vegetables per
day; and not more than 5 g per day of salt
minimum of 400 g/person/day.
(to be iodized). While the exact make-up
è Globally, only one in three children 6 to of a healthy diet varies depending on
23 months of age meets the recommended minimum individual characteristics, as well as
dietary diversity, with wide variation among the cultural context, locally available foods
regions of the world. and dietary customs, the basic principles
of what constitutes a healthy diet are
è Diet quality is negatively affected by food the same.
insecurity, even at moderate levels of severity. People
who experience moderate or severe food insecurity Global assessment of food consumption
consume less meat, and fewer dairy products and and diet quality poses many challenges.
fruits and vegetables, than those who are food secure To date, there is no single, validated
or mildly food insecure. composite index to measure the
multiple dimensions of diet quality
across all countries.
| 19 |PART 1
Trends in food availability Asia showed the largest increase in the
Data on food availability at the country total amount of animal source foods
level show large discrepancies in the available.
per capita availability of foods from
different food groups across different The contribution from animal source
country income groups. Low-income foods varies with the country income
and lower-middle-income countries group. It is higher in high-income
rely heavily on staple foods like cereals, countries (29 percent) compared to
roots, tubers and plantains. Overall, upper-middle and lower-middle-income
the availability of staple foods for the countries (20 percent), and lowest in
world has changed little between low-income countries (11 percent)
2000 and 2017. Availability of roots, (Figure 20).
tubers and plantains increased in
lower-middle-income countries, driven
by a rise in Africa, whereas it Dietary diversity
decreased in high-income countries. According to UNICEF, dietary diversity
in infants and young children was low
In low-income countries, cereals, in the majority of the regions, with less
roots, tubers and plantains represent than 40 percent of children meeting
nearly 60 percent of all food available minimum dietary diversity in seven out
in 2017 (Figure 20). This percentage of the eleven subregions. In addition,
decreases gradually with country there are stark disparities in the
income groups, down to 22 percent in prevalence of minimum dietary
high-income countries. diversity by the place of residence
(urban/rural) and wealth status.
The world average availability of fruits The prevalence of children eating foods
and vegetables increased; however, from at least five out of eight food
only in Asia, and globally in groups is on average 1.7 times higher
upper-middle-income countries, are among children living in urban
there enough fruits and vegetables households than in rural, and among
available to meet the FAO/WHO those living in the richest households
recommendation of consuming a compared to the poorest.
minimum of 400 g per day.
Availability of animal source foods How does food insecurity affect
overall is highest in high-income what people eat?
countries, but it is growing rapidly in An analysis of dietary patterns
upper-middle-income countries. Most of according to levels of food insecurity
the global increases in animal source found that diet quality worsens with
foods were observed in lower- and increasing severity of food insecurity. »
upper-middle-income countries.
| 20 |T H E S TAT E O F FO O D S ECU RI T Y A N D N U T RI T I O N I N T H E WO RL D 2020 IN BRIEF
FIGURE 20 THE PROPORTIONS OF DIFFERENT FOOD GROUPS AVAILABLE FOR HUMAN CONSUMPTION DIFFER
ACROSS COUNTRY INCOME GROUPS: A SNAPSHOT OF 2017
A) EDIBLE QUANTITIES AVAILABLE
UPPER-MIDDLE-INCOME
WORLD HIGH-INCOME
COUNTRIES
COUNTRIES
8.1% 6.7% 5.2%
9.1%
13.1% 11.2%
27.5% 22.2% 28.8%
34.4% 20.1%
37.7%
15.6% 16.2%
7.6% 13.0%
10.0%
2.7%
1.6% 7.4% 1.8%
TOTAL 1 416 TOTAL 1 687 TOTAL 1 709
g/capita/day g/capita/day g/capita/day
LOWER-MIDDLE-INCOME LOW-INCOME
COUNTRIES COUNTRIES
4.8% 6.5% 3.3% 4.5%
14.6%
20.8% 6.5%
3.3% 44.5% 5.1%
4.0% 58.3%
16.1% 7.7%
TOTAL 1 146 TOTAL 974
g/capita/day g/capita/day
Cereals, roots, tubers and plantains Eggs and dairy Pulses, seeds and nuts Other
Fruits and vegetables Fish and meat Sugar and fats
NOTES: The estimates presented here are adjusted for food losses that happen along part of the supply chain, from post-harvest up to (and including) retail,
and are adjusted for inedible portions. The “other” group includes beverages (i.e. alcoholic, fruit juice, fruit juice concentrate, vegetable juice, vegetable juice
concentrate and sweetened beverages), stimulants (tea, coffee and cocoa), spices and condiments, and sugar-preserved fruits. For more details about the food
groupings, see Annex 2 in the report.
SOURCE: FAO.
| 21 |PART 1
» The ways in which moderately food As for nutrition, progress is being made
insecure people modify their diets vary on decreasing child stunting and low
according to the income level of the birthweight and on increasing exclusive
country. In two lower-middle-income breastfeeding for the first six months of
countries studied (Kenya and Sudan), life. However, the prevalence of wasting
there is a marked decrease in is notably above the targets and the
consumption of most food groups, and prevalence of both child overweight and
an increase in the share of staples in adult obesity is increasing in almost all
the diet. In two upper-middle-income regions. COVID-19 is expected to
countries examined (Mexico and exacerbate these trends, rendering
Samoa), people who are moderately vulnerable people even more vulnerable.
food insecure consume more foods that
are typically cheaper on a per-calorie Increasing availability of and access to
basis (cereals, roots, tubers and nutritious foods that comprise healthy
plantains), and consume lesser diets must be a key component of
amounts of expensive foods (meat and stronger efforts to achieve the 2030
dairy), compared with those who are targets. The remaining years of the UN
food secure. Mexico in particular Decade of Action on Nutrition 2016–2025
shows a decrease in fruit and dairy present an opportunity for policymakers,
consumption as the severity of food civil society and the private sector to
insecurity increases. n work together and accelerate efforts. n
1.4 CONCLUSIONS
With ten years to go until 2030, the
world is off track to achieve the SDG
targets for hunger and malnutrition.
After decades of long decline, the
number of people suffering from hunger
has been slowly increasing since 2014.
Beyond hunger, a growing number of
people have been forced to compromise
on the quality and/or quantity of the
food they consume, as ref lected in the
increase in moderate or severe food
insecurity since 2014. Projections for
2030, even without considering the
potential impact of COVID-19, serve as a
warning that the current level of effort
is not enough to reach Zero Hunger ten
years from now.
| 22 |PART 2
TRANSFORMING FOOD SYSTEMS TO DELIVER AFFORDABLE
HEALTHY DIETS FOR ALL
P
art 2 of this year’s report looks affordable healthy diets for everyone,
closely at the cost and while tackling trade-offs and making the
affordability of healthy diets. most of synergies for environmental
As noted in Part 1, diet quality is a sustainability.
critical link between food security and
nutrition outcomes that needs to be
present as part of all efforts to achieve 2.1 THE COST AND
the hunger, food security and nutrition AFFORDABILITY OF HEALTHY
targets of SDG 2. Meeting these targets DIETS AROUND THE WORLD
will only be possible if we ensure that
people have enough food to eat, and that KEY MESSAGES
what they are eating is nutritious.
è Analyses conducted for this report show that healthy
One of the biggest challenges to diets cost 60 percent more than diets that only meet the
achieving this is the current cost and requirements for essential nutrients and almost 5 times
affordability of healthy diets. New as much as diets that meet only the dietary energy
evidence presented in this part of the needs through a starchy staple.
report shows that healthy diets are
è The cost of a diet increases incrementally as the diet
unaffordable for many people in every
region of the world, especially for the quality increases – from a basic energy sufficient diet to
poor and those facing economic a nutrient adequate diet and then a healthy diet
challenges. However, the story does not including more diversified and desirable food groups
end here, because there are also hidden – across all regions and country income groups globally.
costs and externalities associated with
è The high cost and unaffordability of healthy diets
current food consumption patterns,
is associated with increasing food insecurity and
notably those related to the health and
environmental consequences of our
different forms of malnutrition, including child stunting
dietary choices. and adult obesity.
è Healthy diets – that reflect global guidelines and
Further, this part of the report also include foods from several groups and have greater
identifies the main drivers behind the
diversity within food groups – are unaffordable for
high cost of nutritious foods and
more than 3 billion people, and more than 1.5 billion
provides guidance on policy and
investments for countries to transform
people cannot even afford a diet that only meets
their food systems to provide access to required levels of essential nutrients.
| 23 |PART 2
è The cost of a healthy diet is much higher than the healthy diet is, the greater the
international poverty line, established at USD 1.90 prevalence of undernourishment (PoU)
purchasing power parity (PPP) per day. This puts and child stunting becomes. The
healthy diets beyond the reach of those living in association between adult obesity and
poverty or just above the poverty line. affordability of a healthy diet is the
inverse of the other associations.
è Food systems transformation is required to High-income countries have the
address the problem of millions of people not being highest affordability figures for the
able to afford healthy diets because of high food healthy diet and, at the same time,
price and income constraints. At the same time, this the highest rates of adult obesity.
transformation should create supportive food
environments, encourage people to learn about
nutrition and spur behaviour change that can lead Healthy diets are unaffordable for many
to healthy food choices. people in all regions of the world, especially
the poor
New evidence presented below shows
Cost and affordability of healthy diets are that healthy diets are unaffordable to
critical for food security and nutrition many people, especially for the poor, in
The world faces immediate challenges of every region of the world. This evidence
making healthy diets accessible for emanates from analysing the estimated
everyone, an essential requirement in cost of three reference diets denoting
meeting the hunger and nutrition targets increasing levels of diet quality,
of SDG 2. The COVID-19 pandemic has starting from a basic energy sufficient
made the situation even more difficult. diet meeting calorie needs, to a
One of the biggest challenges is the nutrient adequate diet and then a
current cost and unaffordability of healthy diet, the latter including an
healthy diets. estimation of recommended intake of
more diversified and desirable food
What does the evidence tell us? groups. Subsequently, the affordability
The cost and affordability of the foods – or cost relative to people’s income –
that form a healthy diet are important of the three diets was estimated and
determinants of food choices. As such, compared across regions and country
they can affect food security, nutrition income groups.
and health. The cost refers to what people
have to pay to secure a specific diet. The ultimate aim of the analysis
Affordability, on the other hand, is the presented is to measure whether the food
cost of the diet relative to income. system brings the three levels of diet
quality within reach of the poorest, using
New analysis in this report shows that, those foods that meet each standard at
across regions and country income the lowest possible cost.
groups, the more unaffordable a
| 24 |T H E S TAT E O F FO O D S ECU RI T Y A N D N U T RI T I O N I N T H E WO RL D 2020 IN BRIEF
Analysis of cost and affordability of three diets It is estimated that more than
Lowest cost of the three diets 3 billion people in the world could not
around the world afford a healthy diet in 2017.1 Most of
As expected, the cost of a diet these people live in Asia (1.9 billion) and
increases incrementally as the diet Africa (965 million), although there are
quality increases. This pattern holds millions that live in Latin America and
across all regions and country income the Caribbean (104.2 million), and in
groups (Table 7). The cost of a healthy Northern America and Europe
diet is 60 percent higher than the cost (18 million).
of the nutrient adequate diet, and
almost 5 times the cost of the energy Countries in food crisis face even greater
sufficient diet. challenges in accessing a healthy diet,
especially countries with a protracted
To understand what is driving the high crisis situation which are characterized
cost of healthy diets, we need to look at by complex, multidimensional conf licts
cost contribution of each food group in and extreme fragility. In these contexts,
a healthy diet to identify the most most or 86 percent of the population
costly food groups. An analysis of the cannot afford a healthy diet. This is
percentage share of the total cost of more than double the world average
each food in a healthy diet shows that figure (38 percent) and is 57 percent
the highest-cost food groups are those higher than what is estimated for the
that are more nutritious: dairy, fruits, Global South.
vegetables and protein-rich foods
(plant-based and animal source), with These findings imply that: i) the cost of
some variations by region. nutritious foods that constitute healthy
diets need to decrease, particularly
Affordability of the three diets nutritious foods that contribute to a
around the world healthy diet including dairy, fruits,
The affordability analysis shows that vegetables and protein-rich foods; and
while most of the poor around the ii) poverty lines may need to rise, as they
world can afford an energy sufficient are the basis for programme targets and
diet, as defined here, they cannot social safety net programmes, and
afford either a nutrient adequate or a currently do not provide a good gauge of
healthy diet (Figure 28). A healthy diet is people’s ability to access even the
far more expensive than the full value least-cost versions of a healthy diet.
of the international poverty line of
USD 1.90 PPP per day, let alone the
upper bound portion of the poverty line
that can credibly be reserved for food
1
To estimate the cost of the aforementioned three diets, this report uses retail
prices from the World Bank’s International Comparison Program (ICP) for
of USD 1.20 PPP per day. internationally standardized items for 2017, which was the most updated
available at the time of writing.
| 25 |KENYA Women harvesting French beans at one of Kenya's Njukini Corporative farms. ©FAO/Fredrik Lerneryd
T H E S TAT E O F FO O D S ECU RI T Y A N D N U T RI T I O N I N T H E WO RL D 2020                                    IN BRIEF

TABLE 7 THE COST OF A HEALTHY DIET IS 60 PERCENT HIGHER THAN THE COST OF THE NUTRIENT ADEQUATE DIET, AND ALMOST
5 TIMES THE COST OF THE ENERGY SUFFICIENT DIET IN 2017
  Regions                                                     Energy sufficient diet                 Nutrient adequate diet                         Healthy diet
  WORLD                                                                    0.79                                    2.33                                     3.75

  AFRICA                                                                   0.73                                    2.15                                     3.87

  Northern Africa                                                          0.75                                    2.90                                     4.12

  Sub-Saharan Africa                                                       0.73                                    2.06                                     3.84

     Eastern Africa                                                        0.61                                    1.98                                     3.67

     Middle Africa                                                         0.73                                    2.09                                     3.73

     Southern Africa                                                       0.86                                    2.29                                     3.99

     Western Africa                                                        0.80                                    2.05                                     4.03

  ASIA                                                                     0.88                                    2.18                                     3.97

  Central Asia                                                             0.84                                    2.04                                     3.39

  Eastern Asia                                                             1.27                                    2.63                                     4.69

  South-eastern Asia                                                       0.92                                    2.42                                     4.20

  Southern Asia                                                            0.80                                    2.12                                     4.07

  Western Asia                                                             0.74                                    1.87                                     3.58

  LATIN AMERICA AND THE CARIBBEAN                                          1.06                                    2.83                                     3.98

  Caribbean                                                                1.12                                    2.89                                     4.21

  Latin America                                                            1.00                                    2.78                                     3.75

     Central America                                                       1.13                                    3.04                                     3.81

     South America                                                         0.91                                    2.61                                     3.71

  OCEANIA                                                                  0.55                                    2.07                                     3.06

  NORTHERN AMERICA AND EUROPE                                              0.54                                    2.29                                     3.21

  COUNTRY INCOME GROUPS

  LOW-INCOME COUNTRIES                                                     0.70                                    1.98                                     3.82

  LOWER-MIDDLE-INCOME COUNTRIES                                            0.88                                    2.40                                     3.98

  UPPER-MIDDLE-INCOME COUNTRIES                                            0.87                                    2.52                                     3.95

  HIGH-INCOME COUNTRIES                                                    0.71                                    2.31                                     3.43
  NOTES: The table shows the USD cost per person per day of the three reference diets (energy sufficient, nutrient adequate and healthy diet) by region and country
  income group in 2017. The analysis is based on a sample of 170 countries for which retail food price data are available in year 2017. Prices are obtained from the World
  Bank’s International Comparison Program (ICP) for internationally standardized items, converted to international dollars using purchasing power parity (PPP). The cost
  of each diet represents a simple average of the cost incurred by countries belonging to a specific region or country income group. In the report, see Box 10 for the
  definition of the three diets and Box 11 for a brief description of the cost methodology. For the full methodological notes and data sources, see Annex 3 in the report.
  SOURCE: Herforth, A., Bai, Y., Venkat, A., Mahrt, K., Ebel, A. & Masters, W.A. 2020. Cost and affordability of healthy diets across and within countries. Background paper
  for The State of Food Security and Nutrition in the World 2020. Rome, FAO.

                                                                                  | 27 |
PART 2
FIGURE 28 A HEALTHY DIET IS UNAFFORDABLE FOR THE POOR IN EVERY REGION OF THE WORLD IN 2017
A) COST OF AN ENERGY SUFFICIENT DIET COMPARED WITH THE INTERNATIONAL POVERTY LINE
B) COST OF A NUTRIENT ADEQUATE DIET COMPARED WITH THE INTERNATIONAL POVERTY LINE
C) COST OF A HEALTHY DIET COMPARED WITH THE INTERNATIONAL POVERTY LINE
No data < USD 1.20 USD 1.20−USD 1.90 > USD 1.90
NOTES: The maps show the cost of the three reference diets (energy sufficient, nutrient adequate and healthy diet) compared with the international poverty line
(USD 1.90 purchasing power parity (PPP) per day) for 170 countries in year 2017. A diet is considered unaffordable when its cost exceeds USD 1.20, i.e. 63 percent
of USD 1.90 PPP per day. The 63 percent accounts for a portion of the poverty line that can be credibly reserved for food. In the report, see Box 10 for the
definition of the three diets and Boxes 11 and 12 for a brief description of the cost and affordability methodology. For the full methodological notes and data
sources, see Annex 3 in the report. For disclaimers on map boundary lines, see Annex 5 in the report.
SOURCE: Herforth, A., Bai, Y., Venkat, A., Mahrt, K., Ebel, A. & Masters, W.A. 2020. Cost and affordability of healthy diets across and within countries. Background
paper for The State of Food Security and Nutrition in the World 2020. Rome, FAO.
| 28 |You can also read