Extreme storm tides in the German Bight (North Sea) and their potential for amplification
←
→
Page content transcription
If your browser does not render page correctly, please read the page content below
Nat. Hazards Earth Syst. Sci., 20, 1985–2000, 2020
https://doi.org/10.5194/nhess-20-1985-2020
© Author(s) 2020. This work is distributed under
the Creative Commons Attribution 4.0 License.
Extreme storm tides in the German Bight (North Sea) and their
potential for amplification
Iris Grabemann1 , Lidia Gaslikova1 , Tabea Brodhagen2 , and Elisabeth Rudolph2
1 Helmholtz-Zentrum Geesthacht, Max-Planck-Straße 1, 21502 Geesthacht, Germany
2 Bundesanstalt für Wasserbau, Wedeler Landstraße 157, 22559 Hamburg, Germany
Correspondence: Lidia Gaslikova (lidia.gaslikova@hzg.de)
Received: 22 October 2019 – Discussion started: 29 November 2019
Revised: 25 May 2020 – Accepted: 3 June 2020 – Published: 15 July 2020
Abstract. Storm tides are a major hazard for the German creases the highest water levels by several decimetres in the
North Sea coasts. For coastal protection and economic activ- narrow upstream part of the Ems estuary. This effect dimin-
ities, planning information on the probability and magnitude ishes downstream. The sea level rise increases the water level
of extreme storm tides and their possible future changes is in the downstream part of the Ems estuary by the amount ap-
important. This study focuses on the most extreme events and plied at the model boundary to the North Sea. In the upstream
examines whether they could have become more severe un- part, its influence on the water level decreases.
der slightly different conditions while still remaining within This study may serve as a first step towards an impact as-
physical plausibility. sessment for severe storm tides and towards implications for
In the face of a limited number of observational data on coastal zone management in times of climate change.
very severe events, an extensive set of model data is used to
extract most extreme storm tide events for locations in the
German Bight, in particular Borkum and the Ems estuary.
The data set includes water levels and respective atmospheric 1 Introduction
conditions from a hindcast and future climate realizations
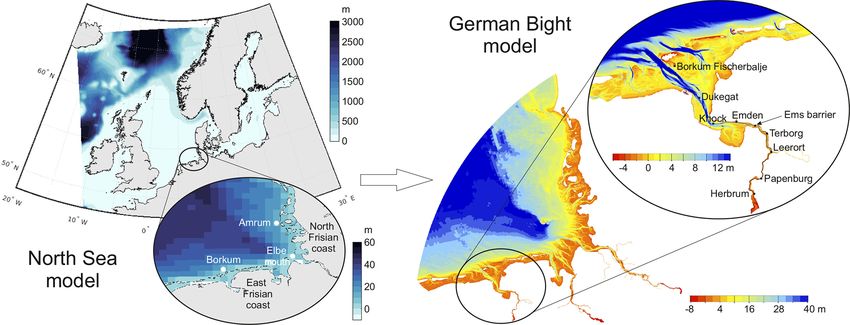
without sea level rise describing today’s and possible future The North Sea (Fig. 1), lying at temperate latitudes (51 to
conditions. 62◦ N), is exposed to the impact of storms mainly occurring
A number of very severe events with water levels exceed- from September to April. Storm tides accompanied by severe
ing those measured near Borkum since 1906 are identified winds represent a major natural hazard for low-lying coastal
in the data set. A possible further amplification of the high- areas.
est events is investigated by simulating these events for the In modern times, two major storm tide disasters that
North Sea with different phase lags between the astronom- caused large damage at the North Sea coasts occurred in the
ical tide given at the open model boundaries and the wind years 1953 and 1962. Since then coastal defences have been
forcing. It is found that superposition of spring tide condi- significantly improved along the German coastline. For ex-
tions, different timing of the astronomical high water and at- ample, the main dikes were reinforced, secondary dikes were
mospheric conditions during the highest storm event would introduced and storm surge barriers were constructed to pro-
cause an enhancement of the highest water level up to about tect coasts of adjoined rivers. Mainly due to these measures
50 cm. more recent storms, e.g. in 1976 or 2013, caused no severe
The water levels of the two highest events from the data damage although water levels higher than those of 1962 have
set are used to analyse the effects in the Ems estuary using been observed at various coastal sections (e.g. NLWKNa,
a high-resolution model of the German Bight. Additionally, 2010; NLWKNb, 2007). Nevertheless, risk of flooding is still
the influences of an extreme river runoff and of sea level present and may increase due to the effects of expected cli-
rise are studied. The extreme river runoff of 1200 m3 s−1 in- mate change. Thus, the rise in the mean sea level may lead
not only to an increase in the height of the storm tides and
Published by Copernicus Publications on behalf of the European Geosciences Union.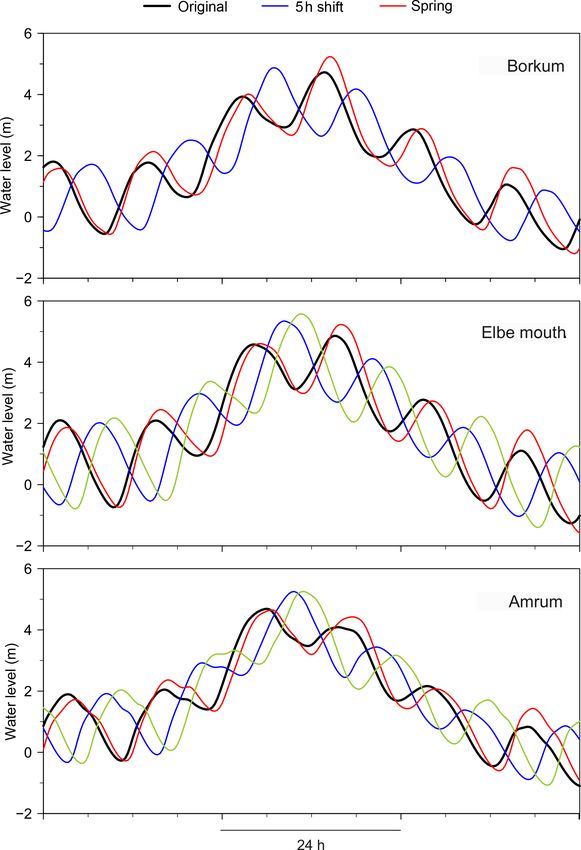
1986                                                                  I. Grabemann et al.: Extreme storm tides in the North Sea

Figure 1. Model domains for the North Sea and German Bight models with distributions of water depths and enlargements of the German
Bight and the Ems estuary, respectively. The black line in the enlargement of the Ems estuary denotes the longitudinal profile for which the
highest high waters were extracted.

longer duration of water levels exceeding certain thresholds            quences. To identify extreme storm tide events, we initially
(e.g. Idier et al., 2019, and references therein) but also to           search through an extensive set of modelled met-ocean data,
shorter arrival times of the storm tide at the coast and in the         which increases the chances of detecting the unprecedented
estuaries (e.g. Arns et al., 2015a). These effects, among oth-          events compared to usage of only historical data. Further, we
ers, may aggravate risks related to storm tides and may have            explore the potential of such events to become even more se-
consequences not only for coastal protection, e.g. for the dike         vere under physically plausible assumptions.
heights or the warning times, but also for such issues as the              There are several key processes determining water level
drainage of low-lying coastal areas.                                    increase during a storm, and their modification may lead to
   Coastal protection and adaptation measures are usually a             an enhancement of identified extreme events. Among others,
long-term effort. Information about the probabilities of very           variations in the atmospheric conditions leading to changes
severe storm tides and their possible changes in the future             in storm track and/or intensity over the sea may entail alter-
is needed for planning and design of coastal defences and               ations in the storm tides near the coast. In particular, in the
protection, for risk assessment, and for the assessment of              project MUSE, Jensen et al. (2006) took a dynamic ensemble
whether or not planned adaptation measures are adequate or              approach. They analysed the extent to which amplification of
robust for a given location. This information is usually as-            observed storm tides could be caused by various atmospheric
sessed and provided in the form of high percentiles or re-              developments of observed storms. The atmospheric varia-
turn values obtained from frequency distribution estimates.             tions in this case were represented by different timings of
There is a spectrum of methods used to construct such esti-             initial conditions used for the atmospheric forecast and cor-
mates (e.g. Debernard and Røed, 2008; Arns et al., 2015b;               responding ensemble simulations. Another study held within
Santamaria-Aguilar et al., 2017 for dynamical modelling ap-             the project XtremRisK (Gönnert et al., 2013; Oumeraci et al.,
proach, Wahl et al., 2011, for stochastic modelling approach            2015) developed a more combinatorial approach, merging es-
or Dangendorf et al., 2013, for processing of tide gauge ob-            timates of various storm tide components such as surge, ex-
servations). In the present study we are interested in the spa-         ternal surge, tides and their non-linear interactions derived
tial and temporal evolution of particular very severe storm             from observation. Both studies were mainly focused on the
tide events in coastal areas and estuaries and, thus, diverge           Elbe estuary and resulted in constructing and investigating
from the statistical approach. So far, more detailed infor-             events exceeding the observed ones.
mation on and assessment of particular events that are ex-                 Without changing the atmospheric forcing, possible ampli-
tremely severe and rare are uncommon. Potential sources of              fications can occur due to different configurations of existing
such events comprise historical data as well as modelled data           atmospheric situations and astronomical tide. In particular,
for the past, present and future.                                       altered timing of atmospheric storm relative to the tidal phase
   The present study aims to identify and assess individual             may lead to variations in maximum water level. In addition
extreme events that are highly unlikely but that are still phys-        to semidiurnal tidal variations, the longer fluctuations in the
ically possible and plausible and may have extreme conse-               tidal components can be considered, reflecting the situation

Nat. Hazards Earth Syst. Sci., 20, 1985–2000, 2020                                       https://doi.org/10.5194/nhess-20-1985-2020
I. Grabemann et al.: Extreme storm tides in the North Sea                                                                     1987

where a particular atmospheric storm may coincide with a           2     Study area, models, data and experiments
spring tide instead of a neap tide. In the present study, we
pursue this strategy to investigate the potential for very se-     2.1    Hydrographic properties
vere storm tides to be amplified.
   Whereas Jensen et al. (2006) looked at particular observed      The south-eastern and north-western coasts of the German
storms and the amplification of their peak water levels, the       Bight (Fig. 1) are mainly endangered by storm winds from
current study deals with a large set of met-ocean hindcast         westerly to northwesterly and from southwesterly to westerly
and climate realizations to detect extraordinary storm events,     directions, respectively. The tidal wave propagates anticlock-
focusing on both storm tide height and duration. The cli-          wise from the East Frisian to the North Frisian coast. Due to
mate realizations used, comprising CMIP3 and CMIP5 sce-            the funnel-shaped German Bight, the mean tidal range in-
narios, reflect only the changes in the atmospheric conditions     creases from about 2.4 m near Borkum near the outer border
and do not include mean sea level rise and local bathymet-         of the Ems estuary to about 3 m in the outer Elbe estuary and
ric changes. A variety of future climate realizations under-       decreases to about 2.6 m near Amrum (e.g. DGJa, 2014). In
lines large uncertainties regarding possible future changes in     outer parts of the estuaries of the Ems, Weser and Elbe the
the storm climate for the region of interest (e.g. Feser et al.,   mean tidal range can exceed 3 m (e.g. Niemeyer and Kaiser,
2015; Ganske et al., 2016). We assume that extremes from           1999). Thus, a specific storm in the southern North Sea has
the climate realizations used also represent plausible events      different influences on the water levels at the different coastal
for the present climate conditions as storm statistics in these    strips and in the estuaries.
simulations show no or minor significant changes until 2100           The Ems estuary is situated in the German Bight at the
in combination with very strong inter-decadal variability for      border between the Netherlands and Germany (Fig. 1). Com-
wind speed and surge levels (e.g. Gaslikova et al., 2013).         ing from the wide mouth of the estuary near the island of
   From this met-ocean data set, the most extreme storm tide       Borkum, it narrows towards Knock but widens again into the
events were selected for three parts of the German Bight –         Dollart bay south of Emden. Upstream of the Dollart the nar-
the East Frisian and North Frisian coasts and Elbe mouth           row and shallower part of the Ems estuary begins. The influ-
(Fig. 1). A set of dynamical large-scale water level simula-       ence of the tide can be observed up to Herbrum. At the mouth
tions was produced to examine whether the identified storm         of the Ems near Borkum the tide is characterized by a mean
tides could have become more extreme under different con-          tidal high water (MHW) of NHN + 1.15 m and mean tidal
stellations of peak winds and tides. Here, a regional hydrody-     low water (MLW) of NHN − 1.31 m (DGJa, 2014; NHN –
namic model in a 2D mode, which covers the North Sea and           Normalhöhennull – presents the standard elevation zero of
parts of the north-east Atlantic to ensure the incorporation of    the German reference height system). In the centre of the es-
external surges, was used.                                         tuary at Emden the mean tidal range increases to 3.28 m with
   To investigate local effects of such extremely severe events    MHW = NHN + 1.48 m and MLW = NHN − 1.80 m (DGJb,
near the coast and specifically in the estuaries, the Ems es-      2018). The mean freshwater discharge into the Ems estuary
tuary was chosen for further experiments and analyses. The         is 80 m3 s−1 ; the highest discharge that has been observed is
estuary represents one of the main German estuaries. In ad-        1200 m3 s−1 (February 1946; DGJb, 2018). Large freshwater
dition to dikes along the North Sea coast and the whole es-        discharges occur frequently in the months from January to
tuary, the upper Ems estuary is protected by a storm surge         April (Krebs and Weilbeer, 2008).
barrier. Operating the barrier influences the water levels both
upstream and downstream of the barrier (Rego et al., 2011;         2.2     North Sea model for the large-scale simulations
BAW, 2007). Such effects under extreme storm tide condi-
tions are of additional interest. The town Emden, as an ex-        All water level simulations for the North Sea were performed
ample of a typical harbour town with importance for ma-            with the hydrodynamic model TRIM-NP. The model TRIM-
rine trade, was chosen as a focus point within the estuary.        NP (tidal, residual, intertidal mudflat – nested and paral-
To adequately transfer the acquired extreme storm tides to         lelized; Kapitza and Eppel, 2000; Pätsch et al., 2017) is
the coasts and assess their impact within an estuary, a more       based on the model TRIM developed by Casulli and Cat-
detailed hydrodynamic model for the German Bight includ-           tani (1994) and was used in 2D mode. The model domain
ing the German estuaries has been used (Fig. 1). Additional        covers the North Sea and adjacent parts of the north-east At-
factors, which may lead to the amplification of water levels       lantic (Fig. 1) to allow for the generation of realistic exter-
at the coast and which are more relevant at local scales and       nal surges. The model solves the Reynolds-averaged Navier–
in shallow water (because of the effects of varying river dis-     Stokes equations on a regular Arakawa C grid with Cartesian
charge and possible future sea level rise), were considered        coordinates and is used in the present study with a resolu-
and incorporated in the sensitivity study here.                    tion of 12.8 km ×12.8 km without further nesting. The model
                                                                   time step was 4 min, and the output was stored every 20 min.
                                                                   Drying and wetting of near-shore points is enabled. The wa-
                                                                   ter level simulations were driven by the 10 m height wind

https://doi.org/10.5194/nhess-20-1985-2020                                 Nat. Hazards Earth Syst. Sci., 20, 1985–2000, 2020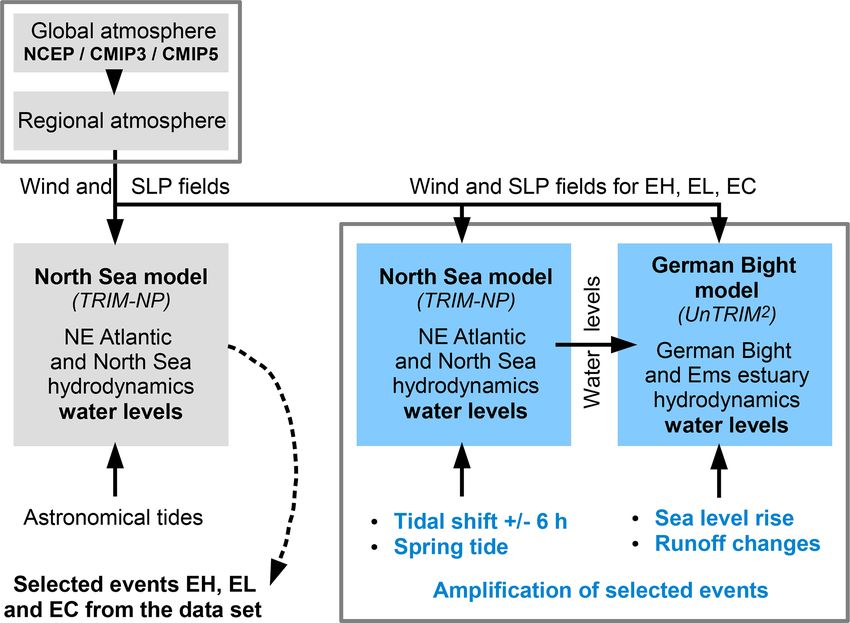
1988                                                               I. Grabemann et al.: Extreme storm tides in the North Sea

speed and direction and mean sea level pressure fields from          tion of the storm surge barrier in the case of a sea level rise
the atmospheric data mentioned above and by astronomical             of 100 cm, the height of the gates is increased from 7 m (two
tides from the FES atlas (Lyard et al., 2006) at the lateral         gates) and 8 m (five gates) in nature (NLWKNb, 2007) to 9 m
open boundaries. The wind influence is parameterized us-             in the model.
ing an approach from Smith and Banke (1975). While this
approach is based on wind speed measurements between 3               2.4   Data set
and 21 m s−1 , which are exceeded during storm surges, pre-
vious studies have shown that this approach is suitable for          A set of numerical simulations for which atmospheric as well
the North Sea and applicable for storm surges (Jensen et al.,        as marine data are available is required for the detection and
2006). The model has been validated against tide gauge ob-           ranking of extreme storm tides and subsequent modifications.
servations at the German coasts. For a detailed description of       Furthermore, a desired homogeneity and comparability of re-
the original water level simulations and model performance           sulting water level fields suggests that the local water level
see Gaslikova et al. (2013) and Weisse et al. (2014).                data should be simulated with the same hydrodynamic model
                                                                     for the North Sea. However, the global and regional atmo-
2.3    German Bight model for the fine-grid simulations              spheric conditions may and should vary in their origins to en-
                                                                     sure a diversity of possible storm and storm tide events. Thus,
For the high-resolution modelling of the German Bight and            the set of underlying atmospheric conditions comprises a
the attached estuaries of the rivers Ems, Weser and Elbe             multi-decadal hindcast (Geyer, 2014) for the period 1948–
(Fig. 1), the hydrodynamic numerical model UnTRIM2 (Ca-              2016 based on downscaled NCEP–NCAR global reanalysis
sulli, 2008) is used.                                                (Kalnay et al., 1996) and six downscaled climate change re-
   UnTRIM2 is a 3D finite-difference–finite-volume numer-            alizations. In detail, the global climate realizations include
ical model. It solves the shallow water equations and the            four CMIP3 members for the SRES A1B and B1 scenarios
transport equation of salt on an unstructured orthogonal grid        (e.g. Nakicenovic and Swart, 2000; Houghton et al., 2001)
(Casulli and Walters, 2000). The use of the subgrid technol-         covering the period 2001–2100 and corresponding present-
ogy described by Casulli (2008) allows for discretizing the          day conditions for 1960–2000. Other realizations include two
model bathymetry with a much finer resolution than the com-          CMIP5 members for the AR5 RCP8.5 scenario (e.g. Stocker
putational grid. In areas like the German Wadden Sea with its        et al., 2013; Taylor et al., 2010) for the periods 2006–2100
large tidal flats, this allows for the describing of dry and wet     or 2071–2100 and corresponding present-day conditions for
areas in greater detail as well as better representation of the      1971–2005 or 1971–2000. The climate simulations were ob-
water volume. Thus, the bathymetry can be captured in detail         tained with different global models (ECHAM5-MPIOM, e.g.
while the computations can still be performed on a relatively        Röckner et al., 2003, and Marsland et al., 2003; EC-EARTH
coarse grid. As a result, large time steps can be used and the       as part of EURO-CORDEX, e.g. Hazeleger et al., 2010; and
computational costs are kept low. The algorithm also guaran-         CMCC, Scoccimarro et al., 2011) using different initial con-
tees conservation of mass and water depths greater than zero         ditions. The global atmospheric realizations from these sim-
regardless of time step size and is unconditionally stable.          ulations as well as the hindcast were downscaled with differ-
   The German Bight model is forced by wind, river runoff,           ent regional circulation models (different versions of CCLM,
salinity and water level. For these simulations, the same wind       e.g. Rockel et al., 2008, and Hollweg et al., 2008, and RCA4,
fields as for the North Sea model are used. In UnTRIM2 , the         e.g. Samuelsson et al., 2011), providing regional atmospheric
wind parameterization is similar to that in TRIM-NP. River           climate realizations for the north-east Atlantic. These re-
runoff is applied at the upstream end of the estuaries. For          gional atmospheric data from the hindcast and climate pro-
the Ems, a constant runoff of 80 m3 s−1 (average for 1942–           jections were used to force the hydrodynamic model TRIM-
2015; DGJb, 2018) is applied. Water level and salinity are           NP (North Sea model) and to obtain water levels in the North
applied at the open boundary towards the North Sea (Fig. 1).         Sea and the north-east Atlantic (e.g. Gaslikova et al., 2013;
Water levels were derived from the North Sea simulations             Weisse et al., 2014; Weisse et al., 2015). The resulting set of
with TRIM-NP. A constant salinity of 33 psu is used, which           water level data is used for further analysis in this study and
is a common value for that region of the North Sea (BSH,             is referred to as the “data set” further on. For the entire data
2016).                                                               and model flow see also Fig. 2.
   The storm surge barrier (Fig. 1) is included in the subgrid          The climate realizations do not include any rise in mean
topography of the model and can be operated at run-time.             sea level. Water level changes are due to changes in the at-
Based on the balance between coastal protection and nature           mospheric forcing only. Furthermore, possible changes in
conservation, the barrier should protect the estuary against         bathymetry over the course of time are neglected in the hind-
storm tides higher than NHN + 3.70 m. The barrier is closed          cast as well as in the climate realizations.
when water levels at the barrier exceed NHN + 3.50 m, and it
is reopened when water levels upstream and downstream of
the barrier are equal. In order to ensure the protective func-

Nat. Hazards Earth Syst. Sci., 20, 1985–2000, 2020                                    https://doi.org/10.5194/nhess-20-1985-2020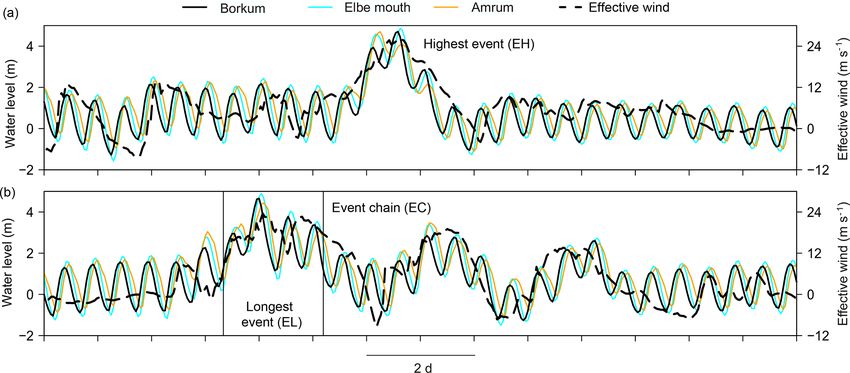
I. Grabemann et al.: Extreme storm tides in the North Sea                                                                  1989

                                                                    – duration of water levels continuously exceeding
                                                                      NHN + 1.15 m (MHW at Borkum, DGJa, 2014),
                                                                    – series of storm tides with high water levels exceeding
                                                                      MHW + 1.5 m within 1 week.
                                                                     Water levels are considered with respect to NHN. The
                                                                  storm tide events for Borkum are ranked with respect to their
                                                                  water levels and their durations. For the further analysis of
                                                                  a possible amplification, the event with the highest high wa-
                                                                  ter was defined as “EH”. The event with the maximum du-
                                                                  ration was defined as “EL”. The strongest event chain from
                                                                  the selected events was defined as “EC”, where “strongest”
                                                                  describes the combination of the maximum number of storm
                                                                  tides within a week and the maximum intensity. The inten-
                                                                  sity is given by the area between the water level curve and a
                                                                  threshold.
Figure 2. Scheme of the chain of models and simulations for the      In step 2, possible amplification of the selected extreme
selected events and their amplification.                          events due to different combinations of wind field and astro-
                                                                  nomical tide was tested. Maximum water levels may be in-
                                                                  creased by variations in relative propagation and arrival time
2.5   Selection of events and amplification experiments           of tidal high water and atmospheric storm. They may also be-
                                                                  come higher if the specific storm occurs around spring tides
Different classifications of storm tides exist using e.g. wa-     rather than around neap tides.
ter levels above a reference height or the probability of            Thus, ensembles of large-scale North Sea water level sim-
water levels. Here, the classification of the Bundesamt für       ulations for each selected event were generated. For ensem-
Seeschifffahrt und Hydrographie (Federal Maritime and Hy-         ble one, the astronomical tide given at the open model bound-
drographic Agency; see Müller-Navarra et al., 2003) is used:      aries was shifted hourly within ±6 h around the wind speed
a storm tide is an event with water levels exceeding the mean     maximum near Borkum. For ensemble two, the highest astro-
tidal high water by at least 1.5 m; a severe and a very severe    nomical spring tide found in the tidal simulations for the pe-
storm tide denote events exceeding MHW by 2.5 and 3.5 m,          riod 1948–2100 was used instead of the original tide and the
respectively.                                                     astronomical tides were again shifted hourly. For each mem-
   The analysis of extreme storm tides is mainly focused          ber of ensemble one and two, water level time series were ex-
on the East Frisian coast, in particular on Borkum and the        tracted for the three locations. The time series were analysed,
Ems estuary. However, the impact of storms in the North Sea       and members were selected focusing on the strongest ampli-
varies along the coasts depending on the wind direction and       fication for Borkum. Comparing the time series for the three
the resulting wind set-up. Therefore, from the data set, time     locations, it is estimated how the amplification for Borkum
series of water levels were extracted for a location seaward of   affected the water levels at Elbe mouth and Amrum.
the island of Borkum (in the following labelled as “Borkum”)         Respective data from the ensemble members with the
and two other locations in the German Bight (Fig. 1): one lo-     highest amplified water levels near Borkum (in the follow-
cation in the outer Elbe estuary (labelled as “Elbe mouth”)       ing identified by “_a”) for each event were used for further
and one location seaward of the North Frisian island of Am-       fine-grid simulations of the German Bight and the Ems estu-
rum (labelled as “Amrum”).                                        ary in steps 3 and 4.
   Figure 2 describes the workflow for the simulation of the         In step 3, high-resolution water level simulations for the
original water levels included in the data set and for the con-   German Bight and the attached estuaries for the ensemble
struction of the amplified water levels. A potential amplifi-     member with the highest amplified water levels near Borkum
cation due to tidal variations is tested for selected events at   for the selected events derived from step 2 were performed.
Borkum, whereas Elbe mouth and Amrum are used to com-                In step 4, the events from step 3 were further amplified by
pare the effects at Borkum with those at other coasts of the      applying an increased river runoff to examine the impact of
German Bight. The methodology used to investigate the po-         runoff variations and a sea level rise to place the results in
tential amplification of the selected storm tide events com-      the context of future climate change. For these amplification
prises four steps.                                                simulations the highest observed river runoff for the Ems of
   In step 1, extreme storm events are selected from the cor-     1200 m3 s−1 (1946; DGJb, 2018) was assumed. This extreme
responding time series using three criteria:                      river runoff was measured in February 1946, i.e. in a sea-
                                                                  son when storm tides are probable. Furthermore, simulations
  – height of water levels,                                       with two sea level rise scenarios of 50 and of 100 cm were

https://doi.org/10.5194/nhess-20-1985-2020                               Nat. Hazards Earth Syst. Sci., 20, 1985–2000, 2020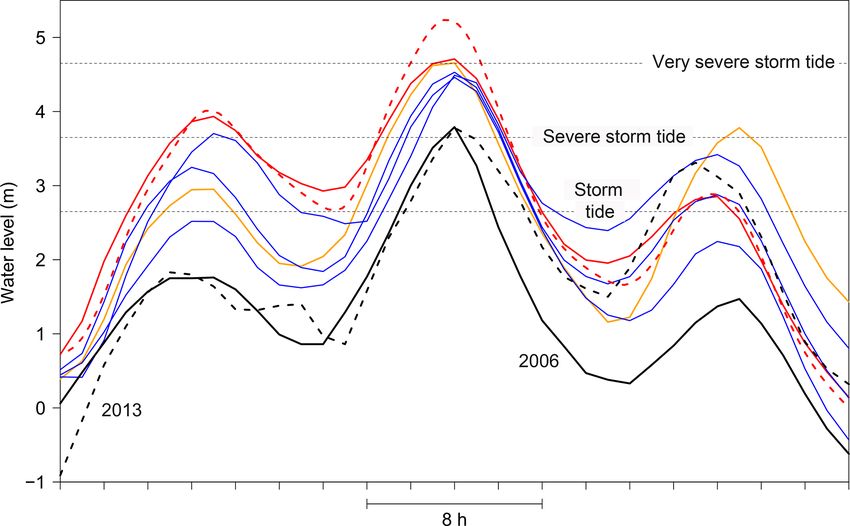
1990                                                                   I. Grabemann et al.: Extreme storm tides in the North Sea

                                                                            The highest event (EH; Fig. 4a and red curve in Fig. 3)
                                                                         with a maximum high water of 4.73 m describes a very se-
                                                                         vere storm tide and was found in one of the B1 climate re-
                                                                         alizations (February 2030; for a detailed description of the
                                                                         realizations see Gaslikova et al., 2013). This event also has a
                                                                         comparably long-lasting time period with water levels higher
                                                                         than the long-term MHW of 1.15 m (DGJa, 2014).
                                                                            The chosen chain of storm tides (EC; Fig. 4b) was found in
                                                                         one of the A1B climate realizations (November 2030). The
                                                                         longest event (EL) with water levels exceeding MHW for
                                                                         45 h is included as the first event in the chain of storms. Fur-
                                                                         thermore, the highest high water of 4.66 m in EL just reaches
                                                                         the water level for a very severe storm tide and presents
                                                                         the second-highest event extracted from the data set (orange
Figure 3. Time series of water levels over 36 h for Borkum. The
two black curves display observations (data source: German Fed-          curve in Fig. 3). EL–EC includes in total seven storm high
eral Waterways and Shipping Administration – WSV – communi-              waters within 8 d.
cated by the German Federal Institute of Hydrology – BfG), and              The effective wind is used here as a relevant representative
the coloured curves represent the five highest simulated storm tides     of the local wind activity. It is the projection of the horizon-
(nearest seaward grid point to Borkum) from the data set. The red        tal wind vector on that direction which is most effective in
and the orange curves denote the two highest events (EH and EL)          producing surges at the coast (see e.g. Ganske et al., 2018).
used for amplification tests; the dashed red curve displays the am-      During EH and EL–EC the single events follow the effec-
plified event EH_a (see Sect. 3.1.2).                                    tive wind variations shown exemplarily for Borkum (dashed
                                                                         black curves in Fig. 4). According to the classification of gen-
                                                                         eral weather situations causing severe storm surges along the
investigated. These values cover the likely range of median              German coasts (e.g. Kruhl, 1978), the storm tracks causing
values for the global sea level rise as well as the bandwidth            events EH and EL (not shown here) belong to the “North-
of the local sea level rise for the North Sea until 2100 as re-          West Type” (for areas of tracks of the different categories see
ported by Stocker et al. (2013). The sea level rise was applied          Fig. 3 in Gerber et al., 2016).
at the open boundary of the German Bight model by shifting
the boundary values for water level by the selected amount               3.1.2   Amplification analysis for selected extreme storm
of sea level rise.                                                               tides for Borkum
   In order to investigate the impact of the storm surge barrier
in the Ems on water levels, the storm tides were simulated               In the original EH, the maximum high water coincides with
with an open and with an operated barrier in steps 3 and 4.              the maximum of the effective wind and the maximum surge
                                                                         occurs about 4 h before the astronomical high water. Fig-
3     Results                                                            ure 5 displays the original EH and the ensemble member
                                                                         with the highest high water obtained from the experiments
3.1     Extreme storm tides at the coasts of the German                  with hourly shifting of wind and astronomical tide against
        Bight                                                            each other. In this case, a 5 h shifting leads to the highest wa-
                                                                         ter levels. EH consists of two high waters (peak 1 and peak
3.1.1    Selected extreme storm tides for Borkum                         2) classified as at least severe storm tides. After the amplifi-
                                                                         cation the higher peak 2 becomes smaller, whereas the lower
Following the procedure described in the previous section,               peak 1 originally reaching 3.93 m now comes up to 4.88 m.
events were selected for Borkum and ranked with respect to               Due to the diurnal inequality, peak 1 of the corresponding as-
their water levels and their durations. In Fig. 3, time series           tronomical tide is about 20 cm higher than peak 2. Due to the
for the five highest storm tides extracted from the data set are         5 h shifting, peak 1 of the tide coincides with stronger wind
compared with the highest observed storm tides for Borkum,               velocities, whereas peak 2 coincides with weaker wind ve-
showing that the data set includes storm tides higher than               locities. Thus, by only shifting the astronomical tide against
observed during the past 110 years. The events observed in               the wind field, an amplification of the maximum high water
2006 and 2013 denote the second- and third-highest storm                 in EH of 15 cm (from original 4.73 to 4.88 m) is obtained.
tides (DGJa, 2014) measured at the tide gauge since the be-                 Figure 6 shows the ensemble member with the highest
ginning of the 20th century. The highest observed storm tide             high water from the simulation experiments with replace-
of 4.06 m occurred in 1906 (NLWKNa, 2010). The five sim-                 ment of the original astronomical tide by the largest spring
ulated events are about 40 to 65 cm higher than the event                tide together with hourly shifting between astronomical tide
observed in 1906.                                                        and wind field. The high water of the replaced astronomical

Nat. Hazards Earth Syst. Sci., 20, 1985–2000, 2020                                       https://doi.org/10.5194/nhess-20-1985-2020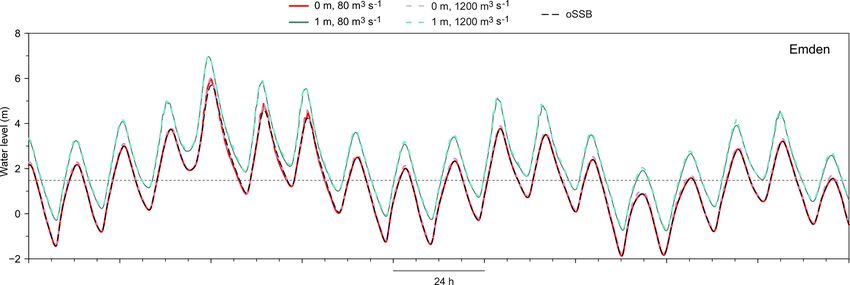
I. Grabemann et al.: Extreme storm tides in the North Sea                                                                              1991

Figure 4. Time series of simulated water levels for three locations along the German Bight coast together with effective wind velocities for
Borkum (dashed black line) for the highest event (EH; a) and the event chain (EC; b) over 14 d. The first event in the event chain represents
the longest event (EL).

                                                                         water before peak 1 or the low water after peak 2 falls below
                                                                         MHW.
                                                                            In the case of the longest event EL (included in EC, Fig. 4),
                                                                         both amplification procedures – shifting of the astronomical
                                                                         tide against the wind and replacement of the original astro-
                                                                         nomical tide with the highest spring tide together with shift-
                                                                         ing – result in an increase in the highest high water by only a
                                                                         few centimetres. In the original EL the highest high water al-
                                                                         ready coincides with an astronomical spring tide about 7 cm
                                                                         lower than the highest one. Thus, both applied procedures
                                                                         lead to relative changes in the three highest water level peaks
                                                                         but not to a substantial absolute increase in the maximum
Figure 5. Highest event (EH): time series of the original (solid black   water level during EL. Furthermore, the length of EL shows
line) and amplified water levels (solid blue line) for Borkum to-        nearly no changes. Possible amplification was also tested for
gether with tide-only time series (dashed black and blue lines); the     the entire EC including EL. The storm tides following EL ex-
amplification is due to 5-hourly shifting of the tide. The dashed        perience an increase in some single high waters of up to 20 to
green curve represents the effective wind (scaled from −10 to            30 cm together with a decrease in other high waters for some
30 m s−1 ).
                                                                         ensemble members. Thus, there was no general amplification
                                                                         regarding the intensity (see Sect. 2.5) of EL–EC. Therefore,
                                                                         the amplification procedures for EL–EC were discarded.
                                                                            For the subsequent fine-grid simulations and further analy-
spring tide is about 40 cm higher than the astronomical high             sis of effects in the Ems estuary, the water levels of the orig-
water of peak 2 in EH. This amplification procedure results in           inal EL–EC are used, whereas for EH the amplified water
a high water of 5.23 m, presenting an amplification of 50 cm.            levels due to the spring tide replacement together with tide
   For the original EH, the time period with water levels                shifting are used, in the following mentioned as EH_a (Fig. 6,
greater than MHW is about 33 h, corresponding to approx-                 red curve).
imately three tidal cycles. Due to the amplification proce-
dures, this time period varies by up to ±1 h with the excep-             3.1.3   Comparison of amplified extreme storm tides at
tion of two ensemble members, for which it is prolonged by                       different coastal strips
up to about four tidal cycles. For these two members, which
show no amplification concerning the highest high water, the             EH and EL–EC (Fig. 4) are analysed for Borkum for possi-
low water before peak 1 and the low water after peak 2 do                ble amplification. Although these highest events are selected
not fall below MHW. For all other members, either the low                and ranked for Borkum, they cause severe storms at the other

https://doi.org/10.5194/nhess-20-1985-2020                                       Nat. Hazards Earth Syst. Sci., 20, 1985–2000, 2020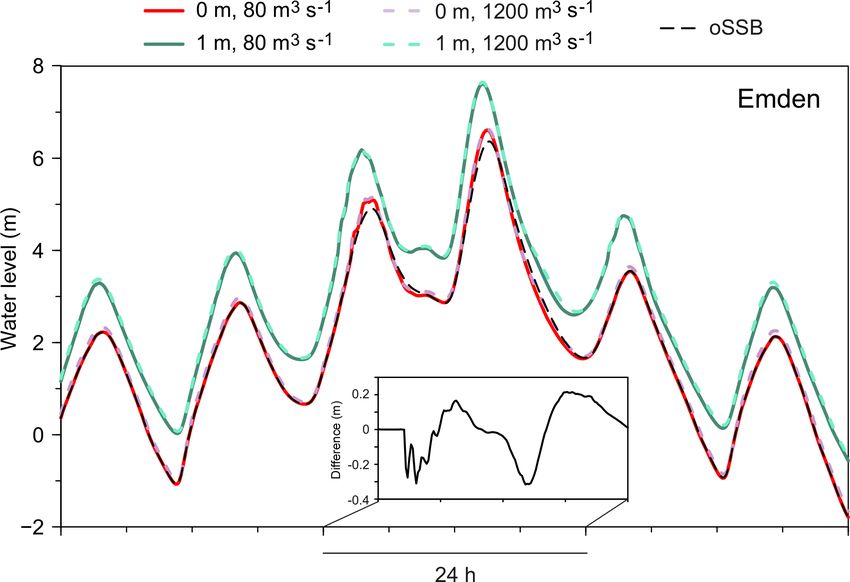
1992                                                                       I. Grabemann et al.: Extreme storm tides in the North Sea

                                                                             the original astronomical tide with the spring tide and hourly
                                                                             shifting, peak 1 shows no or only small changes whereas
                                                                             peak 2 increases. Nevertheless, for the locations Elbe mouth
                                                                             and Amrum the relative impact of the two procedures dif-
                                                                             fers from that for Borkum. At Elbe mouth both procedures
                                                                             cause similar maximum high waters of 5.35 m (+49 cm) and
                                                                             5.23 m (+37 cm), respectively, during the event, whereas at
                                                                             Amrum the 5 h shifting results in the highest high water of
                                                                             5.25 m (+56 cm) as there the original peak 1 is higher than
                                                                             peak 2.
                                                                                The particular amplification mechanisms were adjusted
                                                                             to maximize water levels at Borkum. Thus, other time lags
                                                                             might lead to higher water levels at Elbe mouth and Amrum.
                                                                             This is demonstrated by the olive curves in Fig. 6 which show
                                                                             the highest amplified water levels for these two locations for
                                                                             different ensemble members. For Amrum, the blue and olive
                                                                             curves reach the same highest high waters, but for the olive
                                                                             curve the amplification is based on peak 2. For Elbe mouth
                                                                             the olive curve shows an amplification of 72 cm. The olive
                                                                             curves of both Elbe mouth and Amrum correspond to the
                                                                             same ensemble member, which incorporates both the largest
                                                                             spring tide and a phase shift of the tide.
                                                                                Similar to Borkum, Elbe mouth and Amrum show some
                                                                             changes in the duration of water levels above MHW. For Elbe
                                                                             mouth, this time period is reduced by about one tidal cycle
                                                                             for a few members mainly with a replaced spring tide. For
                                                                             Amrum, this time period is prolonged by up to about one
                                                                             tidal cycle for a few ensemble members.

                                                                             3.2     Extreme storm tides in the Ems estuary
Figure 6. Highest event (EH): time series of the original (black
lines) and amplified water levels due to 5-hourly shifting of the tide       3.2.1    Impact of river runoff (Q) and sea level rise
(blue lines) and due to replacement of the original tide by the high-                 (SLR) on water levels at Emden
est spring tide together with shifting of the tide (red lines) for three
locations along the German Bight coast. The olive curves show wa-            Based on the fine-grid simulations of the German Bight, the
ter levels with the strongest amplification for Elbe mouth and Am-           impact of additional amplifications on the selected extreme
rum.                                                                         events EH_a and EL–EC is investigated for the Ems estuary.
                                                                             Here, additional amplification refers to a sea level rise (SLR)
                                                                             and to an increase in river runoff (Q) of the Ems.
coasts of the German Bight represented here by Elbe mouth                       Time series of the water levels at Emden in the Ems es-
and Amrum. In particular, EH and EL–EC give the second-                      tuary are shown in Fig. 7 for EH_a and in Fig. 8 for EL–
and third-highest events at Elbe mouth and the third- and                    EC with an operated storm surge barrier for a simulation
fourth-highest events at Amrum in the data set. From Fig. 4                  without additional amplification and for simulations with in-
it can be seen that the specific ranking of the single high wa-              creased Q and applied SLR. EH_a reaches peak water levels
ters during each event differs between the locations, but the                of 6.61 m at Emden without additional amplification, which
duration of the events is comparable. The high water occurs                  is 5.13 m higher than the long-term mean tidal high water
about 1.3 and 2 h later at Elbe mouth and Amrum, respec-                     level MHW of 1.48 m (DGJb, 2018) and leads to the clas-
tively, compared to Borkum.                                                  sification of EH_a as a very severe storm tide which is in
   The effects of the amplification procedures adjusted for                  agreement with its classification at Borkum. EL–EC reaches
Borkum are exemplarily compared to those at Elbe mouth                       peak water levels of 5.96 m at Emden, which also classifies
and Amrum for EH (Fig. 6). In general, the water level                       the event as a very severe storm tide. Both events reach water
changes caused by the amplification procedures for Borkum                    levels that exceed the highest observed water level of 5.17 m
are similar at the other two locations. In the case of the                   at Emden (1906; DGJb, 2018).
5 h shift of the astronomical tide, peak 1 increases for Elbe                   Changing the river runoff from 80 to 1200 m3 s−1 in-
mouth and Amrum as well. In the case of the replacement of                   creases the tidal high and low waters at Emden by only a few

Nat. Hazards Earth Syst. Sci., 20, 1985–2000, 2020                                           https://doi.org/10.5194/nhess-20-1985-2020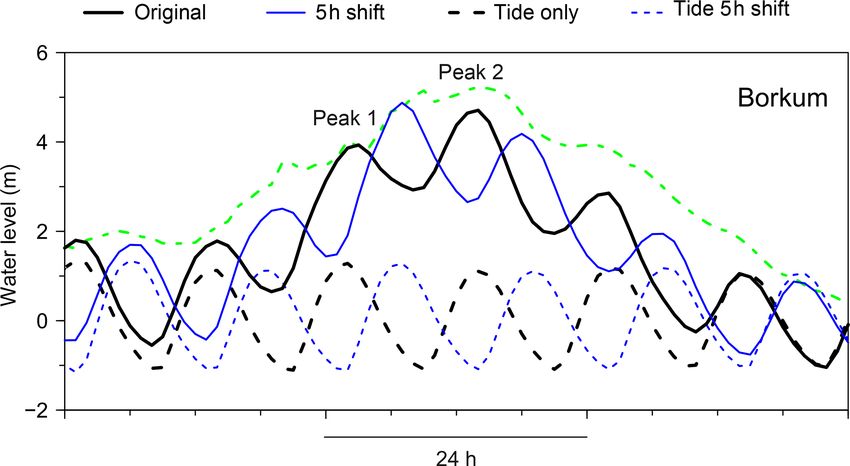
I. Grabemann et al.: Extreme storm tides in the North Sea                                                                         1993

                                                                       less than an hour. But for a sea level rise of 1 m this time pe-
                                                                       riod is prolonged by one tidal cycle up to about 45 h (Fig. 7).
                                                                       For EL the time period with water levels continuously higher
                                                                       than MHW is about two tidal cycles. This differs from the
                                                                       conditions at Borkum where four consecutive tidal cycles are
                                                                       continuously above MHW. In the Ems estuary the tidal range
                                                                       is greater than at Borkum with lower low waters and higher
                                                                       high waters. Thus, the time periods around the two low wa-
                                                                       ters following the highest high water are below MHW for
                                                                       about 2 to 3 h. In the case of a sea level rise of 1 m EL is pro-
                                                                       longed by two tidal cycles as the mentioned two low waters
                                                                       become higher than MHW (Fig. 8).

                                                                       3.2.2   Impact of Q and SLR on the highest water levels
                                                                               along the Ems estuary
Figure 7. Highest event (EH_a): time series of the amplified water
levels for the location Emden in the Ems estuary. The two solid and    To investigate the influence of Q and SLR along the Ems es-
two dashed coloured curves display the water levels for Q equals
                                                                       tuary, the highest water levels during EH_a and EL at each
80 and 1200 m3 s−1 and a SLR of 0 and 1 m, respectively, and an
                                                                       location along the longitudinal profile are analysed for simu-
operated storm surge barrier. As the impact of Q on the water lev-
els at Emden is small, the dashed coloured curves nearly match         lations with an open storm surge barrier. Closing the barrier
the corresponding solid coloured curves. The dashed black curve        separates the estuary into two parts and alters the effects of
shows water levels for an open storm surge barrier (oSSB), for         Q and SLR.
Q = 80 m3 s−1 and no SLR. The inset shows the differences be-             Figure 9 shows the impact of an increase in Q from 80 to
tween the water levels for an operated (red curve in the main panel)   1200 m3 s−1 on the highest water levels for both EH_a (black
and open (dashed black curve in the main panel) storm surge barrier    lines) and EL–EC (red lines). For both events, the increased
over 24 h.                                                             river runoff raises the highest water levels by several decime-
                                                                       tres in the narrow and shallow upper part of the Ems estuary
                                                                       upstream of the Dollart. The influence of Q on the highest
centimetres (see Figs. 7 and 8, red and dashed lilac lines).           water levels decreases towards Dukegat where the Ems be-
This effect is even weaker for the storm tides (see events             comes deeper and wider and disappears towards the mouth of
with open storm surge barrier in Table 1). In the wide and             the estuary. As mentioned before, Emden is located in an area
deep estuarine part near Emden the tidal volume strongly ex-           of the Ems estuary where the influence of the river runoff on
ceeds the river runoff so that the impact of river runoff on           the highest water levels is in the range of some centimetres
water levels is small. As the tidal volume is increased dur-           (see also Figs. 7 and 8 and Table 1).
ing the storm tide, the impact of river runoff is even smaller            Upstream of Papenburg the influence of the bathymetry on
during this period.                                                    the highest water levels during storm surges can be observed
   At Emden, applying a SLR to the events leads to an in-              clearly marked by a sudden decrease in the highest water lev-
crease in tidal high water, tidal low water and the highest            els in the case of low discharge. In the area of Papenburg the
water level during the storm tide in the range of the applied          estuary is very narrow and the dike line is close to the estu-
SLR (Figs. 7 and 8 and Table 1). This behaviour can be seen            ary, whereas the upper part of the estuary is characterized by
in both EH_a and EL–EC. The observed influence of river                wide foreshore areas that are flooded only during events of
runoff and sea level rise agrees with the behaviour analysed           high discharge or storm tides. In addition, the depth of the
in a sensitivity study by Rudolph (2014).                              estuary decreases significantly upstream of Papenburg. This
   Increasing the river runoff results in nearly no change at          part of the Ems estuary is not used as a waterway for seago-
Emden in the occurrence time of the highest water during               ing ships.
the storm tide (see events with open storm surge barrier in               The described bottleneck close to Papenburg prevents the
Table 1). The increased water depth caused by a sea level rise         water during a storm tide to enter the upstream area undis-
increases the propagation velocity of the tidal wave entering          turbed, which results in lower water levels in this area. For
the Ems estuary, which causes the tidal high water to occur            events with high river runoff the wide foreshore areas up-
earlier by 10 to 20 min at Emden (Table 1) for the events              stream of Papenburg can already be flooded before the storm
investigated.                                                          tide depending on the amount of runoff and the height of the
   For EH_a the time period with water levels greater than             tide before the storm tide.
MHW is about 33 h, similar to the time period at Borkum.                  Applying a SLR of 50 or 100 cm while the river runoff re-
Due to an increase in runoff to 1200 m3 s−1 or to a sea level          mains unchanged at 80 m3 s−1 leads to a longitudinally vary-
rise of 0.5 m this time period shows only small changes of             ing increase in the highest water levels along the whole estu-

https://doi.org/10.5194/nhess-20-1985-2020                                     Nat. Hazards Earth Syst. Sci., 20, 1985–2000, 2020
1994 I. Grabemann et al.: Extreme storm tides in the North Sea
Table 1. Highest water levels and their occurrence times at Emden are given for simulations with varying river runoff Q, sea level rise SLR
and modes of operation for the storm surge barrier. The occurrence time of the highest water level is given relative to the Ems kilometre 107
(Hubertgat).
Event Q SLR Barrier Highest Occurrence
(m3 s−1 ) (cm) water level time
(m) (min)
EH_a 80 0 open 6.36 89
EH_a 1200 0 open 6.43 88
EH_a 80 100 open 7.37 82
EH_a 1200 100 open 7.42 79
EH_a 80 0 operated 6.61 80
EH_a 1200 0 operated 6.65 74
EH_a 80 100 operated 7.61 70
EH_a 1200 100 operated 7.65 69
EL–EC 80 0 open 5.71 79
EL–EC 1200 0 open 5.78 77
EL–EC 80 100 open 6.75 62
EL–EC 1200 100 open 6.82 61
EL–EC 80 0 operated 5.96 73
EL–EC 1200 0 operated 6.01 71
EL–EC 80 100 operated 6.96 45
EL–EC 1200 100 operated 7.01 45
13 Mar 1906a 167 – no 5.18 –
01 Nov 2006b 32 – operated 5.17 –
a WSA Meppen, Jens Mäueler, personal communication (2019). b DGJb (2018).
Figure 8. Longest event and event chain (EL–EC): times series of the amplified water levels as in Fig. 7. The dashed horizontal line represents
MHW.
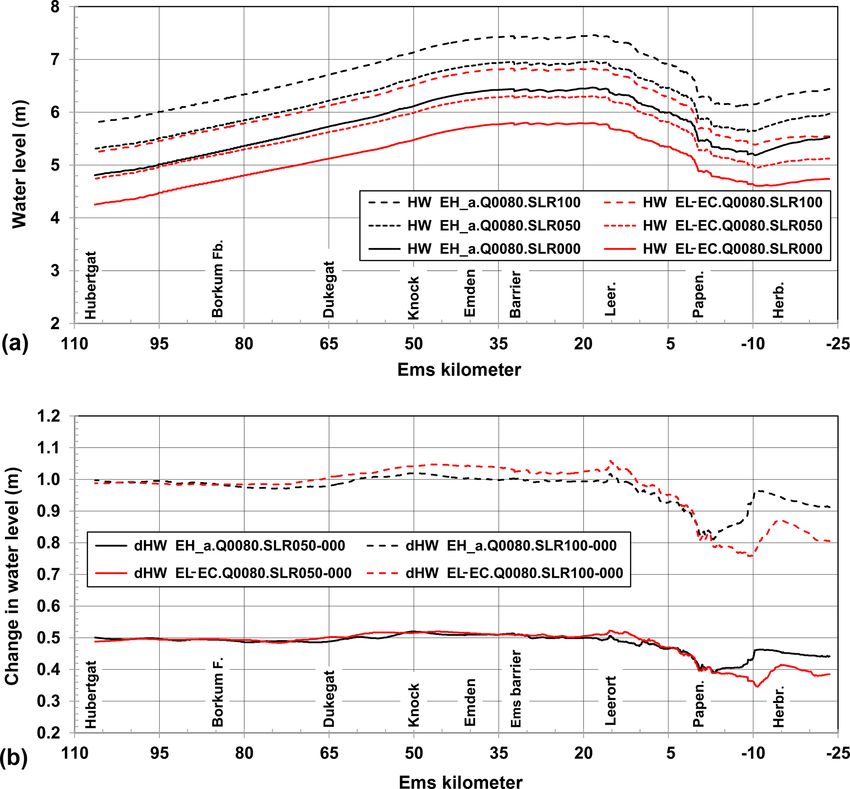
ary for both EH_a and EL–EC (Fig. 10a). The difference in penburg, the impact of the SLR changes depending on the
maximum water levels between a simulation with SLR and event (Fig. 10).
a simulation without SLR (Fig. 10b) shows for both EH_a During storm tides not only are questions concerning
and EL–EC that the maximum water levels downstream of coastal protection important but also the draining of the pro-
Leerort are increased by the amount of the applied SLR with tected areas must be ensured. In the lowlands close to the
small deviations in the range of a few centimetres. The im- mouth of the Ems, draining of urban (e.g. Emden) and agri-
pact of the SLR on maximum water levels decreases between cultural areas (e.g. Knock) is of major interest. The aim of the
Leerort and Papenburg. The rate of decrease depends on the sewer at Knock is to drain the low-lying hinterland (with a
magnitude of the applied SLR. For a SLR of 0.5 m and 1 m ground level of about NHN + 0 m) and keep the inland water
maximum water levels drop by about 20 %. Upstream of Pa- level at Knock lower than NHN − 1.40 m (KLEVER, 2018).
At Knock the mean low water MLW is NHN − 1.58 m so that
Nat. Hazards Earth Syst. Sci., 20, 1985–2000, 2020 https://doi.org/10.5194/nhess-20-1985-2020I. Grabemann et al.: Extreme storm tides in the North Sea 1995
Figure 9. Highest water levels along a longitudinal profile in the Figure 11. Highest water levels along a longitudinal profile in the
Ems estuary during EH_a (black lines) and EL–EC (red lines) for Ems estuary for an operated storm surge barrier without further am-
Q = 80 m3 s−1 (solid lines) and Q = 1200 m3 s−1 (dashed lines) plification (Q = 80 m3 s−1 , SLR = 0 cm; solid lines) and a simula-
for an open storm surge barrier without SLR. tion with amplified conditions (Q = 1200 m3 s−1 , SLR = 100 cm;
dashed lines) for EH_a (black lines) and EL (red lines).
3.2.3 Influence of the storm surge barrier in the Ems
estuary
For the investigation of the impact of SLR and runoff along
the Ems estuary as shown above, the storm surge barrier
in the Ems is considered to be open. When operated, the
storm surge barrier in the Ems has a significant influence
on the highest water levels both upstream and downstream
(Fig. 11). The barrier is closed at a defined water level of
NHN + 3.50 m and reopened when the water levels on both
sides of the barrier are equal.
In the protected area upstream of the barrier the water lev-
els are no longer influenced by the storm tide coming from
the North Sea. Only the amount of river runoff that flows
into the protected area in the period the barrier is closed con-
tributes to the highest water level.
Downstream of the barrier, highest water levels increase
compared to a simulation with an open barrier (black curves
Figure 10. (a) Highest water levels along a longitudinal profile in in Figs. 9 and 11; see also time series at Emden in Figs. 7
the Ems estuary during EH_a (black lines) and EL (red lines) for
and 8, red and dashed black curves). This is due to two main
SLR = 0 cm (solid lines), SLR = 50 cm (dotted lines) and SLR =
reasons. Firstly, the sudden stopping of the impulse of the
100 cm (dashed lines) for an open storm surge barrier and Q =
80 m3 s−1 . (b) Differences in the highest water levels between sim- tidal wave at closure leads to a positive surge downstream of
ulations with and without SLR along the Ems estuary during EH_a the barrier and a negative surge upstream of the barrier. The
(black lines) and EL (red lines) for Q = 80 m3 s−1 (dashed lines positive surge induces a self-oscillation in the Dollart basin
for SLR = 100 cm, solid lines for SLR = 50 cm). The storm surge in which the period of oscillation depends on the geometry
barrier is open. and the actual water depth of the Dollart basin. The created
surge will be weaker when current velocities are lower and
can be avoided when closing the barrier at slack water time.
draining without pumping is only possible for a short time This effect can be observed e.g. in Fig. 7 looking at the wa-
even during mean tides. Caused by long-lasting high water ter level of EH_a (red line) and in the inset of Fig. 7 showing
levels during storm tides, draining is even more restricted. the difference between the water levels for an operated and
For the chain of storm tides EC (Fig. 8) even without am- open storm surge barrier. The storm surge barrier is closed
plification pumping is needed nearly during the whole period at a defined water level (NHN + 3.50 m) and not at a de-
of 176 h (Table 2). The water must be pumped against a wa- fined time in the tidal phase. For the first storm tide the storm
ter level in the Ems higher than MHW for about 90 h. This surge barrier is closed during the flood current. The induced
period will increase by about 40 h in the case of a sea level surge and the subsequent oscillation cause an unsteady rise
rise of 100 cm. in the water level. For the second storm tide the water level
of 3.50 m is reached during slack water time. As the storm
https://doi.org/10.5194/nhess-20-1985-2020 Nat. Hazards Earth Syst. Sci., 20, 1985–2000, 20201996 I. Grabemann et al.: Extreme storm tides in the North Sea
Table 2. Duration of water levels higher than a selected threshold (here NHN − 1.40 m) and MHW (at Knock MHW = NHN + 1.39 m; at
Emden MHW = 1.48 m) for EC with varying river runoff Q, sea level rise SLR and an operated storm surge barrier. The period investigated
covers 176 h.
Knock Emden
Event > −1.40 m > MHW > −1.40 m > MHW
(hours) (hours) (hours) (hours)
EC.Q0080.SLR000 172 88 172 86
EC.Q1200.SLR000 176 91 176 91
EC.Q0080.SLR100 172 129 173 127
EC.Q1200.SLR100 176 131 176 130
surge barrier is closed during a period of nearly no current EL the water levels allow the closing and opening of the bar-
velocity, no surge is induced and a steady rise in the water rier for each storm tide separately (Fig. 8) leading to a clo-
level is observed. This behaviour was investigated in detail sure period of 7 h 5 min. Combining these different closure
in BAW (2007). periods with the extreme runoff results in lower water levels
The second process increasing the highest water levels is for EL than for EH_a upstream of the barrier. In the case of
the shortening of the estuary that takes place when the barrier mean runoff and no sea level rise the length of the closure
is closed. This reduces the stretch where dissipation of the period does not influence the highest water level during the
tidal wave can occur and leads to the reflection of a more storm tide upstream of the barrier. It shows that the protected
energetic wave and results in an increase in the highest water area upstream of the barrier is big enough to store even the
levels. This behaviour has been investigated in other studies extreme discharge of 1200 m3 s−1 for all closure periods in-
and is also described in BAW (2007). The size of the increase vestigated. For all events and amplifications the highest wa-
in the highest water levels has been studied in e.g. Rego et al. ter levels upstream of the operated barrier remain lower than
(2011). those reached in the case of the open barrier (Figs. 10 and
Summarizing, a closed storm surge barrier will always 11).
lead to increased highest water levels downstream of the bar- The highest water levels at Emden for the simulations
rier but the magnitude of the increase depends on the cur- without further amplification and an operated storm surge
rent velocity conditions present at closure. In the case of the barrier are 6.61 m for EH_a and 5.96 m for EL–EC (Ta-
analysed events, at Emden this increase ranges between 19 ble 1). Applying amplified conditions (Q = 1200 m3 s−1 and
and 25 cm (Table 1). In general, the highest water levels are SLR = 1 m) leads to an increase in the highest water levels
reached close to the storm surge barrier and they decrease to 7.65 m for EH_a and 7.01 m for EL–EC (Figs. 7 and 8).
towards the river mouth. Closing the barrier keeps the storm The highest measured water level at Emden is 5.17 m (DGJb,
tide out of the area upstream. Only the river runoff fills the 2018). Thus, the extreme events EH_a and EL–EC identified
protected area during the period when the barrier is closed. and elaborated in this study exceed this water level even with-
Consequently, closing the barrier during a storm tide leads to out the application of further amplification by river runoff
significantly lower highest water levels upstream of the bar- and sea level rise.
rier (Fig. 11).
Applying a SLR and an increased Q to events with an
operated storm surge barrier leads to increased highest wa- 4 Summary and discussion
ter levels downstream of the barrier due to the SLR and in-
creased highest water levels upstream of the barrier due to This study aims to find extreme storm tides in the North Sea
the runoff coming from upstream (Fig. 11). This holds true and Ems estuary that are physically possible but have not
for all events and respective simulations. Figure 11 demon- been observed yet. Numerical simulation data for the North
strates how the water level upstream depends on the length Sea from both hindcast and climate realizations have been
of the period with a closed barrier. For a SLR of 1 m and searched to detect extreme storm tides, i.e. storms causing
a runoff of 1200 m3 s−1 , the water levels during EH_a are very high water levels (EH), water levels that exceed mean
considerably higher than those for EL although for the refer- tidal high water for a longer duration (EL) or multiple storm
ence cases (no SLR, mean runoff) the water levels are simi- tides that occur within 1 week (EC). These events originate
lar. For EH_a the barrier has to be closed for the first storm from the first half of the emission scenario period of two dif-
tide (Fig. 7) and can only be reopened after the second storm ferent climate realizations. Gaslikova et al. (2013) showed
tide due to the considerably elevated water levels around low that the annual maximum water levels of these climate real-
tide. This leads to a continuous closure period of 17 h. For izations displayed strong multi-decadal variability but no sig-
nificant long-term trends from 1961 to 2100. Thus, the high-
Nat. Hazards Earth Syst. Sci., 20, 1985–2000, 2020 https://doi.org/10.5194/nhess-20-1985-2020I. Grabemann et al.: Extreme storm tides in the North Sea 1997 est water levels found, exceeding the water levels measured ertheless, the simulated highest water levels (Table 1) do not since the beginning of the 20th century at Borkum (Fig. 3), reach today’s dike height at Emden of NHN + 7.60 m except could already be possible under present-day conditions as no for in two cases which include a future sea level rise of 1 m. sea level rise is included in the original climate realizations. The upper part of the Ems estuary is protected by the storm Using numerical simulations for the North Sea, the se- surge barrier even against extreme events with amplified dis- lected events were amplified by shifting the astronomical tide charge or sea level rise. against the wind field for the optimization of their interaction The amplified water levels obtained for EH_a of 5.23 m at and by inserting the highest spring tide from the data set. By Borkum and of 6.61 m at Emden are on a similar order of these amplification procedures based only on the co-timing magnitude as the maximum water levels of 4.99 and 6.09 m, of the atmospheric storm and the tidal phase, the water level respectively, reported by Jensen et al. (2006; see therein Ta- at Borkum is increased by about 50 cm and a maximum water ble 10 for an ensemble member of 1976) as an estimate of an level of 5.23 m is reached for EH_a, thus exceeding the high- extreme event with a low probability of occurrence. There, est measured event in 1906 by more than 1 m (see dashed the investigation was focused on the Elbe estuary. Possibly, red line in Fig. 3). Moreover, the enhancement mechanisms ensemble members other than those reported might result in proposed in this study except sea level rise are realistic un- higher water levels for Borkum and Emden. Still the compa- der the present-day conditions and thus a storm tide like the rability of extreme water levels estimated by different pro- amplified EH_a could occur nowadays. cedures and based on different original data sets supports Using a high-resolution model for the German Bight and the plausibility of the results. Moreover, there is a poten- the Ems estuary, the extreme events EH_a and EL–EC were tial for further amplified realistic storm tide events to emerge further studied in the context of an extreme river runoff of when both methods, namely variations in atmospheric condi- 1200 m3 s−1 and increased mean sea level by 0.5 and 1 m. tions as performed by Jensen et al. (2006) and interplay with The river runoff has the largest impact on the highest water different tidal phases as performed in the present study, are levels upstream of Herbrum in the narrow part of the Ems combined. where it leads to an increase of about 1 m. The impact de- Depending on track, intensity and velocity, each storm creases downstream as the Ems becomes wider and deeper affects the German coastal stripes differently. For the East and disappears completely downstream of Dukegat. The am- Frisian coast, storm winds from northern directions lead to plified conditions due to sea level rise increase the water lev- higher storm tides, whereas for the North Frisian coast, storm els in the estuary from the mouth up to the area of Papenburg winds from western directions have more impact. Thus, the by approximately the applied amount of sea level rise. Up- ranking of extreme storm tide events elaborated in this study stream of Papenburg, the river runoff dominates and the in- differs in detail for the different coastal stripes of the Ger- fluence of sea level rise on the highest water levels decreases. man Bight. As this work focuses on the East Frisian coast Both the sea level rise and the increase in river runoff lead to with the Ems estuary, the amplification procedures were ad- an increase in water levels and to a longer duration of higher justed specifically for Borkum. However, the methods for the water levels along the Ems estuary. In addition, a sea level identification and amplification of storm tides used here can rise results in an earlier occurrence of the highest water level be transferred to other coasts and estuaries. during a storm surge in the central part of the estuary on the So far, a fixed bathymetry has been assumed for all simu- order of 10 to 20 min (Table 1). lations. However, the heterogeneous bathymetry of the Ger- Against the background of climate change and the need man Bight, in particular the Wadden Sea and the estuaries, to develop future coastal protection strategies, it is important has been subject to changes due to natural processes and an- to know not only the possible height of an extreme event but thropogenic influences which will proceed in the future. Con- also its duration. Moreover, EC shows that several high storm sideration of changing bathymetry would give an insight into tides within a week could be possible. The low-lying land the effect of morphodynamic states on extreme storm tides. protected by dikes in this area is drained both using the gra- Due to the lack of regular information about past and possible dient in the water level towards the Ems and with pumps. A future regional and local changes, this remains an important prolongation of the duration of higher water levels in the Ems and extensive topic for further investigation. will hinder the natural drainage. The infrastructure in terms In the present study the effects of a coincidence of a severe of more powerful pumps must be improved because the wa- storm tide and extreme runoff were assessed to give an upper ter has to be pumped for a longer period against higher water limit of water levels. So far, an independent probability of levels in the Ems estuary. occurrence of extremes has been assumed. Consideration of In the Ems estuary at Emden, the highest water level for joint probabilities or consideration of them as a compound EH_a is 6.61 m with an operated storm surge barrier and event might narrow down the range of possible water level without further amplification. In the case of a runoff of extremes. 1200 m3 s−1 and a sea level rise of 1 m, it reaches 7.65 m. Events like EC with a series of storm tides within a week These water levels exceed the highest water level observed in might require special arrangements for the management of the event in 1906 by about 1.4 and 2.4 m, respectively. Nev- their impact. Not only must the drainage of the hinterland https://doi.org/10.5194/nhess-20-1985-2020 Nat. Hazards Earth Syst. Sci., 20, 1985–2000, 2020
You can also read