Performance of the Adriatic early warning system during the multi-meteotsunami event of 11-19 May 2020: an assessment using energy banners ...
←
→
Page content transcription
If your browser does not render page correctly, please read the page content below
Nat. Hazards Earth Syst. Sci., 21, 2427–2446, 2021
https://doi.org/10.5194/nhess-21-2427-2021
© Author(s) 2021. This work is distributed under
the Creative Commons Attribution 4.0 License.

Performance of the Adriatic early warning system during the
multi-meteotsunami event of 11–19 May 2020: an assessment
using energy banners
Iva Tojčić1 , Cléa Denamiel1,2 , and Ivica Vilibić1,2
1 Institute of Oceanography and Fisheries, Šetalište I. Meštrovića 63, 21000 Split, Croatia
2 Rud̄er   Bošković Institute, Division for Marine and Environmental Research, Bijenička cesta 54, 10000 Zagreb, Croatia

Correspondence: Iva Tojčić, (tojcic@izor.hr)

Received: 14 December 2020 – Discussion started: 5 January 2021
Revised: 17 June 2021 – Accepted: 22 July 2021 – Published: 18 August 2021

Abstract. This study quantifies the performance of the Croa-        1   Introduction
tian meteotsunami early warning system (CMeEWS) com-
posed of a network of air pressure and sea level observa-           Atmospherically driven extreme sea levels (e.g. wind storms,
tions, a high-resolution atmosphere–ocean modelling suite,          hurricanes), associated with flooding producing substantial
and a stochastic surrogate model. The CMeEWS, which is              damage to houses, goods, and infrastructure, are among the
not operational due to a lack of numerical resources, is used       main hazards impacting coastal communities (Nicholls and
retroactively to reproduce the multiple events observed in          Cazenave, 2010; Neumann et al., al., 2015). As such, meteo-
the eastern Adriatic between 11 and 19 May 2020. The per-           rological tsunamis (commonly referred to as meteotsunamis)
formances of the CMeEWS deterministic models are then               are sea level oscillations with characteristics similar to seis-
assessed with an innovative method using energy banners             mic or landslide tsunamis but generated by atmospheric grav-
based on temporal and spatial spectral analysis of the high-        ity waves, frontal passages, pressure jumps, or squalls, for
pass-filtered air pressure and sea level fields. It is found        example, though a multi-resonant mechanism (Monserrat et
that deterministic simulations largely fail to forecast these       al., 2006). The principal generation mechanisms are open-
extreme events at endangered locations along the Croatian           ocean resonance occurring between the ocean and the air
coast, mostly due to a systematic northwestward shift of the        pressure oscillations at timescales ranging from a few min-
atmospheric disturbances. Additionally, the use of combined         utes to a few hours (e.g. Proudman, 1929) and coastal ampli-
ocean and atmospheric model results, instead of atmospheric         fication that also includes so-called harbour resonance (Miles
model results only, is not found to improve the selection of        and Munk, 1961; Rabinovich, 2009). Locally they can be
the transects used to extract the atmospheric parameters feed-      destructive, not only due to extreme sea levels (Hibiya and
ing the stochastic meteotsunami surrogate model. Finally, in        Kajiura, 1982; Salaree et al., 2018), but also to dangerous
operational mode, the stochastic surrogate model would have         currents in constrictions or in coastal zones (Ewing et al.,
triggered the warnings for most of the observed events but          1954; Vilibić et al., 2004; Linares et al., 2019). The strongest
also set off some false alarms. Due to the uncertainties asso-      meteotsunami on record in the Mediterranean Sea hit Vela
ciated with operational modelling of meteotsunamigenic dis-         Luka, Croatia, in June 1978, with a wave height of 6 m (crest
turbances, the stochastic approach has thus proven to over-         to trough) and a period of 18 min. The meteotsunami lasted
come the failures of the deterministic forecasts and should         several hours and caused USD 7 million in damage (Vučetić
be further developed.                                               et al., 2009; Orlić et al., 2010).
                                                                       In certain locations around the world, due to a combina-
                                                                    tion of weather patterns, geography, and bathymetry, me-
                                                                    teotsunamis can be a regularly occurring phenomenon. The
                                                                    Balearic Islands and Croatian coastline in the Mediterranean

Published by Copernicus Publications on behalf of the European Geosciences Union.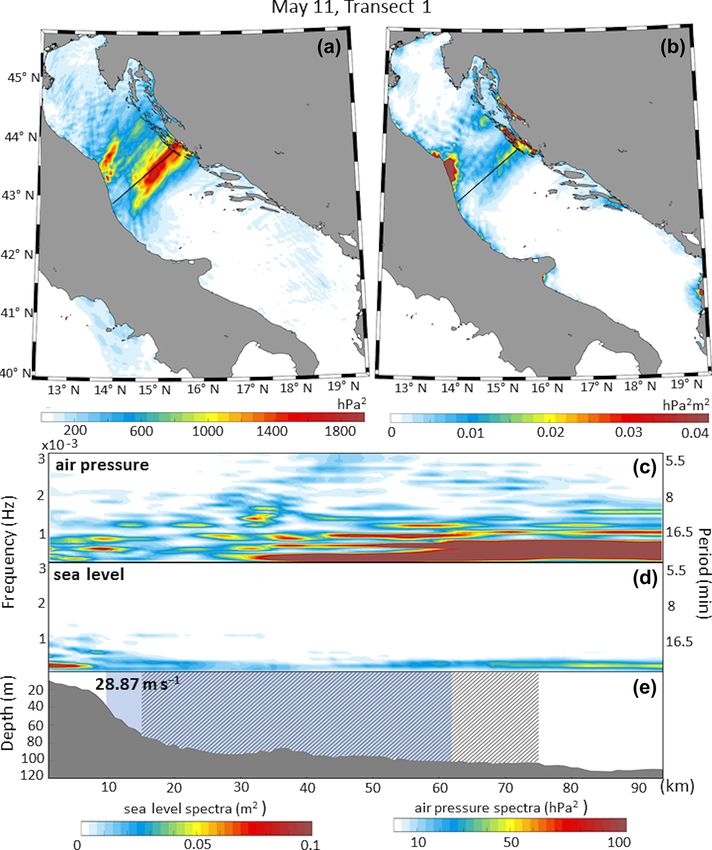
2428                                                        I. Tojčić et al.: Performance of the Adriatic early warning system

Sea, a few of Japan’s gulfs and bays, the Great Lakes and           erationally) for this 11–19 May 2020 period. As quoted by
the US East Coast, and the western Australian coastline             Denamiel et al. (2020), forecasting the right speed and fre-
are good examples (Pattiaratchi and Wijeratne, 2015; Ra-            quency (period) of the travelling atmospheric disturbances
binovich, 2020). For all these locations, despite varying in-       is crucial for meteotsunami hazard assessments in the har-
tensities, meteotsunami events have the potential to gener-         bours of Vela Luka, Stari Grad, and Vrboska. Therefore, un-
ate structural damage and sometimes even human casualties.          like previous studies on the performances of the CMeEWS
Meteotsunami early warning systems, helping the local pop-          operational models, this analysis introduces the novelty of
ulation to prepare for these destructive events, are thus im-       using energy banners – based on the spectral analysis of the
portant for the coastal communities living in such places.          high-pass-filtered air pressure and sea level fields – as a tool
Vilibić et al. (2016) pointed out that meteotsunami early          to evaluate the capacity of the AdriSC deterministic model
warning systems can be created based on four approaches:            to reproduce the frequency of the meteotsunamigenic distur-
(1) identification of tsunamigenic atmospheric synoptic con-        bances measured during the 11–19 May 2020 period. Here-
ditions, (2) real-time detection of tsunamigenic atmospheric        after, the CMeEWS (including the AdriSC modelling suite,
disturbances using a microbarograph network, (3) measure-           the stochastic surrogate model, and the observational net-
ment and tracking of high-frequency sea level oscillations by       work) and the methods used in the study are first presented in
high-resolution digital tide gauges, and (4) numerical sim-         Sect. 2. Then, Sect. 3 describes the 11–19 May 2020 multi-
ulation of meteotsunamis based on coupling of atmosphere–           meteotsunami event using eyewitness reports, available ob-
ocean numerical models. As it stands today, the only fully op-      servations, and reanalysis products. The verification of the
erational meteotsunami early warning system in the world is         AdriSC deterministic atmospheric model is undertaken in
located in the Balearic Islands. It is based on forecasts given     Sect. 4, while Sect. 5 presents the main results of the study
at a qualitative level with the identification of favourable syn-   – i.e. the meteotsunami energy banners used to detect the
optic conditions a few days ahead (Jansà et al., 2007; Jansà        strongest atmospheric disturbances. Finally, the stochastic
and Ramis, 2020) and with the deterministic results of the op-      meteotsunami hazard assessments, based on parameters ex-
erational BRIFS (Balearic Rissaga Forecasting System, http:         tracted from transects selected along the energy banners, are
//www.socib.eu, last access: 16 August 2021) model (Renault         discussed in Sect. 6, and the findings of this study are sum-
et al., 2011). In the Balearic Islands, probabilistic approaches    marized in Sect. 7.
have also been tested recently to narrow down the uncer-
tainties of the meteotsunami forecasts (Vich and Romero,
2020; Mourre et al., 2020). In the US, meteotsunami early           2     Model, data, and methods
warning systems are still under development by NOAA (Na-
tional Oceanic and Atmospheric Administration) and will             The Croatian meteotsunami early warning system
be based on high-resolution air pressure measurements com-          (CMeEWS) receives three different kinds of data: (1)
bined with forecast models (Anderson et al., 2020). Finally,        high-resolution atmospheric and ocean model results pro-
the recently developed Croatian meteotsunami early warning          vided by the Adriatic Sea and Coast (AdriSC) modelling
system (CMeEWS) is based on an observational network of             suite (Denamiel et al., 2019a), (2) high-frequency air pres-
pressure sensors and tide gauges, as well as on the determin-       sure and sea level measurements along the Adriatic coast,
istic AdriSC modelling suite (Denamiel et al., 2019a) and the       and (3) meteotsunami hazard assessments based on the
stochastic meteotsunami surrogate model (Denamiel et al.,           stochastically estimated maximum elevation distributions
2019b, 2020). It provides meteotsunami hazard assessments           derived from a meteotsunami surrogate model (Denamiel
depending on forecasted and measured air pressure distur-           et al., 2019b, 2020). The following subsections describe
bances but has unfortunately not been used operationally            the different components of the CMeEWS and the methods
since November 2019 due to a lack of high-performance               used in this article to improve the detection and extraction
computing resources needed to execute such a numerically            of the modelled meteotsunamigenic disturbances in the
demanding suite in real time.                                       atmosphere.
   However, the CMeEWS applications to recent meteot-
sunami events may surely be used to better quantify its re-         2.1    AdriSC modelling suite
liability and to improve its performance. Recently, an excep-
tional multi-meteotsunami event, which lasted for a week be-        The AdriSC modelling suite is composed of a basic module
tween 11 and 19 May 2020, occurred in the Croatian cities           providing kilometre-scale atmospheric and ocean circulation
of Vela Luka (VL), Stari Grad (SG), and Vrboska (Vr), lo-           over the entire Adriatic region, forcing a dedicated meteot-
cated along the coasts of the Dalmatian islands in the Adri-        sunami module (Denamiel et al., 2019a).
atic Sea (Fig. 1). Therefore, the deterministic and stochas-          The basic module uses a modified version of the
tic AdriSC models have been run retroactively in operational        Coupled     Ocean–Atmosphere–Wave–Sediment–Transport
(hindcast) mode (i.e. in the exact same conditions that the         (COAWST) modelling system developed by Warner
daily meteotsunami forecasts would have been produced op-           et al. (2010), built around the Model Coupling Toolkit

Nat. Hazards Earth Syst. Sci., 21, 2427–2446, 2021                                 https://doi.org/10.5194/nhess-21-2427-2021
I. Tojčić et al.: Performance of the Adriatic early warning system                                                               2429

Table 1. Microbarograph and tide gauge locations.

                            Location            Coordinates         Area                Observations
                            Ancona (An)         13.506◦ E           Western Adriatic    air pressure
                                                43.625◦ N
                            Ortona (Or)         14.415◦ E           Western Adriatic    air pressure
                                                42.356◦ N
                            Vieste (Ve)         16.177◦ E           Western Adriatic    air pressure
                                                41.888◦ N
                            Svetac (Sv)         15.757◦ E           Middle Adriatic     air pressure
                                                43.024◦ N
                            Vis (Vs)            16.192◦ E           Middle Adriatic     air pressure
                                                43.057◦ N
                            Stari Grad (SG)     16.576◦ E           Eastern Adriatic    air pressure and sea level
                                                43.180◦ N
                            Vela Luka (VL)      16.718◦ E           Eastern Adriatic    air pressure and sea level
                                                42.962◦ N
                            Vrboska (Vr)        16.672◦ E           Eastern Adriatic    air pressure
                                                43.181◦ N

                                                                           (MCT), which exchanges data fields and dynamically
                                                                           couples the Weather Research and Forecasting (WRF)
                                                                           atmospheric model, the Regional Ocean Modeling System
                                                                           (ROMS), and the Simulating WAves Nearshore (SWAN)
                                                                           model. The basic module is set up with (1) two different
                                                                           nested grids of 15 and 3 km resolution used in the WRF
                                                                           model respectively covering the central Mediterranean area
                                                                           and the Adriatic–Ionian region and (2) two different nested
                                                                           grids of 3 and 1 km resolution used for both ROMS and
                                                                           SWAN models respectively covering the Adriatic–Ionian
                                                                           region (similar to the WRF 3 km grid) and the Adriatic Sea
                                                                           only.
                                                                              The dedicated meteotsunami module offline couples the
                                                                           Weather Research and Forecasting (WRF) model (Ska-
                                                                           marock et al., 2005) at 1.5 km of resolution with the unstruc-
                                                                           tured ADCIRC–SWAN model (Dietrich et al., 2012), cou-
                                                                           pling the 2DDI (i.e. two-dimensional depth-integrated) AD-
                                                                           vanced CIRCulation (ADCIRC) model and the SWAN model
                                                                           with a mesh of up to 10 m resolution in the areas sensitive to
                                                                           the meteotsunami hazard. In more detail, (1) the hourly re-
                                                                           sults from the WRF 3 km grid obtained with the basic mod-
                                                                           ule are first downscaled to a WRF 1.5 km grid covering the
                                                                           Adriatic Sea; (2) the hourly sea surface elevation from the
                                                                           ROMS 1 km grid, the 10 min spectral wave results from the
Figure 1. Bathymetry of the Adriatic Sea with positions of micro-
                                                                           SWAN 1 km grid, and finally the 1 min results from the WRF
barographs and tide gauges (red circles). Black circles denote model
grid points along transects T1 to T5 (black lines) on which the high-
                                                                           1.5 km grid are then used to force the unstructured mesh of
est energy is reproduced within selected meteotsunami energy ban-          the ADCIRC–SWAN model. In this operational configura-
ners in the eastern (E1 to E6), middle (M1 and M2), and western            tion, the ADCIRC model is forced every minute by the WRF
(W1 to W7) Adriatic.                                                       1.5 km wind and pressure fields and every hour by the ba-
                                                                           sic module sea level fields (including tides) at the open-sea
                                                                           boundary (south of the Strait of Otranto).

https://doi.org/10.5194/nhess-21-2427-2021                                       Nat. Hazards Earth Syst. Sci., 21, 2427–2446, 2021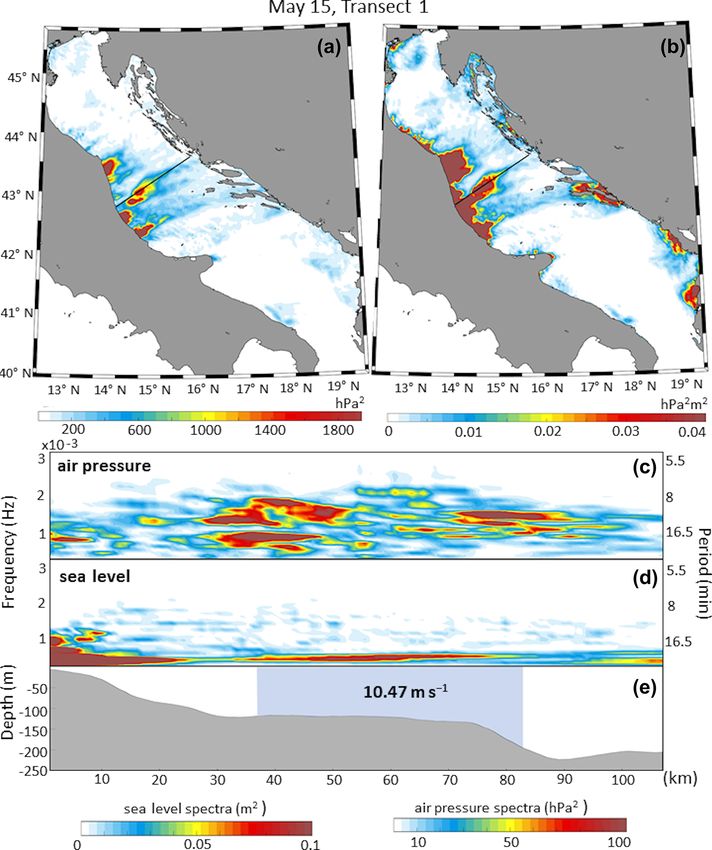
2430                                                      I. Tojčić et al.: Performance of the Adriatic early warning system

   In operational mode (Denamiel et al., 2019a, 2019b) the        and Karniadakis, 2002; Soize and Ghanem, 2004), whereby
AdriSC modelling suite runs every day with the basic module       a particular simulation is forced by synthetic air pressure
initial state and boundary conditions provided by (1) an anal-    fields depending on six stochastic parameters: start location
ysis based on the previous day at 12:00 UTC of the ECMWF          (y0 ), direction (θ), speed (c), period (T ), amplitude (PA),
10 d forecast model (HRES at 0.1◦ resolution; Zsótér et al.,      and width (d) of the disturbance (Denamiel et al., 2018).
2014) for the atmosphere and (2) the Mediterranean Fore-          These six parameters are assumed to have uniform distribu-
casting System (MFS/MEDSEA at 1/24◦ resolution; Pinardi           tions and are adapted to the middle Adriatic meteotsunamis
et al., 2003) for the ocean.                                      on the following intervals: y0 ∈ [41.25◦ N, 43.65◦ N], θ ∈
                                                                  [−π/3, π/2], c ∈ [15 m s−1 , 40 m s−1 ], T ∈ [300 s, 1800 s],
2.2    Observational network                                      PA ∈ [0.5 hPa, 4 hPa], and d ∈ [30 km, 150 km].
                                                                     Within the CMeEWS, the ranges of the stochastic pa-
The observational network (called MESSI, http://www.izor.         rameters used as input to the surrogate model are extracted
hr/messi, last access: 16 August 2021) consists of nine micro-    manually from the forecasted WRF 1.5 km high-pass-filtered
barographs, eight of which are used in this study, measuring      air pressure results, adding the uncertainty of ±0.24◦ N for
air pressure with a Väisälä PTB330 sensor with an accuracy        latitude of origin, ±0.26 rad for direction of propagation,
of ±0.01 hPa, and three tide gauges, two of which are used in     ±0.35 hPa for amplitude, ±150 s for period, and ±12 km
this study, measuring sea level with an OTT radar-level sen-      for width, following the values determined by Denamiel
sor (RLS) with an accuracy of ±1 mm. All instruments are          et al. (2019b). For each sensitive location along the Croatian
set up with a 1 min sampling rate and listed in Table 1. Mi-      coast, the output of the surrogate model consists of the distri-
crobarographs are installed in areas where either the genera-     bution of maximum elevations produced with 20 000 random
tion or the amplification of meteotsunamis is known to occur      combinations of the input parameters selected within the de-
(red circles, Fig. 1): Ancona (An), Ortona (Or), and Vieste       fined ranges. Additionally, to provide a meteotsunami haz-
(Ve) located along the western Adriatic coast, Vis (Vs) and       ard assessment derived from the surrogate model, Denamiel
Svetac (Sv) in the middle of the Adriatic Sea, and Vela Luka      et al. (2019b) prescribed a flooding threshold – defined as
(VL), Stari Grad (SG), and Vrboska (Vr) on the eastern Adri-      the maximum elevation above which flooding would occur
atic coast. Tide gauges are located in Vela Luka (VL) and         – considering the resilience of the coastline at the different
Stari Grad (SG), which are known to be harbours sensitive to      sensitive locations. For Vela Luka, Stari Grad, and Vrboska,
meteotsunamis (red circles, Fig. 1). However, one should be       these thresholds are defined as 1.05, 0.45, and 0.55 m, re-
aware that the tide gauges are located not at the tops of the     spectively. In operational mode, the meteotsunami warning
bays that are normally most affected by meteotsunamis, but        is triggered when the probability of crossing the flooding
about 2 km from the tops; thus, the observed high-frequency       threshold (derived from the maximum elevation distributions
sea level oscillations at tide gauges are 2 to 3 times lower      provided as the surrogate model output) is above or equal to
than reported by eyewitnesses at the bays’ tops.                  10 %.

2.3    Stochastic surrogate model                                 2.4   Methods

Uncertainties linked to the deterministic forecast of the lo-     In order to evaluate the capacity of the CMeEWS to provide
cation, direction, amplitude, speed, period, and width of the     meaningful meteotsunami hazard assessments, the AdriSC
atmospheric disturbances driving meteotsunami events in the       modelling suite is run in operational (hindcast) mode after
Adriatic Sea are known to be quite large (Belušić et al.,        the 11–19 May 2020 multi-meteotsunami event took place.
2007; Šepić et al., 2009; Denamiel et al., 2019a). In other      This means that the 10 d forecasts derived with the ECMWF
words, it is unlikely for atmospheric deterministic models to     HRES and MEDSEA/MSF models on 8–16 May 2020 are
forecast meteotsunamigenic disturbances with proper speed         used to hindcast the meteotsunamigenic conditions of 11–
and period and at the right location. Consequently, deter-        19 May 2020. The model is set up to run for short periods of
ministic ocean models often fail to reproduce or underes-         3 d in the basic module and 1.5 d in the extreme event mod-
timate the meteotsunami events in sensitive harbours (e.g.        ule, with only the last 24 h hourly results – extracted from
Vela Luka, Stari Grad, and Vrboska). In order to improve the      the WRF 1.5 km model in the atmosphere and the ADCIRC
meteotsunami hazard assessments in the Adriatic, the me-          unstructured model in the ocean – used in the following
teotsunami stochastic surrogate model, used to propagate the      analyses. Within the CMeEWS, the meteotsunamigenic dis-
uncertainties of the atmospheric disturbance parameters ex-       turbances reproduced with the AdriSC WRF 1.5 km model
tracted from the WRF 1.5 km model to the maximum am-              are automatically detected if the maximum temporal rate of
plitudes of the meteotsunami waves, was developed within          change (i.e. pressure difference calculated over a 4 min in-
the CMeEWS (Denamiel et al., 2019b, 2020). This model             terval) of the high-pass-filtered air pressure derived at each
optimizes a great number of ADCIRC simulations via a gen-         WRF 1.5 km grid sea point is above 20 Pa min−1 over at least
eralized polynomial chaos expansion (gPCE) method (Xiu            5 % of the sea domain. Such a condition has been proven

Nat. Hazards Earth Syst. Sci., 21, 2427–2446, 2021                                https://doi.org/10.5194/nhess-21-2427-2021
I. Tojčić et al.: Performance of the Adriatic early warning system                                                       2431

to be efficient for the detection of meteotsunamigenic dis-       sure observed and modelled data for the western, middle, and
turbances (Vilibić et al., 2016; Denamiel et al., 2019b). The    eastern Adriatic regions are created (Figs. 4–6).
event mode of the system (i.e. meteotsunamis may occur)               The analyses performed in Sect. 5 are done in two steps
is thus triggered without human intervention for the studied      and aim to better track the propagation of the modelled me-
11–19 May 2020 period.                                            teotsunamigenic disturbances across the Adriatic Sea in or-
   Hereafter, air pressure and sea level data both derived with   der to improve the extraction of the atmospheric parame-
the AdriSC modelling suite and collected from the stations        ters needed to run the stochastic surrogate model. In the first
listed in Table 1 are filtered using a 2 h Kaiser–Bessel filter   step, two different transect sampling criteria are used to se-
to extract high-frequency pressure and sea level oscillations     lect the transects along which the atmospheric disturbances,
characteristic for meteotsunamis. At a very basic level, a di-    and hence the meteotsunami waves, propagate in the model:
rect comparison of modelled (blue lines, Fig. 2) and mea-         one based solely on the atmospheric results (already used op-
sured (red lines, Fig. 2) high-pass-filtered air pressure and     erationally) and a new one also taking into account the ocean
sea level time series is used in Sect. 3 to assess the capacity   results (tested in this study). For the operational sampling
of the AdriSC deterministic model to reproduce the meteot-        criterion, the time variances of the WRF 1.5 km high-pass-
sunami events at the locations of interest during the middle      filtered air pressure results are calculated on a 3 h interval
Adriatic multi-meteotsunami event of 11–19 May 2020.              (i.e. eight time windows per day) over the entire model do-
   Since the failure of deterministic models to reproduce the     main. For each event occurring during the 11–19 May 2020
small-scale atmospheric disturbances at the right locations       period, the transects presented in this study are manually se-
is a known problem, the verification of the AdriSC WRF            lected across the Adriatic Sea following the paths of highest
1.5 km results presented in Sect. 4 tracks the locations where    atmospheric variances for the most energetic time windows.
the highest daily spectral energies occur in both the model       Since the number of time windows and paths with high air
and the observations. In other words, the performance of the      pressure variances varies between the events, the number of
AdriSC WRF 1.5 km model is derived with fast Fourier trans-       transects for each day varies too. For the new sampling crite-
form (FFT) analyses (Cooley and Tukey, 1965) of the high-         rion, the variances of the high-pass-filtered air pressure and
pass-filtered air pressure observed and modelled results cal-     sea level model results estimated on a 3 h interval are multi-
culated every 30 min with a 3 h window at selected locations      plied. This criterion thus tends to zero when the atmospheric
for each day of the reproduced multi-meteotsunami event.          forcing does not trigger any ocean response, i.e. when no res-
First, as the meteotsunamigenic disturbances are known to         onant transfer of energy from the atmosphere to the sea is oc-
propagate from the western to the eastern Adriatic (Vili-         curring. It should be noted that such a criterion could not be
bić and Šepić, 2009; Denamiel et al., 2020), five transects     directly derived from the sea level variances, which provide a
are selected to track the modelled atmospheric disturbances:      noisy and mostly untraceable signal due to the numerous in-
two transects along the Italian coast in the western Adriatic     teractions of ocean waves with the bathymetry including, for
(T4 and T5), one in the middle Adriatic (T3), and two tran-       example, reflection and refraction around the islands. Here-
sects along the Croatian coast in the eastern Adriatic (T1 and    after, the new transect sampling criterion is compared with
T2). Then, for each day of the multi-meteotsunami event, the      the operational one in order to determine whether or not it
AdriSC WRF 1.5 km results are extracted at the actual mi-         would have improved the transect selection. In the second
crobarograph locations and in additional model grid points        step, meteotsunami energy banners defined as the spectro-
(black dots, Fig. 1) selected where the highest daily spec-       grams of the modelled high-pass-filtered air pressure and sea
tral energies are reproduced by the model along the west-         level results are spatially calculated with FFT along the se-
ern (selected points W1 to W7), middle (selected points M1        lected transects for the 3 h time window corresponding to the
and M2), and eastern Adriatic (selected points E1 to E6)          operational transect sampling criterion. As speed remains a
transects. The measurements at the microbarograph location        difficult parameter to extract from the observed and modelled
where the meteotsunami was best observed – i.e. the highest       meteotsunamigenic disturbances, speeds of the tracked at-
spectral energy along the western Adriatic transect for An-       mospheric disturbances along the transects are also visually
cona, Ortona, and Vieste microbarographs, along the middle        determined by analysing the propagation along the transects
Adriatic transect for Vis and Svetac microbarographs, and         of the strongest WRF 1.5 km high-pass-filtered air pressure
along the eastern Adriatic transect for Vrboska, Stari Grad,      peaks. The locations where Proudman resonance is likely
and Vela Luka microbarographs – are also extracted. Finally,      to occur along the transects are then derived by calculating
the time evolutions of the spectra derived from the observa-      where the Froude number (Fr = U/C) ranges from 0.9 and
tions (at the selected stations) are compared with the time       1.1 (i.e. where the speed of the atmospheric disturbances
                                                                                                                     √         U
evolutions of the spectra derived from the WRF 1.5 km re-         matches the speed of the long ocean waves C = gH , with
sults at the point at which the highest energy was reproduced     g the gravitational acceleration and H the local depth). The
(including microbarograph locations). At the end, for the en-     analyses from Sect. 5 are presented with one transect (plotted
tire duration of the multi-meteotsunami event, composites of      from west to east following the propagation of the meteot-
frequency–time spectrograms of high-pass-filtered air pres-       sunami events) per event in the article (Transect 1, Figs. 7–

https://doi.org/10.5194/nhess-21-2427-2021                               Nat. Hazards Earth Syst. Sci., 21, 2427–2446, 2021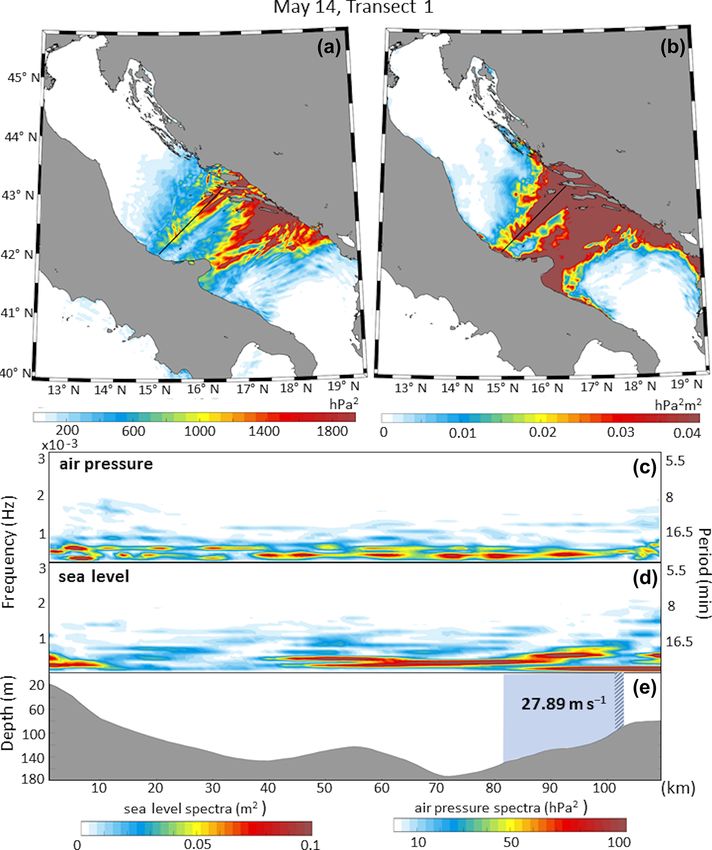
2432                                                           I. Tojčić et al.: Performance of the Adriatic early warning system

Figure 2. Observed (in red) and modelled (in blue) high-pass-filtered time series of air pressure (black rectangles) and sea level (blue
rectangles) during the 11–19 May 2020 period. The distance between adjacent horizontal grid lines (dashed) stands for 1.0 hPa in air pressure
and 0.5 m in sea level for Stari Grad and Vela Luka.

11) selected during the peak of the modelled daily event and             3   Description of the event and background analysis
in the Supplement for the other transects (Figs. S2–S15 in the
Supplement) in order to keep a reasonable article length.                This long-lasting meteotsunami event was reported by
   Finally, for each day of the multi-meteotsunami event,                the media, in particular by eyewitnesses in Vrboska with
the input parameters of the stochastic surrogate model are               two YouTube videos (https://www.youtube.com/watch?v=
then manually extracted from the AdriSC WRF 1.5 km mod-                  vz9G5E9ravc, last access: 16 August 2021; https://www.
elled atmospheric disturbances along the transects selected              youtube.com/watch?v=-aD9q4QMANE, last access: 16 Au-
in Sect. 5. The probabilities of the maximum elevation sur-              gust 2021), and by local web portals in Vela Luka and
passing the flooding thresholds in the Vela Luka, Stari Grad,            Stari Grad. In particular, Dalmacija danas (https://www.
and Vrboska harbours, where flooding occur during the 11–                dalmacijadanas.hr/, last access: 16 August 2021) wrote on
19 May 2020 period, are then determined and the meteot-                  14 May: “Changes in air pressure have a pronounced effect
sunami hazards assessed for each separate event.                         on the sea level in the Adriatic, which is most noticeable on
                                                                         the Dalmatian islands in the last two days. There is a con-
                                                                         stant change in sea level throughout the day, and today it was
                                                                         most pronounced in the afternoon in Vela Luka. [. . . ] the sea
                                                                         level fluctuated in the range of about 70 cm. The sea rose
                                                                         and flooded the waterfront, then receded abruptly, leaving

Nat. Hazards Earth Syst. Sci., 21, 2427–2446, 2021                                        https://doi.org/10.5194/nhess-21-2427-2021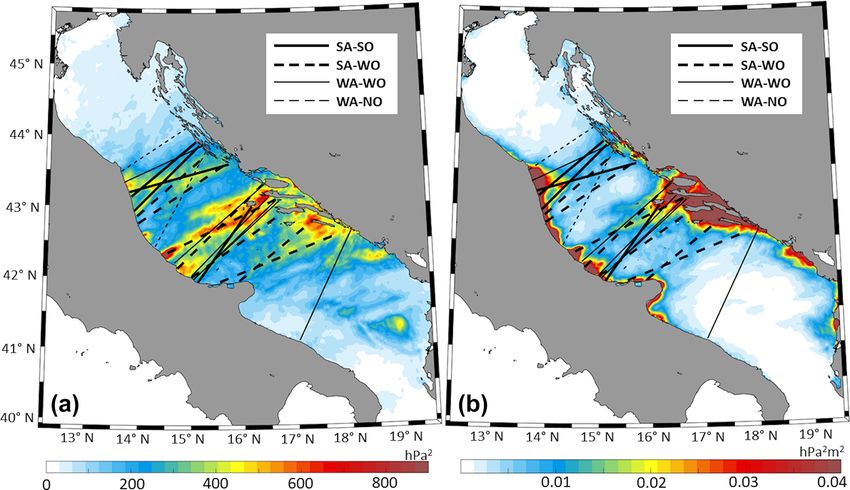
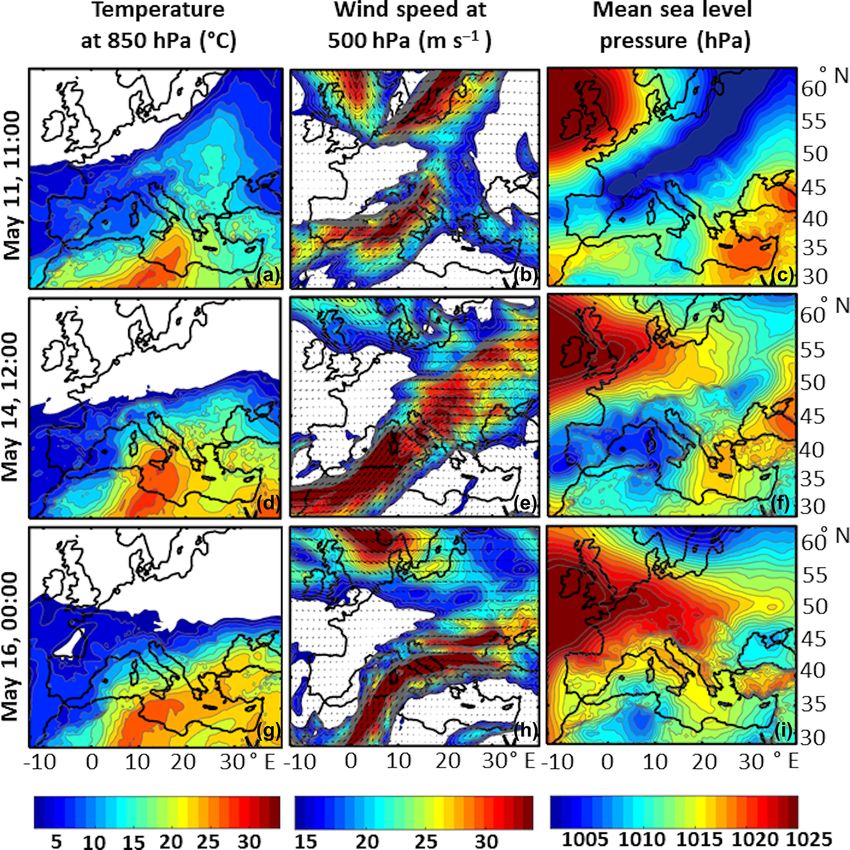
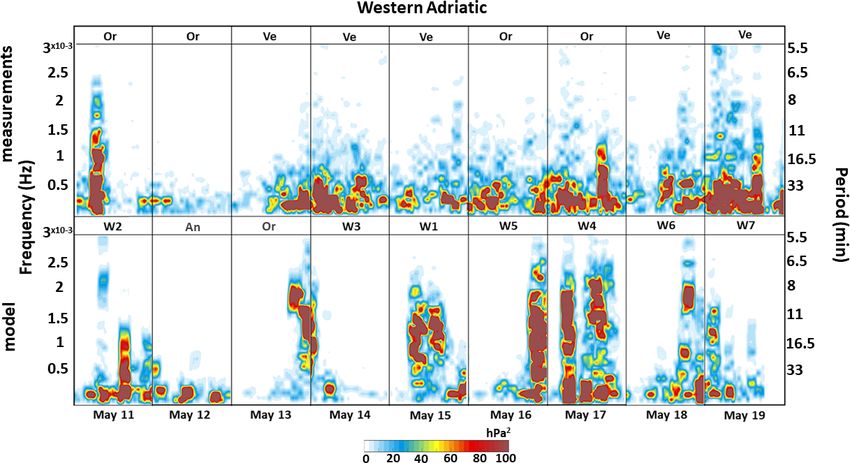
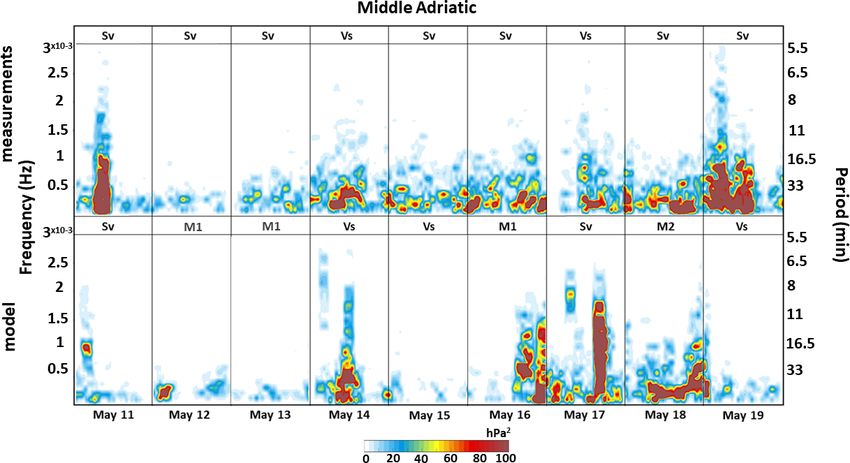
I. Tojčić et al.: Performance of the Adriatic early warning system                                                         2433

the boats dry. The phenomenon was also recorded on Hvar,           pressure over the Adriatic indicates either a trough stretching
for example in Stari Grad, but it was less pronounced.” On         from northern Europe, as on 11 May, or a cyclone that was
16 May another local web portal, Morski.hr, published an           deeper on 14 May and quite weak on 16 May. These syn-
article titled Meteotsunami in Vela Luka: The sea is pour-         optic conditions are known to occur during Mediterranean
ing into shops and cafes. This has been going on for three         meteotsunamis (Jansá et al., 2007; Vilibić et al., 2008; Šepić
days now! The following is the testimony of a local, Ljubo         et al., 2016) when atmospheric disturbances (particularly at-
Padovan. “This is something we haven’t had in years and it         mospheric gravity waves) can be generated along the strong
has been going on for full three days. The sea got into some       frontal gradients of the jet streams, as seen in Fig. 3, and
shops and cafes again. When the sea recedes, one can walk          propagate over long distances in the form of so-called ducted
from one side of the bay to the other. The sea flooded every-      waves (Lindzen and Tung, 1976; Monserrat and Thorpe,
thing again last night. The situation is not calming down even     1996).
after three days; that is very unusual.”
   Concerning the observations (Fig. 2), on 11 May intense
high-frequency sea level oscillations reached up to 80 cm of       4   Measured and modelled meteotsunamigenic
height (crest to trough) and a 16 min period at 09:40 UTC in           disturbances
Vela Luka as well as 53 cm of height and a 18 min period at
11:07 UTC in Stari Grad. Additionally, all microbarographs         The capacity of the AdriSC WRF 1.5 km and ADCIRC mod-
recorded an intensification of the air pressure oscillations,      els to reproduce the meteotsunami events during the 11–
with a maximum high-frequency amplitude of 3.1 hPa and             19 May 2020 period is first assessed qualitatively by com-
a period of 13 min documented for Vela Luka. Air pressure          paring the observed (in red) and modelled (in blue) time se-
oscillations calmed down on 12 and 13 May but, following           ries presented in Fig. 2. It shows that the events on 11 and
reported flooding, increased again on 14 May, especially in        16 May are completely missed by both the WRF 1.5 km
Ancona and Vieste. On this day, in Vela Luka, air pressure         and ADCIRC models. However, the meteotsunami event of
oscillations were about 2 times weaker than on 11 May, but         14 May is partially captured by the AdriSC model. Air pres-
the height of sea level oscillations almost reached 80 cm with     sure oscillations are indeed simulated in Vieste, Vis, Stari
a 15 min period. However, in Stari Grad, sea levels oscillated     Grad, Vela Luka, and Vrboska, along with weaker than mea-
between −25 and 25 cm from 08:00 to 16:00 UTC. Even                sured sea level oscillations in Stari Grad and Vela Luka.
though the sea level oscillations in Stari Grad harbour were       AdriSC model results for 12 and 13 May are generally in
2 times smaller than during 11 May, flooding still occurred,       accordance with the measurements, with no strong oscilla-
probably due to the additional effects of tidal elevation and/or   tions of pressure and sea level, but with slightly underesti-
storm surge. Lower-intensity oscillations of both air pressure     mated pressure and sea level oscillations in Ancona, Vieste,
and sea level followed on the next days until around midnight      and Stari Grad and overestimated pressure oscillations in Or-
on 16 May, when another meteotsunami event took place. For         tona. The model results for 17 May are also generally in ac-
this event, air pressure oscillations were unusually low, even     cordance with the measurements, with underestimated pres-
in Ancona, which recorded the strongest ones. However, in          sure and sea level oscillations in Ortona, Stari Grad, and Vela
Vela Luka the height of the sea level oscillations went up to      Luka and overestimated pressure oscillations in Svetac. Even
80 cm with a 13 min period. Despite the reports of flooding        though the deterministic AdriSC model fails to forecast two
in Stari Grad, identically to 14 May, the sea levels only oscil-   of the three observed meteotsunami events, the event mode of
lated between −25 and 25 cm.                                       the CMeEWS is triggered for all the days of the 11–19 May
   The pressure oscillations did not completely vanish in the      2020 period except for 12 and 13 May for which no false
following days, and on 19 May strong air pressure distur-          alarms would have been triggered (Fig. S1 in the Supple-
bances with heights above 2.5 hPa occurred in Svetac, Vi-          ment).
este, Vis, Vrboska, and Vela Luka. However, no flooding is            Measured and modelled composites of air pressure
recorded in Vela Luka or Stari Grad where the recorded sea         frequency–time spectrograms in the eastern, middle, and
level oscillations did not surpass 30 and 20 cm, respectively.     western Adriatic Sea (Figs. 4–6) are thus used to quantita-
   The synoptic conditions over Europe derived from ERA5           tively compare the energy content of the meteotsunamigenic
reanalysis (Hersbach et al., 2020) – temperature at 850 hPa,       disturbances as observed by the microbarographs and fore-
winds at 500 hPa, and mean sea level air pressure (Fig. 3)         casted with the WRF 1.5 km model at grid points W1–W7,
– are extracted at times close to the flooding of Vela Luka,       M1–M2, and E1–E6, in addition to grid points next to micro-
Stari Grad, and Vrboska harbours: in the morning on 11 May,        barograph stations as described in Sect. 2. Overall, no pro-
around midday on 14 May, and around midnight on 16 May.            nounced energy peaks are found in the spectrograms, which
For all the flooding events, the conditions show the advection     is typical for spectra of air pressure characterized by a num-
of warm air from the Sahara towards the Adriatic at 850 hPa,       ber of oscillatory movements with no dominant period (Mon-
associated with strong southwesterly winds at 500 hPa with         serrat and Thorpe, 1992; Zemunik et al., 2020). Addition-
speeds over 30 m s−1 . Additionally, the mean sea level air        ally, in operational mode, the CMeEWS would have provided

https://doi.org/10.5194/nhess-21-2427-2021                                Nat. Hazards Earth Syst. Sci., 21, 2427–2446, 2021
2434                                                           I. Tojčić et al.: Performance of the Adriatic early warning system

Figure 3. Synoptic settings over Europe – temperature at 850 hPa (left panels), winds at 500 hPa (middle panels), and mean sea level pressure
(right panels) – extracted from ERA5 reanalysis at times closest to the flooding in Vela Luka, Stari Grad, and Vrboska harbours.

warnings for a full day (next 30 h period including night                elled atmospheric disturbances are less energetic and located
hours past midnight) and not for a precise time. It may thus             further north compared to the observed ones.
be noticed that, despite this analysis being temporal, discus-              During the calm period between 12 and 13 May, the en-
sions about the differences between modelled and measured                ergy of the observed spectrograms is much lower than during
timing of the meteotsunami events are not relevant for the               the meteotsunami events. The model produces extremely low
model verification.                                                      energies for both days in all regions, with high energies at fre-
   For 11 May, the highest energies from the observed com-               quencies up to 2.0 × 10⁻³ Hz only in Ortona, in the western
posite are located at Ortona with frequencies below 1.5 ×                Adriatic region, on the evening of 13 May.
10−3 Hz (11 min period) and around 1.8×10⁻³ Hz (9.25 min                    However, on 14 May, the highest energy values from the
period) for the western Adriatic region, at Svetac with fre-             observed composite are found at Vieste with frequencies be-
quencies below 1.0 × 10⁻³ Hz (16.5 min period) for the mid-              low 0.7 × 10⁻³ Hz (24 min period) for the western Adriatic
dle Adriatic region, and at Vela Luka with frequencies below             region, at Vis with frequencies below 0.55×10⁻³ Hz (30 min
1.1 × 10⁻³ Hz (15 min period) as well as with 1.4 × 10⁻³ Hz              period) for the middle Adriatic region, and at Stari Grad with
(12 min) and 1.9×10⁻³ Hz (8.8 min) frequencies for the east-             frequencies below 0.5×10⁻³ Hz (33 min period) for the east-
ern Adriatic region. For this event, the WRF 1.5 km model                ern Adriatic region. The highest energies simulated by the
produces substantially lower energies at the same frequen-               model are located at W3 with frequencies up to 1.8×10⁻³ Hz
cies as the observed composite at E1, located far northwest              (9.25 min period) for the western Adriatic region, at Vis with
from Vela Luka, but with high energies at frequencies up to              frequencies up to 1.1 × 10⁻³ Hz (15 min period) for the mid-
1.1 × 10⁻³ Hz (15 min period) in the western Adriatic, up to             dle Adriatic region, and at E6 located south from Stari Grad
0.8×10⁻³ Hz (20.8 min period) in the middle Adriatic, and at             with frequencies up to 1.5 × 10⁻³ Hz (11 min period) for the
1.0 × 10⁻³ Hz (16.5 min period). This implies that the mod-              eastern Adriatic region. It is unlikely that the modelled at-

Nat. Hazards Earth Syst. Sci., 21, 2427–2446, 2021                                        https://doi.org/10.5194/nhess-21-2427-2021
I. Tojčić et al.: Performance of the Adriatic early warning system                                                            2435

Figure 4. Modelled and measured composites of high-pass-filtered air pressure frequency–time spectrograms for the western Adriatic re-
gion. Maximum daily energies measured by the microbarographs (observed composite) and modelled at one WRF 1.5 km model grid point
(modelled composite) are collocated.

Figure 5. As in Fig. 4, but for the middle Adriatic region.

https://doi.org/10.5194/nhess-21-2427-2021                                  Nat. Hazards Earth Syst. Sci., 21, 2427–2446, 2021
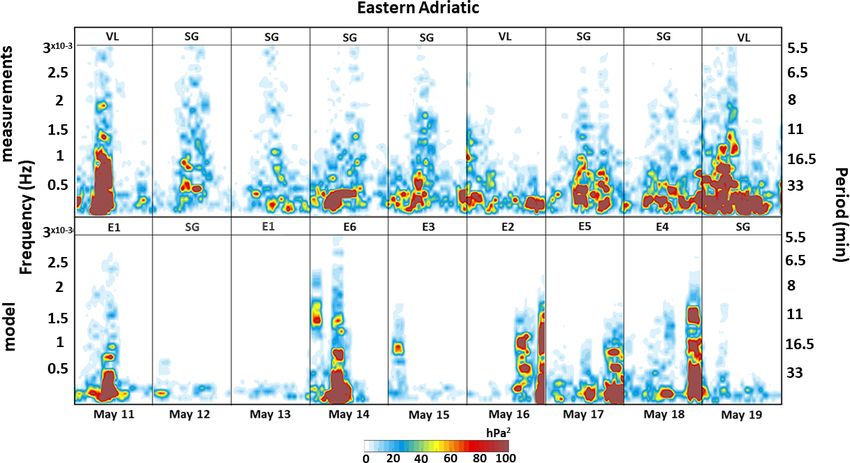
2436                                                           I. Tojčić et al.: Performance of the Adriatic early warning system

Figure 6. As in Fig. 4, but for the eastern Adriatic region.

mospheric disturbance can travel from W3 to E6 by diag-                1.0×10⁻³ Hz (16.5 min period) at E5 for the eastern Adriatic
onally crossing the middle Adriatic region. The results are            region. The spatial layout of the highest-energy points again
thus probably coming from more than one atmospheric dis-               illustrates the limitations of the applied methodology when
turbance that occurred during 14 May and changed energies              multiple disturbances are simulated. Nevertheless, obtained
when crossing the Adriatic.                                            results imply that the different disturbances in the model are
   For 15 and 16 May, the energies of the observed compos-             more energetic than the ones observed by the microbaro-
ite are higher than during the calm background period (be-             graphs.
tween 12 and 13 May) but lower than during the meteot-                    More energy is found in the observed spectrograms for
sunami events. For 15 May, the model produces high energies            18 May than during the calm background period but less
at frequencies up to 2.0×10⁻³ Hz (8 min period) at W1 in the           than during the meteotsunami events. The model, however,
western Adriatic region. However, this disturbance does not            produces high energies at high frequencies of about 2.0 ×
propagate to the east as the spectrograms in the middle and            10−3 Hz (8 min period) at W6 for the western Adriatic re-
eastern Adriatic regions have extremely low energy. Energy             gion and 1.75×10⁻³ Hz (9.5 min period) at E4 for the eastern
in the model for 16 May is negligible in the western Adriatic          Adriatic region. The atmospheric disturbance energy at M2
region, but for the middle and eastern Adriatic regions high           is higher for the middle Adriatic region than for the western
energies at frequencies below 1.5 × 10⁻³ Hz are found at M1            and eastern Adriatic regions, particularly for lower frequen-
and E2, respectively. In other words, even though the me-              cies.
teotsunami event of 16 May is missed by the AdriSC model                  Conditions were again more energetic on 19 May, with the
(Fig. 2), the WRF 1.5 km model simulates a strong meteot-              highest energies in the observed composite at frequencies up
sunamigenic disturbance shifted northwestward compared to              to 1.5×10⁻³ Hz (11 min period) at Vieste and Vela Luka and
the observations.                                                      up to 1.25 × 10⁻³ Hz (13 min period) at Svetac. The model
   On 17 May the highest energies from the observed com-               fails to reproduce these disturbances and only simulates high
posite are located at Ortona for the western Adriatic region,          energies at W7, at the southernmost point of the studied area.
at Vis for the middle Adriatic region, and at Stari Grad for the          Briefly, periods between 10 and 20 min – typical of me-
eastern Adriatic region. High energies are also found in the           teotsunamigenic disturbances – are found to often occur in
modelled composite at up to 2.2 × 10⁻³ Hz (7.5 min period)             the analysis of the frequency–time spectrogram composites
at W4 for the western Adriatic region, up to 1.8 × 10⁻³ Hz             (Figs. 4 to 6). Additionally, systematic biases exist in the
(9 min) at Svetac for the middle Adriatic region, and up to            forecasted atmospheric disturbances, as they are often sim-

Nat. Hazards Earth Syst. Sci., 21, 2427–2446, 2021                                    https://doi.org/10.5194/nhess-21-2427-2021
I. Tojčić et al.: Performance of the Adriatic early warning system 2437
ulated further northwest than the observed ones. Finally, this not in the ocean, can be found on spectrograms of transects
analysis has demonstrated that the Adriatic high-frequency in Figs. S4 and S6. These disturbances are located too south
sea level oscillations of 11–19 May 2020 were induced by or too north of the domain to cause meteotsunamis in the
atmospheric forcing of diverse spatial and temporal charac- harbours of interest. Also, the speeds of the tracked distur-
teristics. bances in Figs. S4 and S5 are not within the range of speeds
of meteotsunamigenic disturbances.
Two atmospheric disturbances are tracked for 15 May and
5 Meteotsunami energy banners presented in Figs. 9 and S7 in the Supplement. The maxi-
mum air pressure variance (Fig. 9, top left panel) and the
Given the lack of reliability of the deterministic AdriSC associated maximum in the new transect sampling criterion
model to properly forecast spatial and temporal characteris- (Fig. 9, top right panel) are located too northwest to have
tics of the multi-meteotsunami event during the 11–19 May caused the Vela Luka and Stari Grad flooding on the night
2020 period, the warnings released by the CMeEWS would of 15 to 16 May. Also, despite the high energies in the at-
have fully relied on the results of the stochastic surrogate mosphere, no transfer to the sea can be seen along the tran-
model forced with input parameters extracted from the WRF sect, being restricted just near the coast. This is probably due
1.5 km simulations. The values of the six stochastic parame- to the low speed of the disturbance (i.e. 10.5 m s−1 ) and the
ters – which serve as input for the stochastic surrogate model depth (i.e. over 100 m) along the transect. Spectrograms in
– are derived from the modelled meteotsunamigenic distur- Fig. S7 display high energies and a strong ocean response at
bances. The meteotsunami energy banners, including their the beginning of the transect but negligibly small energy val-
impact on the ocean, are thus documented along the selected ues on the rest of the transect, which is a good example of
transects where these parameters are extracted. As described a dissipating disturbance. The low speed of the atmospheric
in Sect. 2, the operational sampling criterion (hereafter re- disturbance of only 11.6 m s−1 and the lack of flat seabed
ferred as air pressure variance), the new transect sampling could explain such behaviour.
criterion, the atmospheric and ocean spectrograms, and the Three disturbances are analysed for 16 May and presented
Proudman resonance along the most energetic transects are in Figs. 10, S8, and S9. Two northwestwardly shifted atmo-
displayed in Figs. 7–11 and in the Supplement (Figs. S2– spheric disturbances (Figs. 10 and S8) are extremely ener-
S15) for each day of the multi-meteotsunami event. getic, and the transfer of energy to the sea is strong at the
For 11 May, the modelled air pressure variances (Figs. 7, beginning of the transects. Speeds of the disturbances, of 7.1
S2, and S3, top left panel) and the associated new transect and 11.3 m s−1 , are low compared to the normal speeds for
sampling criterion (Figs. 7, S2, and S3, top right panel) in- meteotsunamigenic disturbances. The southern disturbance
dicate maximum meteotsunami energy banners located too (Fig. S9) has a greater speed of 25 m s−1 , but the atmosphere
far northwest from Vela Luka, Vrboska, and Stari Grad har- is not highly energetic and the transfer of energy to the sea
bours, where the meteotsunami event is observed. Never- is not strong anywhere but near the coast. This is displayed
theless, the atmosphere over the two selected transects is in the top panels and in spectrograms of Fig. S9. It should be
highly energetic and the pronounced disturbances travel with noticed that the air–sea interaction is the strongest over the
a speed between 12.5 and 33.32 m s−1 over relatively shallow area where Proudman resonance is likely to happen.
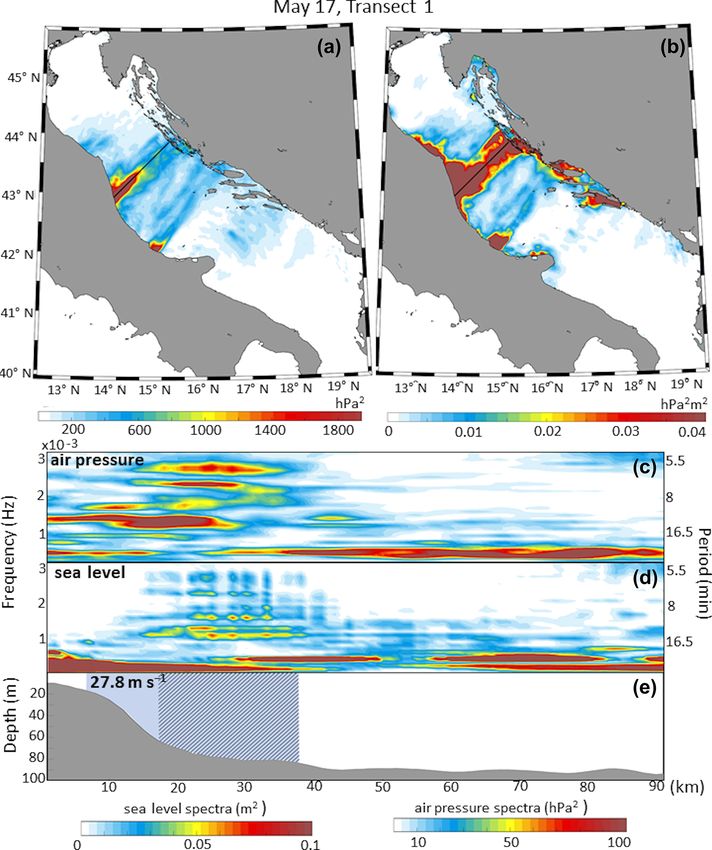
areas. Despite the Proudman resonance being possible over For 17 May, two of three modelled atmospheric distur-
a large section of the transects, the energy transferred to the bances (Figs. S10 and S11) are located where they could
ocean is not substantial anywhere but near the coast. have caused meteotsunamis along the eastern Adriatic coast-
For 14 May, several modelled atmospheric disturbances line. However, the speeds of these disturbances, ranging from
are located in the middle Adriatic region (Figs. 8 and S4–S6 10.3 to 12.1 m s−1 , are too low and the atmosphere and the
in the Supplement, top left panel). The location of the highest sea are not as energetic as they are over the transect anal-
air pressure variances and the associated new transect sam- ysed in Fig. 11. The atmosphere is extremely energetic over
pling criterion (top panels, Fig. 8), as well as the speed of the selected transect and, since energy is well transferred to
the tracked most energetic disturbance of 27.9 m s−1 , make the ocean, high energies occurred for high frequencies in the
this disturbance a good candidate for causing the meteot- ocean too. Spectrograms in Fig. 11 show that ocean’s re-
sunamis that flooded Vela Luka, Vrboska, and Stari Grad har- sponse to atmospheric disturbance is pronounced over the
bours on this day. Nevertheless, the transect is in deep water whole transect, but it is the strongest over the section which
with changing bathymetry, and therefore the Proudman res- satisfied the Proudman resonance conditions. The distur-
onance is only likely to happen over a small part of the tran- bance travelled at 27.8 m s−1 , but as seen in the top panels, it
sect, while other effects, including edge waves, strong topo- is again located in the northern part of the middle Adriatic.
graphical enhancement, and refractions on the islands in the For 18 May, the modelled atmospheric disturbances
pathway of atmospheric disturbances, may be important for (Figs. S12–S14) cross the middle Adriatic from southwest
the generation of meteotsunami waves in the middle Adriatic to northeast, over the common path of meteotsunamigenic
(Šepić et al., 2016). Higher energies in the atmosphere, but disturbances. Speeds of the tracked disturbances vary from
https://doi.org/10.5194/nhess-21-2427-2021 Nat. Hazards Earth Syst. Sci., 21, 2427–2446, 20212438 I. Tojčić et al.: Performance of the Adriatic early warning system
Figure 7. Meteotsunamigenic disturbance of 11 May 2020 along Transect 1. The air pressure spatial variance (a) and new transect sampling
criterion (b) have a mark on the selected transect containing a meteotsunami energy banner (solid black line). Spectrograms of high-pass-
filtered mean sea level air pressure (air pressure) and sea level along the selected transect (c, d) are conjoined by sections of the associated
depth profile (e) where the Proudman resonance is likely to occur (shaded with diagonal stripes) and where the speed of the disturbance is
calculated (in blue).
20.2 to 30.3 m s−1 . Even though the atmosphere is energetic take place at the eastern end of the transect (top right panel,
for the transects presented in Figs. S12 and S14, the energy Fig. S15).
of the sea is not significantly higher than for the transect Averaged air pressure variance and the averaged new tran-
in Fig. S13, with low energy in the atmosphere. Therefore, sect sampling criterion derived from all the extracted tran-
despite the appropriate speeds and locations of the meteot- sects between 11 and 19 May 2020 are presented in Fig. 12,
sunamigenic disturbances, the energy is not well transferred together with the selected transects. The transects are classi-
from the atmosphere to the sea and no meteotsunami event is fied into four different categories emphasizing the strength of
modelled. the atmospheric disturbances as well as the energy transfer
For 19 May there is only one modelled disturbance, travel- from the atmosphere to the ocean. The most intense atmo-
ling at 19.4 m s−1 far south of the analysed region (Fig. S15). spheric activity and air–sea interactions are located across
The energy content of both the atmosphere and the sea is the middle Adriatic region. Additionally, despite relatively
low for the selected transect, but some air–sea interactions low averaged air pressure variances, the averaged values of
the new transect sampling criterion are the highest along the
Nat. Hazards Earth Syst. Sci., 21, 2427–2446, 2021 https://doi.org/10.5194/nhess-21-2427-2021I. Tojčić et al.: Performance of the Adriatic early warning system 2439 Figure 8. As in Fig. 7, but for the meteotsunamigenic disturbance of 14 May 2020 along Transect 1. Dalmatian islands and the middle Adriatic Italian coastline. the air–sea interactions, these interactions are located along These results thus confirm that the intensity of the atmo- the same transects as captured by the highest values of the spheric disturbances is less important than the resonance – air pressure variance. As efficiency is important in an early i.e. appropriate speed, period, and depth along the transects warning system, it can thus be concluded that the use of the (Denamiel et al., 2020) – and, of course, the bathymetry. ocean model results to better select the transect with max- Briefly, the presented results of the travelling air–sea me- imum meteotsunami generation is not necessary in opera- teotsunami energy banners show that the ocean model re- tional mode, since it would be more time-consuming with sponse to the atmospheric forcing highly depends on both no significant value added to the process of the transect se- the location and the frequency of the meteotsunamigenic dis- lection. turbances, which are in our study often modelled too north- west of the most affected locations. Finally, the introduced new transect sampling criterion does not seem to overall fa- 6 Stochastic hazard assessment cilitate the decision-making process in terms of the transect selection, since all the transects selected by this criterion The analysis presented in previous sections has proven that would have also been selected following the highest values the operational deterministic AdriSC model is not capable of air pressure variances only. Even though for some events of properly reproducing the meteotsunami events of the 11– (e.g. Figs. 9–11) the new criterion highlights the strength of 19 May 2020 period. However, parameters like location, am- https://doi.org/10.5194/nhess-21-2427-2021 Nat. Hazards Earth Syst. Sci., 21, 2427–2446, 2021
2440                                                         I. Tojčić et al.: Performance of the Adriatic early warning system

Figure 9. As in Fig. 7, but for the meteotsunamigenic disturbance of 15 May 2020 along Transect 1.

plitude, direction, speed, period, and width can be extracted          pass-filtered sea levels extracted between 14 and 16 May
from the atmospheric disturbances produced by the WRF                  at the tide gauge location. Additionally, the meteotsunami
1.5 km model and used as inputs for the stochastic surrogate           warning would have been wrongly triggered on 17 and 19
model. For the 11–19 May 2020 period (with the exception of            May in Vela Luka and 15, 16, 17, and 19 May in Vrboska
12 and 13 May), the stochastic surrogate model is thus run for         when no flooding was reported. It is worth noticing that, for
Vela Luka, Stari Grad, and Vrboska with input variables from           17 and 19 May 2020, the forecasted meteotsunamigenic con-
the atmospheric disturbances selected for each day along the           ditions capable of triggering the event mode of the CMeEWS
transects presented in the previous section. The probabilities         are, in fact, in good agreement with the strong air pressure os-
of the maximum elevation surpassing the flooding threshold             cillations observed along the western Adriatic coast (Fig. 2).
are presented in Table 2.                                              Additionally, as already shown in Denamiel et al. (2019b),
   For the 11–19 May 2020 period when flooding and strong              false alarms are easily triggered in Vrboska. This may be
sea oscillations were reported for Vela Luka, Stari Grad,              linked to either the poor representation of the Vrboska ge-
and Vrboska (in italics, Table 2), the meteotsunami warn-              omorphology within the ADCIRC model used to create the
ing would have been triggered in Vela Luka and Vrboska for             surrogate model or the choice of the flooding threshold and
all the events, but only for 11 May in Stari Grad. The results         should therefore be further investigated.
found in Stari Grad are, however, in good agreement with the
moderate oscillations (amplitude of 25–30 cm) of the high-

Nat. Hazards Earth Syst. Sci., 21, 2427–2446, 2021                                     https://doi.org/10.5194/nhess-21-2427-2021
I. Tojčić et al.: Performance of the Adriatic early warning system                                                              2441

Figure 10. As in Fig. 7, but for the meteotsunamigenic disturbance of 16 May 2020 along Transect 1.

7   Summary and conclusions                                           sunami. During this period, intense high-frequency air pres-
                                                                      sure and sea level oscillations were observed and recorded in
In the Adriatic Sea, recurrent meteotsunami events are                the middle Adriatic, with maximum sea levels reached on 11,
known to strongly impact the way of life of the coastal               14, and 16 May in Vela Luka, Stari Grad, and Vrboska.
communities, particularly in the Dalmatian islands where                 One of the main originalities of this study is that the perfor-
they can generate serious flooding. In this study, the ca-            mances of the CMeEWS operational models – i.e. the WRF
pacity of the Croatian meteotsunami early warning system              1.5 km atmospheric model and the ADCIRC ocean model
(CMeEWS), which provides meteotsunami hazard assess-                  from the AdriSC modelling suite – are assessed via energy
ments depending on the deterministically forecasted and               banners. Analysis of composites of frequency–time spec-
measured air pressure disturbances and the stochastically de-         trograms has shown that the deterministic models are gen-
duced maximum elevation distributions derived with the sur-           erally not capable of reproducing the meteotsunami events
rogate model, is examined. As it is no longer operational, the        in affected bays but can produce strong meteotsunamigenic
capacity of the CMeEWS is evaluated retroactively for the             disturbances often shifted northwestward from them. It was
multi-event of 11–19 May 2020. This event is of particular            demonstrated that, even though the strongest atmospheric ac-
interest because meteotsunamigenic synoptic patterns over             tivity was modelled in the middle Adriatic along common
the Adriatic were present during a prolonged period of about          air pressure disturbance pathways, the meteotsunami events
5 to 10 d, which was not previously observed for any meteot-          were always missed by the ADCIRC ocean model at Vela

https://doi.org/10.5194/nhess-21-2427-2021                                    Nat. Hazards Earth Syst. Sci., 21, 2427–2446, 2021
2442 I. Tojčić et al.: Performance of the Adriatic early warning system
Figure 11. As in Fig. 7, but for the meteotsunamigenic disturbance of 17 May 2020 along Transect 1.
Luka and Stari Grad during the 11–19 May 2020 period due Given these results, the following question can be raised:
to a shift in location of the modelled atmospheric distur- should the ADCIRC ocean model be run in operational mode
bances. This most probably indicates that the frequency of within the CMeEWS, or should the meteotsunami hazard
the air pressure disturbances is not properly reproduced by assessments be derived solely with the stochastic surrogate
the WRF 1.5 km model, posing the question of the appro- model? In the presented case, as the deterministic ocean
priateness of state-of-the-art atmospheric models in terms of model fails for all events due to a shift in the location of
their resolution and set-up (Horvath and Vilibić, 2014). Fi- the modelled atmospheric disturbances, the question is eas-
nally, this study also highlighted the fact that using the ocean ily answered. And, in general, due to the uncertainties as-
model results in combination with the atmospheric model re- sociated with operational modelling of meteotsunamigenic
sults with the so-called new transect sampling criterion does disturbances, the stochastic approach has proven to be an op-
not help to improve the selection of atmospheric conditions timal option. Nevertheless, the ADCIRC ocean model can
needed to feed the stochastic meteotsunami surrogate model. still be used for other hazards, such as extreme storm surges
However, due to the systematic error link to the shift of the associated with wind waves, and not only for meteotsunami
disturbances towards the north, it may be envisioned in the events.
future to apply a correction concerning the starting point lo- Concerning the evaluation of the stochastic model fed
cation before using the surrogate model. by the extracted meteotsunamigenic air pressure conditions
along the selected transects, in most of the cases and despite
Nat. Hazards Earth Syst. Sci., 21, 2427–2446, 2021 https://doi.org/10.5194/nhess-21-2427-2021You can also read