A three dimensional musculoskeletal model of the dog - Nature
←
→
Page content transcription
If your browser does not render page correctly, please read the page content below
www.nature.com/scientificreports
OPEN A three‑dimensional
musculoskeletal model of the dog
Heiko Stark1*, Martin S. Fischer1, Alexander Hunt2, Fletcher Young3, Roger Quinn3 &
Emanuel Andrada1
The domestic dog is interesting to investigate because of the wide range of body size, body mass,
and physique in the many breeds. In the last several years, the number of clinical and biomechanical
studies on dog locomotion has increased. However, the relationship between body structure
and joint load during locomotion, as well as between joint load and degenerative diseases of the
locomotor system (e.g. dysplasia), are not sufficiently understood. Collecting this data through in vivo
measurements/records of joint forces and loads on deep/small muscles is complex, invasive, and
sometimes unethical. The use of detailed musculoskeletal models may help fill the knowledge gap.
We describe here the methods we used to create a detailed musculoskeletal model with 84 degrees
of freedom and 134 muscles. Our model has three key-features: three-dimensionality, scalability, and
modularity. We tested the validity of the model by identifying forelimb muscle synergies of a walking
Beagle. We used inverse dynamics and static optimization to estimate muscle activations based on
experimental data. We identified three muscle synergy groups by using hierarchical clustering. The
activation patterns predicted from the model exhibit good agreement with experimental data for
most of the forelimb muscles. We expect that our model will speed up the analysis of how body size,
physique, agility, and disease influence neuronal control and joint loading in dog locomotion.
The Dog (canis lupus f. familiaris) is interesting to investigate because of the wide ranges of body size, body mass,
and physique of their more than 400 globally recognized breeds1.
There exists an important body of work related to kinematic and dynamical differences between healthy
dogs and dogs with musculoskeletal diseases2–5. However, the relationship between body structure and joint
load during locomotion, as well as between joint load and degenerative diseases of the locomotor system (e.g.
dysplasia), are not sufficiently understood. To investigate how body size, physique, agility, and diseases influence
joint control and load in dogs, it is necessary to model the morphology with the external and internal forces that
produce locomotion. To analyze joint mechanics, inverse dynamic analysis is typically u sed6–9. Inverse dynam-
ics analysis is a method of the engineering sciences that combines kinetic, kinematic, and morphometric data
to provide an indirect way to describe the causes of movement patterns. In order to quantify the joint load, the
internal transmission of force through the skeleton, and consequently the generation of force in the muscles
is required10. Simulated models, rather than invasive methods, are best suited to evaluate force transmission
between segmental e lements10–15. Specific dog musculoskeletal models exist for the h indlimbs11,16–18. However,
a model with all four legs and the musculoskeletal area between them is necessary to address questions about
adaptivity. For example, in the case that one limb is injured or perturbed, a whole model can help to understand
compensation mechanisms at joint and muscular levels in every limb. In addition, it could help to analyze how
reflexes, central pattern generators, and higher locomotion centers control those adaptations.
Whenever a model is developed to test a scientific hypothesis, the amount of complexity required to address
the question must be determined19. Investigations of the general behaviour of the whole system (global dynamics)
require a different approach than the analysis of joint mechanics or joint load. Thus, one needs to choose between
simple models such as the spring-mass-model20, more complex multi-body models, or detailed models of body
parts using the Finite Element Method (FEM). Model parameters (constant quantities during the simulation,
e.g. mass or geometry), and model variables (speed, forces), must be obtained from experiments, literature, or
‘educated guesses’. Thus, the availability of model parameters and variables can influence the model’s complex-
ity. In general, simple models (also termed templates by Full and K oditschek21) are well suited to study the basic
principles of movement, while more complex models (termed anchors by Full and K oditschek21) provide more
1
Institute of Zoology and Evolutionary Research with Phyletic Museum, Friedrich-Schiller-University Jena,
Jena, Germany. 2Department of Mechanical and Material Engineering, Portland State University, Portland,
USA. 3Department of Mechanical and Aerospace Engineering, Case Western Reserve University, Cleveland,
USA. *email: heiko@starkrats.de
Scientific Reports | (2021) 11:11335 | https://doi.org/10.1038/s41598-021-90058-0 1
Vol.:(0123456789)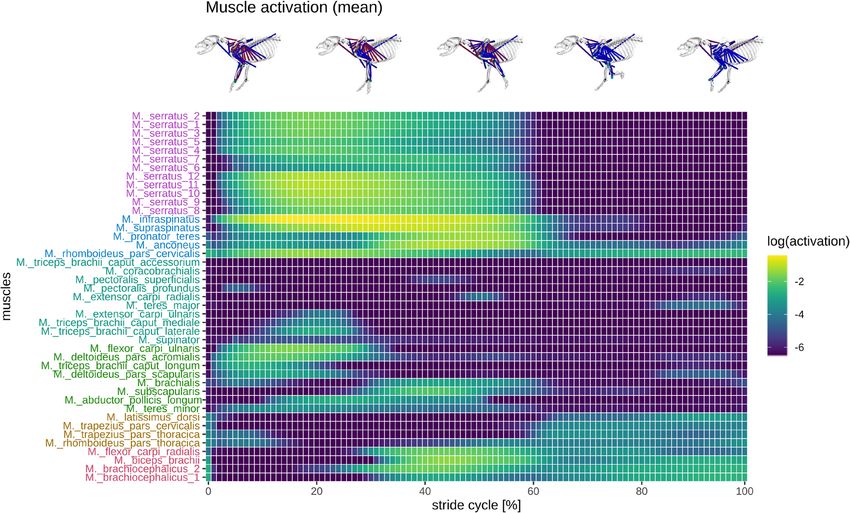
www.nature.com/scientificreports/
Figure 1. Abstraction of the forward and inverse simulation parameter chain for forelimb locomotion.
Depending on the direction of the examination, the chain starts on the left or right side. The figure was created
with the software package LibreOffice71.
detailed insights. A mixture of both extremes can be used to break-down the multidimensionality of complex
models22.
Two distinct methods are used to generate simulations (Fig. 1). Forward simulations calculate specific torques
in the joints on the basis of innervation data, electromyography (EMG) data, or muscle forces. These forces gener-
ate joint movement and finally locomotion through interactions with the environment. An inverse simulation,
in which the joint torques are calculated from kinematic and kinetic data, is used to find muscle forces, muscle
activation patterns, or innervation data a posteriori via static or dynamic optimization. The transformation of
torques into muscle forces is done by numerical approximation based on muscle insertion points and other
anatomical data. Note that for any recorded joint kinematics and joint torques, the muscle forces solution is not
unique (underdetermined system).
Aim. We describe here the methods we used to create a detailed musculoskeletal model of a specific dog
breed, the Beagle. Beagles are often used for experimental purposes and in veterinary education and are well
suited for a generalized model. To permit a broad use of the model, we identified three key-features: three-
dimensionality, scalability, and modularity. Three-dimensionality is needed to represent a variety of movements
such as periodic and non-periodic locomotion, agility, or ideomotion (e.g. scratching). Scalability is important
to include because the body and limb lengths vary even within a dog breed. Scalability also allows the model to
be useful in assessing different breeds. Modularity helps to adapt the model to the requirements/limitations of
the experimental setup (e.g. single leg or multi-leg analysis).
A second and specific goal of the present work is the identification of muscle synergies for a defined limb
motion based on model simulations. This avoids invasive muscle activation recording and enables the inclu-
sion of small and deep muscles. Muscles’ synergies are also important for the design and modelling of neuronal
circuitry23,24. For determining muscle synergies, we used inverse dynamics and static optimization to estimate
muscle activations based on experimental data of a walking Beagle. We present joint torques, muscle activations,
and synergistic muscle groups of the forelimb. Torque profiles and muscle activation are then compared with
published results.
Results
Dog model. The complete model has a maximum of 84 DOFs. Head, thorax, abdomen, and tail have three
rotational DOFs each. Vertebral motions were not modelled. We included 134 (67 per side) muscles (with their
corresponding muscle parameters) encompassing the majority of fore- and hindlimb muscles and the epaxial
muscles relevant for locomotion. Head, belly, and toe muscles were not included. The complete set of muscles
can be found in (Suppl. 5 STab. 2).
Left forelimb. To evaluate the model, the left forelimb was chosen as the test case. For simplicity, most of
the muscles were modelled as single lines. However, the muscles that wrap over the joint have more segments
to match joint constraints. The geometric constraints are necessary to avoid bone penetration. As expected, the
number of degrees of freedom per joint influenced the results. For the forelimbs, 15 DOFs were necessary for
static optimization convergence: scapula (5 DOFs), shoulder (3 DOFs), elbow (2 DOFs), carpal joint (2 DOFs),
paw (3 DOFs) (details see Table 1). For example, without scapular anterior-posterior translation, M. rhomboi-
deus and M. latissimus dorsi activation peaked during the early stance phase. Such an activation profile has not
been reported in the literature. However, when the translational DOFs in the scapular joint were allowed, the
M. rhomboideus was activated continuously, and the M. latissimus dorsi was active at the end of the swing phase,
matching experimental observations25–27. The increment of the DOFs to 16 (including mediolateral translation
Scientific Reports | (2021) 11:11335 | https://doi.org/10.1038/s41598-021-90058-0 2
Vol:.(1234567890)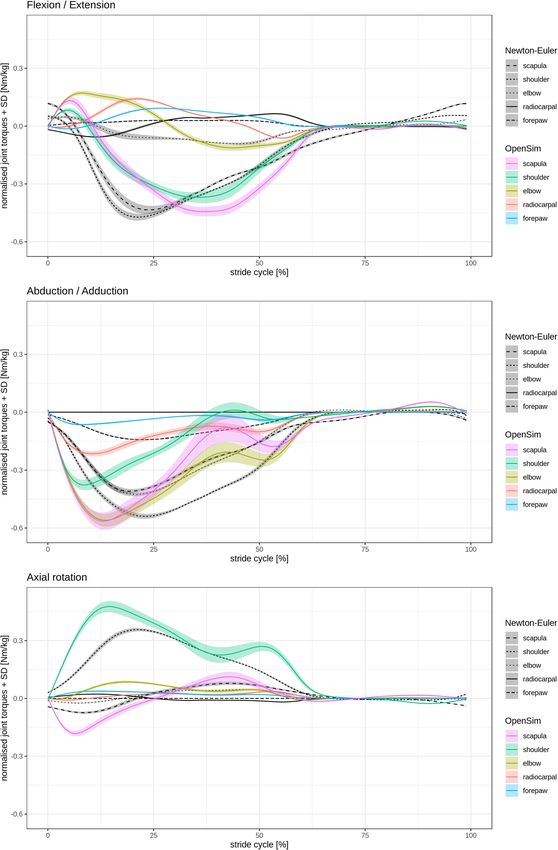
www.nature.com/scientificreports/
Figure 2. Forelimb calculated torques for the flexion/extension, abduction/adduction, and axial rotation in
a walking Beagle based on consecutive strides of the same trial. Comparison between results obtained from
OpenSim versus Newton–Euler method. The standard deviation (SD) is shown as shaded bands. Flexion/
extension torques: positive values indicate net retractor torques and negative values indicate net protractor
torques. A retractor torque flexes the shoulder joint, extends the elbow joint, and flexes the carpal joint.
Abduction/adduction torques: negative values indicate abductor torque and positive values indicate adductor
torque. Axial rotation torques: negative values indicate external rotation torques and positive values indicate
internal rotation torques. The figures were created with the software package R 70.
Scientific Reports | (2021) 11:11335 | https://doi.org/10.1038/s41598-021-90058-0 3
Vol.:(0123456789)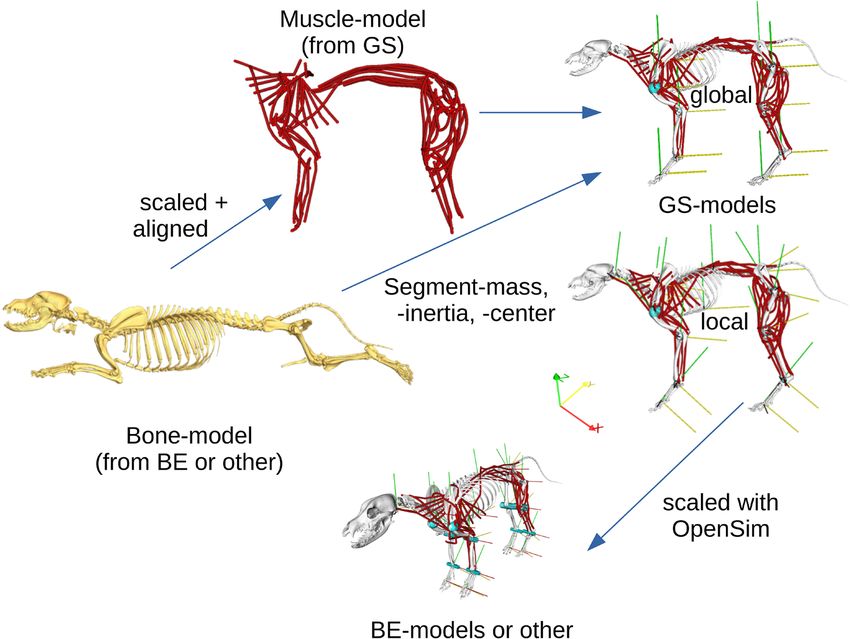
www.nature.com/scientificreports/
Global Scapula Shoulder Elbow Carpal joint Forepaw
Mx (Nm) – 5 0.0005 1 5 0.005
My (Nm) – 5 5 5 – 0.005
Mz (Nm) – 5 5 – 1 0.0005
Fx (N) 0.5 – – – – –
Fy (N) 0.5 0.00005 – – – –
Fz (N) 0.5 0.5 – – – –
DOFs 3 5 3 2 2 3
Table 1. The maximum force and torque actuator values of the joints of the left forelimb calculated with a
parameter map. As well as the degrees of freedom in the joints.
Figure 3. Simulated forelimb muscle activation in a walking Beagle during one gait cycle, shown as a heatmap
of logarithmic values (log2). The plot shows how individual muscles were activated based on consecutive strides
of the same trial. The muscle groups (colours) were arranged according to hierarchical clustering (method—
ward.d2) and minimal leaf sorting. The figures were created with the software packages O penSim28,29 and R
70.
of the scapula) worsened simulation results (e.g. the activations of the muscles M. trapezius and M. rhomboidues
pars thoracica were silent).
Torques. The comparison between torque results computed by OpenSim28,29 and those computed using the
Newton–Euler method (see supplement for method details Suppl. 4) show more agreement in the flexion/exten-
sion (Fig. 2). The abduction/adduction displays higher discrepancies (Fig. 2). In the axial rotation, differences
can be observed for the scapula and the humerus (Fig. 2). Still, the torque amplitudes and patterns computed
using OpenSim28,29 are similar to those computed using the Newton–Euler method and to other published
results12,30 (Fig. 2). The scapula and the humerus displayed the largest torque amplitudes in flexion/extension.
Their torque displayed similar amplitudes, and pattern changes from positive to negative. In abduction/adduc-
tion, besides the carpal joint and the forepaw, all torque patterns and amplitudes were similar. In axial rotation,
the shoulder joint displays larger torque amplitudes.
Muscle activation. The muscle activations calculated through static optimization were similar to those
collected in experiments25,27 (Suppl. 6 SFig. 10, 11, 12 and 13). The muscles that exhibited the largest activations
were M. supraspinatus and M. infraspinatus (Fig. 3; Suppl. 6 SFig. 7#1). Both muscles were activated during the
whole stance phase. All other muscles were only activated during either the early or late stance phase. The M.
Scientific Reports | (2021) 11:11335 | https://doi.org/10.1038/s41598-021-90058-0 4
Vol:.(1234567890)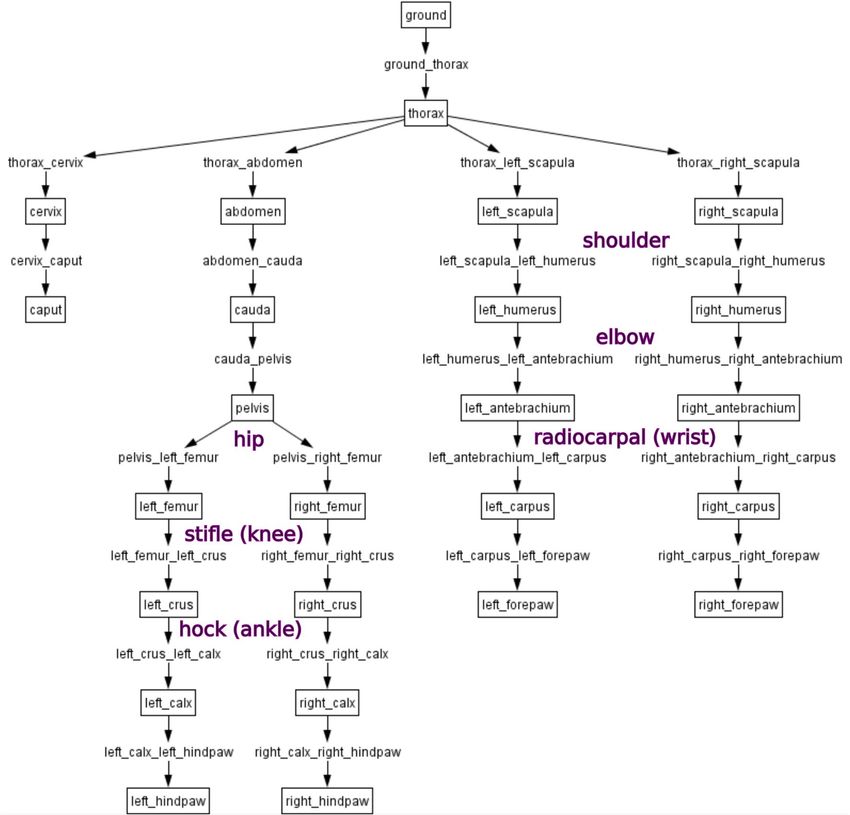
www.nature.com/scientificreports/
Figure 4. Hierarchical clustering (method—ward.d2) and minimal leaf sorting of simulated forelimb
logarithmic muscle activation (log2) in the walking Beagle. The dendrogram shows how individual muscles
were activated based on consecutive strides of the same trial. Groups represent a distance between activation
patterns. The distance is displayed in the dendrogram as branch length. The longest lengths from the root were
70.
used as criteria to separate groups. The figure was created with the software package R
serratus demonstrated a cranial-to-caudal travelling activation wave around touch down and toe-off. Note that
the cranial parts retract the leg, and the caudal parts protract the leg.
The hierarchical cluster-analysis separated muscles into three main synergistic groups (Fig. 4—black lines;
Suppl. 6 SFig. 8 and 9). Every main synergistic group has two subgroups (see different colours in Fig. 4). The
purple subgroup of group #1 includes all of the different parts of M. serratus. The blue subgroup of group #1
includes M. infraspinatus, M. supraspinatus, M. pronator teres, M. anconeus, and M. rhomboideus pars cervicalis.
The cyan subgroup of group #2 encompasses a large number of joint extensor and joint stabilizing muscles
and includes two minor groups. The first minor group includes M. triceps brachii accessorium, M. coracobrachialis,
both parts of M. pectoralis, M. extensor carpi radialis, and M. teres major. The second minor group of muscles
within the cyan subgroup include: M. extensor carpi ulnaris, M. supinator, M. triceps brachii caput mediale, and
M. triceps brachii caput laterale.
The green subgroup #2 includes M. flexor carpi ulnaris, M. deltoideus pars acromialis, M. triceps brachii caput
longum, M. deltoideus pars scapularis, M. brachialis, M. subscapularis, M. abductor pollicis longum, and M. teres
minor.
The brown subgroup of group #3 includes M. latissimus dorsi, M. trapezius pars cervicalis, M. trapezius pars
thoracica, M. rhomboideus pars thoracica. The magenta subgroup of group #3 contains M. flexor carpi radialis,
M. biceps brachii, and both parts of the M. brachiocephalicus.
Discussion
Dogs have more than 400 globally recognized b reeds1. Thus, they enable an interesting analysis of how body
size, physique, and agility, as well as diseases, influence joint control in quadrupedal locomotion. The aim of
this work was to develop a detailed, fully three-dimensional, and scalable musculoskeletal model of a dog to
analyze these effects.
We designed a flexible framework that can be used to generate different dog models ranging from individual
leg components up to an entire musculoskeletal model. Additionally, this framework can be used to generate
models for different breeds. To our knowledge, our model is the first fully three-dimensional model of a dog, and
contains 134 (67 per side) muscles including the majority of fore- and hindlimb muscles and epaxial muscles
relevant for locomotion.
To evaluate the model, we calculated torques and muscle activation patterns for the left forelimb using inverse
dynamics. We compared the results of the inverse dynamic tool in O penSim28,29 to the inverse dynamic com-
putations based on the same data using the Newton–Euler method and published data. The right forelimb is a
Scientific Reports | (2021) 11:11335 | https://doi.org/10.1038/s41598-021-90058-0 5
Vol.:(0123456789)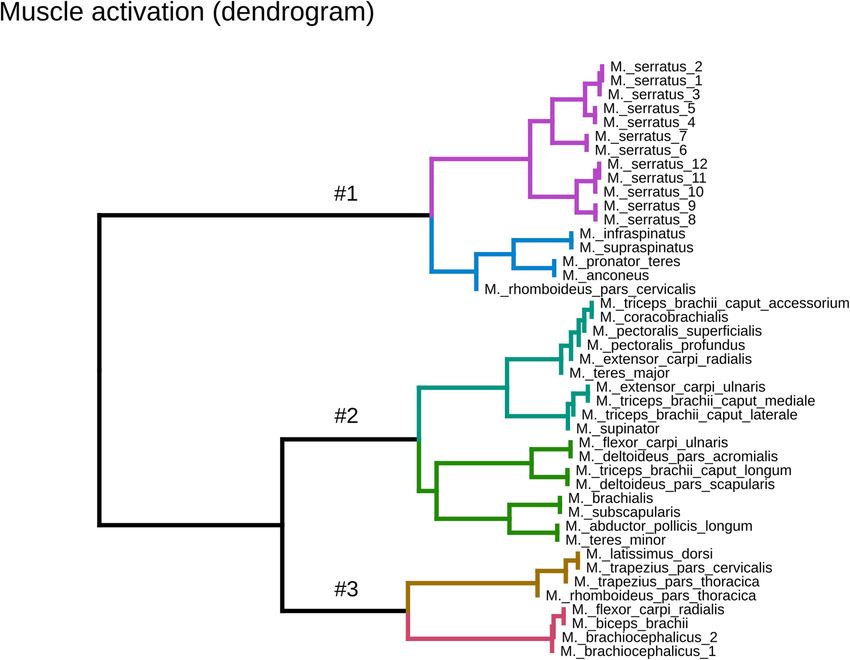
www.nature.com/scientificreports/
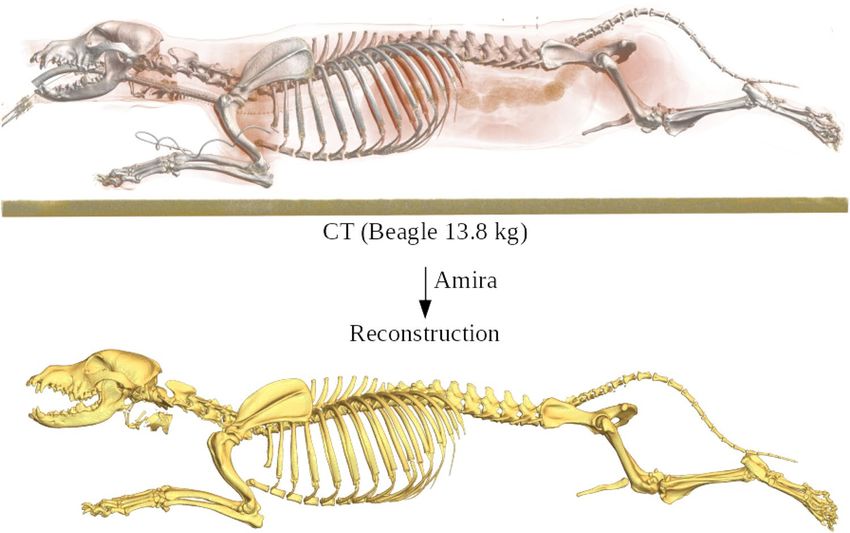
Figure 5. High-resolution computed tomography (CT) data set of an anaesthetized Beagle (upper image—
lateral view) and the reconstruction of the separated bones (lower image—lateral view) using the software
package Amira57.
mirrored copy of the left one, thus we are confident that results gathered from the left leg will also be applicable
to the right leg. The hind limbs have all necessary elements (segments, joints, joint actuators, muscles, and their
corresponding muscle parameters) to perform simulations, however, they still need to be validated.
Only a few available studies on 2D-inverse dynamic analysis of the canine forelimb exist (i.e. excluding
shoulder joint and scapular f ulcrum4,5,12) and only one three-dimensional analysis of the whole f orelimb30. Note
that only Nielsen et al.12 and Andrada et al.30 reported on healthy dogs, and therefore the results of Burton, et al.4
and Burton et al.5 will not be discussed here.
As a standard configuration, OpenSim28,29 presents joint-torques about joint axes. For comparison, we also
computed joint-torques in the joint’s coordinate system. Local coordinates provide an effective method for
checking the functionality and validity of the model, and can be easily transformed into anatomical ones. The
torque amplitudes and patterns about the mediolateral axis computed with O penSim28,29 were similar to those
12,30
computed using the Newton-Euler method and to published results (Fig. 2). Differences in torque ampli-
tudes were observed for the abduction/adduction and axial rotation. Discrepancies between O penSim28,29 and
Newton-Euler methods are to be expected because of the error accumulation in the recursive Newton-Euler
method and differences in filtering. In addition, the position of the joints have more variability in marker data
and length constraint is not guaranteed in our Newton-Euler computation. Moreover, we can not be sure how
OpenSim28,29 models the Cardan-sequence of the relative joint angles. Even small differences in leg orientation
related to the ground reaction force (GRF) vector might also help to explain the discrepancies observed, especially
in the abduction/adduction. In general, multi body systems have less computational e rror31.
OpenSim28,29 uses a two-step process to estimate muscle activation: First, inverse dynamics are used to com-
pute joint forces and then static optimization is used to compute muscle forces. O penSim28,29 also offers a more
advanced method named computed muscle control (CMC). This method combines inverse static optimization
with forward dynamics. The aim of this work was not to accurately predict detailed muscle activations and draw
conclusions on exact timing and magnitude, but to roughly validate the model and determine if muscle loca-
tions and parameters were in the correct range. Therefore, we used the inverse dynamics plus static optimization
method as it provides faster results with fewer parameters.
For the simulations, we chose the Hill-type muscle model by Millard et al.32. We took muscle parameters
from the works by Shahar and Milgram33,34 and Williams et al.35,36 and linearly scaled them to the body mass of
a Beagle. Additionally, we estimated the tendon length (see methods). As a general rule, muscle contractions
in OpenSim28,29 are not effective in stabilizing joints while also reproducing limb kinematics during walking.
Therefore, we included additional actuators in all joints to assist the muscles. A parameter search found the
minimal actuator force/torque values that permitted the static optimization to converge.
To help validate musculoskeletal models, the prediction of muscle activation is often compared to EMG data
collected from the same individuals. We did not collect EMG data from the dog modeled in these simulations,
and this is a limitation of this study. Instead, we used EMG available in the literature as means of comparison
to our model. The reader should be aware that muscle data does not exist for all muscles, furthermore, for
Scientific Reports | (2021) 11:11335 | https://doi.org/10.1038/s41598-021-90058-0 6
Vol:.(1234567890)www.nature.com/scientificreports/
Figure 6. Topology of the segments (boxes) and joints (arrows) of the whole Beagle (BE) model using the
penSim28,29.
software package O
some muscles there is only one source. This is why we compare our simulation results sometimes with just one
literature source.
Model predictions of muscle activations, including the correct separation of the muscle groups with regard
to the stance and swing phase, showed good agreement with reported EMG data25–27 (Suppl. 6 SFigs. 10, 11,
12 and 13). Exceptions were M. triceps and M. trapezius (compared to T okuriki25), M. pectoralis (compared to
Tokuriki25 & Deban et al.27), and M. serratus ventralis cervicalis (compared to Deban et al.27). Muscle activation
is sensitive to the assigned muscle characteristics, joint actuator parameters, and the muscle redundancy solver
(static optimization). A sensitivity analysis could provide insight into what specific muscle/joint properties have
the most effect on muscle activation patterns. However, such an analysis is outside the scope of the present work.
Additionally, muscle activation patterns in the literature are sometimes inconsistent (M. pectoralis profundus ⇒
Tokuriki = Deban; M. latissimus dorsi ⇒ Deban = Tokuriki, Suppl. 6 SFig. 13D,E), making the comparison to
a ground truth difficult. The position of the electrodes (especially in large muscles), time-varying activation of
different muscle regions, and muscle cross-talk may explain these differences. This, however, cannot be tested,
as Tokuriki25 did not report the position of the electrodes. Our findings did show that the translational anterior-
posterior and vertical DOFs must be included in the scapular joint for a correct prediction of shoulder muscles.
For example, predictions of the activation patterns of the M. rhomboideus and M. latissimus dorsi are similar to
those reported in the literature only when the scapular joint has five or six DOFs. Anterior-posterior translation
in the scapular joint must be present as observed in kinematic studies (see F ujiwara37 for review). The fact that
the scapula is only linked to the body with muscles indicates that the scapular joint might hold an additional
role as a damper, reducing the propagation of impact forces to the body (e.g. after jumping) and minimizing the
necessity of gait compensation mechanisms.
We used a hierarchical cluster-analysis to further analyze the validity of our musculoskeletal model. This
analysis identifies synergistic groups by organizing muscles based on their activation patterns. This method is
Scientific Reports | (2021) 11:11335 | https://doi.org/10.1038/s41598-021-90058-0 7
Vol.:(0123456789)www.nature.com/scientificreports/
Figure 7. Representation of the model assembly, from the bone model (yellow bones) to the muscle model (red
paths) to the resulting simulation model, taking into account the transformations performed. The muscles (red)
can be generated as paths closer to the real curves or just straight. Rotation around the red axis (x) represents
protraction/retraction or flexion/extension, around the yellow axis (y) abduction/adduction, and around the
green axis (z) axial rotation. The sub-figures were created using the software packages A mira57 and O penSim28,29.
widely used in the literature to classify motor neuron activation, movement, or disease-related differences38–40.
We used this method, in addition to the information about synergies, to test how well our simulations match
literature data and to compare how well different data sources match each other.
The theory of muscle synergies41–43 hypothesizes that the central nervous system (CNS) produces different
motor behaviours by co-activating groups of muscles in space or t ime41,44. Two types of muscle synergies have
been identified44,45: (1) ‘synchronous synergies’, which activate a group of muscles at the same time; and (2) ‘time-
varying synergies’, which produce patterns with a temporal profile for each muscle of a synergistic group. Muscle
synergies is a theory for understanding how the CNS produces a wide range of motor behaviours and could be
an important tool to simplify the control problem in complex neuromechanical m odels24,46.
Synergy decomposition yielded three main muscle groups within our model. Each of these groups was further
divided into two subgroups, which are denoted by different colours in Fig. 4 (group #1: purple and blue, group
#2: cyan and green, group #3: brown and magenta). Branches within one colour indicate small differences in the
activation profiles. The purple subgroup of group #1 belongs to all the different parts of the M. serratus. Those
parts were activated sequentially from the most cranial to the most caudal parts. The cranial parts protract,
while the most caudal parts retract the scapula. The protraction of the scapula correlates with the braking GRFs
observed in most of the stance phase, while the retraction correlates with the acceleration phase in late stance.
The blue subgroup of group #1 includes M. infraspinatus, M. supraspinatus, M. pronator teres, M. anconeus,
and M. rhomboideus pars cervicalis. M. supraspinatus and M. infraspinatus extend the shoulder joint, M. anconeus
extends the elbow joint, while M. rhomboideus pars cervicalis mainly stabilizes the scapular joint. In our simu-
lations, they were recruited during stance and part of the swing phases. However, only M. rhomboideus pars
cervicalis was active throughout the entire stride. EMG data exists for M. supraspinatus, M. infraspinatus, and M.
rhomboideus pars cervicalis. Our simulation results display a good agreement with those experimental d ata25,27,47.
The cyan subgroup of group #2 encompasses a large number of muscles. Among this subgroup, two main
activation patterns were predicted. The first group encompasses the M. triceps brachii accessorium, M. coracobra-
chialis, both parts of M. pectoralis, M. extensor carpi radialis, and M. teres major. Those muscles showed minimal
activations during simulations, which differs from published EMG data. One explanation for these differences is
that more accurate muscle parameters and/or new goal functions for optimization are needed to better distribute
force among muscles. A further explanation could be, based on the fact that these muscles are difficult to measure,
that the published data displayed just a cross-talk to more superficial muscles. We speculate that these muscles
may be recruited for other tasks (e.g. perturbed locomotion).
The second group of muscles among the cyan subgroup (M. extensor carpi ulnaris, M. triceps brachii caput
mediale, M. triceps brachii caput laterale, and M. supinator) were recruited in the early stance phase. They work
Scientific Reports | (2021) 11:11335 | https://doi.org/10.1038/s41598-021-90058-0 8
Vol:.(1234567890)www.nature.com/scientificreports/
mainly against gravity and control the axial function of the leg. The axial function refers to the time-dependent
length and applied GRFs of the leg as measured from the main proximal pivot/fulcrum (scapular “joint”, that
can be better described as an instantaneous centre of rotation) to the foot48–50.
The green subgroup of group #2 is made up of the following muscles: M. flexor carpi ulnaris, M. deltoideus
pars acromialis, M. deltoideus pars scapularis, M. triceps brachii caput longum, M. brachialis, M. subscapularis,
M. abductor pollicis longus, and M. teres minor. In the literature, there exists EMG data only for M. brachialis.
Experimental data show that during walking, this elbow flexor is recruited from late stance until approximately
mid-swing47. In our model, the M. brachialis, while displaying similar whole activation time, started about 10%
of the stride time earlier than in the experiments. Interestingly, in our simulations, M. subscapularis had a simi-
lar activation pattern to those predicted for M. brachialis, M. abductor pollicis longus, and M. teres minor were
activated earlier in the stance phase. The former was activated around mid-stance, while the latter was activated
during the early stance phase. M. teres minor displayed a similar activation pattern to the EMG data published
for M. teres major47. This could indicate that M. teres minor took the place of the M. teres major in our simula-
tions. However, turning-off M. teres minor in simulations did not significantly improve the predictions of the
activations of M. teres major.
The third group encompasses muscles that were activated throughout the swing phase. Some of them were
also recruited during parts of the stance phase. The brown subgroup of group #3 includes M. latissimus dorsi, M.
trapezius pars cervicalis, M. trapezius pars thoracica, and M. rhomboideus pars thoracica. The predicted activation
of M. latissimus dorsi resembles experimental findings. It brakes the protraction of the forelimb during swing
before touchdown. On the other hand, M. trapezius and M. rhomboideus stabilize the scapular joint. In experi-
ments, M. trapezius pars cervicalis was active during the entire stride cycle, while M. trapezius pars thoracica was
active during the complete stance phase and at the late swing p hase47. Our simulations predicted M. trapezius
to be active earlier during stance and during the complete swing phases. EMG data shows that M. rhomboideus
pars thoracica is active during most of the stride cycle with the exception of a short period around mid-swing.
In our simulations, this silent period occurs around mid-stance.
The magenta subgroup of group #3 contains M. flexor carpi radialis, M. biceps brachii, and both parts of M.
brachiocephalicus. The first two muscles flex the paw and elbow joint, respectively, while the third protracts the
forelimb. In the literature, it was shown that these muscles have similar activation patterns. They are briefly active
after touchdown, then around take-off, and in the late swing phase. Our simulations display a similar pattern
to those found in experiments. Furthermore, they show that the largest activations occur around take-off in
preparation and start of the swing phase.
Conclusions
We have developed a musculoskeletal model of a dog that has three main features: three-dimensionality, scal-
ability, and modularity. Activation patterns predicted by static optimization exhibited good agreement with
experimental data for most of the forelimb muscles. However, because muscles were unable to stabilize joints
on their own, joint actuators have been included for stability. In animals, joints are stabilized by muscle co-
contraction and passive s tructures51–54. Thus, muscle geometry, muscle parameters, and the modelling of passive
structures are essential for an accurate estimation of muscle activation. To this end, more detailed breed-related
anatomical and physiological studies are necessary. Other optimization algorithms such as computed muscle
control (CMC) from OpenSim28,29 or predictive forward simulations might also improve the predictive power
of this dog model55. We expect that the use of our model will speed up the analysis of how body size, physique,
and agility (as well as diseases) influence joint control and loading in dog locomotion. We follow two different
paths for the expansion of this model: (a) we are modelling specific joints in more detail using the finite element
method to analyze joint loads based on the force data of the current model; (b) we intend to expand the model
to a neuromechanical model23,24, to understand how the neural, muscular and skeletal systems operate together
to produce efficient and stable locomotion. To this end, we also presented a method to estimate muscle synergies,
which can help to break-down the design complexity of neuronal networks.
Methods
ata30 and literature data33–36,47,56 were used. In particular, the motion
In the present study, only existing animal d
analysis performed by Andrada et al.30 was approved by the German Animal Welfare of the states of Thuringia
and Lower Saxony (Registration No. TLV Az. 22-2684-04-02-012/14, LAVES 33.9-42502-04-14/1518), and car-
ried out in strict accordance with their guidelines.
Computed tomography data. The Beagle model (BE-model) was built using computed tomography
(CT) data of an adult Beagle (13.8 kg; Andrada et al.30). The resulting CT data set consisted of 3370 (spacing 0.33
mm) sections with a resolution of 512 × 512 pixels (spacing 0.279 × 0.279 mm2). All skeletal bones and muscle
attachment points were reconstructed from the CT data (Fig. 5).
For reconstruction, we use the segmentation software Amira57 and the analysis software imageXd58 for auto-
matic mesh generation. In addition, the segment m asses30,56 and their moments of inertia were determined from
the CT data (see Suppl. 2 and 3).
Muscle data. To initialize the placement of muscles on the skeletal model, we used an existing detailed ana-
tomical model of the working line of the German Shepherd dog (GS-model) by J. Laustrëer, A. Andikfar & M.S.
Fischer47 and transformed it to the Beagle using the Beagle’s skeletal model and insertion points. The GS model
is based on cross-sections of the limbs and body as well as macroscopic dissections. The GS-model was created
originally for illustration and animation in Autodesk M aya59, and cannot be directly used in simulation tasks.
Scientific Reports | (2021) 11:11335 | https://doi.org/10.1038/s41598-021-90058-0 9
Vol.:(0123456789)www.nature.com/scientificreports/
In that model, muscle paths were modelled as nurbs (non-uniform rational basis splines), which were spatially
aligned transversely to the fibre course. The reconstruction of the muscle centrelines from the nurbs was per-
formed in ‘Cloud2’ software58 (Suppl. 5 and 6 SFig. 1).
The muscle parameters were taken from Shahar and M ilgram33,34 and Williams et al.35,36. Shahar & Milgram
published morphometric data of one hindlimb and four forelimbs of mixed-breed dogs. The morphometric
variables included the muscle mass (m), muscle length (ml), muscle fibre length (fl), angle of pennation ( α), and
the resulting physiological cross-sectional area (PCSA). In addition, Williams et al.35,36 published morphometric
data of seven forelimbs and six hindlimbs of racing Greyhounds. Here the morphometric variables included
muscle mass (m), muscle length (ml), fascicle length (fl), as well as PCSA, maximum force, and power. The
tendon length (tl), which is important for the model (Suppl. 6 SFig. 2), was not available and thus approximated
using the following formula:
tl = ml − fl ∗ cos(α)
Adaptation or scaling of muscle parameters from other breeds or species is always a compromise. For the GS-
model we used the muscle parameters from Shahar and M ilgram33,34 and Williams et al.35,36. To scale those
parameters for the BE-model, we tested whether mass and total leg muscle PCSA scales with body mass for
the published data. We found logarithmic relationships between both mass and total PCSA for a limb and
body weight. Those relationships were used to scale every muscle PCSA to our BE-model (Suppl. 6 SFig. 3 and
4). Parameters that scale with length (e.g. muscle fibre, tendon slack length) are automatically scaled with the
geometric change in OpenSim28,29.
Model assembly. To permit higher flexibility and broader use of the model, we generated the model in a
way that it can be compiled in different scripting languages. The basic script was written in M aster58, compiled
as SIMM language60, and then converted via the simmToOpenSim tool28,29 into the OpenSim language28,29. In
addition, the scripts were created in such a way that we can flexibly create models with different specifications.
Depending on the necessity, we can create the whole dog model or parts of it such as fore- or hindlimbs.
In the scripts, the segments are arranged hierarchically to build a kinematic chain as displayed in Fig. 6.
The most proximal segment is joined to the ground (the thorax in the case of the whole). The scripts include
additional data for the relative position and orientation of the segments (bones), the segment masses, the centre
of mass, and the inertia (bones-model). The individual sub-models (fore- or hindlimbs) contain the mass of all
segments (skeleton is complete) but only the muscles of their corresponding segments.
The bones-model (Fig. 7) is scaled and oriented to fit the muscle model (based on the GS-model). This task
was performed in B lender61. We scaled the bones model to fit the muscle model because this is easier to do than
scaling muscles to fit the bones. In dogs the segment length as a percentage of leg length is approximately the
same among different dog breeds including chondrodystrophic dwarf b reeds47,62,63. Thus, just one size factor is
necessary to scale a leg (in our case forelimbs and hindlimbs were multiplied by 1.66). For the spine, neck, and
head we obtained a scaling factor of 1.25 (note that the scaling factor among breeds is not available in the lit-
erature). After scaling Beagle bones to fit the GS-model, muscle origins and insertions of the muscle model (see
Fig. 7) were easily corrected to match those of the Beagle bones’ model (Suppl. 6 SFig. 5 displays the anatomical
differences between the scaled Beagle skeleton and that of the German Shepherd). In the basic Master script,
scaled BE-model and muscle-line models were combined. The position of the joints, position relative to the joint
centre, and joint types were derived from the CT-based BE-model. Additionally, geometrical constraints have
been added to the joints to prevent bone penetration by the muscles. Cylinders were used to constrain hinge joints
while spheres were used to constrain ball-and-socket joints (Suppl. 6 SFig. 6). Our script permits us to generate
curved or straight muscle paths that replicate realistic lines of action. Muscle insertion points are assigned to
their corresponding segments. Model segments (bones and muscle insertion points) are then compiled in SIMM
in either global or local coordinates. We used here a local coordinate system for every segment.
Experimental data, kinematics, GRF, and joint torques. 3D-kinematic (from motion capture/pas-
sive markers) and kinetic data from a previous dog study30 were used to develop the inverse simulation solu-
tions. Experimental methods to collect kinematic and kinetic data can be found in that paper. Motion capture
data belongs to the same individual from which we took the CT scan. Eight walking strides (joint angles and
GRFs from left forelimb) were used as the basis for the analysis. We first computed 3D-Kinematic (XYZ Cardan-
sequence) motion from marker data relative to the lab-frame. We then transformed these segment kinematics
to joint kinematics by using quaternions because OpenSim28,29 necessitates 3D-relative joint coordinates. For
this, we first transformed 3D-segmental Cardan angles to quaternions (for formulas see Henderson64). Then, we
computed the quaternions between adjacent segments by conjugating the quaternion of the lower segment to a
joint (i) and multiplying the result by the quaternion of the upper segment to the same joint (i). Afterward, we
transformed the results to relative Cardan angles XYZ.
For comparison, joint torques were also computed using the 3D-Newton–Euler method7,65, as already pre-
sented in Andrada et al.30. Here, results are presented in the joint’s coordinate systems to allow comparison with
OpenSim28,29 (see supplementary document for more information, Suppl. 4).
Joint actuators. Non-biological actuators were placed in all joints to ensure that the static optimization
converges. This is important for two reasons. First, joint actuators ‘absorb’ numerical and mass errors. The sec-
ond was to prevent muscles from exceeding their maximal force. By scanning the parameter space, the optimal
joint actuator configuration was determined. As the torque output of the actuators should be as small as possible,
Scientific Reports | (2021) 11:11335 | https://doi.org/10.1038/s41598-021-90058-0 10
Vol:.(1234567890)www.nature.com/scientificreports/
we started our scanning at a value 1E−9 (N or Nm). These values were exponentially incremented 1E+1 until a
solution was found. After that, actuator values were logarithmically decreased, until the following two condi-
tions were met: (a) the simulation converged to solutions, and (b) all muscles spanning the joints stayed below
their maximum forces. Actuator values can be found in Table 1.
Simulation. To evaluate the model, we estimated inverse dynamics and muscle activation patterns for
the forelimbs. Forelimbs are challenging to model due to the high mobility of the scapular joint. Whereas the
hindlimbs are linked to the pelvis via a locally static ball-and-socket joint, the scapula is not anchored to the
body as a defined joint but via a complex arrangement of extrinsic appendicular muscles. Rather than rotating
about a fixed point, scapular motion incorporates both translation and rotation around an instantaneous centre
of rotation.
We used OpenSim’s ‘inverse dynamics’ t ool28,29 to compute the torques in the joints from the kinematic and
GRF data. With the ‘static optimization’ tool, we estimated muscle activation patterns and forces. We minimized
the sum of muscle activation squared (default configuration) and used the standard cut-off filter configuration
(6 Hz) for the kinematic and GRF data. We then compared the torque and muscle activation results with data
from the literature. Our goal was to reproduce muscular activation patterns of dog walking with the minimal
possible DOFs ‘on’ in every forelimb joint. We started with a sagittal model (every joint represented as a hinge-
joint). We analyzed the simulated muscle activations and compared them to the results in the literature. We then
increased one DOF in one joint on one plane from the most distal to the most proximal one and mapped again
the optimal set of muscle actuators. This procedure was repeated in every joint until the addition of a joint-DOF
did not improve simulation results.
Hierarchical cluster‑analysis. In order to evaluate synergistic muscle groups, the predicted muscle activa-
tions were further analyzed using the hierarchical cluster analysis66–68. This method is typically used to find and
group similar patterns within a data set69. We first determined the Euclidean distance between the time-series
datasets of logarithmic (log2) muscle activations. The Euclidean distance matrix over time was then used by the
Ward2 algorithm to analyze dissimilarity in the data and group them. Afterward, a tree was generated based on
the minimum distance. The distance was displayed in the dendrogram as length. We used the longest lengths
from the root as criteria to sort muscles into groups. Three groups of data had the same length. Subgroups within
each group were formed based on their longest length. To perform this analysis we used the software package R 70
(packages: dendextend, ggdendro and dendsort).
Data availability. The data that support the findings of this study are available from the authors on reason-
able request. The OpenSim model can be downloaded https://simtk.org/projects/dogmodel.
Received: 18 July 2020; Accepted: 27 April 2021
References
1. Ostrander, E. A. et al. Dog10K: an international sequencing effort to advance studies of canine domestication, phenotypes and
health. Natl. Sci. Rev. 6, 810–824. https://doi.org/10.1093/nsr/nwz049 (2019).
2. Brebner, N. S., Moens, N. M. M. & Runciman, J. R. Evaluation of a treadmill with integrated force plates for kinetic gait analysis
of sound and lame dogs at a trot. Vet. Comp. Orthop. Traumatol. 19, 205–212. https://doi.org/10.1055/s-0038-1633002 (2006).
3. Bockstahler, B. A., Skalicky, M., Peham, C., Müller, M. & Lorinson, D. Reliability of ground reaction forces measured on a treadmill
system in healthy dogs. Vet. J. 173, 373–378. https://doi.org/10.1016/j.tvjl.2005.10.004 (2007).
4. Burton, N. J., Dobney, J. A., Owen, M. R. & Colborne, G. R. Joint angle, moment and power compensations in dogs with fragmented
medial coronoid process. Vet. Comp. Orthop. Traumatol. 21, 110–118. https://doi.org/10.3415/VCOT-07-04-0038 (2008).
5. Burton, N. J., Owen, M. R., Kirk, L. S., Toscano, M. J. & Colborne, G. R. Conservative versus arthroscopic management for medial
coronoid process disease in dogs: a prospective gait evaluation. Vet. Surg. 40, 972–980. https://doi.org/10.1111/j.1532-950X.2011.
00900.x (2011).
6. Bresler, B. & Frankel, J. P. The forces and moments in the leg during level walking. Trans. ASME 72, 25–35 (1950).
7. Eng, J. J. & Winter, D. A. Kinetic analysis of the lower limbs during walking: What information can be gained from a three-
dimensional model?. J. Biomech. 28, 753–758. https://doi.org/10.1016/0021-9290(94)00124-M (1995).
8. Witte, H. et al. Torque patterns of the limbs of small therian mammals during locomotion on flat ground. J. Exp. Biol. 205,
1339–1353 (2002).
9. Andrada, E. et al. From biomechanics of rats’ inclined locomotion to a climbing robot. Int. J. Design Nat. Ecodyn. 8, 191–212.
https://doi.org/10.2495/DNE-V8-N3-191-212 (2013).
10. Shahar, R., Banks-Sills, L. & Eliasy, R. Stress and strain distribution in the intact canine femur: finite element analysis. Med. Eng.
Phys. 25, 387–395. https://doi.org/10.1016/S1350-4533(03)00002-X (2003).
11. Shahar, R. & Banks-Sills, L. Biomechanical analysis of the canine hind limb: calculation of forces during three-legged stance. Vet.
J. 163, 240–250. https://doi.org/10.1053/tvjl.2001.0660 (2002).
12. Nielsen, C., Stower, S. M., Schulz, K. S., Hubbard, M. & Hawkins, D. A. Two-dimensional link-segment model of the forelimb of
dogs at a walk. Am. J. Vet. Res. 64, 609–617. https://doi.org/10.2460/ajvr.2003.64.609 (2003).
13. Shahar, R. & Banks-Sills, L. A quasi-static three-dimensional, mathematical, three-body segment model of the canine knee. J.
Biomech. 37, 1849–1859. https://doi.org/10.1016/j.jbiomech.2004.02.034 (2004).
14. Nyakatura, J. A. & Andrada, E. A mechanical link model of two-toed sloths: no pendular mechanics during suspensory locomo-
tion. Acta Theriol. 58, 83–93. https://doi.org/10.1007/s13364-012-0099-4 (2013).
15. Headrick, J. F. et al. Use of an inverse dynamics method to describe the motion of the canine pelvic limb in three dimensions. Am.
J. Vet. Res. 75, 544–553. https://doi.org/10.2460/ajvr.75.6.544 (2014).
Scientific Reports | (2021) 11:11335 | https://doi.org/10.1038/s41598-021-90058-0 11
Vol.:(0123456789)www.nature.com/scientificreports/
16. Ellis, R. G., Rankin, J. W. & Hutchinson, J. R. Limb kinematics, kinetics and muscle dynamics during the sit-to-stand transition
in greyhounds. Front. Bioeng. Biotechnol. 6, 162. https://doi.org/10.3389/fbioe.2018.00162 (2018).
17. Helms, G., Behrens, B. A., Stolorz, M., Wefstaedt, P. & Nolte, I. Multi-body simulation of a canine hind limb: model development,
experimental validation and calculation of ground reaction forces. Biomed. Eng. Online 8, 1–9. https://d oi.o
rg/1 0.1 186/1 475-9 25X-
8-36 (2009).
18. Brown, N. P. et al. Development of a canine rigid body musculoskeletal computer model to evaluate gait. Front. Bioeng. Biotechnol.
8, 150. https://doi.org/10.3389/fbioe.2020.00150 (2020).
19. Mehta, S., Tyler, A. & Hast, M. Understanding the basics of computational models in orthopaedics: a nonnumeric review for
surgeons. J. Am. Acad. Orthop. Surg. 25, 684–692. https://doi.org/10.5435/JAAOS-D-16-00320 (2017).
20. Blickhan, R. The spring-mass model for running and hopping. J. Biomech. 22, 1217–1227. https://doi.org/10.1016/0021-9290(89)
90224-8 (1989).
21. Full, R. J. & Koditschek, D. E. Templates and anchors: neuromechanical hypotheses of legged locomotion on land. J. Exp. Biol. 202,
3325–3332 (1999).
22. Crowninshield, R. D. & Brand, R. A. The prediction of forces in joint structures; distribution of intersegmental resultants. Exerc.
Sport Sci. Rev. 9, 159–81. https://doi.org/10.1016/S0969-4765(04)00066-9 (1981).
23. Hunt, A. J., Szczecinski, N. S., Andrada, E., Fischer, M. & Quinn, R. D. Using animal data and neural dynamics to reverse engineer
a neuromechanical rat model. In Biomimetic and Biohybrid Systems (eds Wilson, S. P. et al.) 211–222 (Springer, Cham, 2015).
https://doi.org/10.1007/978-3-319-22979-9_21.
24. Deng, K. et al. Neuromechanical model of rat hindlimb walking with two-layer CPGs. Biomimetics 4, 21. https://doi.org/10.3390/
biomimetics4010021 (2019).
25. Tokuriki, M. Electromyographic and joint-mechanical studies in quadrupedal locomotion. I. Walk. Nippon juigaku zasshi. Jpn. J.
Vet. Sci. 35, 433–436. https://doi.org/10.1292/jvms1939.35.433 (1973).
26. Goslow, G. E., Seeherman, H. J., Taylor, C. R., McCutchin, M. N. & Heglund, N. C. Electrical activity and relative length changes
of dog limb muscles as a function of speed and gait. J. Exp. Biol. 94, 15–42 (1981).
27. Deban, S. M., Schilling, N. & Carrier, D. R. Activity of extrinsic limb muscles in dogs at walk, trot and gallop. J. Exp. Biol. 215,
287–300. https://doi.org/10.1242/jeb.063230 (2012).
28. OpenSim Core Team. Opensim is a freely available software system that allows you to build, exchange, and analyse musculoskeletal
models and dynamic simulations of movement (V3.3). http://opensim.stanford.edu/.
29. Delp, S. L. et al. OpenSim: open-source software to create and analyze dynamic simulations of movement. IEEE Trans. Biomed.
Eng. 54, 1940–1950. https://doi.org/10.1109/TBME.2007.901024 (2007).
30. Andrada, E., Reinhardt, L., Lucas, K. & Fischer, M. S. Three-dimensional inverse dynamics of the forelimb of beagles at a walk and
trot. Am. J. Vet. Res. 78, 804–817. https://doi.org/10.2460/ajvr.78.7.804 (2017).
31. Wittenburg, J. Dynamics of Multibody Systems (Springer, Berlin, 2008).
32. Millard, M., Uchida, T., Seth, A. & Delp, S. L. Flexing computational muscle: modeling and simulation of musculotendon dynam-
ics. J. Biomech. Eng. 135, 021005. https://doi.org/10.1115/1.4023390 (2013).
33. Shahar, R. & Milgram, J. Morphometric and anatomic study of the hind limb of a dog. Am. J. Vet. Res. 62, 928–33. https://doi.org/
10.2460/ajvr.2001.62.928 (2001).
34. Shahar, R. & Milgram, J. Morphometric and anatomic study of the forelimb of the dog. J. Morphol. 263, 107–117. https://doi.org/
10.1002/jmor.10295 (2005).
35. Williams, S. B. et al. Functional anatomy and muscle moment arms of the pelvic limb of an elite sprinting athlete: the racing
greyhound (Canis familiaris). J. Anat. 213, 361–372. https://doi.org/10.1111/j.1469-7580.2008.00961.x (2008).
36. Williams, S. B., Wilson, A. M., Daynes, J., Peckham, K. & Payne, R. C. Functional anatomy and muscle moment arms of the tho-
racic limb of an elite sprinting athlete: the racing greyhound (Canis familiaris). J. Anat. 213, 373–82. https://doi.org/10.1111/j.
1469-7580.2008.00962.x (2008).
37. Fujiwara, S. I. Fitting unanchored puzzle pieces in the skeleton: appropriate 3D scapular positions for the quadrupedal support in
tetrapods. J. Anat. 232, 857–869. https://doi.org/10.1111/joa.12778 (2018).
38. Pennartz, C. M., De Jeu, M. T., Geurtsen, A. M., Sluiter, A. A. & Hermes, M. L. Electrophysiological and morphological heterogene-
ity of neurons in slices of rat suprachiasmatic nucleus. J. Physiol. 506, 775–793. https://doi.org/10.1111/j.1469-7793.1998.775bv.x
(1998).
39. Mentel, T., Krause, A., Pabst, M., El Manira, A. & Büschges, A. Activity of fin muscles and fin motoneurons during swimming
motor pattern in the lamprey. Eur. J. Neurosci. 23, 2012–2026. https://doi.org/10.1111/j.1460-9568.2006.04738.x (2006).
40. Ferrarin, M. et al. Gait pattern classification in children with Charcot-Marie-Tooth disease type 1A. Gait Posture 35, 131–137.
https://doi.org/10.1016/j.gaitpost.2011.08.023 (2012).
41. D’Avella, A., Saltiel, P. & Bizzi, E. Combinations of muscle synergies in the construction of a natural motor behavior. Nat. Neurosci.
6, 300–308. https://doi.org/10.1038/nn1010 (2003).
42. Ting, L. H. & McKay, J. L. Neuromechanics of muscle synergies for posture and movement. Curr. Opin. Neurobiol. 17, 622–628.
https://doi.org/10.1016/j.conb.2008.01.002 (2007).
43. Markin, S. N., Lemay, M. A., Prilutsky, B. I. & Rybak, I. A. Motoneuronal and muscle synergies involved in cat hindlimb control
during fictive and real locomotion: a comparison study. J. Neurophysiol. 107, 2057–2071. https://doi.org/10.1152/jn.00865.2011
(2012).
44. Hart, C. B. & Giszter, S. F. Distinguishing synchronous and time-varying synergies using point process interval statistics: motor
primitives in frog and rat. Front. Comput. Neurosci. 7, 1–14. https://doi.org/10.3389/fncom.2013.00052 (2013).
45. Tresch, M. C. & Jarc, A. The case for and against muscle synergies. Curr. Opin. Neurobiol. 19, 601–607. https://doi.org/10.1016/j.
conb.2009.09.002 (2009).
46. Markin, S. N. et al. A Neuromechanical Model of Spinal Control of Locomotion 21–65 (Springer, New York, 2016).
47. Fischer, M. S., & Lilje, K. E. Dogs in Motion (The Pet Book Publishing Company Ltd; 1. Edition, 2011).
48. Maus, H. M., Lipfert, S. W., Gross, M., Rummel, J. & Seyfarth, A. Upright human gait did not provide a major mechanical challenge
for our ancestors. Nat. Commun. 1, 1–6. https://doi.org/10.1038/ncomms1073 (2010).
49. Andrada, E., Rode, C., Sutedja, Y., Nyakatura, J. A. & Blickhan, R. Trunk orientation causes asymmetries in leg function in small
bird terrestrial locomotion. Proc. R. Soc. B Biol. Sci. 281, 1–9. https://doi.org/10.1098/rspb.2014.1405 (2014).
50. Nanua, P. & Waldron, K. J. Energy comparison between trot, bound, and gallop using a simple model. J. Biomech. Eng. 117, 466–473.
https://doi.org/10.1115/1.2794209 (1995).
51. Dhaher, Y. Y., Kwon, T.-H. & Barry, M. The effect of connective tissue material uncertainties on knee joint mechanics under isolated
loading conditions. J. Biomech. 43, 3118–3125. https://doi.org/10.1016/J.JBIOMECH.2010.08.005 (2010).
52. John, C. T., Anderson, F. C., Higginson, J. S. & Delp, S. L. Stabilisation of walking by intrinsic muscle properties revealed in a
three-dimensional muscle-driven simulation. Comput. Methods Biomech. Biomed. Engin. 16, 451–462. https://doi.org/10.1080/
10255842.2011.627560 (2013).
53. Flaxman, T. E., Speirs, A. D. & Benoit, D. L. Joint stabilisers or moment actuators: the role of knee joint muscles while weight-
bearing. J. Biomech. 45, 2570–2576. https://doi.org/10.1016/j.jbiomech.2012.07.026 (2012).
54. Knarr, B. A., Zeni, J. A. & Higginson, J. S. Comparison of electromyography and joint moment as indicators of co-contraction. J.
Electromyogr. Kinesiol. 22, 607–611. https://doi.org/10.1016/j.jelekin.2012.02.001 (2012).
Scientific Reports | (2021) 11:11335 | https://doi.org/10.1038/s41598-021-90058-0 12
Vol:.(1234567890)www.nature.com/scientificreports/
55. Geijtenbeek, T. SCONE: open source software for predictive simulation of biological motion. J. Open Source Softw. 4, 1421. https://
doi.org/10.21105/joss.01421 (2019).
56. Amit, T., Gomberg, B. R., Milgram, J. & Shahar, R. Segmental inertial properties in dogs determined by magnetic resonance imag-
ing. Vet. J. 182, 94–99. https://doi.org/10.1016/j.tvjl.2008.05.024 (2009).
57. Thermo Fisher Scientific. Amira: a commercial, high-level language and interactive environment for numerical computation,
visualization, and programming. (V5.4). https://www.fei.com/software/amira-3d-for-life-sciences/.
58. Stark, H. Toolbox includes: Cloud2, master, enzyme2 and imagexd. (V3.5.19). https://starkrats.de/.
59. Autodesk, INC. Maya. https://autodesk.com/maya.
60. Motion Analysis Corporation. Simm: software for interactive musculoskeletal modelling. https://w ww.m otion
analy sis.c om/s imm/.
61. Blender Online Community. Blender—a 3d modelling and rendering package (V2.79). https://www.blender.org.
62. Lumer, H. Evolutionary allometry in the skeleton of the domesticated dog. Am. Nat. 74, 439–467. https://doi.org/10.1086/280912
(1940).
63. Wayne, R. K. Limb morphology of domestic and wild canids: the influence of development on morphologic change. J. Morphol.
187, 301–319. https://doi.org/10.1002/jmor.1051870304 (1986).
64. Henderson, M.-D. Euler angles, quaternions, and transformation matrics for space shuttle analysis. Tech. Rep. NASA. (USA, 1977).
65. Winter, D. A. Biomechanics and motor control of human movement. John Wiley & Sons, 2009.
66. Hanawa, H. et al. Muscle synergies underlying sit-to-stand tasks in elderly people and their relationship with kinetic characteristics.
J. Electromyogr. Kinesiol. 37, 15–20. https://doi.org/10.1016/j.jelekin.2017.08.004 (2017).
67. Jarque-Bou, N. J., Vergara, M., Sancho-Bru, J. L., Roda-Sales, A. & Gracia-Ibáñez, V. Identification of forearm skin zones with
similar muscle activation patterns during activities of daily living. J. Neuroeng. Rehabil. 15, 91. https://doi.org/10.1186/s12984-
018-0437-0 (2018).
68. Phinyomark, A., Osis, S., Hettinga, B. A. & Ferber, R. Kinematic gait patterns in healthy runners: a hierarchical cluster analysis. J.
Biomech. 48, 3897–3904. https://doi.org/10.1016/j.jbiomech.2015.09.025 (2015).
69. Jain, A. K. Data clustering: 50 years beyond K-means. Pattern Recogn. Lett. 31, 651–666. https://doi.org/10.1016/j.patrec.2009.09.
011 (2010).
70. R Core Team. R: a language and environment for statistical computing (V3.5.3). https://www.R-project.org.
71. LibreOffice Core Team. Libreoffice is free and open source software. (V6.4). https://de.libreoffice.org.
Acknowledgements
We thank all the involved members of the Institute of Zoology and Evolutionary Research for their stimulat-
ing discussions and support. We especially thank Jonas Lauströer and Amir Andikfar for providing the muscle
geometry for the model. This research work was supported by the company ‘Biologische Heilmittel Heel GmbH’
and by grants from the US-German CRCNS program including DLR Grant 01GQ1605 and NSF Grant 1608111.
Author contributions
E.A. and M.F. designed the study. H.S. and E.A. composed the model. H.S. wrote the source code and performed
the simulations. H.S. and E.A. drafted the manuscript, figures and tables. H.S. and E.A. also composed the sup-
plement. All authors analysed the results. And all authors read and approved the final manuscript.
Funding
Open Access funding enabled and organized by Projekt DEAL.
Competing interests
The authors declare no competing interests.
Additional information
Supplementary Information The online version contains supplementary material available at https://doi.org/
10.1038/s41598-021-90058-0.
Correspondence and requests for materials should be addressed to H.S.
Reprints and permissions information is available at www.nature.com/reprints.
Publisher’s note Springer Nature remains neutral with regard to jurisdictional claims in published maps and
institutional affiliations.
Open Access This article is licensed under a Creative Commons Attribution 4.0 International
License, which permits use, sharing, adaptation, distribution and reproduction in any medium or
format, as long as you give appropriate credit to the original author(s) and the source, provide a link to the
Creative Commons licence, and indicate if changes were made. The images or other third party material in this
article are included in the article’s Creative Commons licence, unless indicated otherwise in a credit line to the
material. If material is not included in the article’s Creative Commons licence and your intended use is not
permitted by statutory regulation or exceeds the permitted use, you will need to obtain permission directly from
the copyright holder. To view a copy of this licence, visit http://creativecommons.org/licenses/by/4.0/.
© The Author(s) 2021
Scientific Reports | (2021) 11:11335 | https://doi.org/10.1038/s41598-021-90058-0 13
Vol.:(0123456789)You can also read


