High Blood Caffeine Levels in MCI Linked to Lack of Progression to Dementia
←
→
Page content transcription
If your browser does not render page correctly, please read the page content below
Journal of Alzheimer’s Disease 30 (2012) 559–572 559 DOI 10.3233/JAD-2012-111781 IOS Press High Blood Caffeine Levels in MCI Linked to Lack of Progression to Dementia Chuanhai Caoa,b,c,d,∗ , David A. Loewensteine,f , Xiaoyang Linc , Chi Zhangc , Li Wangc , Ranjan Duarae,f,g , Yougui Wuh , Alessandra Gianninid , Ge Baii , Jianfeng Caii , Maria Greige , Elizabeth Schofielde , Raj Ashokc , Brent Smallj , Huntington Potterc,k and Gary W. Arendashd,∗ a Department of Pharmaceutical Science, University of South Florida College of Pharmacy, Tampa, FL, USA b Department of Molecular Pharmacology and Physiology, University of South Florida College of Medicine, Tampa, FL, USA c USF Health Byrd Alzheimer’s Institute, Tampa, FL, USA d Department of Cell Biology, Microbiology and Molecular Biology, University of South Florida, Tampa, FL, USA e Wien Center for Alzheimer’s Disease and Memory Disorders, Mount Sinai Medical Center, Miami Beach, FL, USA f Department of Psychiatry and Behavioral Sciences, Miller School of Medicine, University of Miami, Miami, FL, USA g Department of Medicine and Neurology, Miller School of Medicine, University of Miami, Miami, FL, USA h Department of Epidemiology and Biostatistics, College of Public Health, University of South Florida, Tampa, FL, USA i Department of Chemistry, College of Arts and Science, University of South Florida, Tampa, FL, USA j School of Aging Studies, College of Behavioral and Community Sciences, University of South Florida, Tampa, FL, USA k Department of Molecular Medicine, University of South Florida College of Medicine, Tampa, FL, USA Accepted 21 February 2012 Abstract. Although both human epidemiologic and animal model studies have suggested that caffeine/coffee protects against Alzheimer’s disease, direct human evidence for this premise has been lacking. In the present case-control study, two separate cohorts consisting of 124 total individuals (65–88 years old) were cognitively assessed and a blood sample taken for caf- feine/biomarker analysis. Subjects were then monitored for cognitive status over the ensuing 2–4 year period to determine the extent to which initial plasma caffeine/biomarkers levels would be predictive of changes in cognitive status. Plasma caffeine levels at study onset were substantially lower (−51%) in mild cognitive impairment (MCI) subjects who later progressed to dementia (MCI→DEM) compared to levels in stable MCI subjects (MCI→MCI). Moreover, none of the MCI→DEM subjects had initial blood caffeine levels that were above a critical level of 1200 ng/ml, while half of stable MCI→MCI subjects had blood caffeine levels higher than that critical level. Thus, plasma caffeine levels greater than 1200 ng/ml (≈6 M) in MCI subjects were associated with no conversion to dementia during the ensuing 2–4 year follow-up period. Among the 11 cytokines measured in plasma, three of them (GCSF, IL-10, and IL-6) were decreased in MCI→DEM subjects, but not in stable MCI→MCI subjects ∗ Correspondence to: Chuanhai Cao, Ph.D., USF/Byrd Alzheimer’s Institute, 4001 E. Fletcher Avenue, Tampa, FL 33613, USA. Tel.: +1 813 396 0711; Fax: +1 813 971 6478; E-mail: ccao@health.usf.edu. Gary W. Arendash, Ph.D., Department of Cell Biology, Microbiology and Molecular Biol- ogy, University of South Florida, Tampa, FL 33620, USA. Tel.: +1 813 732 9040; Fax: +1 813 974 1614; Email: arendash@cas.usf.edu. ISSN 1387-2877/12/$27.50 © 2012 – IOS Press and the authors. All rights reserved
560 C. Cao et al. / Caffeine and Lack of AD Progression
with high plasma caffeine levels. Coffee would appear to be the major or perhaps only source of caffeine for such stable MCI
patients. This case-control study provides the first direct evidence that caffeine/coffee intake is associated with a reduced risk
of dementia or delayed onset, particularly for those who already have MCI.
Keywords: Alzheimer’s disease, caffeine, coffee, dementia, immune response, mild cognitive impairment, plasma cytokines
Supplementary data available online: http://www.j-alz.com/issues/30/vol30-3.html#supplementarydata02
INTRODUCTION diagnosis of AD compared with age-matched subjects
without AD. Though insightful, these epidemiologic
There is a critical need to identify prophylac- studies cannot provide direct evidence for a prophylac-
tics that reduce risk, or delay onset, of Alzheimer’s tic effect of caffeine/coffee against AD because they
disease (AD), particularly from the standpoint of are largely based on recall and cannot unequivocally
lifestyle choices. In this context, an increasing body isolate caffeine/coffee intake from other factors that
of scientific evidence supports the premise that caf- affect cognition over a lifetime (e.g., they are not con-
feine/coffee intake can reduce the risk of AD and/or trolled).
delay the disease’s onset [see Journal of Alzheimer’s Fortunately, the creation of AD transgenic mice
Disease, Special Issue, Volume 20, Supplement 1, has allowed highly controlled studies to be performed
2010]. That evidence began with epidemiologic human that can delve into AD pathogenesis and therapeutic
studies and has been further supported by highly development. These AD mouse models produce the
controlled studies in AD transgenic mice. As well, same abnormal human protein (amyloid-; A) that
these later mouse studies have provided clear insight is produced and aggregates in the brains of humans
into the disease-modifying mechanisms whereby caf- destined for AD [6, 7]. During this brain A patho-
feine/coffee appear to provide protection against AD. genesis, which many researchers believe to be critical
What has been lacking to solidify caffeine/coffee as in precipitating AD [8], AD transgenic mice become
perhaps the first dietary component to be prophylactic memory-impaired and are, thus, considered appropri-
against AD are controlled clinical studies. In that con- ate (though incomplete) models for the disease. We
text, the present case-control study provides the first have utilized “young adult” AD mice in demonstrat-
direct evidence that caffeine/coffee may indeed reduce ing that long-term administration of a physiologic level
risk and/or delay onset of dementia, notably in those of caffeine in drinking water protects them from other-
that already have the prelude to AD, mild cognitive wise inevitable memory impairment in older age [9], as
impairment (MCI). well as reverses already-present memory impairment
Epidemiologic studies have largely supported caf- in “aged” AD mice [10]. Caffeine likely induced these
feine/coffee as protective against cognitive impairment protective and treatment effects through its unique
and AD. Early prospective studies reported signifi- ability to suppress both enzymes required for A pro-
cantly less cognitive decline over a 4–10 year period duction (- and ␥-secretase), resulting in much lower
in aged men drinking 3 cups of coffee per day [1] brain A aggregation/deposition [9, 10]. Moreover,
and in aged women whose daily caffeine intake was there are other complementary mechanisms of caffeine
equivalent to 3+ cups of coffee [2]. Two recent epi- action that we have identified that could contribute to
demiologic studies evaluated mid-life coffee intake the cognitive benefits of caffeine against AD. Specif-
and risk of later AD, with one study reporting a ically, long-term caffeine treatment in AD transgenic
robust 65% decreased risk of AD in individuals who mice: 1) decreases brain levels of pro-inflammatory
drank 3–5 cups of coffee daily during their 40 s–50 s cytokines such as TNF-␣ and IFN-␥ [11], and 2)
[3], while the other study found no association [4]. induces beneficial effects on signal transduction fac-
Parenthetically, the former study involved a typical tors important for neuronal plasticity and survival [12].
in-clinic assessment of AD, whereas the later study Thus, our studies in AD mice indicate that caffeine
utilized a telephone interview questionnaire. Perhaps is likely to be a multi-mechanistic, disease-modifying
most compelling among the epidemiologic studies is therapeutic against development of AD. The extent to
Maia and de Mendonca [5], wherein AD subjects were which adenosine receptor antagonism by caffeine is
found to have consumed much less caffeine (calculated involved in the aforementioned mechanisms has yet to
from questionnaires) during the 20 years preceding be determined.C. Cao et al. / Caffeine and Lack of AD Progression 561 Aside from caffeine, coffee is rich in many other caffeine levels at the beginning of a 2–4 year assess- components (e.g., antioxidants, anti-inflammatory ment period had a 100% chance of avoiding conversion compounds) that may also complement caffeine’s to dementia over that period, and 2) caffeine/coffee actions to reduce risk of AD [13–17]. In this regard, may have provided this protection, in part, by pre- we most recently reported that AD mice treated twice- venting a selective immune decline that we found to weekly with caffeinated coffee (but not those treated occur in MCI patients several years prior to dementia with decaffeinated coffee) showed enhanced mem- conversion. Although our findings are associative and ory [18]. Since treatment was given every 72 hours, require verification via controlled clinical trials with the cognitive-enhancing ability of caffeinated coffee caffeine/coffee administrated over several years to involved a mechanism that out-lives the presence of MCI patients, the present study establishes a linkage coffee’s components (including caffeine) in plasma. between higher caffeine/coffee intake in MCI patients In that same study, we showed that a single oral and prevention or delaying of progression to dementia. administration of caffeinated coffee induced dramatic elevations in three plasma cytokines (granulocyte- MATERIALS AND METHODS colony stimulating factor (GCSF), IL-10, and IL-6) several hours thereafter, with all remaining cytokines Study population unaffected. This plasma cytokine profile was not seen following administration of either decaffeinated cof- Subjects were previously recruited through the fee or caffeine, indicating that some as-yet unidentified Florida Alzheimer’s Disease Research Center component of coffee synergizes with caffeine to greatly (FADRC) as part of a multisite study of persons aged enhance plasma levels of three beneficial cytokines 65 years and over from the Miami and Tampa areas. [18]. This cytokine response, particularly for GCSF, The present case-control study involved a total of 124 appears to trigger long-term beneficial mechanisms randomly-selected subjects between 65 and 88 years against AD (e.g., recruitment of bone marrow cells to of age at study onset, with the Miami cohort comprised remove brain A, enhanced synaptogenesis, increased of 81 subjects and the Tampa cohort comprised of neurogenesis) that out-live coffee’s various plasma 43 subjects. The original FADRC study protocol, to components. Thus, coffee would seem to provide pro- longitudinally monitor cognitive status and blood tective effects against AD that are not possible with biomarkers, was approved by both the University of caffeine or decaffeinated coffee alone. Consistent with Miami and University of South Florida Institutional this premise are epidemiologic studies showing that Review Boards. Prior to the start of the study, all caffeinated coffee intake (but not caffeinated tea or participants gave their written informed consent. overall caffeine intake) was associated with better cog- nitive function in aged humans [19], while mid-life General protocol caffeinated coffee (but not caffeinated tea intake) was associated with later reduced risk of AD [3]. At the initial visit (between February 2006–July Although AD starts in the brain several decades 2007), all subjects were neurologically assessed prior to AD diagnosis, performing prospective through the following evaluations: 1) full clinical his- (longitudinal) human studies over decades to test tory, obtained from the participant and corroborated therapeutics for their “protective” potential against AD by a reliable informant; 2) neurological evaluation; 3) would be most challenging. Patients with mild cog- psychiatric evaluation, including administration of the nitive impairment (MCI) already have considerable Geriatric Depression Scale [23] and the Neuropsychi- AD neuropathology accompanied by a mild loss of atric Inventory [24]; 4) Clinical Dementia Rating scale short-term memory [20]. Inasmuch as 12–15% of MCI (CDR) [25]; 5) Mini-Mental State Evaluation (MMSE) patients will go on to develop dementia per year in [26]; and 6) a neuropsychological test battery, as out- populations seeking evaluation for memory disorders lined by the National Alzheimer’s Coordinating Center [21, 22], they are a good population to test the ability for National Alzheimer’s Disease Research and Clin- of candidate prophylactics to protect against AD or ical Centers (NACC) protocol [27], which includes conversion to AD over a relatively short study period. standard measures of memory, language, visuospatial The present case-control study links epidemiologic and executive function. Also included were additional evidence suggesting caffeine/coffee as prophylactic tests, including the Three-Trial Fuld Object Memory against AD to our recent findings from AD mice Evaluation [28] and Hopkins Verbal Learning Test- in reporting that: 1) MCI patients with high blood Revised [29]. In addition, MRI scans were acquired
562                                   C. Cao et al. / Caffeine and Lack of AD Progression

using a proprietary 3-D (volumetric) protocol on a                 test for dementia (corresponding to NINCDS-ADRDA
Siemens Symphony, 1.5 Tesla machine (Iselin, NJ).                  criteria).
   Based on the above neurologic evaluation at the
initial visit, subjects were diagnosed as either aged              Consensus diagnoses
normal, MCI (both amnestic and non-amnestic), or                      The final consensus cognitive diagnosis was made
dementia (DEM). At that same visit, a fasting blood                using a computational algorithm developed and vali-
sample was taken via venous puncture during the                    dated in the Florida ADRC which combined the AlgDx
morning hours. Plasma was immediately separated by                 assigned each NACC diagnosis by combining the
centrifugation, frozen, and stored at −80◦ C until assay.          physician diagnoses with the neuropsychological eval-
Over the ensuing 2–4 year period, subjects came in on a            uation. Subjects diagnosed with aMCI or non-amnestic
yearly basis for re-assessment of cognitive status. Five           MCI (naMCI) in the FADRC-CC were judged to have
groups resulted from the follow-up analysis:                       met Petersen’s criteria for MCI [21], as well as crite-
                                                                   ria for a diagnosis of Cognitive Impairment without
  N→N     Initially normal and remained so dur-                    Dementia [35]. Subjects judged to meet criteria for
          ing 2–4 year follow-up                                   dementia were impaired on neuropsychological testing
  N→MCI   Initially normal, but converted to MCI                   and judged by the clinician to have sufficient memory,
          during 2–4 year follow-up                                or other cognitive and functional impairment, to meet
  MCI→MCI Initially MCI and remained so during                     criteria for dementia by DSM-IV criteria [36].
          2–4 year follow-up
  MCI→DEM Initially MCI, but converted to                          Progression over time
          dementia during 2–4 year follow-up                           Progression from a normal diagnosis to aMCI or
  DEM     Initially dementia and remained                          naMCI required a diagnosis of MCI by clinical evalua-
          dementia during follow-up                                tion made by the patient’s physician, with confirmation
                                                                   of cognitive deficits by the neuropsychologist who
Diagnostic procedures                                              used a threshold of 1.5 SD or below expected levels
                                                                   of performance on one or more memory measures,
   The physician initially assigned a cognitive diagno-            with or without non-memory impairment (aMCI) or
sis of N, MCI, or dementia, based on the subject’s entire          one or more non-memory measures (naMCI). While
clinical history using a reliable informant, including             the follow-up diagnosis by the physician and the neu-
his/her functional status (which was derived from the              ropsychologist were made independently, they were
history itself and from the CDR rating and a func-                 not blind to the previous or baseline diagnoses, as is
tional activity questionnaire), as well as the MMSE                the case with most longitudinal studies. These clini-
score and sub-scores. All neuropsychological tests                 cians were directed to adhere to as strictly as possible to
were administered in the subjects’ native language                 guidelines or rules in making the consensus diagnosis
(English or Spanish), and age and education adjusted               at baseline and all of their yearly follow-up evalua-
normative data applicable to both language groups                  tions. Subjects were considered to have progressed to
were used to assess the cut points for impairment                  dementia if in their physician’s judgment, social and
in each test, based on a large co-normed normative                 occupational function was sufficiently impaired to ful-
database used in previous studies [30]. Memory was                 fill DSM-IV criteria for a dementia syndrome [3] and
assessed, with the 3-trial Fuld Object Memory Eval-                the patient had deficits on memory testing equal to or
uation [28] and Delayed Visual Reproduction of the                 greater than 1.5 SD below expected levels. For several
Wechsler Memory Scale-R [31]. Tests of non-memory                  patients diagnosed with dementia upon initial year 01
function included category fluency (language) [32],                follow-up, later clinical follow-up was not performed.
letter fluency (language) [33], Block Design-WAIS-
III (visuospatial) [31], Trails B (Executive) [34], and            Plasma analysis
Similarities-WAIS-R (Executive) [31]. Neuropsycho-
logical classification was achieved employing methods              Caffeine
developed by Loewenstein et al. [30]. The thresholds                 Plasma caffeine concentrations were measured via
used were: (a) a test score of 1.5 SD or greater below             compete ELISA Kits from Neogen (WI, USA), fol-
expected normative values on any single test for MCI               lowing manufacturer’s protocol. In brief, the enzyme
syndromes and (b) 2.0 SD or greater below expected                 conjugate solution was prepared by diluting the 180×
normative values in one memory and one non-memory                  enzyme conjugate stock 1 to 180 in the EIA buffer
C. Cao et al. / Caffeine and Lack of AD Progression 563
provided. Caffeine was then diluted with EIA buffer at levels were detected using the Bio-Rad Bio-Plex, with
two-fold dilutions from 200 ng/ml to 0.39 ng/ml. Then reagents being ordered from Millipore as customer
20 l standard of each dilution was added into the kits (Millipore, CA). All samples and standards were
coated plate. Plasma samples were then diluted with prepared using company protocols. Plasma samples
EIA buffer, with 20 l of this dilution added into the were prepared for analysis by diluting 1 volume of the
coated plate. Both standard and samples were run in serum sample with 3 volumes of the Bio-Plex mouse or
duplicate in the plate. Positive and negative controls human sample diluent. Detailed procedures were per-
of 20 l were loaded to each plate. Then 180 l of formed by following the protocol provided by the man-
diluted drug-enzyme conjugate was added into each ufacture. Finally, the plates were read. Each cytokine
well and mixed by gently shaking the plate. Plates level was calculated based on its own standard curve.
were covered with plastic film and incubated at room
temperature for 45 min. During the incubation, a 10× Immunoglobulin isotyping assay
wash buffer was diluted to 1×with DI water and mixed Plasma levels of IgG1, IgG2, IgG3, and IgG4 were
thoroughly. Once incubation was completed, the liquid determined with Beadlyte Human IgG subclass isotyp-
was dumped from the wells. Plates were then taped ing kits (Millipore, CA) by using Luminex detection
on a clean lint-free towel to remove any remaining assay and following the protocol provided by manu-
liquid in the wells. Then each well was washed with facturer. Briefly, each plasma sample was diluted with
300 l of diluted wash buffer 3 times. After complet- dilution buffer in a 96 well sample-preparing plate. Iso-
ing the last wash step, the bottom of the wells was typing beads were then added into each well, mixed
wiped with a lint-free towel to remove any liquid on and incubated for 1 hour at room temperature on a
the outside of the wells. Then 150 l of the K-Blue plate shaker. Then samples were transferred into a pre-
Substrate was added to each well with a multi-channel wet membrane plate and washed under a controlled
pipette. The plate was then mixed by gently shak- vacuum system. Detection antibody was then added
ing, followed by incubation at room temperature for into each well, followed by incubation at room tem-
5 to 20 min. To stop the enzyme reaction, 50 l of perature for 30 minutes. Plates were then washed with
red stop solution was added to each well and gen- controlled vacuum and submitted to Luminex-100 after
tly mixed. The absorbance was then measured with suspension in wash buffer. The concentration of each
a plate reader (Synergy HT, Biotek, VT) at a wave- IgG subtype was calculated according to the standard
length of 650 nm. The absorbance was converted into curve.
concentration using Gen5 software.
Statistical analysis
Aβ1-40 and Aβ1-42
Plasma A1-40 and A1-42 levels were detected Statistical analysis of subject profiles and plasma
by using ELISA kits (Invotrogen, Camarilla, CA). biomarkers between clinical groups were initially per-
Standard and samples were mixed with detection anti- formed using ANOVA, which was then followed by
body and loaded on the antibody pre-coated plate as Tukey HSD tests or additional ANOVAs for planned
the designated wells after three hours of incubation pair-by-pair comparisons. Very infrequently, outlier
at room temperature. HRP-conjugated antibody was analysis (Grubb’s test) of a group’s data for a given
added after wash, and substrates were added for colori- biomarker indicated removal of a single subject’s
metric reaction, which was then stopped with sulfuric data from statistical analysis involving that particu-
acid. Optical density was obtained and concentrations lar marker, which was then done. All clinical data
were calculated according a standard curve. are presented as mean ± SEM, with significance group
differences designated at the p < 0.05 or higher level.
Cytokines/chemokines/growth factors
For both human plasma samples, as well as plasma RESULTS
samples from a prior mouse study [18] presented in the
Discussion, a total of eight cytokines and chemokines Table 1 shows the subject profiles for both Miami
were measured with Lumenix multiplex assay (GCSF, and Tampa cohorts combined (n = 125), as well as for
IL-10, IL-6, TNF-␣, IL-1␣, IL-17, IFN-␥, and IP-10). each cohort separately. For age at study onset, a three-
An addition four cytokines/growth factors (ENA- group comparison (N, MCI, and DEM) for the Miami
78, PDGF BB, NGF, and MCP-1) were analyzed and Tampa cohorts separately revealed no overall
from human plasma samples. Expression profiles and differences via ANOVA for either cohort564 C. Cao et al. / Caffeine and Lack of AD Progression
Table 1
Subject profiles for Miami + Tampa cohorts combined, as well as for each cohort separately
Miami + Tampa Cohorts combined Miami cohort Tampa cohort
Subjects and gender (M/F) Age Follow-up (yrs) Subjects Age Subjects Age
N 69 20/49 73.4 ± 0.7 2.75 ± 0.08 45 73.3 ± 0.8 24 73.5 ± 1.2
MCI 32 17/15 76.5 ± 1.1 2.51 ± 0.11 24 76.7 ± 1.4 8 75.9 ± 2.0
DEM 23 12/11 77.1 ± 1.3∗ 2.35 ± 0.14 12 77.5 ± 2.1 11 76.7 ± 1.4
N→N 60 18/42 72.9 ± 0.7 2.73 ± 0.09 38 72.7 ± 0.9 22 73.1 ± 1.2
N→MCI 9 2/7 76.6 ± 1.3 2.88 ± 0.20 7 76.3 ± 1.4 2 78.0 ± 4.0
MCI→MCI 21 15/6 75.0 ± 1.5 2.62 ± 0.15 15 74.7 ± 1.9 6 75.7 ± 2.7
MCI→DEM 11 2/9 79.4 ± 1.4∗ 2.33 ± 0.14 9 80.0 ± 1.6 2 76.5 ± 2.5
DEM 23 12/11 77.1 ± 1.3 2.35 ± 0.14 12 77.5 ± 2.1 11 76.7 ± 1.4
∗ p < 0.05 versus N or [N→N].
[F(2,78) = 2.40; p = 0.10 and F(2,40) = 1.72; p = 0.19, statistically significant differences between MCI and
respectively]. For both cohorts combined, there DEM subjects with regards to plasma caffeine levels.
was a significant overall difference in age for the Normal and MCI groups were then further sub-
three-group comparison [F(2,121) = 3.83; p < 0.03)], divided according to whether subjects remained stable
with DEM subjects being significantly older than or declined in cognitive status over the 2–4 year follow-
normals at study initiation (p < 0.05). If age at up (Fig. 1b). For initially-diagnosed normal subjects,
study onset is compared in terms of the five-groups a 26% lower plasma level of caffeine in normals
resulting from the 2–4 year follow-up (e.g., N→N, that converted to MCI (N→MCI) compared to sta-
N→MCI, MCI→MCI, MCI→DEM, DEM), an ble normals (N→N) was not significance because of
overall group difference in age was present for considerable variability in caffeine levels among indi-
both cohorts combined [F(4,119) = 3.56; p < 0.004], viduals in both of these sub-groups. In contrast, 11
with post hoc analysis showing that only the N→N MCI subjects that progressed to DEM (MCI→DEM)
versus MCI→DEM groups differed significantly in had much lower plasma caffeine levels [F(1,30) = 6.77;
age (p < 0.05). For each cohort separately, no age p < 0.02)] that were 51% below levels at study initiation
differences were present among the five groups. It when compared to MCI subjects that remained MCI
is important to underscore that, for the important (MCI→MCI; Fig. 1b). Plotting of blood caffeine levels
pair-by-pair comparisons of [N→N versus N→MCI] for all individuals in the MCI→MCI and MCI→DEM
and [MCI→MCI versus MCI→DEM], there were groups revealed that none of the MCI→DEM subjects
no differences in age irrespective of combined or had initial blood caffeine levels that were above an
separate cohort analysis. For all subjects in this study, apparent critical value of 1200 ng/ml (Fig. 1c). By con-
the average follow-up period after initial cognitive trast, approximately half of MCI→MCI subjects had
assessment was around 2½–3 years (Table 1). blood caffeine levels at least that high. The data from
Plasma caffeine levels were analyzed simultane- this combined 2-cohort study indicates that blood caf-
ously by utilizing the same kits for both Miami and feine levels greater than 1200 ng/ml (t6 M plasma
Tampa cohorts, thus allowing combination of data caffeine) in MCI patients at the start of the study were
from the two cohorts. Plasma caffeine levels did not associated with a 100% chance of avoiding progression
co-vary with age since the correlation between age to dementia during the 2–4 year follow-up.
and caffeine levels was not significant (r = −0.09; We then focused on the Miami cohort for additional
p > 0.34) for the combined cohorts. Moreover, there analysis because the Tampa cohort had several sub-
were no statistically significant caffeine versus age groups with very few subjects (Table 1). Moreover,
correlations among normal, MCI, or DEM sub-groups. with the exception of caffeine levels, plasma levels of
Analysis of plasma caffeine levels from the initial all other biomarkers were analyzed separately for the
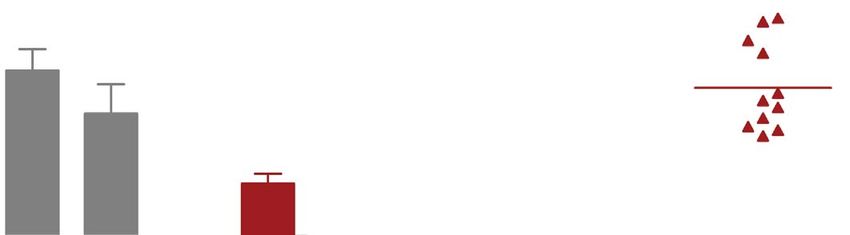
visit in relation to initial diagnosis (Fig. 1a) revealed Miami and Tampa cohorts; ensuing statistical analy-
significantly lower caffeine levels in MCI subjects ses indicated the data from both cohorts could not
relative to normals [F(1,99) = 5.52; p < 0.03]. Lower be combined due to the two independent biomarker
caffeine levels were also present in DEM subjects analyses.
compared to normals, but not to statistical significance As was the case for both Miami and Tampa cohorts
[F(1,90) = 3.42; p < 0.07)] (Fig. 1a). There were no combined (Fig. 1b), MCI subjects in the MiamiC. Cao et al. / Caffeine and Lack of AD Progression 565 Fig. 1. Plasma caffeine levels at the beginning of a 2–4 year cognitive assessment period in subjects from two combined cohorts (Miami and Tampa). a) Caffeine levels in subjects grouped by their initial cognitive status as Normal (N), mild cognitive impairment (MCI), or dementia (DEM). Lower caffeine levels were present in MCI and DEM subjects at study initiation. ∗∗ p < 0.02 versus N; † p = 0.07 versus N. b) Caffeine levels in subjects grouped by their eventual cognitive status during follow-up as stable Normal (N→N), Normal converting to MCI (N→MCI), stable MCI (MCI→MCI), or MCI converting to DEM (MCI→DEM). Blood plasma caffeine levels at study initiation were substantially lower in MCI patients who eventually progressed to DEM compared to those that remained stable MCI. ∗∗ p < 0.02. c) Plotting of caffeine levels in individual MCI subjects who progressed to DEM and those that remained stable MCI (group means indicated by horizontal lines). None of the MCI→DEM subjects had initial caffeine levels above a critical level of 1200 ng/ml, while half of stable MCI subjects had levels higher than that level. Thus, subjects with the initial diagnosis of MCI and who possessed plasma caffeine levels above 1200 ng/ml at that time had a 100% chance of avoiding DEM during the ensuing 2–4 years. cohort that progressed to DEM had much lower initial subjects compared to MCI→MCI subjects were simi- caffeine levels (−56%) compared to MCI subjects that lar to the 56% lower plasma caffeine levels in the same remained stable [F(1,22) = 7.63; p < 0.02] (Fig. 2a). MCI→DEM subjects. No such differences in plasma Interestingly, DEM subjects in the Miami cohort had caffeine or the same three cytokines were evident for caffeine levels significantly higher than those of MCI N→N versus N→MCI subjects (Fig. 2). Indeed, there subjects that progressed to DEM [F(1,19) = 7.69; were no differences between these two sub-groups p < 0.02] (Fig. 2a). Analysis of all 11 cytokines of normal subjects for any of the 11 cytokines, 4 analyzed from the initial blood sample revealed 3 IgGs, and 2 A isoforms analyzed in plasma (data not cytokines that were particularly affected—GCSF, IL- shown). Moreover, there were no group differences 10, and IL-6 (Fig. 2b–d). All three of these cytokines between normal subjects and stable MCI subjects for were lower in plasma of MCI patients that were des- any biomarker analyzed (Fig. 2). Group differences tined for AD conversion (MCI→DEM) in comparison (suppressions) in plasma caffeine and cytokine levels to both non-converting MCI subjects (MCI→MCI) were largely restricted to the MCI→DEM group. and DEM subjects. For GCSF, IL-10, and IL-6 com- In contrast to the three cytokines shown to be lower parisons involving MCI→DEM versus MCI→MCI, in MCI subjects destined for DEM conversion com- [F(1,22) = 2.38; p = 0.13], [F(1,21) = 2.33; p = 0.14], pared to MCI stable subjects (Fig. 2b–d), none of the and [F(1,21) = 4.1; p < 0.05], respectively. For cytokine other 8 plasma cytokines or plasma NGF showed any comparisons involving MCI→DEM versus DEM, such profile when the same two MCI sub-groups were [F(1,19) = 5.6; p < 0.05], [F(1,18) = 7.9; p < 0.02], and compared (Table 2). In MCI→DEM subjects, these [F(1,18) = 8.52; p < 0.02], respectively. The 39–55% 9 cytokines/growth factors varied between reductions lower levels of these three cytokines in MCI→DEM to overt elevations compared to MCI→MCI subjects.
566 C. Cao et al. / Caffeine and Lack of AD Progression
Figure 2 indicates a relationship between blood lev-
els of caffeine and the three cytokines GCSF, IL-10,
and IL-6, with low levels of all four being found in MCI
patients destined to progress to DEM during the ensu-
ing 2–4 years. To further elucidate the linkage between
blood caffeine levels, these three cytokines, and cog-
nitive status, we re-examined caffeine levels for the
two MCI subgroups in Fig. 2a. For the MCI→MCI
group, we took the three subjects having the highest
plasma caffeine levels (↑ caf. group) and the three
subjects with the lowest caffeine levels (↓ caf. group).
Plasma markers from these two groups of subjects were
compared with three subjects from the MCI→DEM
group that had plasma caffeine levels very compara-
ble to the (↓ caf.) MCI→MCI group (Fig. 3). When
caffeine, GCSF, IL-10, and IL-6 levels were compared
between these subjects, it became clear that high blood
caffeine levels in MCI→MCI subjects are linked to
high blood levels of GCSF, IL-10, and IL-6 in those
same subjects. By contrast, low blood caffeine levels in
either MCI→MCI or MCI→DEM subjects are linked
to lower levels of all three cytokines (Fig. 3).
Although the dietary source of caffeine for sub-
jects in this study was not determined or available, the
fact that high plasma caffeine levels were selectively
associated with high plasma levels of three cytokines
(GCSF, IL-10, and IL-6) suggests that coffee was the
major or perhaps only source of caffeine for MCI
patients that did not convert to DEM (MCI→MCI).
Figure 4, which depicts transformed data from our
earlier study [18], underscores the reasoning for that
premise and is addressed in the Discussion’s Interpre-
tations and Implications sub-section.
DISCUSSION
This study provides an intriguing association
between plasma caffeine levels in MCI patients and
their ensuing progression (or not) to dementia. High
plasma caffeine levels in MCI patients at the begin-
ning of a 2–4 year cognitive assessment period were
Fig. 2. a–d) Plasma caffeine, GCSF, IL-10, and IL-6 levels at the
beginning of a 2–4 year cognitive assessment period in subjects from associated with complete avoidance of progression to
the Miami cohort. All four biomarkers were significantly or near- dementia over that period. Although several studies
significantly lower in MCI subjects who later progressed to DEM have previously associated caffeine/coffee intake with
(MCI→DEM) compared to MCI subjects that remained stable, or
reduced risk of AD [1–3, 5], in the present study we
compared to subjects initially classified as AD. ∗ p < 0.05; ∗∗ p < 0.02.
provide more direct evidence of this association by
measuring plasma caffeine levels. If caffeine/coffee
intake was indeed critical to protection against demen-
For all four IgGs and both A isoforms measured in tia progression, it likely provides this protection in
plasma, no differences were observed between the two part by preventing a selective immune decline in
MCI sub-groups. MCI patients—an immune decline characterized byC. Cao et al. / Caffeine and Lack of AD Progression 567
Table 2
A comparison of initial plasma biomarkers in MCI→MCI and MCI→DEM subjects from the Miami cohort
MCI→MCI MCI→DEM Percent change
(n = 15) (n = 9) (%)
Cytokines (pg/ml)
TNF-␣ 0.65 ± 0.07 0.73 ± 0.11 +12
IFN-␥ 5.95 ± 1.28 4.62 ± 1.6 −22
IL-1␣ 1.09 ± 0.15 0.91 ± 0.14 −16
IL-17 13.1 ± 5.1 17.8 ± 15.4 +35
ENA-78 72.1 ± 10.3 74.4 ± 11.3 +3
IP-10 71.1 ± 8.3 90.8 ± 12.2 +28
PDGF BB 5.53 ± 1.42 7.21 ± 2.2 +30
MCP-1 2.11 ± 0.34 2.42 ± 0.33 +15
Growth factors
NGF (pg/ml) 8.8 ± 2.1 2.95 ± 0.5 −66
IgGs (pg/ml)
IgG1 7147 ± 800 6512 ± 519 −9
IgG2 85 ± 20 58 ± 17 −31
IgG3 1288 ± 139 1700 ± 334 +32
IgG4 718 ± 174 592 ± 278 −17
Amyloid- (pg/ml)
A1-40 213 ± 18 235 ± 20 +10
A1-42 28 ± 2 25 ± 4 −11
Fig. 3. a–d) Plasma caffeine, GCSF, IL-10, and IL-6 levels in the three stable MCI subjects who initially had the highest and lowest plasma
caffeine levels. Also plotted are these same four biomarkers in three MCI subjects who eventually progressed to DEM and whose plasma
caffeine levels were comparable to stable MCI patients with the lowest caffeine levels. MCI subjects that remained stable and who had the
highest caffeine levels at study onset had plasma levels of GCSF, IL-10, and IL-6 that were higher than the other two groups. Horizontal lines
are the average for that given triple sampling.
decreases in plasma GCSF, IL-10, and IL-6 levels important for maintaining plasma levels of these three
several years prior to dementia conversion. The higher critical cytokines and preventing dementia conversion.
caffeine levels (most likely associated with coffee As detailed below under “Interpretations and Implica-
intake) in many stable MCI subjects were probably tions”, these stable MCI subjects exhibited the exact568 C. Cao et al. / Caffeine and Lack of AD Progression
same plasma cytokine profile (e.g., elevated GCSF,
IL-10, and IL-6 levels) as AD transgenic mice given
caffeinated coffee, a cytokine profile not provided by
decaffeinated coffee or caffeine alone in such mice
[18]. Thus, it is likely that stable MCI subjects were
getting most or all of their caffeine from caffeinated
coffee. Our results clearly warrant controlled clinical
trials with caffeine/coffee administration to MCI
subjects over a 2–4 year period to definitively eluci-
date the ability of caffeine/coffee to protect against
dementia/AD, as well as the mechanisms involved.
It should be noted that the dementia subjects in this
study were diagnosed through “cognitive” assessment.
As such, the vast majority of these dementia subjects
were undoubtedly AD patients (although not all),
necessitating use of the term “dementia” rather than
“AD” for the results of this study.
Comparison to other studies
Prior epidemiologic-based studies have reported an
association between moderate caffeine/coffee intake in
mid-life [3] or in older age [1, 2, 5, 19] and reduced risk
of cognitive impairment/AD. Highly controlled AD
mouse studies have further strengthened the linkage
between caffeine/coffee and protection against AD.
These studies have demonstrated that long-term oral
treatment of AD mice with caffeine [9] or caffeinated
coffee [18] prevents cognitive impairment. Utilizing
these same AD mouse, we have identified specific
“disease-modifying” mechanisms for caffeine alone,
and in combination with other components of coffee.
Caffeine alone suppresses brain levels of both enzymes
(- and ␥-secretase) required for A production [9]
via targeting of specific signal transduction mecha-
nisms [10, 12]. As well, caffeine has anti-inflammatory
actions in AD mouse brains [11]. Most recently, we
have uncovered a surprising synergy between caffeine
and some as-yet unidentified component of coffee to
Fig. 4. a) Levels of eight plasma cytokines in MCI subjects that provide a highly beneficial increase in three key plasma
remained stable (MCI→MCI) over the subsequent 2–4 year period, cytokines [18]. GCSF is the most notable of these three
with each cytokine graphed as a percent difference in reference to because of its beneficial cognitive actions in AD mice
values from MCI subjects who progressed to DEM (MCI→DEM)
during the same time period. Note that three cytokines (GCSF, IL-10, that involve synaptogenesis, neurogenesis, and recruit-
and IL-6) are selectively elevated in stable MCI subjects. b–d) Levels ment of bone marrow stems cells to phagocytize brain
of the same eight plasma cytokines, but in AD transgenic mice that A [6]. Thus, coffee’s caffeine and non-caffeinergic
had been given acute treatment three hours earlier with caffeinated components would appear to exert multiple anti-AD
coffee (b), caffeine (c), or decaffeinated coffee (d). Cytokine levels
for all three treatments are graphed as a percent difference in refer- actions.
ence to values from AD mice treated with saline control. The original The aforementioned studies underscore a substantial
data (i.e., actual plasma cytokine levels) are presented in Cao et al. body of both human epidemiologic and mouse model
[18]. Note that only caffeinated coffee treatment (b) resulted in a
work that had already linked caffeine/coffee to pro-
plasma cytokine profile in AD mice that was similar to that of sta-
ble MCI subjects (a), both having elevated GCSF, IL-10, and IL-6 tection against AD prior to the present study—what
levels. has been lacking is direct human evidence for thatC. Cao et al. / Caffeine and Lack of AD Progression 569
linkage. The present case-control study addressed this In subjects that were initially MCI, however, plasma
need by directly measuring caffeine levels in blood of caffeine levels were predictive for MCI subjects that
aged individuals (65–88) to determine if those levels would remain stable (e.g., not progress to DEM) over
were predictive of future cognitive status. Thus, certain the ensuing 2–4 year cognitive assessment period. In
limitations inherent to standard epidemiologic studies MCI subjects, plasma caffeine levels above a criti-
(e.g., recall bias, variable control) were avoided. cal value of 1200 ng/ml were associated with a 100%
chance of avoiding AD conversion over that period.
Interpretation and implications The resultant t6 M plasma caffeine concentration
is typically present several hours after intake of 1-
When subjects were groups according to their “ini- 2 cups of coffee [39], given that the half-life of
tial” cognitive status (Normal, MCI, or DEM), there plasma caffeine is 3-4 hours and peak plasma caffeine
were group differences in plasma caffeine, with MCI levels of 10–20 M occur around 1 hour following
subjects having significantly lower levels compared such oral caffeine ingestion [40]. By contrast, MCI
to Normals. When Normal and MCI subjects were subjects that did progress to DEM had initial caffeine
further sub-divided into groups that either remained levels that were substantially (−56%) lower compared
stable or that converted to MCI or DEM, respec- to stable MCI subjects. Interestingly, both sub-groups
tively, Normals that converted to MCI had generally of MCI subjects exhibited less variability in plasma
lower initial caffeine levels compared to Normals that caffeine concentration compared to the sub-groups of
remained stable. However, this 26% lower caffeine Normals.
level was not significant due to the large variation For subjects that were already diagnosed with DEM
in caffeine levels among subjects in both of the ini- at the beginning of the study, plasma caffeine levels
tially Normal sub-groups. Factors that could account were comparable to stable MCI subjects and signif-
for this variability in plasma caffeine levels are: marked icantly higher than MCI→DEM subjects. Moreover,
individual differences in caffeine intake, individual dif- accompanying levels of GCSF, IL-10, and IL-6 in
ferences in caffeine metabolism, and extent of smoking DEM subjects were also significantly higher than those
(which affects caffeine metabolism). Moreover, multi- in MCI→DEM subjects. Although increased plasma
ple non-caffeinergic factors could be important in aged cytokine levels in AD were anticipated as part of a
Normals for determining whether or not they converted heightened inflammatory response following diagnosis
to MCI. of DEM (see next section), the elevated caffeine levels
No other plasma biomarkers were initially different in DEM subjects compared to MCI→DEM subjects
for Normals that converted to MCI versus Normals that were not anticipated. It is important to keep in mind,
did not, including the 3 cytokines (GCSF, IL-10, and however, that caffeine levels in DEM subjects were
IL-6) that collectively were different between convert- only higher in comparison to the very low levels of
ing and non-converting MCI subjects. These results MCI→DEM subjects; plasma caffeine levels in DEM
suggest that the mild short-term memory impairment subjects were still 40% lower than those of all Normals
of MCI does not involve any advance changes in and near-identical to the low levels present in all MCI
plasma cytokines, A, or immunoglobulins several subjects.
years before MCI diagnosis. Moreover, there were A number of prior studies have investigated the pos-
no differences between normal subjects and stable sibility that plasma cytokine levels could be viable
MCI subjects for any biomarker analyzed, indicat- biomarkers for progression from Normal or MCI to AD
ing an inability of “individual” plasma biomarkers [37, 41, 42]. Although no single cytokine/growth factor
to distinguish between Normal and MCI subjects at has been identified thus far as predictive of impending
study initiation. These results are consistent with prior MCI or AD, Laske and colleagues have determined
studies, which have largely reported no consistent dif- that blood levels of several neurotrophic/hematopoietic
ferences in individual plasma cytokines between aged factors (e.g., GCSF, BDNF, and SCF) are decrease
normal and MCI subjects [37, 38]. Other than the in “early AD” [43–45], resulting in deficient neu-
present study, we are aware of no earlier study that rotrophic/hematopoietic brain support. We believe this
investigated whether plasma cytokine levels of nor- deficient brain support actually begins to occur in
mal subjects were predictive of later MCI diagnosis. late MCI, several years prior to AD conversion, and
Although any single cytokine may not have this pre- is important for AD conversion. In this context, the
dictive potential, a combination of plasma cytokines in present study provides initial evidence that three key
normal aged individuals may be predictive [38]. cytokines (GCSF, IL-10, and IL-6) become collectively570 C. Cao et al. / Caffeine and Lack of AD Progression decreased in MCI patients several years prior to their those stable MCI patients with low caffeine levels (e.g., conversion to DEM. Thus, a selective immune decline below 1200 ng/ml) and concomitantly low levels of would seem to occur during those years. If this immune GCSF, IL-10, and IL-6, will progress to DEM sooner decline can be verified in larger cohorts of MCI than MCI patients with high caffeine/GCSF/IL-10/IL- subjects, regular monitoring of these three plasma 6 levels. cytokines beginning at onset of MCI may provide sev- Finally, it should be underscored that the lack of eral years warning of impending conversion to DEM. differences between the two MCI sub-groups in mul- By the time cognitive impairment becomes severe tiple plasma IgGs, A isoforms, and the 8 unaffected enough to warrant clinical diagnosis of DEM, plasma plasma cytokines, indicates that these biomarkers were levels of the 3-cytokines appear to have re-established not independently predictive of impending MCI pro- their higher levels, but this elevated immune response gression to DEM. would seem to come too late for cognitive protection. We propose that higher caffeine intake (very likely Strengths and limitations in association with coffee) maintains the levels of these three critical cytokines in MCI subjects, such A key strength of our study was the direct measure- that progression to DEM occurs later or perhaps not ment of blood caffeine levels, rather than reliance on at all. recall or dietary surveys of caffeine intake, as has been Caffeinated coffee was very likely the primary typical of prior retrospective/longitudinal epidemio- dietary source of caffeine for stable MCI subjects logic studies. However, our measurement of blood because their blood cytokine profile was very similar caffeine levels was also the largest study limitation to that of AD (APPsw+PS1) transgenic mice acutely because of a lack of ancillary data collection that would given caffeinated coffee (see Cao et al. [18]). In that have provided greater insight. First, we did not take recent study, AD transgenic mice were given a sin- multiple blood samples for caffeine analysis during the gle treatment with caffeinated coffee, decaffeinated 2–4 year study period, only at the study’s inception. coffee, caffeine, or saline. Of all four acute treat- This is because the study was created retrospectively ments, AD mice only responded to caffeinated coffee from available blood (taken at initial clinical exam) and with greatly and selectively increased plasma levels of follow-up clinical evaluations available over 2–4 years GCSF, IL-10, and IL-6. The methodology of this AD as part of the FADRC’s ongoing longitudinal assess- mouse study relevant to the present study is briefly ment of aged individuals for biomarkers and cognitive indicated in the Supplementary Data section (avail- status. Second, the extent to which caffeine levels at able online: http://www.j-alz.com/issues/30/vol30- study onset were indicative of daily caffeine intake 3.html#supplementarydata02). Figure 4 compares was not determined. For example, we did not monitor plasma cytokine data from MCI patients of the present the primary source(s) of caffeine in study partici- study with the same cytokines from the AD mouse pants (although we presented evidence that the primary study. Only administration of caffeinated coffee pro- source was caffeinated coffee for stable MCI subjects). vided the same profile of substantially elevated GCSF, We also did not ask participants when their last caffeine IL-10, and IL-6 levels in transgenic mice that is seen intake was prior to coming in for the initial visit/blood in stable MCI→MCI patients. Thus, it is likely that sample. As well, we did not ask subjects about their “caffeinated coffee” was the source of caffeine associ- long-term caffeine/coffee intake habits, although it is ated with cognitive stability in the present study’s MCI likely that subjects with high plasma caffeine levels are patients. habitual/moderate coffee drinkers. Additionally, com- Although stable MCI→MCI subjects as a group plete data on ApoE status, education level, ethnicity, had substantially higher plasma caffeine levels com- dietary habits, and lifestyle choices were not avail- pared to those MCI subjects that progressed to DEM able for all study participants, so none of these can (MCI→DEM), it is important to recognize that half of presently be eliminated as contributory to the results these stable MCI subjects had caffeine levels below the observed. Finally, the follow-up time of 2–4 years was critical level for protection (e.g., 1200 ng/ml), yet they relatively short for establishing causality and reverse did not progress to DEM during the 2–4 year follow- causation (i.e., subjects with poorer cognitive perfor- up period. Clearly, other dietary/life-style choices, risk mance may have reduced caffeine/coffee intake) is factors, and extent of disease progression entered into possible. Nonetheless, the fact that MCI subjects in determining which MCI patients progressed to DEM Miami and Tampa cohorts independently showed the and which ones did not. Nonetheless, we predict that same relationship between blood caffeine levels and
C. Cao et al. / Caffeine and Lack of AD Progression 571
later risk of DEM progression provides a degree of cognitive impairment in Alzheimer’s mice and decreases A
confidence regarding this association. levels in both brain and blood. Neuroscience 163, 55-72.
[7] Cao C, Arendash G, Dickson A, Mamcarz M, Lin X, Ethell D
(2009) A-specific Th2 cells are sufficient to reverse cogni-
CONCLUSION tive impairment, cerebral angiopathy, and pro-inflammatory
profiles in Alzheimer’s transgenic mice. Neurobiol Dis 34,
63-70.
In providing initial direct evidence for caf- [8] Selkoe D (2011) Resolving controversies on the path to
feine/coffee being protective against dementia/AD, Alzheimer’s therapeutics. Nat Med 17, 1060-1065.
the present case-control study is nonetheless based [9] Arendash G, Schleif W, Rezai-Zadeh K, Jackson E, Zacharia
on association, wherein caffeine/coffee could simply L, Cracchiolo J, Shippy D, Tan J (2006) Caffeine protects
Alzheimer’s mice against cognitive impairment and reduces
be associated with stable cognitive status in MCI brain beta-amyloid production. Neuroscience 142, 941-952.
and not contribute to that cognitive stability. It is [10] Arendash G, Mori T, Cao C, Mamcarz M, Runfeldt M, Dick-
also important to recognize that the AD pathogenic son A, Rezai-Zadeh K, Tan J, Citron B, Lin X, Echeverria
process begins in the brain 1-2 decades before any V, Potter H (2009) Caffeine reverses cognitive impairment
and decreases brain A levels in aged Alzheimer’s mice. J
evident cognitive impairment; prophylactic interven- Alzheimers Dis 17, 661-680.
tion should ideally begin that far in advance of AD [11] Cao C, Cirrito J, Lin X, Wang L, Verges D, Dickson A, Mam-
symptoms. In that context, moderate caffeine/coffee carz M, Zhang C, Mori T, Arendash G, Holtzman D, Potter H
intake is safe for most humans, appears to attack mul- (2009) Caffeine suppresses -amyloid levels in plasma and
brain of Alzheimer’s transgenic mice. J Alzheimers Dis 17,
tiple aspects of the disease process, and is convenient 681-697.
for long-term/widespread dietary intake. If controlled [12] Zeitlin R, Patel S, Burgess S, Arendash GW, Echeverria V
clinical trials further support caffeine/coffee as protec- (2011) Caffeine induces beneficial changes in PKA signaling
tive against AD diagnosis, compelling evidence will and JNK and ERK activities in the striatum and cortex of
Alzheimer’s transgenic mice. Brain Res 1417, 127-136.
be given for the general public to adopt this strategy to [13] Higdon J, Frei B (2006) Coffee and health: A review of recent
reduce risk of AD. human research. Crit Rev Food Sci Nutr 46, 101-123.
[14] Halvorsen B, Carlsen M, Phillips K, Bohn S, Holte K, Jacobs
D, Blomhoff R (2006) Content of redox-active compounds
ACKNOWLEDGMENTS (ie., antioxidants) in foods consumed in the United States.
Am J Clin Nutr 84, 95-135.
This research was supported by the National Insti- [15] Herder K, Erlund I, Kolb H, Martin S, Carstensen M, Koenig
W, Sundvall J, Bidel S, Huha S, Tuomilehto J (2010) Effects
tute of Aging, NIH 5R01AG020094-03 and NIH of coffee consumption on subclinical inflammation and other
1P50AG025711-03, & USF/Byrd Alzheimer Center risk factors for type 2 diabetes: A clinical trial. Am J Clin Nutr
and Research Institute funds. 91, 950-957.
Authors’ disclosures available online (http://www.j- [16] Pham M, Yosida D, Yin G, Ohnaka K, Takayanagi R, Kono S
(2010) The relationship of coffee and green tea consumption
alz.com/disclosures/view.php?id=1187). with high-sensitivity C-reactive protein in Japanese men and
women. Clin Chem Lab Med 48, 849-854.
[17] Bakuradze T, Boehm N, Janzowski C, Lang R, Hofmann T,
REFERENCES Stockis JP, Albert FW, Stiebitz H, Bytof G, Lantz I, Baum M,
Eisenbrand G (2011) Antioxidant-rich coffee reduces DNA
[1] van Gelder B, Buijsse B, Tijhuis M, Kalmijn S, Giampaoli damage, elevates glutathione status and contributes to weight
S, Nissinen A, Kromhout D (2007) Coffee consumption is control: Results from an intervention study. Mol Nutr Food
inversely associated with cognitive decline in elderly Euro- Res 55, 793-797.
pean men: The FINE Study. Eur J Clin Nutr 61, 226-232. [18] Cao C, Wang L, Lin X, Mamcarz M, Zhang C, Bai G, Nong
[2] Ritchie K, Carriere I, de Mendonca A, Portet F, Dartigues J, J, Sussman S, Arendash GW (2011) Caffeine synergizes with
Rouaud O, Barberger-Gateau P, Ancelin M (2007) The neuro- another coffee component to increase plasma GCSF: Linkage
protective effects of caffeine: A prospective population study to cognitive benefits in Alzheimer’s mice. J Alzheimers Dis
(the Three City Study). Neurology 69, 536-545. 25, 323-335.
[3] Eckelinen M, Ngandu T, Tuomilehto J, Soininen H, Kivipelto [19] Corley J, Jia X, Kyle J, Gow A, Brett C, Starr J, McNeill G,
M (2009) Midlife coffee and tea drinking and the risk of late Deary I (2010) Caffeine consumption and cognitive function
life dementia: A population-based CAIDE study. J Alzheimers at age 70: The Lothian birth cohort 1936 study. Psychosomatic
Dis 16, 85-91. Med 72, 206-214.
[4] Laitala V, Kaprio J, Koskenvuo M, Raiha I, Rinne J, Sil- [20] Galvin J, Powlishta K, Wilkins K, McKeel D Jr, Xiong C,
ventoinen K (2009) Coffee drinking in middle age is not Grant E, Storandt M, Morris J (2005) Predictors of preclinical
associated with cognitive performance in old age. Am J Clin Alzheimer disease and dementia: A clinicopathologic study.
Nutr 90, 640-646. Arch Neurol 62, 758-765.
[5] Maia L, de Mendonca A (2002) Does caffeine intake protect [21] Petersen R, Doody R, Kurz A, Mohs RC, Morris JC, Rabins
from Alzheimer’s disease? Eur J Neurol 9, 377-382. PV, Ritchie K, Rossor M, Thal L, Winblad B (2001) Current
[6] Sanchez-Ramos J, Song S, Sava V, Catlow B, Mori T, Dick- concepts in mild cognitive impairment. Arch Neurology 58,
son A, Lin X, Cao C, Arendash G (2009) G-CSF reverses 1985-1992.You can also read