Title: Smartphone Camera Oximetry in an Induced
←
→
Page content transcription
If your browser does not render page correctly, please read the page content below
Title: Smartphone Camera Oximetry in an Induced
                                                          Hypoxemia Study
arXiv:2104.00038v1 [cs.LG] 31 Mar 2021

                                               Authors: Jason S. Hoffman,1∗† Varun Viswanath,2,3† Xinyi Ding,4
                                          Matthew J. Thompson,5 Eric C. Larson,4 Shwetak N. Patel,1,6 Edward Wang2,3

                                                                                                  Affiliations:
                                             1
                                                 Paul G. Allen School of Computer Science and Engineering, University of Washington
                                            2
                                                Department of Electrical and Computer Engineering, University of California San Diego
                                                                           3
                                                                         The Design Lab, University of California San Diego
                                                               4
                                                                   Department of Computer Science, Southern Methodist University
                                                                     5
                                                                         Department of Family Medicine, University of Washington
                                                      6
                                                          Department of Electrical and Computer Engineering, University of Washington

                                                ∗
                                                    To whom correspondence should be addressed; E-mail: jasonhof@cs.washington.edu.
                                                                               †
                                                                                   These authors contributed equally to this work.

                                         One Sentence Summary
                                         Smartphone-based SpO2 sensing for hypoxemia screening is demonstrated with 81% sensitivity
                                         and 79% specificity by applying deep learning to a new dataset gathered from test subjects
                                         exhibiting the full range of clinically relevant SpO2 values (70%-100%) in a varied FiO2 study.

                                                                                                        1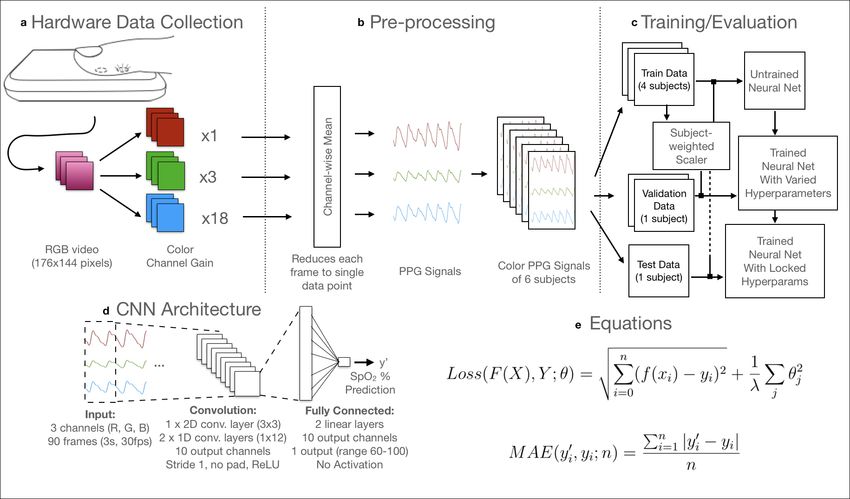
Abstract
   Hypoxemia, a medical condition that occurs when the blood is not carrying
   enough oxygen to adequately supply the tissues, is a leading indicator for dan-
   gerous complications of respiratory diseases like asthma, COPD, and COVID-
   19. While purpose-built pulse oximeters can provide accurate blood-oxygen
   saturation (SpO2 ) readings that allow for diagnosis of hypoxemia, enabling
   this capability in unmodified smartphone cameras via a software update could
   give more people access to important information about their health, as well
   as improve physicians’ ability to remotely diagnose and treat respiratory con-
   ditions. In this work, we take a step towards this goal by performing the first
   clinical development validation on a smartphone-based SpO2 sensing system
   using a varied fraction of inspired oxygen (FiO2 ) protocol, creating a clini-
   cally relevant validation dataset for solely smartphone-based methods on a
   wide range of SpO2 values (70%-100%) for the first time. This contrasts with
   previous studies, which evaluated performance on a far smaller range (85%-
   100%). We build a deep learning model using this data to demonstrate accu-
   rate reporting of SpO2 level with an overall MAE=5.00% SpO2 and identifying
   positive cases of low SpO2
Introduction
Monitoring blood-oxygen saturation (SpO2 ) with a smartphone, if enabled in an accurate and
unobtrusive manner, has the potential to improve health outcomes for those with respiratory
illnesses by enabling access to rapid risk assessment outside of face-to-face clinical settings (1).
Recent work on smartphone-based SpO2 monitors show that these devices may offer the ubiq-
uity and precision necessary to increase access to detection and monitoring of respiratory dis-
eases (2, 3). This work builds upon these prior findings by being the first to systematically
compare smartphone-based SpO2 monitoring to standalone pulse oximeters on a wide range
of clinically-relevant SpO2 values (70% ≤ SpO2 < 100%). We show the promise of a
smartphone-based system for monitoring SpO2 by training and testing a deep learning model
with data gathered using an unmodified smartphone camera and flash in a varied Fractional In-
spired Oxygen (FiO2 ) study (Fig. 1a), in which test subjects exhibit SpO2 levels in the clinically
relevant range of 70%-100% (4).
    Blood-oxygen saturation, reported as SpO2 percentage, is a clinical measure that informs
a physician of the ability of the body to distribute oxygen by revealing the proportion of
hemoglobin in the blood currently carrying oxygen. While baseline SpO2 level varies slightly
(typically 96% − 98% at sea level in otherwise healthy individuals), major deviations from
these levels can be a sign of more serious cardiopulmonary disease. Respiratory illnesses, such
as asthma, chronic obstructive pulmonary disease (COPD), pneumonia, and COVID-19, can
cause significant decreases in SpO2 , hypoxemia (low blood oxygen), and potentially hypoxia
(low tissue oxygen). Hypoxia can lead to serious complications, such as organ damage to vital
organs like the brain or kidneys, and even death, if uncorrected or occurring acutely for an ex-
tended period of time (5). Repeated measurements of SpO2 can be used to assess the severity of
a wide range of cardiopulmonary conditions such as asthma and COPD (6) and detect presence
of other illnesses including Idiopathic Pulmonary Fibrosis, Congestive Heart Failure, Diabetic
Ketoacidosis, and pulmonary embolism (7–9). 90% SpO2 has been cited as a threshold below
which in-hospital mortality rates increase in COVID-19 patients (10) and treatment adjustment
is needed for primary care patients (11).
    Blood-oxygen saturation, or SaO2 , can be directly measured from samples of arterial blood
by analyzing the blood samples using a Arterial Blood Gas (ABG) analysis device, which re-
ports the ratio of oxygenated to deoxygenated hemoglobin. However, obtaining and analyzing
arterial blood samples is invasive and can be technically difficult; therefore, it is typically limited
to intensive care or emergency cases. As a result, clinicians typically rely on the convenience
of widely available noninvasive measures of SpO2 using FDA-cleared, purpose-built devices
called pulse oximeters consisting of a finger clip and readout screen (Fig. 1b). This device al-
lows physicians to noninvasively monitor SpO2 for single (spot-check) measures or continuous

                                                  3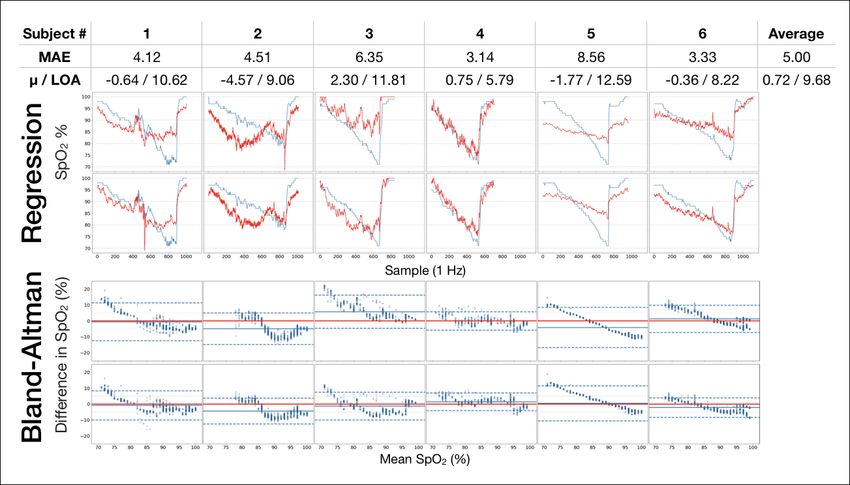
Figure 1: A smartphone was used to collect data during a varied FiO2 experiment. This
experiment produced a more balanced dataset for training our deep learning model than prior
work on breath-holding experiments. a Drawn figure of the experimental setup of the varied
FiO2 experiment conducted for this study. The subject breathes a controlled mixture of oxygen
and nitrogen to slowly lower the SpO2 level over a period of 13-19 minutes. b Light response
was recorded from two fingers on each hand. One finger was placed over a smartphone camera
with flash on to record light response via Reflectance PPG, while a second finger was placed in
the fingerclip of a transfer standard pulse oximeter, which emits Red and IR light reports SpO2
via Transmittance PPG. c Histogram of the data distribution of ground truth of samples from a
breath-holding study dataset, adapted from Ding et al. (3) and the histogram of the ground truth
distribution from our varied FiO2 experiment dataset. Our dataset contains more than 1000
samples in both ranges 65%-80% and 80%-90% SpO2 , while the example breath-holding study
has fewer than 1000 samples total below 90% SpO2 (3). This allows our deep learning model
to train and evaluate on the full range of clinically relevant SpO2 values (4). d Classification
results for the smartphone method reveal that 79% of cases of hypoxemia (defined as a low
SpO2 below 90%) were detected using this method.

                                               4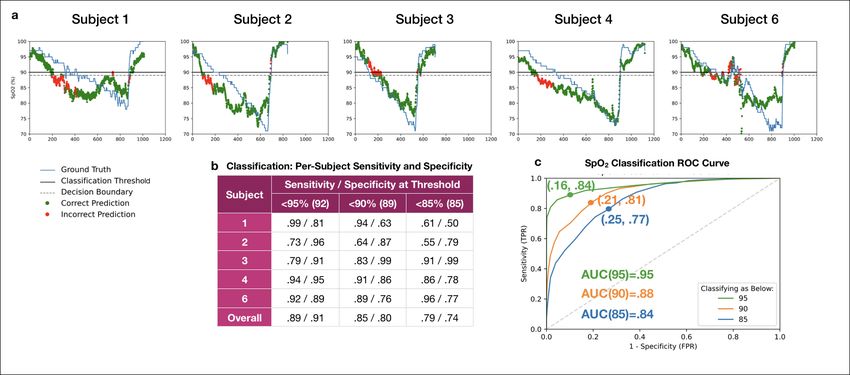
measures, if necessary to detect changes in status over time. Some patients, such as those with
COPD, use pulse oximeters in home settings to monitor the need for oxygen therapy. Pulse
oximeters typically perform oxygenation measurement via transmittance photoplethysmogra-
phy (PPG) sensing at the finger tip, clamping around the end of the finger and transmitting
red and IR light via LEDs (12). By measuring the resultant ratio of light transmittance, the
devices estimate the absorption properties of the blood, using calibrated curves based on the
Beer-Lambert Law to infer blood composition (2). While purpose-built pulse oximetry is non-
invasive and accurate across a full range of clinically relevant SpO2 levels and skin tones, it
requires a standalone device. This reduces access to SpO2 measurements, particularly among
patients at home, or by health care workers in lower or middle income countries. This gap in
access to SpO2 measurements has become more prominent during the COVID-19 pandemic,
where home (or out of hospital) monitoring of SpO2 levels has become a valuable tool in deter-
mining the need for clinical care, yet is limited by lack of widely available pulse oximeters (13).
    Smartphone-based SpO2 monitors, especially those that rely only on built-in hardware with
no modifications, present an opportunity to detect and monitor respiratory conditions in con-
texts where pulse oximeters are less available. Smartphones are widely owned because of their
multi-purpose utility, and contain increasingly powerful sensors, including a camera with a LED
flash (1, 14, 15). Due to their ubiquity, smartphones have been proposed as a decision support
tools, indicating the need for health care consultation (16, 17). Researchers have used sensors
in off-the-shelf smartphone devices to assess many physiological conditions, including detect-
ing voice disorders (18), tracking pulmonary function (18, 19), assessing infertility (16), mea-
suring hemoglobin concentration (20, 21), and estimating changes in blood pressure (22, 23).
Smartphone-based solutions for monitoring blood oxygen saturation have been explored, em-
ploying various solutions used to gather and stabilize the PPG signal, augment the IR-filtered
broad-band camera sensor, and filter the resultant signal for noise or outlier correction. Some so-
lutions require extra hardware, such as a color filter or external light source (2, 24–28), whereas
others rely only on the in-built smartphone hardware and employ software techniques to process
the PPG signal (3, 29–31). Various statistical methods have been used to interpret the results
to achieve reasonable accuracy, including the ratio-of-ratios method used by standalone pulse
oximeters (2) and deep learning (3). These prior works illustrate the potential for smartphone-
based SpO2 monitors to fill the gaps identified above, but lack validation data on a full range
of clinically relevant SpO2 levels. Prior evaluation techniques for these smartphone-based stud-
ies have been limited to a minimum of 80% SpO2 using techniques such as breath-holding,
which is limited by very short durations of data collection due to participant discomfort, lim-
iting the clinical applicability of the findings. The US Food and Drug Administration (FDA)
recommends cleared pulse oximeter devices to achieve < 3% accuracy across the full range of
clinically relevant data of 70%-100% (4, 32). To our knowledge, no prior works have thus far

                                                5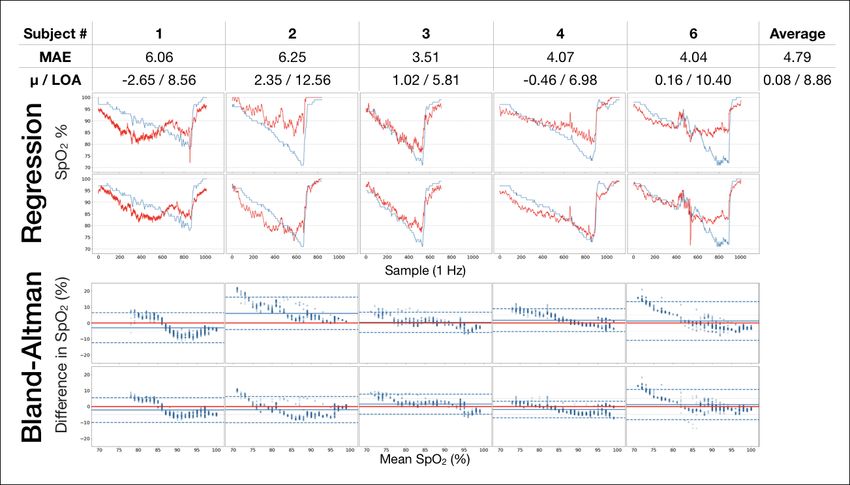
evaluated smartphone-based pulse oximetry on this range of SpO2 data.
     In order to demonstrate the accuracy of smartphone-based pulse oximetry on the full range
of clinically relevant SpO2 data, we develop and evaluate our system using a varied FiO2 pro-
tocol. This protocol, which is commonly used to validate devices in development towards FDA
clearance, requires the test subject to breathe in a combination of oxygen and nitrogen to slowly
and safely lower their SpO2 level to below 65%. During this test, we record simultaneous video
data using an unmodified smartphone camera and SpO2 ”ground truth” reference data from a
standard standalone finger clip pulse oximeter, known as a reference standard pulse oxime-
ter (33). In this way, we are able to build a labeled training data set to evaluate the performance
of our smartphone-based SpO2 measurement system across a wide range of clinically relevant
levels, and report those here for the first time. Our analysis on 6 subjects reveals that a con-
volutional neural network (CNN) model is able to achieve a Mean Average Error (MAE) of
5.00% SpO2 in predicting a new subject’s SpO2 level, after it has been trained only on other
subjects’ labeled data. To assess potential hypoxemia screening capability, we show that this
corresponds to an average sensitivity and specificity of 81% and 79% respectively in classifying
a new subject’s SpO2 as below 90%. In addition, when evaluated only on data above 85% SpO2 ,
our results show similar MAE to prior work on smartphone-based SpO2 sensing.
     Our contributions with this study are three-fold: (1) a software application and associated
deep learning model for unmodified smartphones that can report SpO2 measurements with ac-
curacy nearing that of standalone pulse oximeters across a clinically relevant range, (2) analysis
of model performance of unmodified smartphone camera oximetry as a screening tool for hy-
poxemia, and (3) a novel, open-source dataset of a varied FiO2 experiment captured using an
unmodified smartphone camera oximetry system, containing more than 10,000 labeled SpO2
sample readings from 6 subjects in the range of 61%-100%.

Results
SpO2 prediction performance Our convolutional neural network (CNN) achieved a MAE
of 5.00% SpO2 when trained and evaluated via leave-one-out cross validation (LOOCV) on the
data from the varied FiO2 study. MAE represents the difference between our model’s prediction
and the simultaneous reading of the transfer standard pulse oximeter as the ground truth in this
study. Fig. 2 shows the regression and difference analysis, using Bland-Altman analysis to
evaluate the relative accuracy of the smartphone sensing system against the reference standard
pulse oximeter. The best within-subject performance is a MAE of 3.14%, a mean difference
(µ) and Limit of Agreement (LOA) of 0.75% and 5.79% (Subject 4). The worst within-subject
performance is a MAE of 8.56%, a µ and LOA of -1.77% and 12.59% (Subject 5). The reasons
the model may have performed poorly on this subject (namely, thick skin on the fingertip) are

                                                6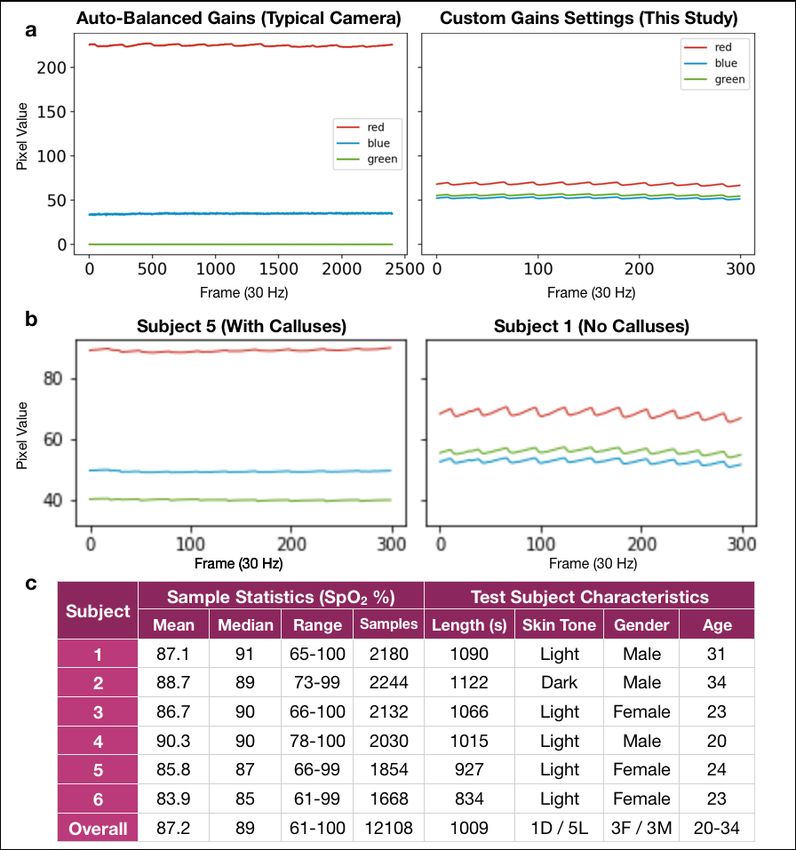
discussed in Discussion, and additional analysis of the model while excluding this subjects’
results can be viewed in the Supplementary Materials.
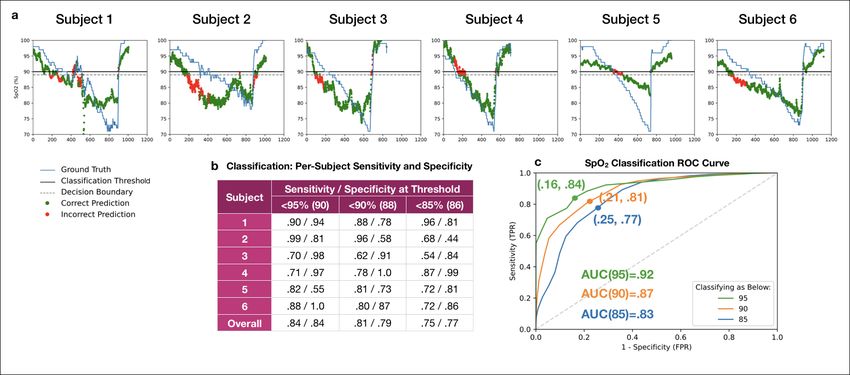
Figure 2: Regression results displayed as direct performance analysis and Bland-Altman
comparison. MAE averages to 5.00% over all 6 subjects in the study. The average difference
(µ) and limits of agreement (LOA) average to 0.72 and 9.68, which compare favorably to stan-
dalone pulse oximetry devices. Table: MAE and Bland-Altman statistics for CNN evaluation
by LOOCV for each subject (n=6) in the study. Regression: Plots of direct performance anal-
ysis of regression results. Model predictions (in red) and ground truth readings (in blue) for the
6 subjects in the FiO2 study plotted against time of study. Left hand is on top and right hand
is on bottom. Bland-Altman: Bland-Altman plots displaying the spread of predictions against
ground truth, revealing that the standalone pulse oximeter and smartphone model perform sim-
ilarly for most test subjects, with exceptions discussed in Discussion.
Bland-Altman analysis (bottom two rows of plots in Fig. 2) demonstrates the performance
of the CNN relative to the transfer standard pulse oximeter in LOOCV. The SpO2 values pre-
dicted by the learned model near the Limits of Agreement (LOA) reported in previous studies
of clinical and non-clinical pulse oximeters, while evaluating on a wider range of SpO2 lev-
els (32, 34–36). Considering that the ground truth measurements from pulse oximeters exhibit
similar variance to these results, this indicates that the model has learned features in the PPG
signal that are common across subjects and the model is not simply mean-tracking. We can also
see that for Subjects 1, 3, and 6, there is a negative trend in predictions and the mean difference
7is above the limits of agreement for some ground truth values in the range 65% - 80% SpO2 .
This tells us that the model shows a pattern of consistently over-predicting on SpO2 samples
below 80%. Notably, without the varied FiO2 study, we would not have been able to observe
the model performance below 85%, and no prior work has demonstrated that smartphone-based
sensing systems may perform poorly at this level. To better understand differences between data
ranges, we explore training and evaluating on subsets of our dataset in a data ablation study in
the following section.
Figure 3: Data ablation study. With a data ablation study, we show that our model would have
performed better if validated against breath-holding data, which typically does not include data
below 80% SpO2 . a Mean average error (MAE) of latest works in smartphone-based SpO2 sens-
ing that perform on datasets with SpO2 values in the range of 85% to 100% b When the range
of the data in our work is reduced to a similar level, we achieve comparable accuracy to prior
work. Note that Bui et al used attachments on the smartphone to enhance the photoplethysmo-
graphic signal for inference while Ding and the present work use an unmodified smartphone
camera (2, 3, 25). c Sample statistics and MAE results for this varied FiO2 study are compared
to a recent breath-holding study using smartphone cameras and deep learning (3).
Data ablation To understand how the accuracy of our model compares to previously pub-
lished smartphone-based pulse oximetry systems, we study how excluding subsets of the dataset
affects the accuracy. Due to the larger range evaluated in this study compared to prior studies,
the overall MAE is not as low as prior studies. However, a data ablation study reveals that, as
lower subsets of the data are removed, the accuracy of our model nears that of other published
work. Notably, none of these proof-of-concept works were evaluated on data where a statis-
tically significant portion of the SpO2 evaluation data was below 85%, whereas in our varied
FiO2 dataset, the minimum SpO2 value included is 70% and the mean of all ground truth SpO2
levels is 87.1% (See Fig. 1c).
8We train and evaluate our machine learning models against a similar dataset to these proof-
of-concept works using a data ablation technique. We first subsample our dataset so that we only
include samples with ground truth SpO2 above a floor threshold. We then retrain and evaluate
our models to calculate a sub-sampled MAE. Varying across possible thresholds, we observe a
negative linear correlation between the minimum SpO2 value included and the resultant mean
absolute error, as can be seen in Fig. 3a. That is, as we reduce the range of SpO2 values in our
training and testing dataset, our models perform more accurately. To directly compare to the
performance of prior work from Ding et al. and Bui et al. (shown on Fig. 3b), we set a SpO2
threshold of 85%. While Ding et al. report a range of 73%-100%, their dataset shows that only
.6% of all samples are below 85%, so we report this as a practical floor of 85% for comparison
purposes. At a floor SpO2 value of 85%, our model performs nearly as well as prior work with
a mean absolute error of 3.06%. With this analysis, we can be confident that our techniques are
at least as reliable as prior works, and likely benefit from the larger range of training examples.
Classification of hypoxemia Rather than simply inferring an estimate for SpO2 , a smartphone-
based tool could be valuable for detecting low SpO2 , indicating whether or not further medical
attention is needed. To explore the potential of using an unmodified smartphone camera oxime-
ter system as a screening tool for hypoxemia, we calculated the classification accuracy of our
model in providing an indication of whether an individual has an SpO2 level below three dif-
ferent thresholds: 95%, 90%, and 85%. A pulse oximetry value below 90% SpO2 is a common
threshold used to indicate the need for medical attention (11), but other thresholds could be
valuable clinically. Thus, we evaluate the ability of our system to classify samples from our
test set by thresholding the regression result from our CNN at different decision boundaries and
comparing it to whether the ground truth pulse oximeter simultaneously reports less than the
threshold value. We compute sensitivity (true positive rate) and specificity (true negative rate)
across all combinations of LOOCV to compute an average result. This experiment simulates
the scenario where a smartphone screens a subject it has never seen before, as the model was
trained only on 4 other subjects from the dataset.
The results of this classification analysis can be seen in Fig 4. For classifying SpO2Figure 4: Classification results for the system. a Classifications overlaid on ground truth
for each subject with a 90% classification threshold and 88% decision boundary. b Summary
statistics for classification across subjects shows that classification performed better on certain
patients, and overall achieved a 81% sensitivity and 79% specificity rate at sensing whether a
subject fell below a 90 % SpO2 level c ROC curves for the classification of low SpO2 , produced
by thresholding the regression model. Classification accuracy decreases as the classification
goal is shifted lower, from 95% to 90% to 85%. The classification decision boundary was
varied to produce curves for all 3 classification goals, with each point plotted as the average
test classification False Positive Rate and True Positive Rate for all LOOCV combinations. The
points that are labeled on each curve are those closest to (0,1) for each classification threshold.
The Area Under the Curve (AUC) is .87 for the 90% threshold SpO2 level classification.
10classification threshold, the highest accuracy (defined as the closest point to (0,1) on the ROC curve) occurred when the classification decision boundary was set to 88% SpO2 . For clinical value, it may be preferable to choose a threshold that prioritizes sensitivity over specificity, par- ticularly for home settings, so that individuals with low SpO2 cases would be identified at the expense of over-diagnosis. For example, choosing a decision boundary of 90% on the regression result for the SpO2
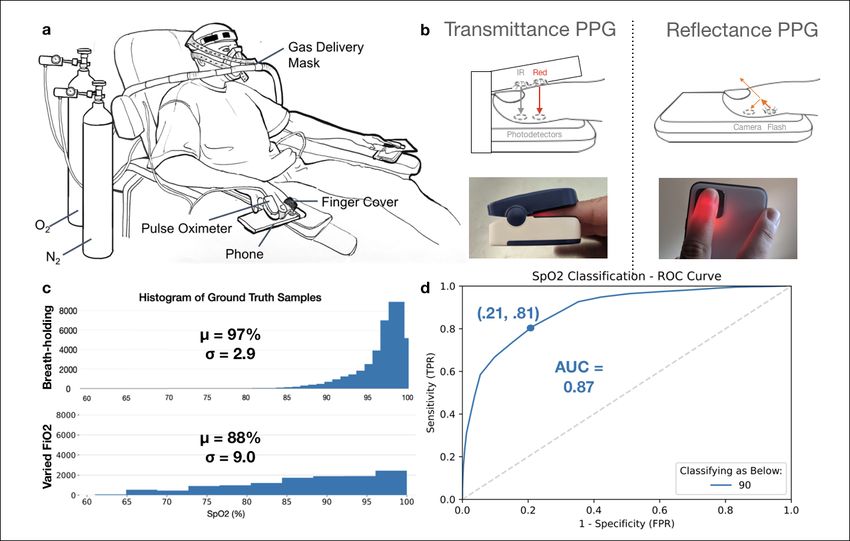
Figure 5: Signal extraction and deep learning pipeline a PPG signal extraction occurs af-
ter collecting video data from the smartphone camera, applying empirically determined per-
channel gains to ensure that each channel is within a usable range (no clipping or saturating).
Gains for the R, G, and B channels were empirically determined and held constant through-
out all subjects to avoid clipping or biasing towards one channel. b Pre-processing of the data
computes the PPG signal for each channel as the average pixel value across each frame over
time our system. The mean of each channel value across each frame was used as the input for
the models. c Training and evaluation was performed using Leave-One-Out Cross-Validation
(LOOCV) by using 4 subjects’ data as the training set, one subject’s data as the validation set
for optimizing the model, and then evaluating the trained model on one test subject. d The
deep learning model is constructed of 3 convolutional layers and 2 linear layers operating on
the input of 3 seconds of RGB video data (90 frames for 3s at 30fps). The output is a prediction
of the current blood-oxygen saturation (SpO2 %) of the individual, which was evaluated using
Mean Average Error (MAE) compared to the ground truth standalone pulse oximeter reading.
e Equations for Loss and MAE that were used in training and evaluating the model.

if more training samples were gathered from further varied FiO2 experiments, representing a
larger range of potential users of the system.
    Signal processing and more advanced fine-tuning may improve model performance further,
as well as simply gathering more data. PPG signal noise originating from the wide-band light
source and multi-purpose camera sensor of a smartphone likely reduce accuracy. Both prior

                                              12
work and physiological intuition support this theory. Bui et al. suggests that data collected
with an unfiltered light source results in a noisy signal that should be modeled with a nonlinear
function approximator (2). Ding et al. filter the PPG signal to remove noise sources, such as user
movement, before feeding the signal to their CNN (3). While we do not filter our data prior to
the CNN, our choice to use a relatively simple neural network architecture with few parameters
can be interpreted as a form of regularization that reduces the likelihood of over-fitting. These
observations suggest that strong regularization or filtering is important for models predicting
SpO2 from data collected with a smartphone light source and camera. Overall, though, work
in computer vision (39) and natural language processing (40) have shown the effectiveness of
collecting higher quality datasets for machine learning. To build a robust model for smartphone-
based SpO2 sensing, a large and broadly collected dataset may be the best way to prevent signal
noise from adversely affecting predictions.
In addition, classification machine learning models may improve the classification results.
The only type of machine learning model we tested were in the category of regression algo-
rithms. Our classification study involved thresholding the result of the regressor. While that
method worked relatively well, producing an AUC of .87 for 90% classification, we believe
that even better classification could be achieved via a classifier model. Improved classification
accuracy would result in enhanced utility as a screening tool, improving the rate at which the
sensing system correctly reveals information that allows individuals to seek further care.
Camera color channel settings For this study, camera settings were locked during data gath-
ering by presetting auto-balancing and manually enhancing color gain, which are unique steps
in our data collection system relative to prior works in this area. Camera image capture is vari-
ably exposed based on three factors: exposure time, sensor sensitivity, and aperture. For RGB
cameras used in smartphones, all three color channels typically use the same exposure time and
aperture settings. Both oxygenated and deoxygenated hemoglobin have a significantly higher
absorption coefficient in the blue and green wavelengths than for the red wavelengths by about
two orders of magnitude. Thus, it would not be possible to measure all three wavelengths simul-
taneously under the same exposure. If the hardware sensor’s sensitivity to a particular color is
too high or too low, pixel values for that color may clip by recording the minimum or maximum
value of 0 or 255. Because phones use an 8-bit precision scheme for storing pixel data, the
pixels will all be rounded to 0 and small changes in that color will be lost. In our application,
red is the most dominant color, and prior work has shown that with the use of white balance
presets for incandescent light, the tones between blue and green can be amplified (26).
Software advancements in smartphone image processing pipelines now provide more inde-
pendent control of each color channel’s exposure through independent per-channel amplifier
gain settings. By having control of independent amplifier gain settings, we can balance the
13exposure settings to amplify the blue and green channels. Different operating systems allow
for a different granularity in the gain control settings. Our work was enabled with the Android
Camera2 API, which provides access to manual setting of sensitivity, exposure, and individual
color gains. Therefore, to ensure that the blue and green signals are not lost, we empirically
determined and assigned a fixed color gain in our application, ensuring that a usable signal
is recorded by the camera for all 3 channels. We empirically determined and used the gains
(1,3,18) for R, G, and B (See Fig 5a). After we set the color channel, we determined through
the same study the use of 1.2ms for exposure time and a sensor sensitivity of 300 ISO performed
well in evenly exposing R,G, and B color channel PPG signals at the middle of the 0-255 value
range. The impact of this on the RGB signal is shown in Figure 6a. With auto-balancing, the
red PPG clips fall at the top of the 0-255 range of RGB lumen values, while the green channel
falls to close to 0. In comparison, using custom hardware gain settings in this study, controlled
through the Android Camera2 API, allowed all three color channel PPGs to be well-represented
in the 8 bit range and display differentiable AC signal amplitude.
Skin tissue aberrations We see particularly aberrant performance on subject 5 with MAE=8.56.
We suspect this is due to exacerbated tissue noise on the subject’s fingers from thickened skin,
which is not represented in the rest of the training data. This subject was noted to be the only
subject in the study with noticeable calluses on their fingertips, and the subject indicated this
was due to sports. We investigate the data obtained from this subject more closely in Fig. 6b
and observe that the PPG signals for subject 5 show nearly 50% dampened oscillations (AC sig-
nal component), quantified by a standard deviation of 3.44 compared to 6.86, and 50% higher
average value (DC signal component), quantified by a mean of 84.5 compared to 51.5, rela-
tive to other subjects. We hypothesize that these abnormal features are a result of the calluses.
Specifically, an abnormally thick layer of tissue on the finger would absorb more light in the
blue and green spectra. Because our device’s sensor has fixed sensitivity, the abnormally atten-
uated light in the blue and green spectra results in poor measurement of the pulsatile blood and
altered spread in color channel values. With a small training set of 4 subjects including no other
examples of subjects with fingertip calluses, the model cannot learn to account for these tissue
differences. We anticipate the model could learn to account for tissue abnormalities if trained
on more subjects, if adaptive gain settings were employed to gather data that ensured a similar
oscillation amplitude in the AC signal for the input data collected by the smartphone.
Limitations From this limited dataset, we are unable to make definitive conclusions regarding
the effect of skin tone or gender on smartphone pulse oximetry. Our test subjects included 1
subject with a dark skin tone (subject 2 identified as African-American) and 5 subjects with a
light skin tone (all other subjects identified as Caucasian), as seen in Fig. 6c. Our model does
14Figure 6: Analysis of collected data. Visualization of PPG data, derived from smartphone
videos, reveal the effects of camera gains settings and skin tissue differences on the input sig-
nal for our deep learning model. a PPG signal using auto-balance (3) vs custom empirically
determined gain settings (this study). In the left image, the green channel is clipped so that the
dynamic range becomes so low that the AC variation in the signal cannot be observed. In the
right image, the pulsation is visible in all three channels. This shows how standard smartphone
camera settings, designed for photography, can reduce the information available to smartphone-
based systems for accurate SpO2 sensing. b Skin tissue aberrations (such as calluses seen in
Subject 1’s fingers) can affect the quality of data available for SpO2 sensing. At left, the raw
data in the red, blue, and green channels for Subject 5 are dampened and the AC portion of the
signal cannot be observed at a resolution of 300 frames. At right, the AC portion can be clearly
seen for Subject 2 at the same resolution. This abnormality is likely due to Subject 5’s callused
tissue on the fingers. c Subject breakdown for the FiO2 study and ground truth data statistics (in
SpO2 %) for each subject. The average difference between mean and median for each subject is
1.58, showing minimal skew. The average length of each subject’s test run is about 16 minutes.
15not appear to perform differently based on skin tone with this limited dataset, as the results for
subject 2 fell in a similar range as other subjects, as seen in Fig. 2. However, it has been shown
that standalone pulse oximeters, such as the one used as the ground truth in our dataset, can
produce decreased accuracy on patients with darker skin tones (41). Based on our study, we do
not claim any findings that our model works better or worse based on skin tone, but that should
be evaluated in future studies. Our model also does not perform differently on either side of our
3:3 female:male gender split. Analyzing performance of our model to users of different skin
tones and genders is important, but will require further work to understand.
This work on smartphone camera oximetry locks exposure settings rather than allowing the
phone to auto-balance. Other research published around smartphone camera oximetry have re-
lied on phone auto-balancing features and out of the box white-balancing algorithms. We made
the design choice to appropriate the phone sensors to act much more like a simple sensor system
that doesn’t automatically adjust in software; however, when we examine the performance that
has been achieved in our data ablation study, it may be the case that both methods are sound
approaches. Our study does not help to elucidate whether auto-balancing would work well at
lower ranges; therefore, it would be useful to perform a similar study for auto-balancing based
camera oximetry systems.
In this study, we did not analyze signal filtering for motion artifacts. While other recent
works employ signal processing methods for removing noisy data points (2, 3), such as finger
slippages or shaking (as is common in breath-holding experiments), the controlled design of
the experiment allows the finger to stay relatively stable and consistently coupled to the sensor,
as compared to breath-holding experiments. However, in any future screening tool, it will be
important in real-world use to detect excessive motion, provide feedback to the user to keep
still, and discard high motion segments (42). Combining our methods with signal processing
techniques studied in prior works may improve results in clinical and outpatient use.
Study Expansion Informing directions for future work in this area, we note that our study
size was limited due to the cost of running a FiO2 study, which is approximately $8,000 for
the 6 subject tested. While we can speculate that this prediction task becomes more difficult
at lower SpO2 ranges based on our Bland-Altman statistics in Fig. 3, we need to collect more
data in the 70% to 85% range to better understand why this happens. It is still important to
note that this finding of diminished performance at lower than 85% oxygen saturation is a core
contribution of this work as the first published study (to our knowledge) to test smartphone
camera oximetry in an induced hypoxemia study on the full range of clinically relevant data.
Furthermore, the study we presented uses a transfer standard method of validation using
optical pulse oximeters as the ground truth gold standard reference. FDA clearance of new
pulse oximetry devices requires a full human desaturation study, including regular blood draws
16for co-oximetry validation against an ABG ground truth (4). Because that test is more expensive
(>$20,000) and invasive, it is common to perform a transfer standard pulse oximeter-based
study, such as the one performed in this study, during development of a new device prior to a
full human desaturation study (33). After more development and validation using this transfer
standard method, a full human desaturation study could be warranted.
Conclusion Our results, in this pilot study of 6 subjects, provide a positive indication that a
smartphone could be used to assess risk of hypoxemia without the addition of extra hardware.
In order to validate and enable this in the future, we would recommend gathering more data with
a smartphone in varied FiO2 studies that induce hypoxemia to increase the training data and the
accuracy of the deep learning model. With an improved model, we could set up user studies in
which the app is used in conjunction with a standalone pulse oximeter to measure the accuracy
of the software-based solution in real-world scenarios. We would also like to see what others
in the community can do with the open-source FiO2 data that we are providing alongside this
paper. More development and testing could allow this tool to become beneficial for low-cost
clinical management of individuals with chronic respiratory conditions, such as COPD, as well
as acute respiratory diseases like COVID-19.
Materials and Methods
Study Design 6 healthy test subjects were recruited and enrolled to participate in a varied
FiO2 study to evaluate the efficacy of using unmodified smartphone cameras in pulse oxime-
try. The varied FiO2 study was performed using the varied fractional inspired oxygen protocol
administered by a clinical validation laboratory, Clinimark, which is a group that performs
validation services for medical devices (33). This experiment was approved by the Internal
Review Board at Clinimark. Consent for each participant was obtained prior to commencing
the test procedure. Six subjects were administered controlled fractional mixtures of medical
grade oxygen-nitrogen in a controlled hospital setting for 14-19 minutes. The subjects rested
comfortably in a reclined position while the gas mixture was given to induce hypoxemia in a
stair-stepped manner. During this time, the subjects’ fingers were instrumented with multiple
transmittance pulse oximeter clips and two smartphone devices, with the smartphone device
on the index finger of each hand. The ground truth data was recorded using multiple purpose-
built pulse oximeters, including a tight-tolerance transfer standard pulse oximeter, the Masimo
Radical-7 (43). Subject characteristics and data statistics can be seen in Fig. 6c. Subject obser-
vations were recorded, including the observation that one subject, Subject 5 in the analysis, had
particularly callused hands.
17Smartphone Device Configuration and Setup We collected camera oximetry data with a
Google Nexus 6P, recording video at 30 frames per second in a custom video capture applica-
tion developed in Java using Android Studio. The device was specifically configured so that
camera exposure settings in the camera hardware did not change throughout the entire study.
Color gains were set to 1x for the red channel, 3x for the green channel, and 18x for the blue
channel. These gains were chosen empirically by manually analyzing the impact of gain value
adjustments on 20 healthy individuals to find gain values that avoided data loss due to compres-
sion and obtained optimal signal quality (see Fig. 6a). During the varied FiO2 study, because
the device could overheat from recording continuous video with flash enabled for more than 1
minute, we placed clay ice packs around the device to keep its temperature down for the 14-19
minute duration of the study. The ice packs were placed strategically to avoid contact with the
hand.
Data pre-processing For each hand on each subject, we recorded an ordered list of n RGB
image frames, each with 176 × 144 pixels. To obtain a PPG signal, we computed the mean pixel
value for each color channel and obtained a 3 × n-shaped matrix of values. Each hand of each
subject is treated as a unique subject in the display of results. We divide the data into samples
for each 1-second (30 frames) window, combining the 3 seconds (90 frames) of sample RGB
data centered on 1 ground truth SpO2 reading as one sample. This provides over 8000 training
examples (4 subjects) to our models, with about 2000 samples (1 subject) held out for both the
cross-validation and test set for each configuration of LOOCV. Samples under 70% SpO2 are
removed prior to training and validation due to the sparsity of samples in that range.
Convolutional neural network We applied a CNN machine learning model, detailed in Fig.
5. We designed and trained a network with three convolutional layers followed by two fully
connected layers. For the first convolution, we treat the RGB channel components of our signals
as a second dimension and use kernel sizes of 3 × 3 with no padding. We normalize and
standardize both training and validation datasets based on a weighted channel-wise mean and
standard deviation of the training dataset, where the weights are scaled by the length each
subject’s data collection. The model is trained using the Adam optimizer with a learning rate of
0.00001 (with a rate decay by 0.1 after 80 epochs) and an L2 regularization of strength 0.1. We
optimize Mean Squared Error (MSE) as our loss function and report the accuracy of the results
by computing the MAE (Fig 5e). The model is built and trained using the PyTorch library.
Statistical analysis We identified and evaluated two potential usage scenarios for a software-
based oximetry solution on a standalone smartphone: (1) as a replacement for traditional pulse
oximeters by regressing a continuous SpO2 value, and (2) as an at-home screening tool to inform
18the need for a follow-up with a physician by classifying regression results as below a particular
threshold.
We explored the first scenario of pulse oximetry measurement by performing a regression
analysis, comparing our smartphone measurement to a purpose-built pulse oximeter with er-
ror and Bland-Altman metrics. In our performance assessment, we evaluated models using
Leave-One-Subject-Out cross validation (LOOCV). Specifically, we trained and tested on six
validation splits, with two different subjects (both hands) held out for cross-validation and test-
ing in each split. We visually examined the ground truth distributions of the splits to ensure
there was not a heavy imbalance in the dataset. We compared the performance of algorithms
using Mean Absolute Error.
We explored the second scenario of hypoxemia screening by performing a classification
analysis, thresholding the ground truth recordings below 3 different SpO2 levels (95%, 90%,
and 85%) and comparing it to our thresholded regression result. We examined the true posi-
tive (sensitivity) and true negative (specificity) rates at different screening decision boundaries
(95%, 90%, and 85%) to illustrate the potential performance of the system for use in hypoxemia
screening. To interrogate the potential to adjust this decision boundary to bias towards sensitiv-
ity or specificity, we varied the decision boundary across the range of 70%-100% and plotted
ROC curves for each subject using LOOCV.
Data Availability We provide the data from the varied FiO2 study in open source format to
the community to allow others to build upon this work.
List of Supplementary Materials
1. Fig. S1 Regression Results After Removing 1 Subject
2. Fig S2. Classification Results After Removing 1 Subject
3. Data file S1. Zip file of raw camera oximetry data
References and Notes
References
1. S. R. Steinhubl, E. D. Muse, E. J. Topol, The emerging field of mobile health, Science
translational medicine 7, 283rv3 (2015).
192. N. Bui, A. Nguyen, P. Nguyen, H. Truong, A. Ashok, T. Dinh, R. Deterding, T. Vu,
Smartphone-based spo2 measurement by exploiting wavelengths separation and chro-
mophore compensation, ACM Transactions on Sensor Networks (TOSN) 16, 1 (2020).
3. X. Ding, D. Nassehi, E. C. Larson, Measuring oxygen saturation with smartphone cameras
using convolutional neural networks, IEEE journal of biomedical and health informatics
23, 2603 (2018).
4. U. Food, D. Administration, et al., Pulse oximeters—premarket notification submissions
[510 (k) s]: guidance for industry and food and drug administration staff, US Department
of Health and Human Services (2013).
5. P. E. Bickler, J. R. Feiner, M. S. Lipnick, P. Batchelder, D. B. MacLeod, J. W. Severinghaus,
Effects of acute, profound hypoxia on healthy humans: implications for safety of tests
evaluating pulse oximetry or tissue oximetry performance, Anesthesia & Analgesia 124,
146 (2017).
6. T. Siddiqui, B. I. Morshed, Severity classification of chronic obstructive pulmonary disease
and asthma with heart rate and spo2 sensors, 2018 40th Annual International Conference of
the IEEE Engineering in Medicine and Biology Society (EMBC) (IEEE, 2018), pp. 2929–
2932.
7. V. Wilson, Diagnosis and treatment of diabetic ketoacidosis, Emergency Nurse 20 (2012).
8. J. A. Kline, J. Hernandez-Nino, C. D. Newgard, D. N. Cowles, R. E. Jackson, D. M. Court-
ney, Use of pulse oximetry to predict in-hospital complications in normotensive patients
with pulmonary embolism, The American journal of medicine 115, 203 (2003).
9. D. A. Zisman, D. J. Ross, J. A. Belperio, R. Saggar, J. P. Lynch III, A. Ardehali, A. S.
Karlamangla, Prediction of pulmonary hypertension in idiopathic pulmonary fibrosis, Res-
piratory medicine 101, 2153 (2007).
10. J. Xie, N. Covassin, Z. Fan, P. Singh, W. Gao, G. Li, T. Kara, V. K. Somers, Associa-
tion between hypoxemia and mortality in patients with covid-19, Mayo Clinic Proceedings
(Elsevier, 2020).
11. K. Jones, P. Cassidy, J. Killen, H. Ellis, The feasibility and usefulness of oximetry mea-
surements in primary care, Primary Care Respiratory Journal 12, 4 (2003).
12. J. Welch, R. DeCesare, D. Hess, Pulse oximetry: instrumentation and clinical applications,
Respir Care 35, 584 (1990).
2013. J. Teo, Early detection of silent hypoxia in covid-19 pneumonia using smartphone pulse
oximetry, Journal of medical systems 44, 1 (2020).
14. S. S. Gambhir, T. J. Ge, O. Vermesh, R. Spitler, Toward achieving precision health, Science
translational medicine 10 (2018).
15. E. J. Topol, A decade of digital medicine innovation, Science translational medicine 11
(2019).
16. M. K. Kanakasabapathy, M. Sadasivam, A. Singh, C. Preston, P. Thirumalaraju,
M. Venkataraman, C. L. Bormann, M. S. Draz, J. C. Petrozza, H. Shafiee, An automated
smartphone-based diagnostic assay for point-of-care semen analysis, Science translational
medicine 9, eaai7863 (2017).
17. T. Laksanasopin, T. W. Guo, S. Nayak, A. A. Sridhara, S. Xie, O. O. Olowookere, P. Cadinu,
F. Meng, N. H. Chee, J. Kim, et al., A smartphone dongle for diagnosis of infectious
diseases at the point of care, Science translational medicine 7, 273re1 (2015).
18. D. D. Mehta, M. Zanartu, S. W. Feng, H. A. Cheyne II, R. E. Hillman, Mobile voice
health monitoring using a wearable accelerometer sensor and a smartphone platform, IEEE
Transactions on Biomedical Engineering 59, 3090 (2012).
19. E. C. Larson, M. Goel, G. Boriello, S. Heltshe, M. Rosenfeld, S. N. Patel, Spirosmart:
using a microphone to measure lung function on a mobile phone, Proceedings of the 2012
ACM conference on ubiquitous computing (2012), pp. 280–289.
20. R. G. Mannino, D. R. Myers, E. A. Tyburski, C. Caruso, J. Boudreaux, T. Leong, G. Clif-
ford, W. A. Lam, Smartphone app for non-invasive detection of anemia using only patient-
sourced photos, Nature communications 9, 1 (2018).
21. E. J. Wang, W. Li, J. Zhu, R. Rana, S. N. Patel, Noninvasive hemoglobin measurement using
unmodified smartphone camera and white flash, 2017 39th Annual International Confer-
ence of the IEEE Engineering in Medicine and Biology Society (EMBC) (IEEE, 2017), pp.
2333–2336.
22. E. J. Wang, J. Zhu, M. Jain, T.-J. Lee, E. Saba, L. Nachman, S. N. Patel, Seismo: Blood
pressure monitoring using built-in smartphone accelerometer and camera, Proceedings of
the 2018 CHI Conference on Human Factors in Computing Systems (2018), pp. 1–9.
23. V. Chandrasekaran, R. Dantu, S. Jonnada, S. Thiyagaraja, K. P. Subbu, Cuffless differential
blood pressure estimation using smart phones, IEEE Transactions on Biomedical Engineer-
ing 60, 1080 (2012).
2124. Y. Mendelson, B. D. Ochs, Noninvasive pulse oximetry utilizing skin reflectance photo-
plethysmography, IEEE Transactions on Biomedical Engineering 35, 798 (1988).
25. D. L. Carni, D. Grimaldi, P. F. Sciammarella, F. Lamonaca, V. Spagnuolo, Setting-up of ppg
scaling factors for spo2% evaluation by smartphone, 2016 IEEE International Symposium
on Medical Measurements and Applications (MeMeA) (IEEE, 2016), pp. 1–5.
26. W. Karlen, J. M. Ansermino, G. A. Dumont, C. Scheffer, Detection of the optimal region
of interest for camera oximetry, 2013 35th Annual International Conference of the IEEE
Engineering in Medicine and Biology Society (EMBC) (IEEE, 2013), pp. 2263–2266.
27. İ. Tayfur, M. A. Afacan, Reliability of smartphone measurements of vital parameters: A
prospective study using a reference method, The American journal of emergency medicine
37, 1527 (2019).
28. C. G. Scully, J. Lee, J. Meyer, A. M. Gorbach, D. Granquist-Fraser, Y. Mendelson, K. H.
Chon, Physiological parameter monitoring from optical recordings with a mobile phone,
IEEE Transactions on Biomedical Engineering 59, 303 (2011).
29. S. Tomlinson, S. Behrmann, J. Cranford, M. Louie, A. Hashikawa, Accuracy of
smartphone-based pulse oximetry compared with hospital-grade pulse oximetry in healthy
children, Telemedicine and e-Health 24, 527 (2018).
30. A. Nemcova, I. Jordanova, M. Varecka, R. Smisek, L. Marsanova, L. Smital, M. Vitek,
Monitoring of heart rate, blood oxygen saturation, and blood pressure using a smartphone,
Biomedical Signal Processing and Control 59, 101928 (2020).
31. F. Lamonaca, D. L. Carnı̀, D. Grimaldi, A. Nastro, M. Riccio, V. Spagnolo, Blood oxygen
saturation measurement by smartphone camera, 2015 IEEE International Symposium on
Medical Measurements and Applications (MeMeA) Proceedings (IEEE, 2015), pp. 359–
364.
32. A. M. Luks, E. R. Swenson, Pulse oximetry for monitoring patients with covid-19 at home.
potential pitfalls and practical guidance, Annals of the American Thoracic Society 17, 1040
(2020).
33. Clinimark, Pulse Oximetry Product Development Testing (2010 (accessed August 9,
2020)). http://www.clinimark.com/TABS%20Testing%20&%20Services/
Pulse%20Oximetry/Pulse%20Oximetry_Product%20Development%
20Testing.html.
2234. A.-M. Kelly, R. McAlpine, E. Kyle, How accurate are pulse oximeters in patients with
acute exacerbations of chronic obstructive airways disease?, Respiratory medicine 95, 336
(2001).
35. X. Muñoz, F. Torres, G. Sampol, J. Rios, S. Martı́, E. Escrich, Accuracy and reliability of
pulse oximetry at different arterial carbon dioxide pressure levels, European Respiratory
Journal 32, 1053 (2008).
36. M. S. Lipnick, J. R. Feiner, P. Au, M. Bernstein, P. E. Bickler, The accuracy of 6 inexpensive
pulse oximeters not cleared by the food and drug administration: the possible global public
health implications, Anesthesia & Analgesia 123, 338 (2016).
37. T. B. Jordan, C. L. Meyers, W. A. Schrading, J. P. Donnelly, The utility of iphone oximetry
apps: a comparison with standard pulse oximetry measurement in the emergency depart-
ment, The American journal of emergency medicine 38, 925 (2020).
38. digiDoc Technologies, Pulse Oximeter Application (2013 (accessed August 10, 2020)).
https://www.digidoctech.no/products-1.html.
39. J. Deng, W. Dong, R. Socher, L. Li, K. Li, L. Fei-Fei, Imagenet: A large-scale hierarchical
image database, 2009 IEEE Conference on Computer Vision and Pattern Recognition pp.
248–255 (2009).
40. T. Brown, et al., Language models are few-shot learners, ArXiv abs/2005.14165 (2020).
41. J. R. Feiner, J. W. Severinghaus, P. E. Bickler, Dark skin decreases the accuracy of pulse
oximeters at low oxygen saturation: the effects of oximeter probe type and gender, Anes-
thesia & Analgesia 105, S18 (2007).
42. M. T. Petterson, V. L. Begnoche, J. M. Graybeal, The effect of motion on pulse oximetry
and its clinical significance, Anesthesia & Analgesia 105, S78 (2007).
43. Masimo, Masimo Radical-7 (2020 (accessed August 10, 2020)). https://www.
masimo.com/products/continuous/radical-7/.
Acknowledgments: The authors thank Clinimark for conducting the study. Funding: Uni-
versity of Washington gift funding supported the study. Author contributions: EJW and SNP
designed the study. EJW built the smartphone application and collected data. JSH and VV built
the machine learning model. ECL and XD collected comparison data and advised on study
design. JSH, VV, and EJW wrote the manuscript. All coauthors edited the manuscript. Com-
peting interests: JSH, SNP, EJW, and VV are inventors of US patent application 17/164,745
23covering systems and methods for SpO2 classification using smartphones. Data and materials
availability: All data associated with this study are available in the main text or the supplemen-
tary materials.
24Supplementary Materials
Fig. S1 Regression Results After Removing 1 Subject
Figure 7: Regression results with one subject’s data removed from the model, displayed as
direct performance analysis and Bland-Altman comparison. Mean Average Error (MAE)
averages to 4.79 over 5 subjects after subject 5 is removed from the model training and vali-
dation. The average difference (µ) and limits of agreement (LOA) average to 0.08 and 8.86,
which compare favorably to standalone pulse oximetry devices (34). Table: Mean Average Er-
ror (MAE) and Bland-Altman statistics for CNN evaluation by LOOCV for these subjects (n=5).
Regression: Plots of direct performance analysis of regression results. Model predictions (in
blue) and ground truth readings (in red) for the 6 subjects in the FiO2 study plotted against
time of study. Left hand is on top and right hand is on bottom. Bland-Altman: Bland-Altman
plots displaying the spread of predictions against ground truth, revealing that the standalone
pulse oximeter and smartphone model perform similarly, and more closely aligned when the
one subject with calluses is removed from the analysis.
25Fig S2. Classification Results After Removing 1 Subject
Figure 8: Classification results for the system with 1 subject’s data removed. a Classi-
fications overlaid on ground truth for each subject with a 90% threshold and 89% decision
boundary. b Summary statistics for classification across subjects shows that classification per-
formed better on certain patients, and overall achieved a 85% sensitivity and 80% specificity
rate at sensing whether a subject fell below a 90 % SpO2 level c ROC curves for the classi-
fication of low SpO2 , produced by thresholding the regression model. Classification accuracy
decreases as the classification goal is shifted lower, from 95% down to 85%. The classification
decision boundary was varied to produce curves for all 3 classification goals, with each point
plotted as the average test classification false positive rate and true positive rate for all LOOCV
combinations. The points that are labeled on each curve are the closest to (0,1).
Data file S1. Zip file of raw camera oximetry data
A zip file of raw data from the FiO2 study will be shared after peer review and publication.
26You can also read