R 373 - Questioni di Economia e Finanza (Occasional Papers) - Banca d'Italia
←
→
Page content transcription
If your browser does not render page correctly, please read the page content below
Questioni di Economia e Finanza
                (Occasional Papers)

                Cyber attacks: preliminary evidence
                from the Bank of Italy’s business surveys

                by Claudia Biancotti
February 2017

                                                                     373
                                                            Number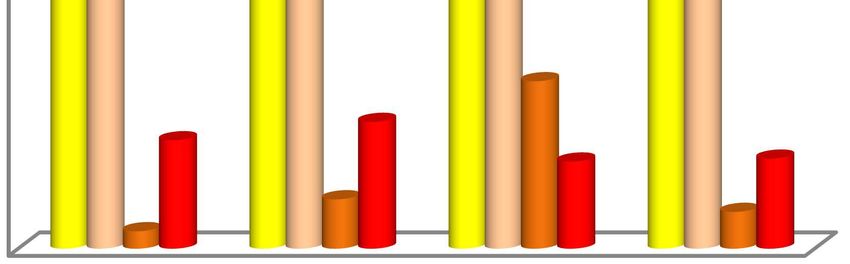
Questioni di Economia e Finanza
(Occasional papers)

Cyber attacks: preliminary evidence
from the Bank of Italy's business surveys

by Claudia Biancotti

Number 373 – February 2017
The series Occasional Papers presents studies and documents on issues pertaining to
the institutional tasks of the Bank of Italy and the Eurosystem. The Occasional Papers appear
alongside the Working Papers series which are specifically aimed at providing original contributions
to economic research.

                 The Occasional Papers include studies conducted within the Bank of Italy, sometimes
in cooperation with the Eurosystem or other institutions. The views expressed in the studies are those of
the authors and do not involve the responsibility of the institutions to which they belong.

                 The series is available online at www.bancaditalia.it .

ISSN 1972-6627 (print)
ISSN 1972-6643 (online)

Printed by the Printing and Publishing Division of the Bank of Italy
CYBER ATTACKS: PRELIMINARY EVIDENCE FROM THE
BANK OF ITALY’S BUSINESS SURVEYS
by Claudia Biancotti*
Abstract
This paper presents preliminary evidence on cyber risk in the Italian private sector
based on the Bank of Italy’s annual surveys of Italian industrial and service firms. The
information collected, albeit only covering the incidence of cyber attacks and some aspects of
security governance, is the first of its kind for Italy. The results are striking: even though a
mere 1.5 per cent of businesses do not deploy any cybersecurity measures, 30.3 per cent –
corresponding to 35.6 per cent of total employees – report at least some damage from a cyber
attack between September 2015 and September 2016. Once data are corrected to account for
unwillingness to report or inability to detect attacks on the part of some respondents, these
figures climb to 45.2 and 56 per cent respectively, with large, high-tech and internationally
exposed businesses faring worse than average. The economy-wide risk level is likely to be
higher still; the financial sector, healthcare, education and social care are excluded from the
sample, but they are known from other sources to be particularly appealing to attackers.
JEL Classification: F50, L60, L80, C83.
Keywords: cyber attacks, cybersecurity, cyber risk.
Contents
1. Motivation ............................................................................................................................. 5
2. The data ................................................................................................................................. 7
3. Results: unedited data ............................................................................................................ 8
3.1 Cybersecurity management in Italian non-financial firms .................................................. 8
3.2 Cyber attacks against Italian non-financial firms................................................................ 9
4. Data correction models ........................................................................................................ 11
5. Results: corrected data ......................................................................................................... 15
6. Conclusions ......................................................................................................................... 19
Appendix .................................................................................................................................. 20
References ................................................................................................................................ 29
______________________________________
* Bank of Italy, Directorate General for Economics, Statistics and Research.1. Motivation1
Cyber risk is currently at the top of the international agenda. Between 2012 and 2016, it featured three
times in the World Economic Forum’s list of significant global risks (World Economic Forum, various
years). The concluding statement of the G7 Leaders’ Summit of May 2016 reads: ‘We strongly support an
accessible, open, interoperable, reliable and secure cyberspace as one essential foundation for economic
growth and prosperity’ (G7 Leaders, 2016).
Some stakeholders have long been aware of the dangers of poor cybersecurity,2 however this concern has
entered the mainstream only recently as lines between state-mandated cyber war, cyber terrorism, profit-
oriented cyber espionage and cybercrime blur (World Bank, 2016) and the broader implications of cyber
attacks start to become clear.
Possible targets are no longer restricted to traditional strategic assets, such as military systems and large-
scale infrastructure, or to businesses that guarantee immediate monetary gain for the attacker upon a
successful breach, such as providers of online payment services.3 Corporations that store massive amounts of
personal data are now a prime object of desire for attackers: incursions that have made the front pages of
newspapers – against medical insurer Anthem, e-mail provider Yahoo!, etc. – are only the tip of a growing
iceberg of privacy breaches (Center for Strategic and International Studies, 2016), often perpetrated with
goals that go beyond the sale of stolen data on black markets.
Disclosure of sensitive information is known to impact stock prices, at least in the short run (Spanos and
Lefteris, 2016), can cause companies to fail and can affect political dynamics, as shown by the 2015 attacks
on the Ukrainian power grid and the role played by hacked e-mail accounts in the 2016 US presidential
campaign. Beyond such notable cases, any manufacturing or service firm can be targeted for theft of
intellectual property or sabotage; any individual is at risk of financial fraud or identity theft.
Perhaps most importantly, the nature of cyberspace is such that anyone who owns a connected device
can become an unwitting accomplice to a crime: a security flaw in a system can be leveraged to hit other
systems. Attackers are likely to look for the weakest links in a company’s supply chain: in 2013, US retailer
1
I would like to thank Luigi Cannari, Pietro Catte, Paolo Ciocca, Riccardo Cristadoro, Pauline Massart and Giovanni
Veronese for their comments. The Sample Surveys Division at the Bank of Italy and the cybersecurity community of
the Italian government provided substantial help with the survey questions. All remaining mistakes and omissions are
mine. The views here expressed are those of the author and should not be attributed to the Bank of Italy.
2
The military and law enforcement implications of cyber vulnerabilities have been evident for some time and have been
discussed multilaterally in forums as comprehensive as the United Nations (United Nations General Assembly, various
years).
3
International financial institutions were comparatively quick to react to the emergence of cyber risk. A few years ago
the Bank for International Settlements and the International Organization of Securities Commissions, together with
national and supranational supervisors, fostered a coordinated drive for enhanced security across banks and other
financial institutions, ongoing today (Bank for International Settlements and Board of the International Organization of
Securities Commissions, 2016). As an example of public-private partnership, in December 2016 the Bank of Italy and
the Italian Banking Association created a Computer Emergency Response Team for the financial sector (CERTFin).
5Target was hit, causing total damage of about $300 million via network credentials stolen from a low-
security, third-party provider of air-conditioning services. Poorly protected machines can also be hijacked: in
2016, about 100,000 Internet-of-Things4 (IoT) devices, such as digital video recorders and web cameras,
were used, unbeknownst to the owners, to disrupt the operations of high-profile targets including social
platforms Twitter and Reddit.
The damage caused by cyber attacks goes beyond individual victims: a widespread perception of
excessive, inadequately managed risk could ultimately trigger a technological backlash (World Economic
Forum, 2014). One of the clearest examples of vulnerability comes from knowledge-intensive services; in
this sector, it is easy to see how a lack of cybersecurity could both stifle productivity and erode the gains
from globalization. From cloud storage to e-commerce, from social networking to management consulting,
many knowledge-intensive services are based on exchanges of digitized information; most have a cross-
border dimension, with providers in one jurisdiction serving customers all over the world. Should consumers
fear that their data are not safe, they might choose to exit the market, or at least withdraw from international
trade. Indeed, pressure for repatriation of data has been mounting, based on the fear that information stored
abroad is more exposed to both hackers and foreign governments. 5 Security considerations can, and do, enter
decisions on whether to develop and sell new information-based products, or where to establish data-
intensive productive processes, such as industrial 3D printing. Cybersecurity regulations can constitute a
barrier to trade as well (Friedman, 2013).
Recent academic literature shows how the market alone fails to provide adequate protection against
cyber threats on account of distortive factors, such as asymmetric information, and the externalities
exemplified above (Anderson, 1993; Anderson, 2001; Ashgari, van Eeten and Bauer, 2015; Moore, Dynes
and Chang, 2016; van Eeten et al., 2010). Governments and researchers may be well acquainted with this
fact in qualitative terms, however they often lack precise metrics. How vulnerable are businesses? How often
are they attacked? What is the cost of security? A pressing need for reliable data emerges, since very little is
4
‘Internet of Things’ describes the growing network of physical objects, such as household appliances, cars or
industrial machines, that are connected to the Internet so as to enable remote operation (e.g. control, maintenance, data
transfer). Some users of IoT devices do not realize that they should protect them the way they would a computer or a
smartphone; default configurations, including passwords, are often left untouched, resulting in widespread vulnerability.
5
In 2015, based on the complaint of a Facebook customer, the European Court of Justice overturned the ‘Safe Harbour’
decision taken by the European Commission in 2000 (European Court of Justice, 2015). This decision allowed
companies located in the United States to store data belonging to European citizens, as long as they self-
certified adherence to a set of privacy principles. After the decision was overturned, negotiations began for a new
agreement, known as the US-EU Privacy Shield, which includes stronger safeguards and entered into force in 2016
(European Commission, 2016). While the Court’s reasoning focused on the incompatibility between EU principles and
US ‘legislation permitting the public authorities to have access on a generalized basis to the content of electronic
communications’, the same concern applies even more so to the lack of a defence against any unauthorized access to
data by attackers. Compliance with the Cyber Essentials scheme, a security certification programme run by the British
government, is already a pre-requisite for bidding for certain public contracts in the United Kingdom; authorities are
suggesting that private businesses adopt the same requirement (Crown Commercial Service of the United Kingdom
Government, 2016). Federal procurement in the US has cybersecurity requirements (United States Department of
Defense, General Service Administration, National Aeronautics and Space Administration, 2016); certification of
compliance with the 2016 EU Directive on Security and Network Information Systems may come to play a similar role
in Europe.
6known. The statistics most often quoted in the media are provided by companies that specialize in cyber
defence: the potential for a conflict of interest exists and the underlying data are not public.
This paper presents a first-time overview of cyber risk in the Italian private sector based on the Bank of
Italy’s annual surveys of Italian industrial and service firms. This data source appears to be particularly
suited to policy design as it draws on a random sample with known statistical properties, covers a significant
share of the economy, documents the collection methodology, is available to researchers and comes from a
provider with no commercial interest in cybersecurity. Similar characteristics can be found in the UK
Government’s Cyber Security Breaches Survey (United Kingdom Department for Culture, Media and Sport,
2016), already in its second wave at the time of writing.
The information collected, albeit only covering the incidence of cyber attacks and some aspects of
security governance, is the first of its kind for Italy. The results are striking: even though a mere 1.5 per cent
of businesses do not deploy any cybersecurity measure, 30.3 per cent – corresponding to 35.6 per cent of
total employees – report at least some damage from a cyber attack between September 2015 and September
2016. Once data are corrected to account for inability to detect attacks on the part of some respondents, and
reticence to disclose them on the part of others, these figures climb to 45.2 and 56 per cent respectively, with
large, high-tech and internationally exposed businesses faring worse than average. The economy-wide risk
level is likely to be higher still; the financial sector, healthcare, education and social care are excluded from
the sample, but they are known from other sources to be particularly appealing to attackers.
The paper is structured as follows. Section 2 describes the data; Section 3 discusses the main findings
using the unedited data; Section 4 illustrates the process of data correction; Section 5 reports results using the
corrected data; Section 6 concludes. The Appendix provides further statistical details.
2. The data
Every year, the Bank of Italy carries out two surveys of the Italian private business sector covering
industrial and non-financial service firms with at least 20 employees. The sample is randomly selected
according to a stratified design; the results are statistically representative by macro-region, size class and
certain aggregations of NACE Rev.2 sectors at the two-digit level (see Banca d’Italia, various years for
methodological documentation).
Between January and May of each year, the main quantitative descriptors of a firm’s economic activity
(employment, investment, turnover) are measured. Between September and October, a qualitative follow-up
records changes in those variables.6 Questionnaires also include time-varying monographic questions, driven
by contingent informational needs. In 2016, the qualitative survey featured two questions on cybersecurity:
Q1. In your firm, cybersecurity is:
6
The dataset is not a full panel due to attrition; the overlap between adjacent surveys is at around 80 per cent.
71 = Handled by internal resources; 2 = Outsourced to an external company, belonging to the same group; 3 =
Outsourced to an external company, not belonging to the same group; 4 = Partly handled by internal resources,
partly outsourced; 5 = Not applicable, as no cybersecurity activities exist; 9 = I don’t know / I refuse to answer.
Q2. The number of cyber attacks against firms, including small and medium ones, is increasing. Over the
last year, how many times were you hit by a cyber attack? Only consider the attacks that had
consequences, no matter how limited and/or short-lived and/or easily reversible, on the functioning of
the firms’ systems and/or on the integrity and confidentiality of data therein stored.
1 = No attacks; 2 = One attack; 3 = Between 2 and 5 attacks; 4 = Between 6 and 10 attacks; 5 = More than 10
attacks; 9 = I don’t know / I refuse to answer.
The questions were included, first and foremost, to address the data gap in the incidence of cyber attacks
in the Italian corporate sector. Information on outsourcing was collected to get an initial feel for the way
cyber threat is managed by firms and of the market for cybersecurity services in the country. The section on
cybersecurity followed others on investments, funding, employment, turnover, international trade, the impact
of geopolitical factors on business and government payments to firms. Typically, respondents are either
executives or administrative staff with a broad knowledge of the business.
Most results presented in this paper are based on the sample for the 2016 qualitative survey, comprising
4,271 firms. Some require the use of variables that were only collected in the previous quantitative survey,
and are computed on a sample restricted to the 3,657 firms that participated in both (Appendix Table A1).7
3. Results: unedited data
3.1 Cybersecurity management in Italian non-financial firms
Nearly all firms report adopting some defensive measure against cyber attacks; only 1.5 per cent have
none (Table 1).
Cybersecurity is fully outsourced by 31.8 per cent of respondents and partly outsourced by 26.9 per cent;
37.2 per cent rely on internal resources only. The exclusive use of outsourcing is less common among large
and high-tech firms. Involving third parties in securing a firm’s IT systems implies giving them at least some
access to private data and processes and allowing them to assess vulnerability levels. This is a risk factor per
se as some contractors may use the information inappropriately or may not take the necessary precautions to
avoid being hacked themselves. Firms that can afford it prefer to have their own security teams;8 they may
also only outsource the tasks that are considered less sensitive. Indeed, only 5.1 per cent of firms with 500 or
more employees choose the option having the highest degree of third-party risk: exclusive outsourcing to a
company that is not a part of the same group; for small businesses, the figure is 30.6 per cent.
7
Descriptive statistics for the two samples appear similar (Appendix Table A2); there is no evidence of a systematic
discrepancy in model estimation results. Any difference between the stated sample sizes and the number of observations
used for estimates depends on item non-response for specific variables included in the regressions, assumed to be
unrelated to the analysis variables once all covariates are controlled for.
8
Data from qualitative surveys consistently confirm that large businesses are more likely to separate cybersecurity from
ordinary IT management, employ a Chief Information Security Officer, and other specialized professionals
(PriceWaterhouseCoopers, various years).
8Table 1
Cybersecurity management
(percentages)
Internal Outsourcing Outsourcing Internal + No Don’t know /
resources within group outside group outsourcing cybersecurity No answer
Geographical area
North-West 35.2 5.0 27.2 29.1 0.7 2.8
North-East 30.0 6.9 28.3 31.1 1.9 1.8
Centre 42.8 6.1 22.9 22.7 2.2 3.2
South and Islands 46.8 4.1 24.1 20.1 2.0 3.0
Number of employees
20 – 49 35.4 4.6 30.6 24.5 1.7 3.1
50 – 199 39.6 7.6 19.7 30.2 1.5 1.4
200 – 499 46.6 5.4 7.8 37.7 . 2.5
500 and over 42.9 10.4 5.1 36.9 0.1 4.7
Tech / knowledge
intensity of sector (*)
High and medium-high 43.4 5.8 19.4 27.3 0.5 3.6
Low and medium-low 34.9 5.5 28.7 26.7 1.9 2.3
Exports as share of
turnover
Less than 1/3 38.2 5.5 27.0 25.0 1.8 2.6
Between 1/3 and 2/3 33.2 5.5 27.0 31.4 0.3 2.6
Over 2/3 37.2 5.8 20.6 31.7 1.8 3.0
Total 37.2 5.6 26.2 26.9 1.5 2.6
(*) High and medium-high: manufacturing firms with high or medium-high technological intensity, and service firms with high
knowledge intensity, according to OECD/Eurostat classification. Low and medium-low: all other firms. Firms in the energy sector,
not covered by the original classification, are reclassified as high-technology.
The exclusive use of internal resources is more common than average in Southern Italy, at 46.8 per cent.
This may depend on the limited availability of potential external contractors: the market for high-tech
services is less developed compared to the rest of the country.
Note that, in this wave of the survey, no details are collected on the quality of security measures. Both
‘outsourcing’ and ‘internal resources’ may belie an array of vastly different realities. Anecdotal evidence
suggests that for smaller, low-tech firms, contractors tend to be retail computer sellers, while internal
resources are employees who happen to be IT enthusiasts; in neither case is cybersecurity handled by
professionals. On the other hand, larger firms mostly outsource cybersecurity to specialized firms and their
internal teams are at least partly staffed by experts.9
3.2 Cyber attacks against Italian non-financial firms
Despite the avowed existence of defensive measures, almost one business in three (30.3 per cent; Table
2) declares to have fallen prey to a cyber attack in the twelve months prior to the interview; 60.4 per cent
9
A ‘knowledge gap’ in this field has been documented: demand for security professionals exceeds supply (McAfee and
Center for Strategic and International Studies, 2016).
9report no attacks; 9.4 per cent do not reply to the question. When estimates are weighted for the number of
employees, one of the possible proxies for a firm’s contribution to the economy, the overall proportion of
self-reported victims climbs to 35.6 per cent.10 Among the firms that reported at least one attack, 37.9 per
cent were hit only once, 44.5 per cent between two and five times (Appendix Figure A1).
Table 2
Firms hit by at least one cyber attack, unedited data
(percentages)
As a share of total firms As a share of total employees
At least one Don’t know/ At least one Don’t know /
No attack No attack
attack No answer attack No answer
Geographical area
North-West 62.1 28.5 9.4 48.0 32.1 19.8
North-East 56.9 32.5 10.6 45.5 35.2 19.3
Centre 53.8 35.3 10.9 38.7 46.9 14.4
South and Islands 70.0 24.4 5.6 64.0 27.1 8.9
Number of employees
20 – 49 63.2 29.2 7.6 63.2 29.3 7.5
50 – 199 57.6 31.3 11.1 56.1 32.7 11.1
200 – 499 45.4 36.7 17.9 47.0 35.9 17.1
500 and over 39.3 34.8 25.9 33.0 40.7 26.3
Tech / knowledge
intensity of sector (*)
High and medium-high 57.3 30.5 12.1 40.0 36.8 23.2
Low and medium-low 61.6 30.1 8.3 51.2 34.9 13.8
Exports as share of
turnover
Less than 1/3 62.5 29.4 8.1 48.1 35.6 16.4
Between 1/3 and 2/3 54.3 34.6 11.1 44.8 38.0 17.2
Over 2/3 57.1 29.0 14.0 45.8 33.0 21.2
Total 60.4 30.2 9.4 47.2 35.6 17.2
(*) High and medium-high: manufacturing firms with high or medium-high technological intensity, and service firms with high
knowledge intensity, according to OECD/Eurostat classification. Low and medium-low: all other firms. Firms in the energy sector,
not covered by the original classification, are reclassified as high-technology.
The probability of reporting at least one hit increases with firm size, but it is lower in Southern Italy
across all size classes. Larger firms are more attractive to all types of attackers: they handle more data and
this data is also likely to be more valuable. They are also more exposed, as they are better known, and they
have more devices connected to the Internet, wider networks, more employees that can engage in risky
behaviour and more external suppliers that may have some access to IT assets. On the other hand, firms
10
Results are similar when data are weighted by turnover.
10located in the South tend to have lower levels of productivity, knowledge content and technology use: they
are less interesting and less visible to hackers.11
There is a link between internationalization and attacks: firms that export between one third and two thirds
of their products or services are more likely to report a hit compared to the average. Again, exposure
probably plays a role. Cyber attacks are often cross-border: firms that exchange information with business
partners abroad, especially in high-risk jurisdictions, are more likely to become targets compared to others
who do not communicate through the Internet as often, and whose existence may not even be known outside
their immediate surroundings. While the argument should apply even more so for firms that export more than
two thirds of total turnover, this does not seem to be true when looking at the unedited data: the comparison
may be affected by the fact that non-response is higher for this latter group (see below).
4. Data correction models
While already somewhat informative, estimates based on the unedited data should be viewed with great
caution. The literature suggests that two important sources of downward bias exist when measuring the
incidence of cyber attacks via surveys: imperfect knowledge of the phenomenon on the part of some
respondents and reticence on the part of others (Moore and Anderson, 2011).
Some firms may lack the technical ability required to realize that they have been hit. Only some types of
attacks, generally aimed at intimidation or extortion, are designed to be evident; those aimed at data
exfiltration, or any other remote exploitation of a computer’s resources, are built to be as unobtrusive as
possible and require specific skills to be detected.12
Other firms, while competent enough to recognize attacks, may decline to disclose them: this type of
information could be considered too sensitive to be shared, no matter how many confidentiality guarantees
are given, as it potentially implies reputational damage, loss of business, legal fees, regulatory fines, and
other costly consequences.
Table 3 shows the results of two logistic regressions, respectively addressing the probability of
answering the question on cyber attacks and the probability of reporting at least one hit. Covariates include
the geographical, size, sector and export descriptors shown in Table 2; a dummy that distinguishes between
industrial and service firms; two indicators derived from a paradata section at the end of the survey wherein
respondents are asked to state whether completing the questionnaire was difficult for them and whether
gathering relevant information from different sources (e.g. different offices in the company, third-party
suppliers) was a problem. The regressions are run both on the full sample and on the restricted sample, where
11
In all descriptive tables, firms from Central Italy show a higher hit rate. This is a spurious result: respondents are
allocated to geographical areas based on their legal headquarters, and most formerly state-owned large corporations
(railways, postal services, etc.) are headquartered in Rome. These firms are among the most targeted, both because they
operate in strategic sectors and because of their size. In regressions where such factors are controlled for, the results
from Central Italy are similar to those observed for Northern regions.
12
Median time to detection of such attacks has been estimated at over one year for European business, vis-à-vis five
months for US ones (Mandiant, 2016).
11an additional variable measuring the share of skilled labour over total labour input is available.13 Indicators
of outsourcing are not included as they yield results that are not robust across specifications: this may depend
on unobserved heterogeneity in the quality of contractors and/or internal resources.
Table 3
Probability of answering the question on cyber attacks vis-à-vis probability
of reporting at least one attack (unedited data), by type of firm
(logistic regressions)
Full sample Restricted sample
Answered? Reported attack? Answered? Reported attack?
Intercept 2.277 *** -0.801 *** 2.518 *** -1.150 ***
(0.159) (0.112) (0.198) (0.137)
Small 0.201 *** -0.091 ** 0.200 *** -0.086 **
(0.055) (0.037) (0.061) (0.041)
South 0.260 *** -0.205 *** 0.242 *** -0.212 ***
(0.086) (0.048) (0.094) (0.053)
High-tech sector -0.171 *** 0.032 -0.078 -0.019
(0.057) (0.040) (0.066) (0.045)
Industrial 0.246 *** -0.088 ** 0.196 *** -0.006
(0.062) (0.038) (0.071) (0.044)
Export share: over 2/3 -0.304 *** -0.053 -0.352 *** -0.115
(0.101) (0.075) (0.109) (0.083)
Export share: between 1/3 and 2/3 -0.057 0.176 *** -0.026 0.244 ***
(0.095) (0.066) (0.103) (0.072)
Found survey difficult -0.380 *** 0.060 -0.340 *** 0.108
(0.081) (0.065) (0.089) (0.069)
Multiple respondents involved -2.049 *** 0.695 * -2.046 *** 0.768 *
(0.522) (0.378) (0.573) (0.422)
Share skilled -0.430 ** 0.709 ***
(0.218) (0.144)
N 4254 3742 3657 3225
Percent concordant 66.3 57.5 66.6 58.2
Percent discordant 32.6 41.3 32.5 41.1
Percent tied 1.1 1.2 0.9 0.7
Levels of statistical significance of coefficients : *** 1% ** 5% *10%
The regressions have limited explanatory power with respect to the reported hit rate: this is fully
expected as the survey does not provide any information on defensive measures adopted by firms, an
important component of micro-level vulnerability. Still, two distinct clusters emerge quite clearly,
corresponding to the two sources of bias described above. Firms where human capital is typically lower than
average – small ones, those active in traditional sectors, and again those located in the South –answer the
13
For a full description of the variables used, see Appendix Table A3.
12cybersecurity question more often than the rest, but report fewer attacks. The result holds true even after
controlling for self-assessed questionnaire difficulty, which is negatively correlated with response rates
(although it is not a significant predictor of reported hit rates). This group of firms probably lacks the
technical skills necessary for attack detection.
On the other hand, large businesses have the lowest response rates and the highest hit rates. The same
applies to firms with a high share of skilled labour14 and to those where multiple respondents were involved
in answering the survey, a possible proxy for organizational complexity; high-tech firms and those engaging
in cross-border business show similar behaviour too, although not all the effects are statistically significant,
possibly on account of collinearity. This group is likely to be at least somewhat reticent.
In order to correct for these issues, we need to understand the determinants of both response behaviour
and the probability of being attacked so that we can impute missing data and edit unreliable data based on
models. As a first step, we formalize the response process (Figure 1). There are two possible true states of
the world: either a firm has been attacked or it has not. Given a state, respondents can observe it or not. After
observing it, they can tell the truth or lie when reporting it, or refuse to answer the question.
Figure 1
Cyber attacks: response process
14
This variable, only available for the restricted sample, is a better predictor in most regressions compared to the
technology level of the firm’s sector of activity, probably because it accounts for otherwise unobserved cross-sectional
variation in knowledge intensity.
13Of the twelve outcomes that emerge by combining the possibilities, the seven shaded ones are realistic;
the others appear unlikely enough to be neglected.15 A negative answer to the survey question can therefore
correspond to three different cases: no attacks, an undetected attack, or a detected attack that was deliberately
misreported. Non-response can correspond to no attacks, an undetected attack, or a detected attack that was
not reported. A positive answer is observed only if an attack happened and was detected.
We propose four data correction models (Table 4). In the base model, we only impute data for non-
respondents. In augmented model A, we delete answers for respondents who reported no attacks and who fit
a chosen criterion for low detection ability, then impute data for both them and non-respondents. In model B,
we delete answers for respondents who reported no attacks and fit a chosen criterion for likelihood of
misreporting, then impute data for both them and non-respondents. Model C combines the two corrections.
Table 4
Cyber attacks: data correction models
Corrects for…
Model Non- Mis- Mis- Data imputed for…
response detection reporting
Base Yes No No Non-respondents
Augmented A Yes Yes No Non-respondents; respondents with no knowledge of TTIP
who reported no attacks
Augmented B Yes No Yes Non-respondents, foreign-controlled respondents who
reported no attacks
Augmented C Yes Yes Yes Non-respondents, respondents with no knowledge of TTIP
who reported no attacks, foreign-controlled respondents who
reported no attacks
In model A, we instrument low detection ability with the answer to a question that measures the level of
knowledge of the Transatlantic Trade and Investment Partnership (TTIP).16 This variable is exogenous to the
probability of suffering a cyber breach, however respondents who state that they never heard of TTIP are
significantly less likely to report an attack compared to the rest (Appendix Table A4). The negotiations for
this treaty were mentioned often in the media in the recent past as the fieldwork for the survey was
underway: not knowing anything about them is tantamount to not following TV news and not reading
15
Cases where no attack was observed, but one was reported are unlikely because a respondent convinced that a
negative event did not take place has no incentive to report otherwise. Cases where no attack happened, but one was
observed may correspond to technical failures mistaken for attacks; we assume them to be infrequent.
16
The question, administered in the same survey, reads as follows:
What do you know of the negotiations currently underway between the United States and the European Union on
the agreement on trade and investment known as TTIP (Transatlantic Trade and Investment Partnership)? 1 = I
didn’t know that this negotiation existed; 2 = I heard about the negotiation, but I don’t know the contents; 3 = I have some
knowledge of the general contents of the agreement 4 = I have detailed knowledge of some aspects of the agreement; 9 = I
don’t know/I refuse to answer.
14newspapers. Assuming that general knowledge is correlated to knowledge of cyber threats, we can take the
answer to this question as associated with attack detection skills.
In model B, we instrument the likelihood of misreporting with a dummy variable that is valued at one if
the self-reported effective locus of control of the firm is outside Italy.17 This characteristic should be
exogenous to the probability of being attacked or, if anything, correlate positively with it, in the same vein of
large businesses and exporters: multi-national enterprises might be more interesting, and more exposed, to
hackers. On the contrary, foreign-controlled firms report lower hit rates. They also answer less often,
suggesting that this is not a case of better defences compared to similar domestic firms (Appendix Table A5).
The pattern can be understood by looking at the issue from a national security perspective. Governments
are trying to raise awareness of cyber threats in the business community: widespread vulnerability is seen as
an existential risk, especially as economically motivated cyber espionage becomes more common. In most
OECD countries, the state offers guidance to firms,18 highlighting the importance of defending against
terrorists and competitors alike. A firm operating in a foreign country might prefer to share information on
cyber attacks with its own national government, understating vulnerability to public authorities (and
surveyors) in the host country instead.
All imputations are performed based on the same specification. A dummy variable, valued at one if the
firm reported an attack, is regressed on the set of covariates presented in Table 3;19 the regression
coefficients are used to compute a probability score for each firm for which the answer was originally
missing or has been deleted; a Bernoulli draw is performed from a distribution with the score as the mean,
and the outcome is the imputed value.20 The correction models only differ from each other in that they are
estimated on different data sets: the base version uses all responses provided in the survey, while the others
exclude the deleted categories starting from the estimation stage.
5. Results: corrected data
Table 5 shows a summary of results for all data correction models, and also of versions thereof where
non-respondents are assumed to be reticent, so that data that were originally missing are imputed as reported
attacks independent of what the model predicts.21
17
Answer to this question, administered in the same survey:
Control of the business, i.e. dominant influence on strategic decisions, is exercised by a person or company whose
nationality is: 1 = Italian; 2 = Foreign
18
See, for example, the National Cybersecurity Awareness Month promoted by the US Department of Homeland
Security, or the CyberAware campaign launched by the UK government.
19
Standard imputation theory predicts that non-response bias can be corrected only if the data are missing at random
(MAR), i.e. if the non-response pattern is not correlated with the value of the analysis variable, but with variables
included in the imputation model. Data can be still treated as MAR if a set of covariates exists that predicts both
response probability and the value of the analysis variable, i.e. if the non-response pattern is likely to be uncorrelated
with the value of the analysis variable after controlling for those covariates (Little and Rubin, 2002).
20
In order to control for this element of randomness, five separate draws are made and averaged.
21
The results are robust across many possible specifications, not presented in this paper for the sake of brevity. Some
imputation diagnostics are available in Appendix Table A6.
15Table 5
Firms hit by at least one cyber attack: summary across data correction models
(percentages)
Complete
Base (i) Base (ii) A (i) A (ii) B C
cases
Share of firms 33.3 33.8 33.3 39.7 39.2 34.5 41.2
…if all non-respondents attacked / 39.6 39.2 45.2 44.9 40.8 45.8
Share of employees 43.0 43.7 44.8 47.6 47.9 49.0 52.7
…if all non-respondents attacked / 52.7 52.9 56.0 56.3 56.4 59.9
N 3,742 4,254 3,657 4,254 3,657 3,657 3,657
(i) Estimated on full sample (ii) Estimated on restricted sample
The first column in the table is provided for reference and shows results for complete cases only, i.e. firms
that provided an answer to the question on cyber attacks. This equates to assuming that the distribution of the
analysis variable is the same across respondents and non-respondents. In this scenario, the share of firms hit
by attacks goes up by three percentage points, to 33.3 per cent (43 per cent of employees), from the 30.2 per
cent observed on unedited data.
The base imputation model yields results that are very similar: by construction, it is bound to reproduce all
sources of bias present in the unedited data. The misdetection correction is quite significant, with the share of
attacked firms climbing to over 39 per cent (48 per cent of employees) under model A for both the full and
the restricted sample; the misreporting correction has a smaller effect. The two combined yield a hit rate of
41.2 per cent (52.7 per cent of employees). If the reticence correction is added, the share of attacked firms
increases by 4.5-6.5 percentage points, depending on the model.
We believe that model A is the most informative:22 it can be estimated on the largest possible sample and
the instrument used to single out unreliable answers is more strongly exogenous compared to the one used in
model B.23 Also, we believe that non-response should be treated as reticence: the survey offers the option to
report no attacks, and there are few reasons why a firm should skip the item other than not wanting to
disclose breaches.24 Detailed results derived by applying model A to the data and then adding the reticence
correction are presented in Table 6. In this scenario, 45.2 per cent of firms, corresponding to 56 per cent of
employees, have been hit by at least one cyber attack.
22
Sample selection due to item non-response in covariates for models B and C is especially difficult to control.
23
The results are robust to different specifications of the instrument. In the version of model A presented in this paper,
only those respondents who declared no knowledge at all of TTIP are included in the group that is assumed to have low
detection ability; if we expand this group to encompass those who reported very generic knowledge (‘I heard about the
negotiation, but I don’t know the contents’), thus adding variance in terms of covariates included in the model, the
effects shown in Table 4A and Table 7 obtain again; in some cases, they are even stronger. We choose to describe the
narrow specification, as it keeps the share of deleted cases relatively low.
24
Under a no-reticence hypothesis, the non-response rate for the question on attacks should roughly coincide with that
observed for the question on outsourcing, whereas it is multiplied by a factor of 3.6 on average, and more than 5 for the
largest firms.
16Results confirm some features of the distribution observed on the unedited data: cyber attacks are more
common among larger firms (62.8 per cent of those with 500 employees and over), while they are less
frequent in Southern regions (35.9 per cent). Other patterns emerge or become more starkly defined: high-
tech firms are more likely to be attacked than their low-tech counterparts, with hit rates at 48.8 and 43.8 per
cent respectively, and all exporters fare worse than non-exporters.
Table 6
Firms hit by at least one cyber attack: data corrected for misdetection, reticence
(percentages; estimates on full sample)
Total correction Misdetection (share Reticence (share of
Share of firms Share of employees
(percentage points) of total correction) total correction)
Geographical area
North-West 44.2 15.7 40.1 59.9 54.8
North-East 47.3 14.8 28.4 71.6 57.5
Centre 52.3 17.0 35.9 64.1 63.9
South and Islands 35.9 11.5 51.3 48.7 42.6
Number of employees
20 – 49 42.7 13.5 43.7 56.3 44.0
50 – 199 48.4 17.1 35.1 64.9 48.2
200 – 499 56.0 19.3 7.3 92.7 56.2
500 and over 62.8 28.0 7.5 92.5 67.6
Tech / knowledge
intensity of sector (*)
High and medium-high 48.8 18.3 33.9 66.1 62.7
Low and medium-low 43.8 13.7 39.4 60.6 52.4
Exports as share of
turnover
Less than 1/3 43.0 13.6 40.4 59.6 55.1
Between 1/3 and 2/3 51.8 17.2 35.5 64.5 59.2
Over 2/3 48.5 19.5 28.2 71.8 57.6
Total 45.2 15.0 37.3 62.7 56.0
(*) High and medium-high: manufacturing firms with high or medium-high technological intensity, and service firms with high
knowledge intensity, according to OECD/Eurostat classification. Low and medium-low: all other firms. Firms in the energy sector,
not covered by the original classification, are reclassified as high-technology.
On average, the correction implies an increase of 15 percentage points in the incidence of attacks; the
figure is higher for the categories that were more severely affected by non-response. Misdetection accounts
for 37.3 per cent of total correction; the incidence is highest in the South (51.3 per cent) and for firms with
less than 50 employees (43.7 per cent), while it is lowest for large businesses. Most of these characteristics
are a direct consequence of how the corrections were constructed; the core messages are, however, quite
robust across different specifications (see Appendix Tables A7-A11).
When the regression models presented in Table 3 are estimated on imputed data, the results obtained on
the unedited data are confirmed and the predictive power improves for both specifications (Table 7, columns
17i and ii).25 Self-assessed questionnaire difficulty also appears to be a strong predictor of the probability of
being hit: this is, in all likelihood, a spurious effect due to the reticence correction.
Table 7
Probability of being hit by least one attack (imputed data), by type of firm
(logistic regressions)
(i) (ii) (iii)
Intercept -0.156 -0.401 *** -0.419 ***
(0.100) (0.123) (0.154)
Small -0.109 *** -0.097 *** -0.118 ***
(0.034) (0.037) (0.043)
South -0.206 *** -0.225 *** -0.217 ***
(0.043) (0.047) (0.053)
High-tech sector 0.080 ** 0.040 0.034
(0.035) (0.040) (0.047)
Industrial -0.113 *** -0.052 -0.045
(0.034) (0.039) (0.046)
Export share: over 2/3 0.016 0.005 0.027
(0.067) (0.073) (0.082)
Export share: between 1/3 and 2/3 0.172 *** 0.200 *** 0.155 **
(0.060) (0.066) (0.075)
Found survey difficult 0.212 *** 0.255 *** 0.231 ***
(0.057) (0.062) (0.072)
Multiple respondents involved 0.934 *** 1.104 *** 1.353 ***
(0.340) (0.379) (0.439)
Share skilled 0.465 *** 0.450 ***
(0.130) (0.148)
No mobile internet / cloud -0.037
(0.046)
No big data / artificial intelligence 0.020
(0.069)
No internet of things -0.115 **
(0.059)
N 4,254 3,657 2,854
Percent concordant 60.1 61.0 61.9
Percent discordant 39.0 38.5 37.7
Percent tied 0.9 0.5 0.5
Levels of statistical significance of coefficients : *** 1% ** 5% *10%
We run one further regression to take into account a few variables on technology adoption (Table 7,
column iii); the results should be taken as merely indicative, as the information is only available for a
25
The effect of exporting over two thirds of turnover now has the expected sign, but is still not statistically significant.
We were not been able to find a convincing explanation for this result: while there are hints that the incidence of low-
tech firms in the textile sector in this group plays a role, no specification was robustly significant. Further data are
needed to understand which type of heterogeneity is at play.
18fraction of the sample and there is no way to control the selection process. Firms that use IoT devices have a
higher probability of being attacked: this could be because of specific vulnerabilities or because this
characteristic proxies for aspects of the firm’s technological sophistication that are captured neither by the
activity sector nor by the share of skilled labour over total labour. As IoT-based attacks are still relatively
rare compared to other forms, it is probably a mix of the two. The effect of other technologies is not
statistically significant, probably on account of limited variation in the sample.
Even after all corrections, the economy-wide risk level is likely to be higher than we estimated. The
financial sector is traditionally not covered in the survey because central banks, in their capacity as regulators
and supervisors, are already in possession of detailed data.26 Health care, education and social care are also
excluded because in Italy they are mostly provided by the state. Results from the UK governmental survey
mentioned in Section 1 suggest that these sectors are more profitable targets to hackers compared to the
average and can be expected to show higher hit rates.27
6. Conclusions
In this paper, we have presented preliminary evidence on cyber risk in the Italian private sector based on
a representative sample of industrial and non-financial service firms with 20 employees or more. Only 1.5
per cent of respondents stated that they do not take any cybersecurity measures, showing that at least some
awareness of cyber risk permeates the economy; however, significant vulnerability still emerged. About one
third of firms reported at least some damage from cyber attacks, in terms of operational continuity and/or
integrity and confidentiality of business data, between September 2015 and September 2016.
Once data are corrected to take into account the fact that some respondents may not be aware of having
been attacked, and others may be reticent in disclosing what is perceived as sensitive information, the share
of attacked firms climbs to 45.2 per cent (56 per cent of total employment). Attack rates are lowest for firms
headquartered in Southern Italy, at 39.5 per cent, and highest for those with more than 500 employees, at
62.8 per cent.
Along with large firms, those in high-tech sectors, those employing a high share of skilled labour and
those with a significant degree of international exposure are more likely to be hit. These businesses are both
more visible and more attractive to attackers compared to the rest; not only are they better known and more
present online than average, they also tend to handle larger amounts of valuable data.
The paper does not assess two policy-relevant dimensions: the correlation between firm-level
vulnerability and investments in cyber defence, and the cost of cyber breaches. Further research is needed on
both subjects as more data become available.
26
On the subject of cybersecurity, the European Central Bank recently conducted a thorough investigation, although
most results are confidential.
27
Studies from the private sector, although not statistically representative, also confirm this fact: see for example
KPMG (2015) for the health care industry, and VMWare (2016) for higher education.
19Appendix 20
Table A1
Sample composition
(number of firms)
Full sample Restricted sample
Industrial Service All Industrial Service All
Geographical area
North-West 757 288 1,045 656 247 903
North-East 622 262 884 515 202 717
Centre 675 269 944 585 231 816
South and Islands 988 400 1,388 891 336 1,227
Number of employees
20 – 49 1,103 394 1,497 952 327 1,279
50 – 199 1,215 454 1,669 1,056 365 1,421
200 – 499 443 182 625 392 163 555
500 and over 281 189 470 247 161 408
Tech / knowledge intensity of sector
High and medium-high 985 244 1,229 860 204 1,064
Low and medium-low 2,057 975 3,032 1,787 812 2,599
Exports as share of turnover
Less than 1/3 1,506 1,090 2,596 1,313 905 2,218
Between 1/3 and 2/3 823 83 906 713 71 784
Over 2/3 713 46 759 616 39 655
Total 3,042 1,219 4,261 2,647 1,016 3,663
Table A2
Firms hit by at least one cyber attack, unedited data, restricted sample
(percentages)
As a share of total firms As a share of total employees
One attack Don’t know/ At least one Don’t know /
No attack No attack
or more No answer attack No answer
Geographical area
North-West 61.5 28.8 9.7 47.7 32.1 20.2
North-East 56.9 31.7 11.4 44.9 36.5 18.6
Centre 55.0 35.4 9.6 38.4 47.7 13.8
South and Islands 71.5 22.9 5.6 65.0 26.6 8.4
Number of employees
20 – 49 63.4 29.0 7.6 63.4 29.1 7.6
50 – 199 58.9 30.1 11.0 57.6 31.6 10.7
200 – 499 44.4 37.2 18.4 46.2 36.3 17.5
500 and over 38.4 36.0 25.7 32.3 42.5 25.3
Tech / knowledge intensity of sector
(*)
High and medium-high 57.9 30.6 11.5 39.1 37.5 23.4
Low and medium-low 61.9 29.5 8.6 51.5 35.3 13.2
Exports as share of turnover
Less than 1/3 63.2 28.7 8.1 48.0 36.5 15.5
Between 1/3 and 2/3 52.9 36.1 11.0 43.9 38.4 17.8
Over 2/3 58.0 27.5 14.5 45.9 31.9 22.2
Total 60.8 29.8 9.4 47.0 36.1 16.9
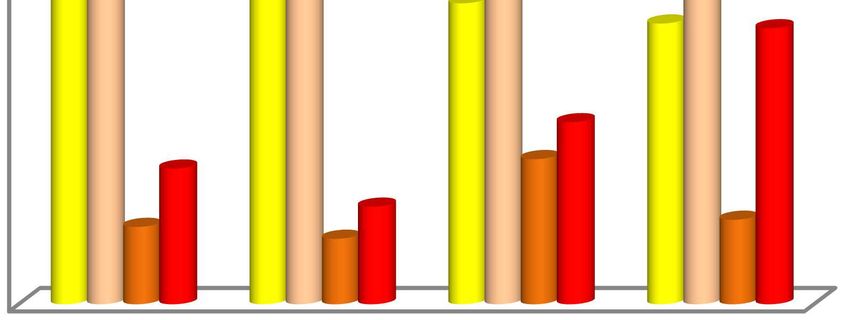
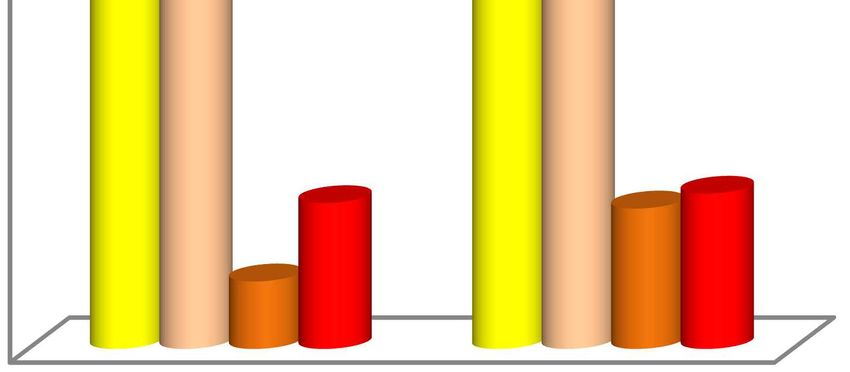
21Figure A1
Number of cyber attacks
(percentage of firms that reported at least one attack)
a. All b. By geographical area
50
11%
6.5% 40
37.9%
30
20
10
0
44.5%
North North East Center South and
West Islands
c. By firm size d. By technology level
50 50
40 40
30 30
20 20
10 10
0 0
20 - 49 50 - 199 200 - 499 500+ Low-tech High-tech
22Table A3
Definition of variables used in regressions
Descriptor Type Content
Small Binary Number of employees between 20 and 49, 2015 average
South Binary Administrative headquarters located in Southern Italy or Islands, as of September 2016
High-tech Binary Main activity sector in 2016 classified by OECD/Eurostat as high or medium-high
technological intensity (manufacturing), or high knowledge intensity (services). Energy
sector not considered by OECD/Eurostat, classified as high-tech.
Industrial Binary ATECO activity sector as of September 2016: manufacturing, mining, energy
Export share Multinomial Value of exported goods or services as a fraction of turnover, 2016 (expectation as of
September 2016)
Found survey difficult Binary Self-assessed difficulty of the 2016 qualitative questionnaire: ‘High’ or ‘Excessive’
Multiple information Continuous Share of self-assessed difficulty of 2016 the qualitative questionnaire dependent on having
sources to retrieve information from multiple sources
No outsourcing Binary Self-reported cybersecurity management through internal resources only
No knowledge of TTIP Binary Self-reported knowledge of TTIP negotiation: ‘I did not know that this negotiation
existed’
Share skilled Continuous Share of employees that are not apprentices, trainees, or manual workers over average
employment, 2016
Foreign control Binary Self-reported locus of decision making for the firm in 2016: outside Italy
23Table A4
Probability of answering the question on cybersecurity vis-à-vis probability of being attacked
(logistic regressions)
Full sample Restricted sample
Answered? Reported attack? Answered? Reported attack?
Intercept 2.929 *** -0.816 *** 3.386 *** -1.277 ***
(0.217) (0.120) (0.271) (0.155)
Small 0.351 *** -0.107 *** 0.348 *** -0.104 **
(0.067) (0.039) (0.074) (0.044)
South 0.533 *** -0.183 *** 0.501 *** -0.185 ***
(0.128) (0.051) (0.139) (0.056)
High-tech sector -0.175 ** 0.017 -0.070 -0.037
(0.070) (0.042) (0.079) (0.047)
Industrial 0.324 *** -0.111 *** 0.214 ** -0.046
(0.077) (0.041) (0.089) (0.047)
Export share: over 2/3 -0.458 *** -0.049 -0.488 *** -0.133
(0.116) (0.079) (0.127) (0.089)
Export share: between 1/3 and 2/3 -0.005 0.170 ** 0.026 0.234 ***
(0.114) (0.069) (0.125) (0.076)
Found survey difficult -0.006 0.130 * 0.099 0.160
(0.125) (0.070) (0.144) (0.074)
Multiple respondents involved -1.829 *** 0.861 ** -1.688 ** 1.090
(0.622) (0.398) (0.684) (0.445)
No outsourcing -0.076 -0.097 ** -0.068 0.206 **
(0.066) (0.038) (0.073) (0.084)
No knowledge of TTIP -0.153 ** -0.010 ** -0.235 *** -0.067
(0.075) (0.044) (0.080) (0.048)
Share skilled -0.852 *** 0.642 ***
(0.269) (0.152)
N 3,718 3,374 3,196 2,909
Percent concordant 68.7 59.2 69.6 59.1
Percent discordant 30.3 40.0 29.5 40.3
Percent tied 1.0 0.8 0.9 0.6
Levels of statistical significance of coefficients : *** 1% ** 5% *10%
24Table A5
Probability of answering the question on cybersecurity vis-à-vis probability of being attacked
(logistic regressions)
Answered? Reported attack? Answered? Reported attack?
Intercept 2.206 *** -1.390 *** 3.123 *** -1.352 ***
(0.225) (0.168) (0.301) (0.177)
Small 0.212 *** -0.091 ** 0.360 *** -0.103 **
(0.063) (0.043) (0.077) (0.046)
South 0.228 ** -0.218 *** 0.494 *** -0.184 ***
(0.096) (0.054) (0.141) (0.057)
High-tech sector -0.050 -0.049 -0.056 -0.057
(0.069) (0.046) (0.082) (0.049)
Industrial 0.208 *** 0.042 0.263 *** -0.007
(0.074) (0.046) (0.093) (0.049)
Export share: over 2/3 -0.387 *** -0.082 -0.560 *** -0.104
(0.114) (0.088) (0.130) (0.094)
Export share: between 1/3 and 2/3 -0.019 0.154 ** 0.024 0.153 **
(0.101) (0.077) (0.128) (0.080)
Found survey difficult -0.369 *** 0.157 ** 0.091 0.223 ***
(0.091) (0.072) (0.151) (0.077)
Multiple respondents involved -1.559 *** 0.463 -1.559 ** 0.794 *
(0.600) (0.442) (0.704) (0.460)
Foreign control -0.241 ** -0.230 *** -0.196 * -0.196 **
(0.097) (0.086) (0.114) (0.089)
Share skilled -0.481 ** 0.940 *** -0.799 *** 0.821 ***
(0.228) (0.153) (0.028) (0.160)
No outsourcing -0.030 -0.087 **
(0.076) (0.044)
No knowledge of TTIP -0.228 *** -0.077
(0.084) (0.051)
N 3,409 3,015 2,999 2,733
Percent concordant 67.7 58.5 70.5 59.0
Percent discordant 31.4 40.9 28.7 40.4
Percent tied 0.8 0.6 0.8 0.6
Levels of statistical significance of coefficients : *** 1% ** 5% *10%
Table A6
Firms hit by at least one cyber attack: imputation diagnostics across data correction models
Base (i) Base (ii) A (i) A (ii) B C
Share of imputed data 9.4 9.4 23.3 23.4 13.1 26.3
N used to estimate imputation model 3742 3225 2960 2540 2745 2145
Model prediction: percent concordant 57.5 58.2 57.8 58.3 59.1 59.2
Model prediction: percent discordant 41.3 41.1 41.1 41.0 40.3 40.2
Model prediction: percent tied 1.2 0.7 1.1 0.7 0.6 0.6
25Table A7
Firms hit by at least one cyber attack: complete-case analysis
Full sample
% firms % empl.
Geographical area
North-West 31.4 40.1
North-East 36.3 43.6
Centre 39.6 54.8
South and Islands 25.8 29.7
Number of employees
20 – 49 31.6 31.7
50 – 199 35.1 36.8
200 – 499 44.7 43.4
500 and over 46.9 55.2
Tech / knowledge
intensity of sector
High and medium-high 34.7 47.9
Low and medium-low 32.8 40.5
Exports as share of
turnover
Less than 1/3 32.0 42.5
Between 1/3 and 2/3 38.9 45.8
Over 2/3 33.7 41.9
Total 33.3 43.0
Table A8
Firms hit by at least one cyber attack: base model
Full sample Restricted sample
No reticence correction Reticence correction No reticence correction Reticence correction
% firms % empl. % firms % empl. % firms % empl. % firms % empl.
Geographical area
North-West 32 40.7 37.9 51.9 32.3 42.6 38.5 52.2
North-East 37.5 45.7 43.1 54.5 35.9 45.8 43.0 55.1
Centre 38.8 54.1 46.1 61.2 40.2 55.9 45.0 61.5
South and Islands 25.7 30.2 30.0 36.0 23.9 29.0 28.5 35.0
Number of employees
20 – 49 32.0 31.3 36.8 36.8 31.8 30.7 36.6 36.6
50 – 199 35.6 37.8 42.4 43.8 34.0 37.0 41.1 42.3
200 – 499 43.2 45.2 54.6 53.0 45.6 45.7 55.6 53.8
500 and over 46.3 53.6 60.6 66.9 45.4 56.6 61.6 67.6
Tech / knowledge
intensity of sector
High and medium-high 35.4 48.0 42.7 59.9 34.4 50.4 42.1 60.8
Low and medium-low 33.2 41.3 38.4 48.7 32.9 41.7 38.1 48.5
Exports as share of
turnover
Less than 1/3 32.3 42.7 37.5 51.9 32 44.8 36.8 52.0
Between 1/3 and 2/3 39.2 48.4 45.7 55.1 39.9 47.0 47.1 56.1
Over 2/3 34.6 43.0 42.9 54.2 31.8 42.3 42.0 54.1
Total 33.8 43.7 39.6 52.7 33.3 44.8 39.2 52.9
26You can also read