Identifying urban features for vulnerable road user safety in Europe - OSF
←
→
Page content transcription
If your browser does not render page correctly, please read the page content below
Identifying urban features for vulnerable road user safety in Europe
               Marina Klanjčića , Laetitia Gauvina , Michele Tizzonia , and Michael Szell∗a,b
                                      a
                                    ISI Foundation, Via Chisola 5, 10126 Torino, Italy
    b
        Computer Science Department, IT University of Copenhagen, Rued Langgaards Vej 7, 2300 København, Denmark

                                                         April 14, 2021

                                                             Abstract
              One of the targets of the UN Sustainable Development Goals is to substantially reduce the number
          of global deaths and injuries from road traffic collisions. To this aim, European cities adopted various
          urban mobility policies, which has led to a heterogeneous number of injuries across Europe. Monitoring the
          discrepancies in injuries and understanding the most efficient policies are keys to achieve the objectives of
          Vision Zero, a multi-national road traffic safety project that aims at zero fatalities or serious injuries linked
          to road traffic. Here, we identify urban features that are determinants of vulnerable road user safety through
          the analysis of inter-mode collision data across European cities. We first build up a data set of urban road
          crashes and their participants from 24 cities in 5 European countries, using the widely recommended KSI
          indicator (killed or seriously injured individuals) as a safety performance metric. Modelling the casualty
          matrices including road infrastructure characteristics and modal share distribution of the different cities, we
          observe that cities with the highest rates of walking and cycling modal shares are the safest for the most
          vulnerable users. Instead, a higher presence of low-speed limited roads seems to only significantly reduce the
          number of injuries of car occupants. Our results suggest that policies aimed at increasing the modal share
          of walking and cycling are key to improve road safety for all road users.

1         Introduction
Road traffic crashes result in yearly 1.3 million deaths and 50 million injuries, and are the world’s leading cause
of death for children and young adults 5–29 years of age [1]. The World Health Organization quantifies the
economic costs of road traffic crashes to 3% of the global GDP, or 2.3 trillion USD. Because of this pressing
societal issue, the UN has declared in 2015 the global sustainability goal to halve the number of global deaths
and injuries from road traffic crashes by 2020 [2]. However, traffic deaths and injuries have kept rising worldwide
instead of decreasing, and the UN goal has been missed [1].
     On a global level, the WHO’s explanation for this failure is the heterogeneity of progress: while casualties
from road traffic have overall stagnated or decreased in high income countries, they have increased in low and
middle income countries. For example, on the one hand, road fatalities have decreased in the EU (although
EU-wide targets to significantly lower traffic crashes have been missed [3]). On the other hand, in most African
and South-East Asian countries, road fatalities have stagnated or grown exceptionally high [1].
     The WHO report also shows that vulnerable road users – pedestrians, cyclists, and motorcyclists – are
disproportionally affected. Increased urbanization has therefore made clear that implementing effective urban
planning policies at scale is necessary to overcome such failures [4]. In particular, the UN’s current sustainability
goal 11 to “Make cities inclusive, safe, resilient and sustainable” [2] is a key to decrease road casualties worldwide
[5].
     In this study, we seek to identify urban features that are determinants of vulnerable road user safety through
the analysis of inter-mode collision data across European cities. We first build up a high-quality data set of urban
road collisions and collision participants from 24 cities in 5 European countries, using the widely recommended
KSI indicator (killed or seriously injured individuals) as a safety performance metric [6]. We then apply machine
learning tools on this established data set to identify 1) the biggest danger to vulnerable traffic participants per
city, and 2) the most relevant urban features – extracted from OpenStreetMap [7] – that are associated with
higher safety for road users. This approach follows a human-centric urban data science [8] that aims to generate
value for citizens by applying data science methods on large-scale urban data sets.
     Our work follows in the footsteps of a wide literature of data-driven studies on road safety. Previous studies
investigating the determinants of road safety have typically considered a subset of dimensions, including vehicle
type, road infrastructure, traffic and control, environmental factors, through the regression analysis of individual
    ∗ Corresponding   author. Email: misz@itu.dk

                                                                 1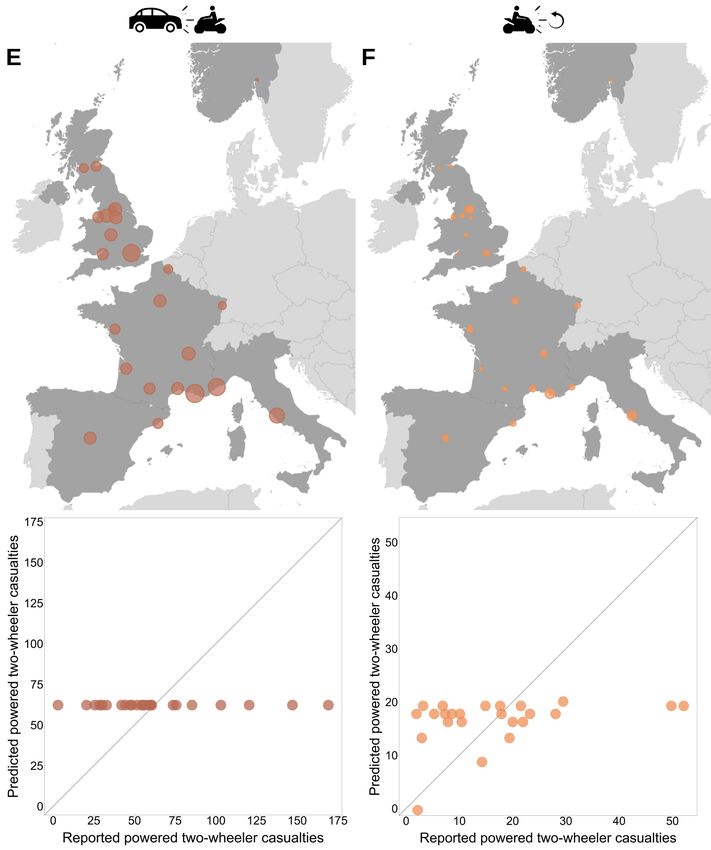
Figure 1: Map of the cities included in the study. We collected, processed, and aligned fine-grained road crash data
and urban features data from OpenStreetMap for the 24 European cities shown in the map, in France, Italy, Norway,
Spain and the United Kingdom, in the year 2018.

crash data [9, 10, 11, 12]. Most of them have a limited geographical coverage, usually focusing on one particular
city or region, with some notable exceptions typically on policy questions [13, 14, 15, 16, 17]. Also, many of
these studies took into account a single transport mode [18, 19] (e.g. cyclists, or pedestrian), yet increasingly
on vulnerable road users [20, 21, 22, 23], but usually only limited to the victim participant in the crash [24]. In
particular, among vulnerable road users, cyclists have received considerable attention by recent studies. Cycling
is one of the most sustainable mobility solutions for short and medium distance trips, but faces considerable risks
imposed by motorized vehicles. The risk for injury has been quantified recently in London using a multilevel
regression model accounting for exposure, finding that lower speed limits and more cycling routes can be a
crucial factor [25]. A more recent study of data from Spain followed a Bayesian network approach to identify
the most relevant features for cyclist injury severity, finding higher risk posed by heavy goods vehicles and lower
risk from certain route conditions [26]. Other approaches use GIS methods to link objective and subjective
risks [27], bicycle trip data of a public bicycle rental system to proxy the bicycle crash exposure [28], crowd-
sourced bicycle incident reports to characterize patterns of injury [29], spatio-temporal trends [30], and analysis
of intersections or bicycle infrastructure [31, 32, 33, 34, 35].
    To summarize, the majority of studies on urban road safety focus on crash victims, often from a single mode,
and only in specific cities or regions. However, there is a clear lack of research that considers both sides of a
crash from all traffic modes to identify inter-mode hazards, together with multiple cities to control for regional
peculiarities.
    Here we fill this gap by following the three main recommendations of the OECD for developing evidence-
based approaches to road safety [36, 37]: 1) to collect and analyze crash data “from a larger set of cities”, 2)
to investigate “the relationships between urban shape, density, speeds, modal share and road user risk”, and 3)
to place “an immediate focus [. . .] on the analysis of casualty matrices to reveal the number of people in each
user group who are killed or seriously injured in crashes involving another user group”. By doing so, we adopt
an ecological study approach that takes into account all traffic modes and casualty matrices across multiple
European cities, and that considers the exposure to different population-level urban features as determinants
of road safety.

                                                         2
Figure 2: Casualty matrices for Barcelona, Inner London and Rome demonstrate heterogeneity of road
traffic risks. The casualty matrix shows the number of killed or seriously injured people in 2018 after a traffic participant
on the left collided with one on the bottom. The leftmost column (above the symbol ö) denotes a crash with only one
participant, indicating self-risk. The heterogeneity of posed risks is apparent: Cars are responsible for the majority of
road deaths/injuries, while columns for pedestrians and cyclists do not appear because they pose practically no risk to
others. Further, these examples also reveal the heterogeneity of risks to specific vulnerable participants through different
cities, for example a much higher relative risk to pedestrians in London than in Barcelona. See Fig. S1 for a full picture
including more traffic participants and all studied cities.

2     Results
Establishing a road casualty data set with inter-mode impacts
We collected road casualty data from 24 European cities in 5 countries (Spain, Italy, France, UK, and Norway)
as shown in Fig. 1 from the year 2018, which was the most recent data available at the time of the study. Of the
24 cities 10 are in France and 10 are in the UK. For more details about the data collection and processing see the
Methods section. The data contain records of road crashes in each city, in a line list format, with details about
the individuals injured, the severity of the injuries, and the types of vehicles involved. A complete description
of the records is reported in the Methods section.
    Based on the crash records, we created casualty matrices reporting the number of individuals killed or
seriously injured (KSI) caused by the collision of any two pairs of road user types, in each city. Among all road
users, we focused in particular on the vulnerable ones, that is pedestrians, cyclists, and powered two-wheelers,
apart from cars. As an illustrative example, in Fig. 2, we show the casualty matrices for 3 cities: Barcelona,
Inner London and Rome. Casualty matrices for all other cities are shown in the Supplementary Information
(Fig. S1). While the highest risk for vulnerable users is expectedly represented by cars in all the cities, the
number of KSI varies significantly by user group. For instance, the casualty matrix of Barcelona shows a high
level of road safety not only for vulnerable users but for car drivers too, with only 4 KSI reported in car-car
collisions in 2018.
    To better compare road safety levels of all cities in our dataset, we normalized the number of KSI, for each
type of collision, by population size. Figure 3 shows the number of KSI individuals per 1 Million inhabitants,
as a stacked bar chart, where each bar corresponds to a specific type of collision. The chart reveals the high
heterogeneity in road safety across the cities under study. On the one hand, we have an extreme case like
Sheffield with almost 500 KSI/M, and, at the top of the safety rank, Oslo that is the safest city in our dataset
with less than 50 KSI/M in 2018. The highest KSI rates among the most vulnerable road users, pedestrians and
cyclists, were recorded in Inner London (308 KSI/M), Liverpool (198 KSI/M), and Birmingham (181 KSI/M),
followed by the rest of the British cities. Instead, the highest KSI rates for powered two-wheelers were reported
in Marseille, Rome and Nice. British cities were also the least safe for car drivers, with Sheffield leading the
rank by KSI rates in car-car crashes, immediately followed by Birmingham. French cities show medium to low
rates of KSI individuals across all types of collisions, with the exception of Marseille that ranks as the second
least safe city in our dataset (387 KSI/M). National capitals also show very different levels of road safety, as
Rome and Inner London display almost 400 KSI/M. while Paris ranked as the 5th safest city of our dataset,
with 132 KSI/M.

                                                             3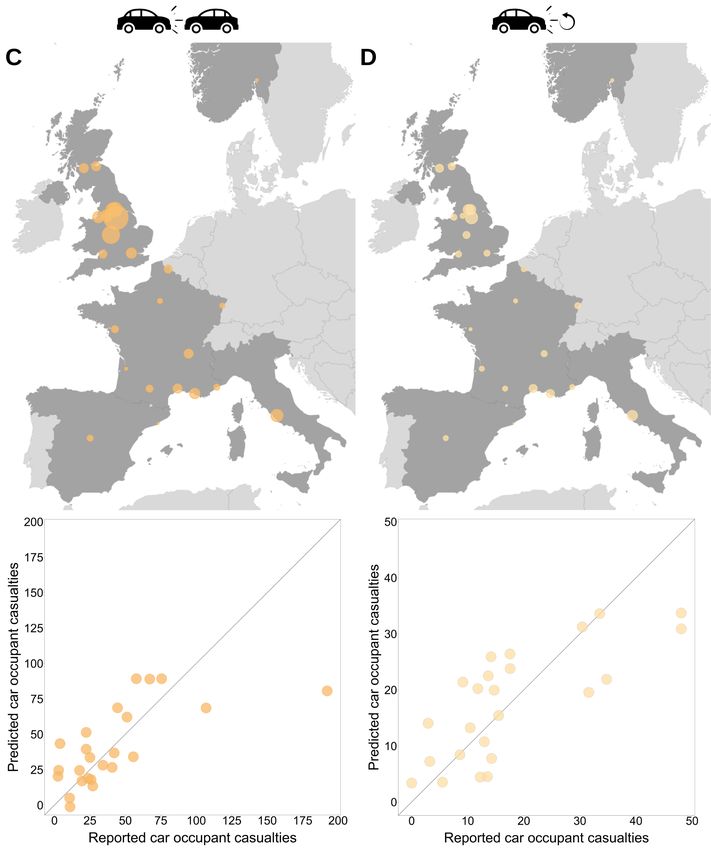
Figure 3: Killed or seriously injured (KSI) individuals per 1 million inhabitants are heterogeneous between
different cities and road participant pairs. The figure reports very different levels of road safety in terms of killed or
seriously injured (KSI) individuals per 1 million inhabitants in 2018. Sheffield (GB) leads with almost 500 KSI, whereas
Oslo (NO) has close to zero KSI. French cities mostly have lower KSI rates, in contrast to most of the British cities which
show high KSI rates often double the amounts of French cities. The most vulnerable traffic participants, pedestrians and
cyclists, are highlighted in maroon and red, respectively. Their KSI rates are highest in Inner London (GB), Liverpool
(GB), and Birmingham (GB).

Urban features as determinants of road safety
To explain the observed heterogeneities in road safety across European cities, and in particular for vulnerable
users, we examined the relationship between a number of urban features and the inter-mode KSI rates shown
in Fig. 3. We collected data regarding 7 different urban features in the 24 cities using OpenStreetMap (OSM)
and from the European Platform on Mobility Management (EPOMM). A complete description of the data
collection process is reported in the Methods section. The features considered in our study are: population
density, the ratio of total cycling area to total driving area, the ratio of total low-speed limited area to total
driving area, modal shares for walking, cycling, public transport, and motor vehicles. Fig. S2 and Fig. S3 provide
an overview of the urban features and the modal shares, respectively, in the 24 cities. All cities displayed a high
variability in the urban features and modal shares, also within the same country. Population density ranges
from 1,417 pop{km2 in Oslo to 20,000 pop{km2 in Paris. The cycling area share of the total streets is only 3%
in Rome but is more than 30% in Strasbourg and Nantes. The speed limited area share varies over more than
an order of magnitude across cities, from 2% in Bradford to 87% in Inner London. Modal shares are also very
different across the 24 cities. Paris ranks first by walking share (47%) and last by motor vehicle usage (17%).
Cycling modal share is generally low, below 4% in all cities, with exception of Bristol (14%), Strasbourg (8%)
and Nantes (5%). Public transport leads the modal share of Barcelona (39%) while it is less common in French
cities, like Montpellier (8%) and Bordeaux (9%).
    For all cities, we examined the relationship between the above urban features and the inter-mode KSI
rates by a multiple linear regression with variable selection through the Lasso procedure, as described in the
Methods. Each regression coefficient β and its associated 95% confidence interval (CI) quantify the relations
of each variable with the inter-mode KSI casualty rates. The main results of the model are summarized by
Fig. 4 which shows the association between each urban feature (rows) and the inter-mode KSI rate (columns)
of collisions that involved at least one car. Each entry of the matrix reports the regression coefficient associated
with a given feature when predicting the KSI rates of a given collision type. Negative values indicate a reduction
of KSI rates and statistically significant values at p ă 0.05 are highlighted by a solid box.
    First, let us focus on modal share, i.e. the bottom three rows in Fig. 4. In general, larger shares of walking
and cycling were most frequently selected by the model to predict a reduction in all type of KSI rates. In
particular, the share of walking was significantly associated with the inter-mode KSI casualty rates of 3 collision
types. Cities with a higher walking share showed to have lower KSI rates for pedestrians (β = -0.48, 95% CI
[-0.81, -0.15]), cyclists (β = -0.57, [-0.97, -0.17]) and car/taxi occupants (β = -0.46, [-0.90, -0.03]) when injured
in a collision with a car or taxi. Walking share was also negatively associated with single-vehicle car crashes,
even though it did not show to be statistically significant. A larger cycling share was also associated - although

                                                            4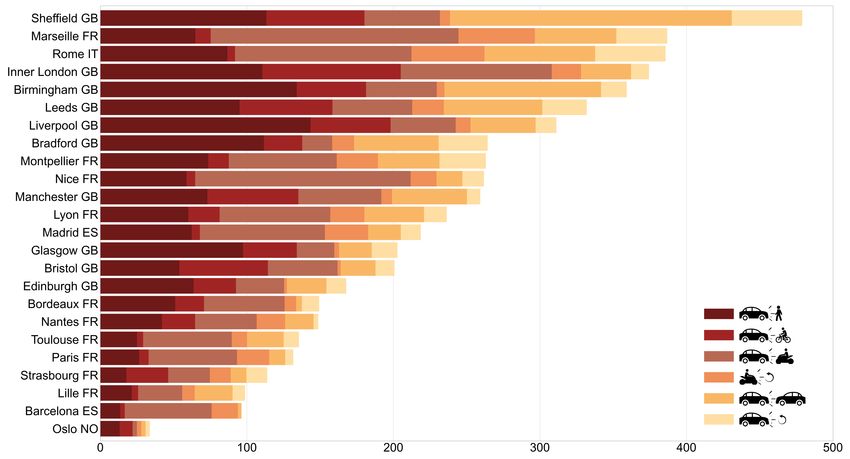
Figure 4: Walking modal share is a significant predictor for inter-mode KSI casualties. The figure reports
regression coefficients for inter-mode casualties per capita and urban features. Each column represents a participant
type killed or seriously injured by car. Each row represents an urban feature selected by the regression model (the blue
bicycle icon denotes the area share of protected cycling paths, the red circled icon denotes the share of areas with speed
limits of at most 30 km{h or 20 mi{h, the last three rows denote modal share of walking, cycling, and public transport).
Empty cells mark the features that were discarded by the model. Black solid boxes denote the statistically significant
variables at p ă 0.05.
not significantly - with lower KSI rates of pedestrians, and car occupants in collisions with cars.
Next, let us examine the features related to infrastructure, i.e. the top two rows in Fig. 4. The model
showed that cities with a higher proportion of low speed limited streets with respect to the total driving area
(second row in Fig. 4), are characterized by lower KSI rates for both single-vehicle car crashes (β = -0.44, [-0.79,
-0.09], significant) and car-car crashes (not significant). A positive association without statistical significance
was observed between low-speed limited area share and cyclists injured by a car/taxi. With pedestrian KSI
rates the proportion of low-speed limited streets had no detectable relation. When it comes to the proportion of
protected cycling paths (first row in Fig. 4), we found the following not significant effects: a larger proportion
was associated to lower inter-mode KSI casualty rates for pedestrians, car/taxi occupants, and single-vehicle
car/taxi occupants. The largest effect between these three on the KSI rates was found for pedestrians (β =
-0.37).
Finally, our model selected the public transport share as positively associated with KSI rates for pedestrians,
cyclists and car/taxi occupants, although not statistically significantly.
Evaluating model performance on inter-mode KSI rates
We examined the quality of our model’s predictions, for the KSI rates of all collision types that involved at least
one car. Figure 5 shows the results of the regression as predicted vs. reported KSI rates, for collisions between
cars and the vulnerable road users of pedestrians and cyclists. In both cases, as shown in the maps, road safety
is lowest in British cities, especially for cyclists, when compared to the rest of our sample. Overall, the model
reached a good performance in predicting the KSI rates of pedestrians hit by a car or taxi (adjusted R2 “ 0.527).
The model’s performance was lower (adjusted R2 “ 0.349) for the KSI of cyclists, as indicated by some outliers
in the scatterplot. In particular, the KSI rate of cyclists in Inner London was more than double than predicted
by the model, based on the selected features. On the other hand, the model predicted relatively higher KSI
rates for cyclists than those reported in Rome, Barcelona and Oslo.
Model results for KSI rates of car occupants are shown in Fig. 6. The model’s performance was better for
collisions involving one car and no other vehicles adjusted R2 “ 0.471 as KSI rates did not differ much between
predicted and reported (Fig. 6D). The performance of the model was lower in the case of car-car collisions
adjusted R2 “ 0.302, mostly due to a single large outlier - Sheffield - where the reported KSI rate was 192
KSI/M but the model predicted a value below 100 KSI/M. On the other hand, the model was better able to
predict KSI rates of car occupants in countries characterized by mid to low KSI rates (ă 50), like France and
Spain.
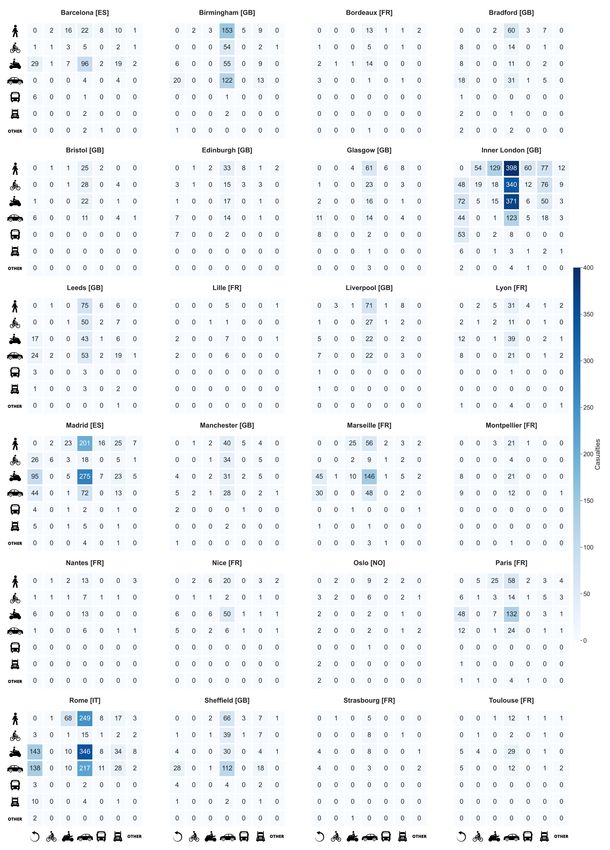
We also performed a multilinear regression to predict the KSI rates of power two wheelers in collisions
involving one car or one single vehicle. In this case, the Lasso regression did not select any of the features
included in the model, indicating a lack of predictive power (see Fig. S4).
5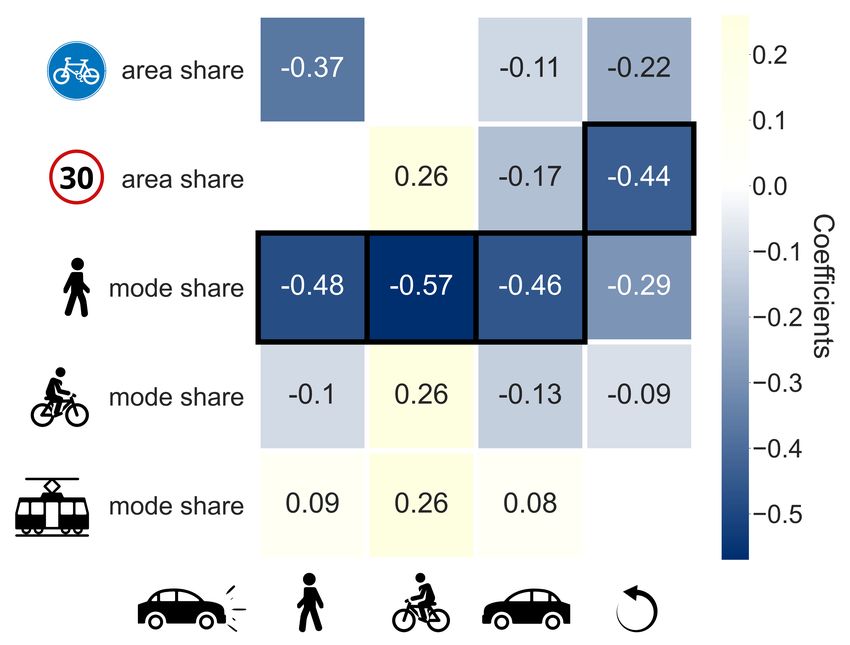
Figure 5: Collisions involving vulnerable road users: maps of the collisions and performance of the models.
Maps are showing the reported numbers of vulnerable road users killed or seriously injured by a car or taxi, normalized
by population. Scatter plots show the corresponding prediction results. Panel A refers to pedestrians, while panel B
refers to cyclists. Colours correspond to those used in the legend of Fig. 3. Of the 24 cities under study, the 10 cities
with the lowest vulnerable road users’ safety are British cities. Prediction results showed adjusted R2 “ 0.527 in panel
A and adjusted R2 “ 0.349 in panel B.

3     Discussion
In this study, we have shown that cities whose residents are more inclined to walk or cycle in their everyday life
are safer for vulnerable road users. Interestingly, the effect of pedestrian modal share extends beyond vulnerable
users and such cities also see less deaths or serious injuries among car occupants. Our observation that a high
rate of walking and cycling is associated with a smaller number of deaths and serious injuries was already noted
by a seminal study of Jacobsen [38]. Our results confirm that early finding, and extend it by showing that
more walkers and cyclists imply more safety for drivers too. Even though there have been significant efforts in
recent years to integrate road safety into urban mobility plans of many cities, the incentives to walk or cycle
remain among the most promising routes to make cities safer for pedestrians, cyclists and drivers. A notable
example is the city of Oslo, which has successfully reached the Vision Zero milestone of zero vulnerable road
deaths in 2019, through a concerted effort to turn roadway decision-making from car-centric to people-centric
[39]. Another conclusion of our study is the relative impact of low-speed limited roads on vulnerable users.
According to our analysis, a larger proportion of speed limited roads is associated with a smaller number of
injuries involving car drivers, but there is no clear association with the number of casualties among cyclists and
pedestrians.
    In the interpretation of the results, it is important to note that our study comes with limitations. We

                                                           6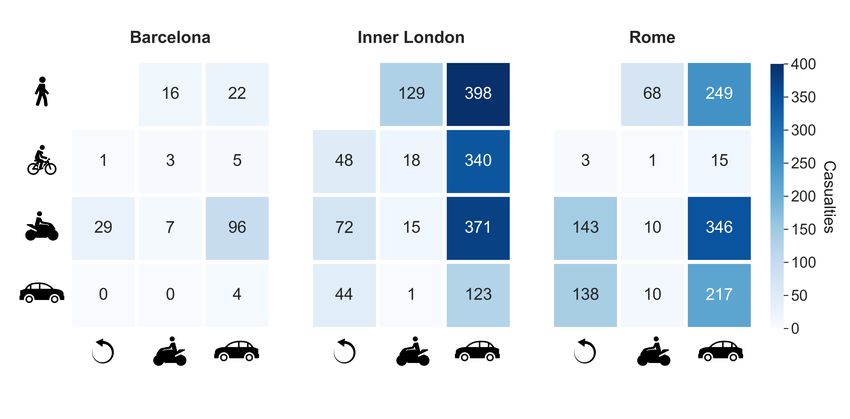
Figure 6: Collisions involving cars: maps of the collisions and performance of the models.. Maps are showing
the reported numbers of car/taxi occupants killed or seriously injured in a crash among cars or in a single-vehicle crash,
normalized by population. Scatter plots show the corresponding prediction results. Panel C (left) refers to car occupants
from a car-car crash, while panel D (right) refers to those from a single-vehicle crash. Colours correspond to those seen
in Fig. 3. Sheffield has the highest KSI rates among car occupants, doubling the KSI rates of Birmingham. Prediction
results showed adjusted R2 “ 0.302 for panel C and adjusted R2 “ 0.471 for panel D.

extracted urban features such as city area, protected cycle paths, and low-speed limited zones, from the vol-
unteered geographic information platform OpenStreetMap using OSMnx [7]. Collecting data in this way, we
were only able to access the most up-to-date information in each city but we are missing historical records of
the urban features under study, thus limiting the investigation of causal effects between the temporal evolu-
tion of infrastructures and road injuries. Nevertheless, these crowdsourced data, which have been shown to be
reliable and relatively complete in the Western world [40, 41], allowed us to provide an insightful overview of
the relationship between rate of collisions and urban infrastructure. They also have been successfully used in
similar urban data science contexts, as in cycling injury analysis [25], in bicycle network analysis [42, 43, 44],
or in estimating traffic disruption patterns [45]. Apart from novel data sources, also state-of-the-art machine
learning methods are currently innovating in road safety research, e.g. with decision trees or neural networks
[46, 47, 48, 49].
    Another limitation of our study lies in the heterogeneity of the data collection process across countries. We
focused on the KSI statistics as their definition is rather uniform in Europe, however, the collection of crash data
may not be consistent in all countries and in particular deaths or serious injuries of vulnerable road users may
go underreported [50, 12]. Several efforts are currently in place to harmonize the collection of KSI numbers in
Europe, for instance the maintenance of the CARE database, a community database on road crashes resulting

                                                            7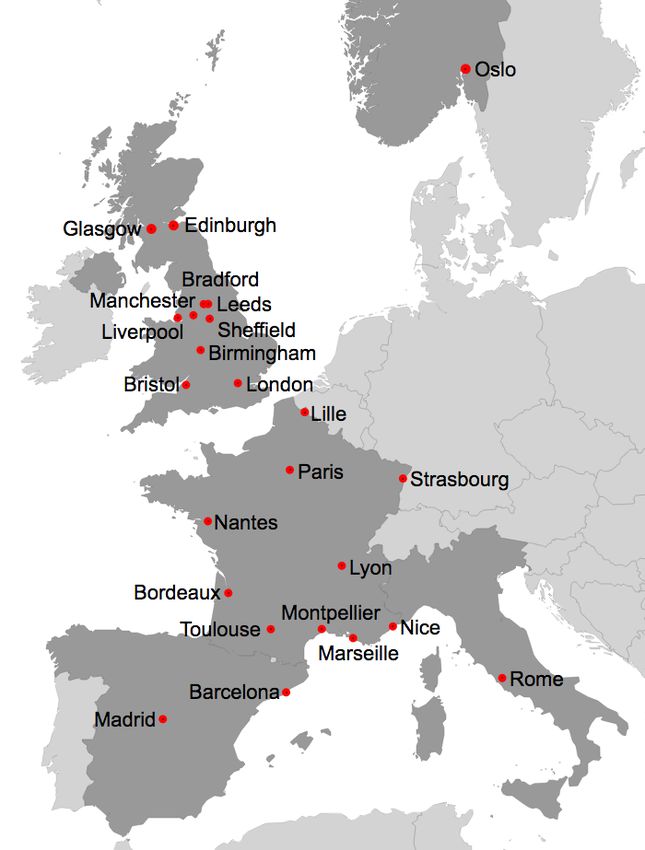
in death or injury for Europe [51].
    Further, by definition our findings of statistical associations cannot distinguish cause and effect nor identify
possible confounding factors that are not part of the data sets, and we were forced to work with a sample size
of 24 cities in no more than 5 countries, due to limitations in publicly available road crash data detailed enough
for our ecological analysis approach. In particular, our focus on multiple cities and modes implied restriction of
the data to a common denominator, thus excluding possible additional exposure data such as driven kilometers
as such data are not publicly available for multiple cities and modes.
    Finally, we focused on the potential impact of urban features on the injuries of the most vulnerable road
users, however the introduction of additional socioeconomic factors into the model, such as per capita income,
per capita expenditure on alcohol, or age cohorts [52, 53], could increase its predictive power and better explain
the reported KSI rates by user groups in European cities.
    In recent years, several European countries have developed national walking and cycling strategies aimed at
improving pedestrian and cyclist safety. However, only six European countries have drafted a national walking
strategy and among them, only Finland and Luxembourg have defined a target for increasing the walking modal
share [50]. Our results suggest that setting concrete targets for increasing modal shares of walking and cycling
represents an effective strategy toward more sustainable and safer cities.

4     Methods
Data collection
We used data from various sources shown in Table S1. Data on road crashes were downloaded from the open
data portals, with the exception of the data for Oslo, which was provided by the Norwegian Public Roads
Administration upon request. Road crash statistics relate to personal injury crashes on public roads that were
reported to the police in 2018. Population estimates for the same year were collected from the corresponding
National Statistics Office of each country.
    Data on urban features were downloaded from OpenStreetMap (OSM), a free, editable map of the world,
built by volunteers. We used OSMnx, a Python package for modelling, projecting, visualization, and analysis
of real-world street networks from OSM’s APIs [7], to collect the following urban features:

    • City area in km2 . We selected the administrative surface of a city.
    • Driving area in km. We selected all the drivable streets by choosing drive as network type.
    • Cycling area in km. We selected all the protected cycling paths by choosing bike as network type and
      by specifying related custom filters.

    • Speed limited area in km. We selected all the streets with speed limit of ď 30 km{h or ď 20 mi{h by
      choosing drive as network type and by specifying related custom filters.
   Modal share percentages in walking, cycling, public transport and motor vehicles were gathered from the
European Platform on Mobility Management (EPOMM), a network of governments in European countries,
represented by the Ministries responsible for Mobility Management. They developed The EPOMM Modal Split
Tool (TEMS) with comparable modal split data from European cities with more than 100.000 inhabitants.
   From the extracted urban features and population data we calculated the first three features, out of seven
used for our analysis:
    1. City density. Population per km2 .
    2. Cycling area share. The ratio of cycling area and driving area.

    3. Speed limit area share. The ratio of speed limited area and driving area.
    4. Walking mode share in percent.
    5. Cycling mode share in percent.

    6. Public transport mode share in percent.
    7. Motor vehicles mode share in percent.

                                                         8
Casualty matrix
Raw data on road crashes was cleaned and transformed to show only relevant information used for the casualty
matrix calculation. Each row of the cleaned data set corresponds to a unique casualty, while columns contain
the following details:
• Crash Index. Unique index for each crash, used to connect vehicles and casualties to the corresponding
crash.
• Date.
• Number of Vehicles. Total count of vehicles in a crash.
• Number of Casualties. Total count of casualties in a crash.
• Vehicle Reference. Reference to each vehicle in a crash, used to connect vehicles with the corresponding
casualty.
• Vehicle Type. Options: Bicycle, Powered Two-Wheeler (PTW), Car/Taxi, Bus/Coach, Goods Vehicle
or Other Vehicles.
• Casualty Reference. Reference to each casualty in a crash, used to connect casualties with the corre-
sponding vehicle.
• Casualty Class. Options: Driver, Passenger, Pedestrian.
• Casualty Type. Options: Pedestrian, Cyclist, PTW occupant, Car/Taxi occupant, Bus/Coach occupant,
Goods Vehicle occupant or Other Vehicles occupant.
• Casualty Severity. Options: killed (on spot or died within 30 days of the crash), seriously injured
(hospitalized for ą24 hours) or slightly injured (hospitalized for ď24 hours).
Casualty Type information was available only in the UK data set which made the casualty matrix calculation
easier, so we also formed this column in the rest of the data sets based on the Casualty Class and Vehicle Type
columns. This enabled us to base our analysis on the number of inter-mode casualties, instead of the common
approach focusing on the total number of casualties per each type [36]. For example, a pedestrian casualty
from a crash between two cars and a pedestrian was counted as a pedestrian injured in a pedestrian-car crash.
Similarly, an injured car occupant from a crash with four cars was counted as a car occupant injured in an
car-car crash. Regarding the casualty severity levels, casualties with slight injuries were removed from the data
set and only killed or seriously injured (KSI) people were observed. We eliminated casualties from crashes with
ą2 different parties involved (including pedestrians), as they represented ď2% of total KSI casualties in each
city, which aligns with previous research [46]. Also, all the crashes with missing relevant data (mentioned above)
were not taken into account.
From the newly created data set, we formed two pivot tables, one with Vehicle Type counts as columns,
and another one with Casualty Type counts as columns. This time, each row of both tables corresponded to a
unique crash. These two tables were joined into a single table based on Crash Index and we queried them twice
for all possible casualty-vehicle pairs – at first for only fatal casualties and then for the seriously injured ones.
These counts were used to create the KSI casualty matrix for each city. Rows of the matrix represent casualty
types, while columns represent vehicle types. Finally, each matrix cell represents the number of casualties from
one casualty-vehicle pair. For the next steps, we observed only the following six casualty-vehicle pairs from the
casualty matrix (we chose the pairs with median value ą 5):
• pedestrian - car (pedestrians killed or seriously injured in a crash between pedestrians and cars/taxis).
• cyclist - car (cyclists killed or seriously injured in a crash between bicycles and cars/taxis).
• PTW - itself (PTW occupants killed or seriously injured in a single-vehicle crash).
• PTW - car (PTW occupants killed or seriously injured in a crash between PTWs and cars/taxis).
• car - itself (car/taxi occupants killed or seriously injured in a single-vehicle crash).
• car - car (car/taxi occupants killed or seriously injured in a crash between two or more cars/taxis).
9Predicting the number of casualties
We used multiple linear regression to explain the potential relations between the urban features (7 input vari-
ables) and the number of inter-mode casualties (6 target variables), resulting in six linear models. The input
variables were standardized by scaling variance to one and centering mean to zero. The target variables were
firstly normalized by population (per 1 million inhabitants) and then standardized the same way as the input
variables. In order to perform variable selection, we used Lasso regression [54], defined as:
β̂lasso pαq “ argminβ ||y ´ Xβ||22 ` α||β||1
where y is the number of inter-mode casualties for the observed pair, X is a matrix of urban features for each
city, α is the penalty parameter and β is a vector of regression coefficients.
Variables were chosen with the following setup: Lasso as the estimator, 1000 α values spaced evenly on a log
scale within the interval [10´1 , 100 ], 3-fold cross-validation and mean squared error as the scoring method. The
search found the best estimator (the best α value), which we used to fit the data and identify the important
variables. The prediction with selected variables was performed using the ordinary least squares (OLS) model
and 3-fold cross-validation.
The selected variables were used for the final ordinary least squares regression. We performed inverse
transformation to scale back the data to the original representation. This pipeline was repeated for all six linear
models. Results for four of them (pedestrians injured by a car or taxi, cyclists injured by a car or taxi, car or
taxi occupants injured on their own and car or taxi occupants injured by another car or taxi) are discussed in
details in section 2.
Data availability
Computed inter-mode road crashes data and urban features for 24 cities, used in this study, are available at:
https://github.com/klnmrn/urbanroadsafety. Other data sources are reported in Table S1.
Code availability
The Python code developed for the data analysis is available at: https://github.com/klnmrn/urbanroadsafety.
Acknowledgments
We acknowledge the support of the Lagrange Project funded by the CRT Foundation. We thank Monica
Knoblauch Brathaug from the Norwegian Public Roads Administration for the data provided. We also thank
Geoff Boeing for helpful comments concerning OSMnx. Transportation icons designed by Freepik.
Author contributions
M.K. acquired and processed the data. All authors contributed to the conception and design of the work,
analysis and interpretation of the data, and drafted the work.
References
[1] Global status report on road safety 2018. World Health Organization, 2018.
[2] United Nations General Assembly. Transforming our world: The 2030 agenda for sustainable development.
a/res/70/1. Technical report, United Nations General Assembly, 2015.
[3] European Commission. EU road safety policy framework 2021-2030 - next steps towards ”vision zero”.
Technical report, European Commission, 2019.
[4] M Khayesi. Vulnerable road users or vulnerable transport planning? front. sustain. Cities, 2:25, 2020.
[5] Jacqueline M Klopp and Danielle L Petretta. The urban sustainable development goal: Indicators, com-
plexity and the politics of measuring cities. Cities, 63:92–97, 2017.
[6] Roni Utriainen, Markus Pöllänen, and Heikki Liimatainen. Road safety comparisons with international
data on seriously injured. Transport Policy, 66:138–145, 2018.
10[7] Geoff Boeing. OSMnx: New methods for acquiring, constructing, analyzing, and visualizing complex street
networks. Computers, Environment and Urban Systems, 65:126–139, 2017.
[8] Bernd Resch and Michael Szell. Human-centric data science for urban studies. ISPRS International Journal
of Geo-Information, 8(584), 2019.
[9] Darren Walton, Dan Jenkins, Roselle Thoreau, Simon Kingham, and Michael Keall. Why is the rate of
annual road fatalities increasing? A unit record analysis of New Zealand data (2010–2017). Journal of
Safety Research, 72:67–74, 2020.
[10] Vı́ctor Cantill, Luis Márquez, and Carmelo J. Dı́az. An exploratory analysis of factors associated with
traffic crashes severity in Cartagena, Colombia. Accident Analysis & Prevention, 146, 2020.
[11] Grigorios Fountas, Achille Fonzone, Niaz Gharavi, and Tom Ryez. The joint effect of weather and lighting
conditions on injury severities of single-vehicle accidents. Analytic Methods in Accident Research, 27, 2020.
[12] Piotr Olszewski, Piotr Szagala, Daniel Rabczenko, and Anna Zielińska. Investigating safety of vulnerable
road users in selected EU countries. Journal of Safety Research, 68:49–57, 2019.
[13] Michael Branion-Calles, Thomas Götschi, Trisalyn Nelson, Esther Anaya-Boig, Ione Avila-Palencia, Al-
berto Castro, Tom Cole-Hunter, Audrey de Nazelle, Evi Dons, Mailin Gaupp-Berghausen, Regine Gerike,
Luc Int Panis, Sonja Kahlmeier, Mark Nieuwenhuijsen, David Rojas-Rueda, and Meghan Winters. Cy-
clist crash rates and risk factors in a prospective cohort in seven European cities. Accident Analysis and
Prevention, 141, 2020.
[14] Wouter Van den Berghe, Michael Schachner, Veronica Sgarra, and Nicola Christie. The association between
national culture, road safety performance and support for policy measures. IATSS Research, 44:197–211,
2020.
[15] Hamid Safarpour, Davoud Khorasani-Zavareh, and Reza Mohammadi. The common road safety approaches:
A scoping review and thematic analysis. Chinese Journal of Traumatology, 23:113–121, 2020.
[16] Dinesh Mohan, Geetam Tiwari, Mathew Varghese, Kavi Bhalla, Denny John, Ashrita Saran, and Howard
White. PROTOCOL: Effectiveness of road safety interventions: An evidence and gap map. Campbell
Systematic Reviews, 16, 2020.
[17] Faan Chen, Jingyang Lyu, and Tianye Wang. Benchmarking road safety development across OECD coun-
tries: An empirical analysis for a decade. Accident Analysis and Prevention, 147, 2020.
[18] Stéphanie Blaizot, Francis Papon, Mohamed Mouloud Haddak, and Emmanuelle Amoros. Injury incidence
rates of cyclists compared to pedestrians, car occupants and powered two-wheeler riders, using a medical
registry and mobility data, Rhône County, France. Accident Analysis and Prevention, 58:35–45, 2013.
[19] Ghazal Batouli, Manze Guo, Bruce Janson, and Wesley Marshall. Analysis of pedestrian-vehicle crash
injury severity factors in Colorado 2006–2016. Accident Analysis and Prevention, 148, 2020.
[20] George Yannis, Dimitrios Nikolaou, Alexandra Laiou, Yvonne Achermann Stürmer, Ilona Buttler, and Dag-
mara Jankowska-Karpa. Vulnerable road users: Cross-cultural perspectives on performance and attitudes.
IATSS Research, 44:220–229, 2020.
[21] A. Värnild, P. Tillgren, and P. Larm. What types of injuries did seriously injured pedestrians and cyclists
receive in a Swedish urban region in the time period 2003–2017 when Vision Zero was implemented? Public
Health, 181:59–64, 2020.
[22] Lynn B. Meuleners, Michelle Fraser, Marilyn Johnson, Mark Stevenson, Geoffrey Rose, and Jennie Ox-
ley. Characteristics of the road infrastructure and injurious cyclist crashes resulting in a hospitalisation.
Accident Analysis and Prevention, 136, 2020.
[23] Mariana Vilaca, Nélia Silva, and Margarida C. Coelho. Statistical Analysis of the Occurrence and Severity
of Crashes Involving Vulnerable Road Users. Transportation Research Procedia, 20:1113–1120, 2017.
[24] Marco Te Brömmelstroet. Framing systemic traffic violence: media coverage of dutch traffic crashes.
Transportation research interdisciplinary perspectives, 5:100109, 2020.
[25] Rachel Aldred, Anna Goodman, John Gulliver, and James Woodcock. Cycling injury risk in London: A
case-control study exploring the impact of cycle volumes, motor vehicle volumes, and road characteristics
including speed limits. Accident Analysis & Prevention, 117:75–84, 2018.
11[26] Rachel Aldred, Susana Garcı́a-Herrero, Esther Anaya, Sixto Herrera, and Miguel Ángel Mariscal. Cyclist
injury severity in Spain: a Bayesian analysis of police road injury data focusing on involved vehicles and
route environment. International journal of Environmental Research and Public Health, 17(1):96, 2020.
[27] Rul von Stülpnagel and Jonas Lucas. Crash risk and subjective risk perception during urban cycling:
Evidence for congruent and incongruent sources. Accident Analysis and Prevention, 142, 2020.
[28] Hongliang Ding, N.N. Sze, Haojie Li, and Yanyong Guo. Roles of infrastructure and land use in bicycle
crash exposure and frequency: T A case study using Greater London bike sharing data. Accident Analysis
and Prevention, 144, 2020.
[29] Jaimy Fischer, Trisalyn Nelson, Karen Laberee, and Meghan Winters. What does crowdsourced data tell
us about bicycling injury? A case study in a mid-sized Canadian city. Accident Analysis and Prevention,
145, 2020.
[30] Germán A. Carvajal, Olga L. Sarmiento, Andrés L. Medaglia, Sergio Cabrales, Daniel A. Rodrı́guez, D. Alex
Quistberg, and Segundo López. Bicycle safety in Bogotá: A seven-year analysis of bicyclists’ collisions and
fatalities. Accident Analysis and Prevention, 144, 2020.
[31] Rebecca Ling, Linda Rothman, Marie-Soleil Cloutier, Colin Macarthur, and Andrew Howard. Cyclist-
motor vehicle collisions before and after implementation of cycle tracks in Toronto, Canada. Accident
Analysis and Prevention, 135, 2020.
[32] Sareh Bahrololoom, William Young, and David Logan. Modelling injury severity of bicyclists in bicycle-car
crashes at intersections. Accident Analysis and Prevention, 144, 2020.
[33] Wesley E. Marshall and Nicholas N. Ferenchak. Why cities with high bicycling rates are safer for all road
users. Journal of Transport & Health, 13:285–301, 2019.
[34] Felipe E. Pedroso MD MPH, Federico Angriman MD MPH, Alexandra L. Bellows BS, and Kathryn Taylor
PhD. Bicycle Use and Cyclist Safety Following Boston’s Bicycle Infrastructure Expansion, 2009–2012. Am
J Public Health, 106:2171–2177, 2016.
[35] Jessica B. Cicchino, Melissa L. McCarthy, Craig D. Newgard, Stephen P. Wall, Charles J. Di Maggio,
Paige E. Kulie, Brittany N. Arnold, and David S. Zuby. Not all protected bike lanes are the same:
Infrastructure and risk of cyclist collisions and falls leading to emergency department visits in three U.S.
cities. Accident Analysis and Prevention, 141, 2020.
[36] A Santacreu. Cycling Safety: Summary and Conclusions of the ITF Roundtable on Cycling Safety, 29-30
January 2018, Paris. 2018.
[37] ITF. Road Safety in European Cities: Performance Indicators and Governance Solutions. Technical report,
International Transport Forum Policy Papers, No. 67, OECD Publishing, Paris, 2019.
[38] Peter L Jacobsen. Safety in numbers: more walkers and bicyclists, safer walking and bicycling. Injury
prevention, 9(3):205–209, 2003.
[39] Anders Hartmann and Sarah Abel. How Oslo achieved zero. ite journal, pages 32–38, 2020.
[40] Mordechai Haklay. How good is volunteered geographical information? A comparative study of Open-
StreetMap and Ordnance Survey datasets. Environment and planning B: Planning and design, 37(4):682–
703, 2010.
[41] Christopher Barrington-Leigh and Adam Millard-Ball. The world’s user-generated road map is more than
80% complete. PloS one, 12(8):e0180698, 2017.
[42] Luis E. Olmos, Maria Sol Tadeo, Dimitris Vlachogiannis, Fahad Alhasoun, Xavier Espinet Alegre, Catalina
Ochoa, Felipe Targa, and Marta C. González. A data science framework for planning the growth of bicycle
infrastructures. Transportation Research Part C, 115, 2020.
[43] Luis Guillermo Natera Orozco, Federico Battiston, Gerardo Iñiguez, and Michael Szell. Extracting the
multimodal fingerprint of urban transportation networks. Transport Findings, 13171, 2020.
[44] Luis Guillermo Natera Orozco, Federico Battiston, Gerardo Iñiguez, and Michael Szell. Data-driven strate-
gies for optimal bicycle network growth. Royal Society Open Science, 7(201130), 2020.
[45] Chico Q Camargo, Jonathan Bright, Graham McNeill, Sridhar Raman, and Scott A Hale. Estimating
traffic disruption patterns with volunteered geographic information. Scientific reports, 10(1):1–8, 2020.
12[46] Gabriele Prati, Luca Pietrantoni, and Federico Fraboni. Using data mining techniques to predict the
severity of bicycle crashes. Accident Analysis and Prevention, 101:44–54, 2017.
[47] Alfonso Montella, Rocı̀o de Oña, Filomena Mauriello, Maria Rella Riccardi, and Giuseppe Silvestro. A
data mining approach to investigate patterns of powered two-wheeler crashes in Spain. Accident Analysis
and Prevention, 134, 2020.
[48] Le Yu, Bowen Du, Xiao Hu, Leilei Sun, Liangzhe Han, and Weifeng Lv. Deep spatio-temporal graph
convolutional network for traffic accident prediction. Neurocomputing, 423:135–147, 2021.
[49] Jeremiah Roland, Peter D. Way, Connor Firat, Thanh-Nam Doan, and Mina Sartipi. Modeling and
predicting vehicle accident occurrence in Chattanooga, Tennessee. Accident Analysis and Prevention, 149,
2021.
[50] Dovilé Adminaité-Fodor and Graziella Jost. How safe is walking and cycling in Europe? PIN Flash
Report 38, European Transport Safety Council, January 2020.
[51] Robert Bauer, Klaus Machata, Christian Brandstaetter, George Yannis, Alexandra Laiou, and Katerina
Folla. Road traffic accidents in european urban areas. In Proceedings of the 1st European Road Infrastructure
Congress, Leeds, UK, pages 18–20, 2016.
[52] Robert B Noland and Mohammed A Quddus. Analysis of pedestrian and bicycle casualties with regional
panel data. Transportation research record, 1897(1):28–33, 2004.
[53] Paraskevas Nikolaou, Katerina Folla, Loukas Dimitriou, and George Yannis. European countries’ road
safety evaluation by taking into account multiple classes of fatalities. Transportation research procedia,
52:284–291, 2021.
[54] Robert Tibshirani. Regression Shrinkage and Selection via the Lasso. Journal of the Royal Statistical
Society: Series B (Methodological), 58(1):267–288, 1996.
13Supplementary Information
This is the supplementary information for the manuscript Identifying urban features for vulnerable road user
safety in Europe by Marina Klanjčić, Laetitia Gauvin, Michele Tizzoni, and Michael Szell, containing a supple-
mentary table and figures.
1Table S1: List of sources of collision data.
City Source Ref.
Barcelona Barcelona City Hall https://opendata-
ajuntament.barcelona.cat/data/
en/dataset?q“accidents&sort“
fecha publicacion`desc
Madrid City Council of Madrid https://datos.madrid.es/
sites/v/index.jsp?vgnextoid“
7c2843010d9c3610VgnVCM2000001f4a900aRCRD&
vgnextchannel“
374512b9ace9f310VgnVCM100000171f5a0aRCRD
Oslo Norwegian Public Roads Administration Received upon request.
Rome Municipality of Rome https://dati.comune.roma.it/catalog/
dataset/d655
Cities in France Ministry of Interior https://www.data.gouv.fr/fr/datasets/
bases-de-donnees-annuelles-des-
accidents-corporels-de-la-circulation-
routiere-annees-de-2005-a-2019/
Cities in the United Kingdom Department for Transport https://data.gov.uk/dataset/cb7ae6f0-
4be6-4935-9277-47e5ce24a11f/road-
safety-data
2Figure S1: Casualty matrices of all cities and all transport modes
3Figure S2: Urban features across cities
4Figure S3: Modal shares across cities
5Figure S4: Urban features do not account for the road safety of powered two-wheelers. Maps are showing the
reported numbers of powered two-wheeler occupants killed or seriously injured in a road crash, normalized by population.
Scatter plots show the corresponding prediction results. Panel E (left) refers to PTW occupants hit by a car, panel F
(right) refers to PTW occupants from single-vehicle PTW crashes. Marseille, Rome and Nice have the highest KSI rates
among PTW occupants. Lasso regression for the panel E did not select any variables, so the prediction results showed
adjusted R2 “ 0, while for the panel F, results showed adjusted R2 “ 0.067.
6You can also read