Conservative News Media and Criminal Justice: Evidence from Exposure to Fox News Channel - Elliott Ash
←
→
Page content transcription
If your browser does not render page correctly, please read the page content below
Conservative News Media and Criminal Justice:
         Evidence from Exposure to Fox News Channel∗

                       By Elliott Ash and Michael Poyker

          Exposure to conservative news causes judges to impose harsher
          criminal sentences. Our evidence comes from an instrumental
          variables analysis, where randomness in television channel posi-
          tioning across localities induces exogenous variation in exposure
          to Fox News Channel. These treatment data on news viewership
          are taken to outcomes data on almost 7 million criminal sentenc-
          ing decisions in the United States for the years 2005–2017. Higher
          Fox News viewership increases incarceration length, and the effect
          is stronger for black defendants and for drug-related crimes. The
          effect is observed for elected, and not appointed, judges, consistent
          with voter attitudes as a potential mechanism. The effect becomes
          weaker as judges get closer to election, suggesting a diminishing
          marginal effect for judges who are already politically engaged.
          JEL: D72, H76, K41, L82
          Keywords: Partisan Media, Judge Elections, Incarceration, Racial
          Bias

  ∗ Elliott Ash: ETH Zürich, ashe@ethz.ch; Michael Poyker (corresponding author): Columbia Uni-
versity, mp3780@columbia.edu. We are grateful to Sergio Galletta and Greg Martin for help with un-
derstanding the datasets. We thank seminar participants at CMU Heinz and ETH Zürich for helpful
comments. We thank David Cai and Romina Jafarian for helpful research assistance. All errors are ours.
                                                  1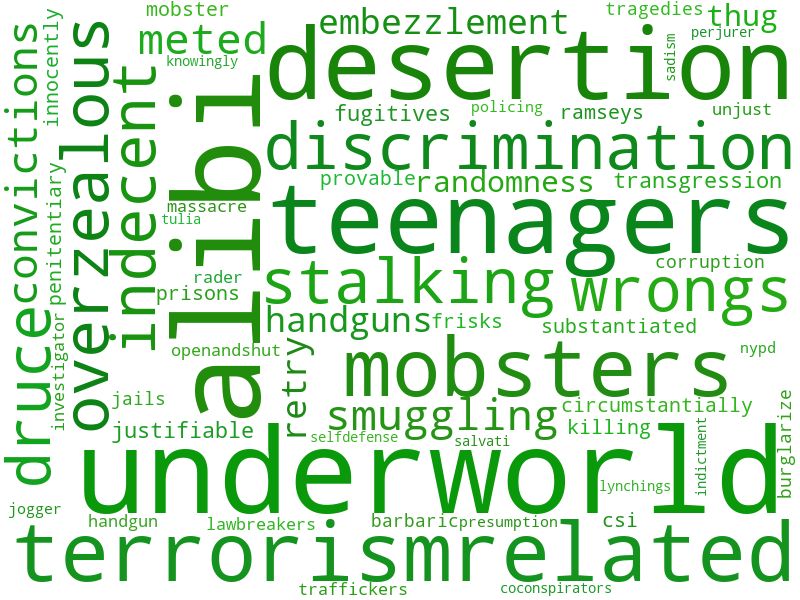
I.   Introduction

   A recent literature has documented that greater exposure to partisan televi-
sion news has an impact on voting in presidential elections (DellaVigna and Ka-
plan, 2007; Martin and Yurukoglu, 2017) and congressional position-taking (Clin-
ton and Enamorado, 2014; Arceneaux et al., 2016). An unexamined question is
whether partisan news would have an effect on judge decision-making. The goal
of this paper is to provide the first evidence on this issue.
   If judges are apolitical and make their decisions without regard to outside in-
fluences, partisan news exposure should have no effect (see, e.g., Posner, 2008;
Epstein, Landes and Posner, 2013). But recent empirical work has documented
that judges do respond to non-legal influences, political and otherwise (Berdejó
and Yuchtman, 2013, Ash and MacLeod, 2015, 2017, Chen, Moskowitz and Shue,
2016, Berdejó and Chen, 2017, and Cohen and Yang, 2018). In addition, there
is evidence suggesting that the judiciary has become more conservative over time
(e.g., Ash, Chen and Naidu, 2017, Ash, Chen and Lu, 2017). This research asks
whether we can attribute a causal influence to partisan news media in this trend.
   The empirical context is criminal courts in U.S. states for the years 2005 through
2017. We use combined microdata on criminal sentencing decisions from the
National Corrections Reporting Program (hereafter, NCRP) and a unique dataset
with the universe of sentencing decisions linked to judge biographies from ten
states (Poyker and Dippel, 2019), paired with data on cable news viewership at the
county level. The measure of conservative news exposure is Fox News viewership
(relative to other cable news networks), where exogenous variation comes from the
channel positioning of Fox News across counties. As demonstrated in Martin and
Yurukoglu (2017), this channel-number variation can be used as an instrument
for TV viewership across channels.
   We replicate the strong first stage from Martin and Yurukoglu (2017) at the
county level in our sample of states. We document that current Fox channel posi-
tion is unrelated to preexisting markers for conservative policy, such as historical
Republican vote shares, past crime rates, or past sentencing rates.
   We use the first-stage prediction for Fox News viewership to estimate the impact
on criminal sentencing outcomes in a two-stage-least-squares (2SLS) framework.
We find that an exogenous increase in Fox News exposure is associated with an
increase in criminal sentence length. We find no effect on the extensive margin;
i.e., probability of being sent to prison. The result is robust to the inclusion of rich
demographic controls and case controls, and to including controls for viewership
of other cable news networks (CNN and MSNBC). In heterogeneity analysis,
we find that the effect is larger for black defendants than for white or Hispanic
defendants; the effect is larger for drug-related crimes.
   We investigate three potential mechanisms that may explain this effect. First,
media could affect legislators (either directly or through voter preferences), which
would result in harsher laws. We can rule this out in our context because
our empirical specification uses state-year interacted fixed effects, as well as
                                           2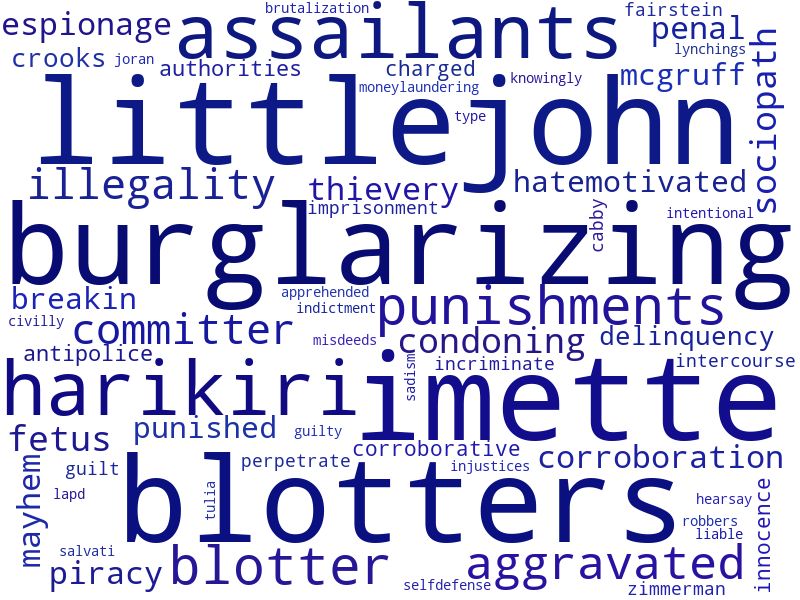
state-specific crime and recidivism characteristics, which would absorb any state-
specific changes in legislation.

   Second, the effect could work through judges, either by changing judge pref-
erences or — for elected judges — by changing voter preferences. Voters might
become more conservative due to Fox News exposure, and in particular due to me-
dia attention on felony cases. Meanwhile, lawyers/prosecutors put active pressure
on judges threatening to find candidates to displace them (Berdejó and Yuchtman,
2013); that would increase electoral pressures on judges to be harsher in sentenc-
ing decisions. To distinguish direct judge effects from voter preferences effects,
we run regressions separately for elected and appointed judges. The appointed
judges have tenure, and therefore face minimal political pressures once in office.
We find that Fox News increases sentencing only for elected judges, and not for
appointed judges. We also use within-state variation in judge selection process in
Kansas to show that the effect exists only in counties with elected judges. These
results are consistent with voter attitudes providing a possible mechanism for our
effects. However, we find evidence that Fox News has a smaller effect on judges
that are closer to election, suggesting that electoral pressures are substitutable
(rather than complementary) with partisan media pressures.

   The election evidence also provides evidence against a third mechanism – that
media influences criminal sentencing through other actors in the criminal justice
system, notably police or prosecutors. That is, police officers after watching too
much Fox News might arrest more people or focus on more serious crimes, while
prosecutors might become more aggressive in charging decisions. Our evidence
for an effect only under judicial elections is inconsistent with a “policing” channel,
which we would expect to work in all states. We also do not find effects of Fox
News on factors that can be affected by police and prosecutors but not judges:
i.e., the number or types of charges that defendants face.

  These results will be of interest to scholars in empirical political economy, and
in particular for those who study courts and the mass media (e.g., Lim, Snyder Jr
and Strömberg, 2015). Building on the cross-sectional evidence for a partisan
gap in racial sentencing disparities (Cohen and Yang, 2018), our estimates have
a causal interpretation for shifts in ideology. The findings are relevant to recent
debates on how judges should be selected, retained, and compensated (Epstein,
Landes and Posner, 2013; Ash and MacLeod, 2017), along with recent debates on
polarization and media regulation (Boxell, Gentzkow and Shapiro, 2017; Allcott
and Gentzkow, 2017). More generally, this research is related to the literature
on partisan slant, media coverage, and political accountability (Gentzkow and
Shapiro, 2010; Snyder and Stromberg, 2010). We provide causal evidence that
incentives of elected judges are distorted as they cater to voters as politicians,
rather than operating on facts and laws (Kessler and Piehl, 1998).
                                          3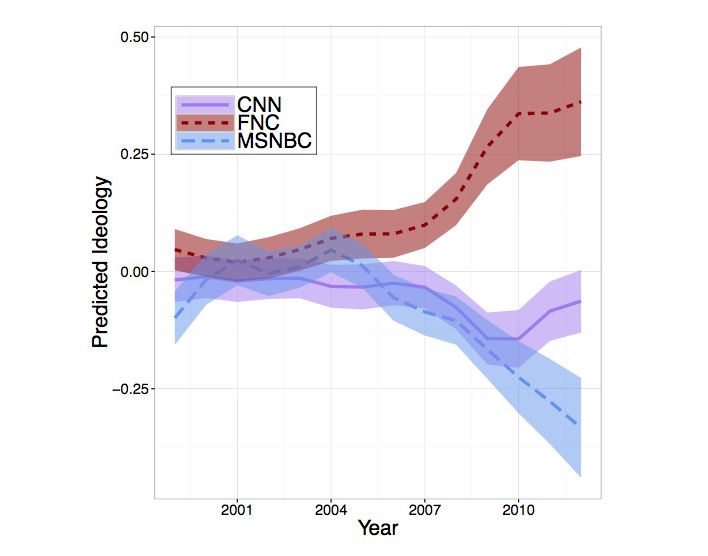
II. Background
This paper is motivated by previous evidence that Fox News is conservative,
and the ongoing discourse on how conservative media impact social attitudes and
policy outcomes. Figure 1 shows three pieces of evidence on this point. First,
Panel A, from Martin and Yurukoglu (2017), shows that Fox News tends to use
politicized phrases associated with Republican politicians. Second, in Panel B,
we see that for the years 2005–2008, Fox speakers mention crime more often
than speakers on CNN and MSNBC.1 Third, in Panel C, we show in our data
that places with higher Fox News ratings share tend to impose longer criminal
sentences.2
An additional piece of cross-sectional evidence on how Fox News is related to
criminal justice is reported in Panel D. To make this graph, we produced average
sentence length metrics by court. We then plotted the trends in sentence length
separately by quartiles in Fox News viewership (for the years 2005–2008). We can
see that in the places with more Fox News viewership, there was a much larger
jump in sentencing lengths starting in 2009. This is some striking descriptive
evidence that places with more Fox News exposure had harsher criminal justice
outcomes. The question, for this paper, is whether this correlation in the courts
is due to a causal link.
To better understand the crime-related discourse of Fox News, we used natural
language processing tools to understand the language associations in cable news
shows. We trained word2vec, a popular word embedding model (Mikolov et al.,
2013), on transcripts for Fox, CNN, and MSNBC, for the years 2001 through
2013. This model works by reading through sentences and locating words close
to each other in a vector space if they tend to occur in similar contexts (that
is, windows of neighboring words). Similarity between words can then be mea-
sured using the cosine of the angle between the vector representations of each
word. In the transcripts data, the most similar words to “crime” were “crimes,”
“murder,” “homicide,” “perpetrator,” “felonies,” and other synonyms or closely
related terms.
What is most interesting for our purposes is the differences in word associations
across the networks. To get the crime words most associated for Fox News, for
example, we take the Fox cosine similarity and divide by the average of the
similarities for CNN and MSNBC. We computed a symmetric measure for CNN
and MSNBC. We then ranked the most associated words for each network.
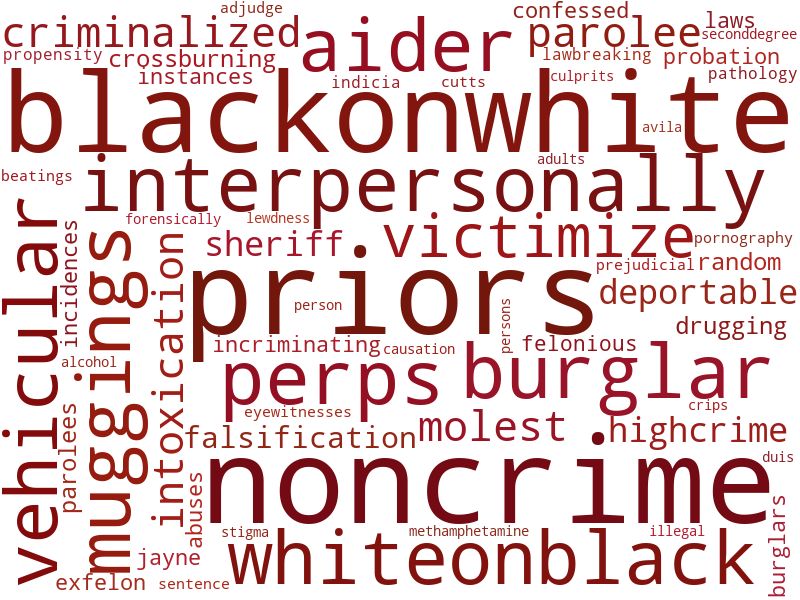
Word clouds illustrating the most crime-associated words for each of the three
networks are reported in Figure 2. The results are striking. One can see imme-
1 These are counts of “crime,” “criminal,” “murder,” and “homicide,” divided by the number of spoken
sentences, in transcripts for prime time shows for each network.
2 We don’t take a position on whether Fox News policy advocacy is “biased” away from some optimum;
we are only speaking relative to the CNN and MSNBC reference point. In addition, we don’t take a
position on the motivations underlying this advocacy; it could be due to political motivations, due to
trying to get more viewers, or for other reasons.
4diately in Panel A that at Fox, discourse on crime is racialized. The highest-
associated term is “black-on-white”, and “white-on-black” is also highly ranked.
Other words seem to personalize crime victimization: “victimize,” “muggings.”
They also arguably demean the accused: “perps” and “priors.”
Panel A Panel B
.015
Proportion of Speakers Mentioning Crime
0 .005 .01
2005 2006 2007 2008
Year
CNN FOX
MSBC
Panel C Panel D
Figure 1. Fox News is Conservative and Correlates with Sentencing Length
Note: Illustrations for Fox News conservatism. Panel A is predicted ideology based on political
phrases used by Republicans and Democrats. Panel B is the number of references to crime
per sentence spoken in cable news transcripts. Panel C is a binscatter for the OLS correlation
between incarceration length and Fox Nielsen rating. Figures B, B, and B contain results for
CNN and MSNBC. Panel D correlates Fox News consumption and average sentence length; the
figure shows average sentence length in top 25%, bottom 25%, and middle 50% of the counties
by Fox News consumption.
The word clouds for CNN (Panel B) and MSNBC (Panel C) have very different
flavors. One can see that CNN focuses on criminal organizations and conspirato-
rial language: “terrorism,” “mobsters,” and “underworld.” The top terms from
MSNBC are for a rapper (“Little John”) and a particular sensational New York
City murder case from 2006 (“Imette [St. Guillen]”).
5Panel A. Most Similar Words to “Crime”: Fox News
Panel B. Most Similar Words to “Crime”: CNN
Panel C. Most Similar Words to “Crime”: MSNBC
Figure 2. Crime Discourse in U.S. Cable News Channels
Note: Most closely related terms to “crime,” in Fox, CNN, and MSNBC, respectively. Similarities
computed from word2vec models trained separately on the transcript corpora for each network.
Larger words mean the word has higher similarity for the indicated network and lower similarity
for the other two networks.
6III. Data
A. Sentencing Data
The data on sentencing come from the National Corrections Reporting Program
(ICPSR 36373, hereafter NCRP). This is a standard dataset for the literature and
it contains data for all prison admissions in the United States from 2000 to 2014.
This dataset has several important characteristics that make it crucial for our
study. As it spans all U.S. states, it gives us more variation in our main explana-
tory variable at the county level. In addition, we have eight years of overlap for
our explanatory variable (2005 to 2008 and 2010 to 2014).
Our main outcome variable is the length of sentence imposed. We also use
defendant and case characteristics. The seriousness of a crime is one of the main
features of the judgment of a court, and the classification of offenses in the NCRP
is standardized. Therefore we include in our regressions a matrix of 180 fixed ef-
fects for the offense with the longest sentence length. We also include criminal
history (recidivism), education, military background, and demographic charac-
teristics, including age at conviction, gender, and race (Asian, Black, Hispanic,
Native American, White, and other).
We supplement our NCRP data with the sentencing data from Poyker and
Dippel (2019). It is superior to the NCRP’s dataset in the sense that it has
(i) case-level information on each sentencing decision; (ii) information on the
defendants that were found not guilty or did not go to prison (e.g., went on
probation); (iii) information on judges. Here, we only use data from the 10
states that have judges’ information: Alabama, Colorado, Georgia, Kentucky,
Minnesota, North Carolina, Pennsylvania, Tennessee, Virginia, and Washington.
The years covered by the convictions data vary from state to state but range from
1980 to 2017.
To construct the length of sentence imposed we assign zero for all cases in which
the defendant is found not guilty or put on probation. In the case of consecutive
sentences, those are summed. In the case of concurrent sentences, we take the
max.
The classification of offenses varies across states and trying to harmonize them
would be complex and require many subjective decisions. Therefore we include
in our regressions a separate set of offense class fixed effects for each state. Data
also contains information on recidivism and basic demographic characteristics,
including age at conviction, gender, and race.
Finally, we have information on judicial elections for a subset of states. In
Kansas, we have the list of counties where judges are elected and those that are
appointed.
B. Media Data
The data on channel positions and ratings come from Nielsen. This is an
expanded version of the dataset in Martin and Yurukoglu (2017). The data
7includes channel listings by system and year, with associated zip codes, for the
years 1998 through 2017. It includes zip code level viewership for Fox, CNN, and
MSNBC for the years 2005 through 2008. It includes Designated Market Area
(hereafter, DMA) level data on viewership for the years 2010 through 2017. The
viewership data are for all shows on the networks, so they include a collection of
“news” shows (which claim to report straight news) and “pundit” shows (which
have an acknowledged political viewpoint).3 For the text illustrations (shown
previously), we downloaded full-text transcripts of prime time shows on Fox News,
CNN, and MSNBC, from LexisNexis. For the Google Trends results, those are
downloaded from the Google Trends web site and matched on DMA.
IV. Empirical Specification and Identification
The identification strategy adopts an instrumental variables approach based on
Martin and Yurukoglu (2017). The instrument relies on exogenous variation in
where Fox News Channel appears in the channel number lineup across counties
relative to other cable news channels. Counties are the lowest-level geographical
unit for the sentencing data; in most states judicial districts are composed of
multiple counties. Throughout the paper, an observation is a sentencing decision
i that took place in county c of state s at year t.
The first-stage estimating equation is:
(1) Tct = αst + γZct + Xi(c)t β + ηi(c)t ,
where Tct is the time spent watching Fox News as a share of total television
watched (share) for county c at time t, αst includes state-year (interacted) fixed
effects,4 Zct is the channel number for Fox News, and ηi(c)t is an error term. Xi(c)t
includes other covariates describing demographics and cable system characteris-
tics. From Martin and Yurukoglu (2017) we expect a negative and significant
estimate for γ.
The second-stage estimating equation models an outcome Yi(c)t (e.g., criminal
sentencing harshness in courthouse/county c at time t) as:
(2) Yi(c)t = αst + ρTct + Xi(c)t β + i(c)t ,
where the terms are the same as in equation (1) and i(c)t is the error term. The
identification assumption is that conditional on the fixed effects and covariates,
the channel position Zct affects the outcome Yi(c)t only through Fox News view-
ership Tct . As treatment is on the county level, we cluster standard errors by
3 More precisely, the 2005–2008 ratings data is for all shows, while the 2010–2017 ratings data are for
prime time shows.
4 Note that for the 2010-2017 data sample, ratings are at the DMA level. For some states (Connecticut,
Hawaii, New Mexico, Rhode Island, Utah, Vermont, and Washington D.C.), DMAs coincide with states.
So these are effectively dropped.
8county.5
We require instrument relevance. Figure B1 Panel A shows graphical evidence
of the first-stage variation we are using. There is a clear downward trend, with
higher channel numbers having lower viewership. In the regression tables below,
we report the F-statistic of excluded instruments for each regression, and they
are consistently greater than 10.
Figure B1 Panel B shows a binscatter for the reduced form. The vertical axis
is the outcome (log incarceration length) and the horizontal axis is Fox channel
position. We can see a negative relation, reflecting that in counties with a lower
Fox channel position judges tend to be harsher in sentencing.
The reduced form is identified if the channel position is exogenous. Martin
and Yurukoglu (2017) provide a lengthy discussion and set of checks along these
lines. In our data, as in theirs, the instrument is not related to past Republican
vote shares. It is not related to past crime rates, and it is not related to past
sentencing harshness. These points all support the exogeneity assumption. Still,
in Robustness Section V.D we include these covariates as controls.
Under exogeneity, two-stage least squares procures consistent estimates for ρ
if the instrument satisfies an exclusion restriction. That is, the channel position
affects sentencing decisions only through its effect on Fox News viewership. We
feel this is a reasonable assumption in our context. In particular, we include
state-year fixed effects in all specifications to control for the changes in state-level
legislation: it allows us to rule out an effect of conservative media through changes
in legislation.
A final assumption is monotonicity. That is, a lower Fox News Channel would
not decrease Fox News viewership. Again, we feel this is a reasonable assumption
in our institutional context. Still, we have performed a series of checks to see that
the first stage is satisfied in subsets of the data.6
V. Results
This section reports the results of the regression analysis. Subsection V.A
reports the main results. Subsection V.B looks to mechanism by analyzing judicial
elections. Subsection V.C reports key heterogeneity analysis.
A. Main Results
The main results are presented in Table 1. We report OLS estimates for the
specification without controls in Column I. As we already saw in the binscatter
from the bottom panel of Figure 1, the share of Fox news viewers is positively
associated with the sentence length. Columns III and V add demographic controls
and case controls, respectively, which make the coefficient about twice as large.
5 Our results hold if we cluster by state, DMA, or by county and year. These results are available
upon request.
6 We report a histogram of the first-stage coefficients in Figure B5.
9Table 1—Fox News and Sentencing Decisions
Dependent variable: Log sentencing length in months
I II III IV V VI VII VIII IX X
Nielsen share OLS 2SLS OLS 2SLS OLS 2SLS OLS 2SLS OLS 2SLS
Fox news 0.012** 0.042 0.016*** 0.054* 0.021*** 0.075*** 0.022*** 0.070**
[0.0107] [0.1338] [0.0003] [0.0639] [0.0000] [0.0066] [0.0000] [0.0155]
Fox - (CNN+MSNBC)/2 0.020*** 0.074**
[0.0000] [0.014]
CNN 0.011** -0.004
[0.0163] [0.6629]
MSNBC 0.007 -0.007
10
[0.4972] [0.6369]
Demographic controls X X X X X X X X
Case controls X X X X X X
R-squared 0.274 0.274 0.283 0.282 0.393 0.391 0.394 0.392 0.394 0.393
Partial R-squared 0.031 0.029 0.029 0.028 0.029
F-stat. of excl. inst. 33.7 33.2 33.1 34.8 34.1
Observations 4,974,207 4,962,922 4,974,207 4,962,922 4,974,203 4,962,918 4,950,290 4,940,401 4,950,290 4,940,401
Note: All columns include state-year FEs. The dependent variable is the inverse hyperbolic sine of the sentencing length. The following
variables are used as controls: age, age squared, and race dummies (Black, Hispanic, Asian, Native American, and other), dummy for military
background, recidivists and set of crime severity and education dummies. Standard errors clustered by FIPS. P-values are in brackets. ***
pWe report 2SLS estimates without controls in Column II. While the first stage
is strong (F = 32.5), the coefficient is not statistically insignificant. In Columns
IV and VI, we again add demographic and case controls. As with OLS, adding
these controls increases the effect; with controls, the 2SLS effect is statistically
significant. Defendant characteristics and case characteristics are correlated with
Fox News viewer share, so they soak up the residual variation and strengthen
estimates. The coefficient for 2SLS is somewhat larger than for OLS, which could
be due to measurement error or to a local treatment effect. Reduced form results
are shown in Column I of Table B5.
A potential confounder in our analysis are the ratings for other cable news
networks, CNN and MSNBC. To zero in on Fox News, Columns VII and VIII
provide results with an alternative specification for viewership which is normalized
relative to CNN and MSNBC.7 Finally, Columns IX and X include CNN and
MSNBC viewer share as (non-excluded) controls. In each of these alternative
specifications, the 2SLS estimates are comparable to Column IV: positive and
statistically significant.8
These estimates are economically significant. According to the estimate from
Column X, increasing Fox News share by 1 percent would increase average sen-
tencing length by 7 percentage points (about 4 months).9 As a baseline, consider
the evidence from Cohen and Yang (2018) that in federal courts, Republican-
appointed judges give about 2-months-longer sentences on average than Democrat-
appointed judges.
B. Mechanisms: Judicial Elections
To establish the mechanism, we test whether the effect is different in states
where judges are elected versus states with appointed judges. We hypothesize
that if judges are facing election or reelection they may change their sentencing
behavior in accordance with political media messaging. Thus we split the sample
in two (with elected and appointed judges) and estimate the effect of Fox news
consumption on each subsample of states separately. Besides the sample split,
the estimation approach is the same as that from Section IV.
We test judicial elections as a possible mechanism for the observed effect in
Table 2. Column I includes the baseline specification with controls (Table 1,
Column VII) for comparison. Column II reports results for the sample of states
with appointed judges: the coefficient is negative and insignificant.10 Column III
7 It is constructed as share∗FOX = shareFOX − 21 (shareCNN + shareMSNBC ).
8 The appendix reports graphical evidence for effects of CNN and MSNBC on sentencing. We do not
see the same effects for these networks.
9 The equivalent effect for OLS (Column I) is smaller: 21 days. From the 2SLS estimates, a county
with a one standard deviation increase in Fox News viewer share (1.3%) would experience approximately
9 percentage points longer sentences, or 5 months in prison.
10 The list of states with both appointed and elected judges can be found in Table 1 of (Lim, Snyder
and Strömberg, 2015). We include four states (Arizona, Indiana, Kansas, and Missouri) with within-state
variation in judge selection in both samples; however, results hold if we drop them or split by counties’
selection method.
11reports the coefficient for the subsample of states with elected judges. The coef-
ficient of interest is significant and is not statistically different from the baseline
coefficient. This result is consistent with the effects being driven by the election
channel.11 The fact that we do not find a positive coefficient for the subsample
of states with appointed judges provides suggestive evidence against policing and
prosecutor channels. If police or prosecutors were important, we would expect
appointment states to have positive (possibly smaller in magnitude) effects. The
fact that we don’t find a significant coefficient might mean that media attention
is mostly concentrated on judges rather than police or prosecutors.12
In Columns IV–VII we use the fact that Kansas has within-state variation in
judicial selection: in roughly half of judicial districts judges are elected in partisan
elections, and in the other half judges are appointed (49 out of 105 counties).
Identification using within-state variation in judges selection has been used in
previous research, which has compared the counties in greater detail (Gordon
and Huber, 2007; Lim, 2013; Park, 2017).13 First, in Columns IV and V, we
report OLS and 2SLS estimates of the baseline specification for Kansas. We only
have 9,104 observations from Kansas: OLS estimate is insignificant, and 2SLS
is positive and significant; however, the first stage is barely strong enough with
F-statistic of 8.5. Then we split the state in samples of counties where judges are
appointed (Column VI) and counties where judges are elected (Column VII).14
Similarly to the results in Columns II and III, we find positive and significant
OLS effects for the subsample of counties with elected judges and find no effect
for the counties where they are appointed. We do not report 2SLS results because
we do not have enough power in the first stage.
In order to dig into the election mechanism, we also look at dynamic effects
of the electoral cycle. For this purpose we need judge identifiers, which are not
available in the NCRP data. Therefore, we use data from ten states with judge
identifiers. Following Berdejó and Yuchtman (2013) we construct a variable that
measures proximity to election of judge i at time t as a linear running variable
that is scaled from 0 to 1. It starts at 0 on the day after a general election, and
equals 1 on the day of the next general election. It increases by 1/Ts each day,
where Ts is the length of state s’s electoral cycle, i.e., TW A = 4 × 365 + 1 and
TN C = 8 × 365 + 2.15 Here we estimate the baseline Equation 2, but we also
add interaction of the Fox news viewership with a judge’s proximity to election as
the second endogenous variable and the interaction of Fox channel position with
a judge’s proximity to election as a second instrument. In addition, we include
11 Here, we do not discard the legislation channel, as it is conditioned by the state-year fixed effects.
While we can’t rule it out, it does not drive our results.
12 The following states have appointed attorneys: Alaska, Connecticut, New Jersey, and Washington
D.C.
13 Arizona, Indiana, and Missouri also have within state variation in selection of judges, but their
counties are not comparable in terms of covariates (Park, 2017).
14 The list of counties with elected/appointed judges is available at https://ballotpedia.org/
Judicial_selection_in_Kansas.
15 More details on construction of the electoral cycles can be found in Dippel and Poyker (2019).
12Table 2—Fox News and Sentencing Decisions: Elected vs. Appointed Judges
Dependent variable: Log sentencing length in months
I II III IV V VI VII
Sample All states Kansas
States/counties All Appointed Elected All Appointed Elected
2SLS 2SLS 2SLS OLS 2SLS OLS OLS
Nielsen share (Fox) 0.071** -0.089 0.074*** 0.007 0.248*** -0.014 0.022**
[0.0113] [0.2107] [0.0085] [0.4182] [0.0046] [0.3042] [0.0245]
R-squared 0.39 0.589 0.331 0.536 0.478 0.540 0.539
Partial R-squared 0.029 0.013 0.032 0.013
F-stat. of excl. inst. 31.9 8.6 30.9 8.5
Observations 4,960,185 1,025,716 4,444,469 9,115 9,104 4,368 4,746
Note: All columns include state-year FEs. The dependent variable is the inverse hyperbolic sine
of the sentencing length. All columns use the baseline specification from Column VI of Table
V.A. Standard errors clustered by FIPS. P-values in brackets. *** pTable 3—Fox News and Sentencing Decisions: Elected vs. Appointed Judges
Dependent variable:
Log sentencing length in months
I II III IV V
NCRP
Sample NCRP Full sample of 10 states
(10 states)
Nielsen share (Fox) 0.071** 0.037 0.061* 0.068* 0.077**
[0.0113] [0.5170] [0.0515] [0.0573] [0.0328]
Proximity-to-election 0.343***
[0.0026]
Proximity-to-election -0.132***
x Nielsen share [0.0043]
Judge FE X X
R-squared 0.39 0.429 0.487 0.508 0.507
Partial R-squared 0.029 0.033 0.094 0.047 0.05 & 0.01
F-stat. of excl. inst. 31.9 27.8 76.9 41.1 24.8 & 6.6
Observations 4,960,185 1,126,388 2,521,509 2,521,080 2,521,080
Note: Columns I–II use baseline specification from Column VI of Table V.A. The following states
are included in Columns II–V: Alabama, Arkansas, Colorado, Georgia, Kentucky, Minnesota,
North Carolina, Pennsylvania, Tennessee, Virginia, and Washington. All columns include state-
year FEs. In fact, inColumns III–V for sentencing length, we use inverse the hyperbolic sin
log(yi + (yi2 + 1)1/2 ) , which is approximately equal to log(2) + log(yi ), and can be interpreted
in exactly the same way as a standard logarithmic variable but without needing to fill in zero
values (Burbidge, Magee and Robb (1988)). The following variables are used as controls in
Columns III–V: age, age squared, and race dummies (Black, Hispanic, Asian, Native American,
and other), dummy for recidivists and state-specific set of crime severity dummies. Standard
errors clustered by FIPS. P-values are in brackets. *** p1
(4) Tct = αs(c)t + γ1 Zct + γ2 Zct × µi(c) + µi(c) + Xi(c)t β + ηi(c)t and
2
(5) Tct × µi(c) = αs(c)t + γ1 Zct + γ2 Zct × µi(c) + µi(c) + Xi(c)t β + ηi(c)t ,
where the two excluded instruments are the channel position Zct , plus the channel
position interacted with the defendant characteristic, Zct ×µi(c) . These first stages
are used to predict the endogenous regressors.
Table 4 reports possible heterogeneous effects by providing estimates for Eq. 3.
Column II shows that our effect goes almost entirely through black defendants.
The coefficient for ρ1 becomes insignificant, while ρ2 is large, suggesting racial
bias in the effect of Fox News on sentencing behavior.17 We find no evidence
for a disproportionate media effect toward Hispanics or toward female defendants
(Columns III–VI).
The empirical literature on U.S. criminal justice has emphasized that minorities
are often disproportionately prosecuted for non-violent crimes (e.g., Fagan and
Ash, 2017). And anecdotally, conservative discourse often concerns itself with
the risks posed by illicit drugs and the associated informal economy. Motivated
by these points, we estimate the relative effects of Fox News exposure for drug-
related crimes (Column VIII) and a non-illegal-drug placebo, driving under the
influence of alcohol (DUI, Column X). We find that while there is no relative effect
of Fox News on DUI crimes, there is a large interaction effect for drug crimes.
The estimates in Column VIII suggest that the effect operates almost entirely
through drug-related crimes.
D. Additional Results and Robustness Checks
In Table B1, we also test whether Fox News affected other sentencing-related
outcomes. Columns I and II show no evidence for an effect of Fox News on
probability of incarceration. Thus the effect exists only on the intensive margin
but not on the extensive margin. In Columns III and IV, we check whether Fox
News consumption affects the number of offenses in each case.18 Because the
initial number of cases does not depend on a judge, finding evidence that Fox
News increases the number of offenses would mean that the effect is partially
driven by the police officers and prosecutors who prepare the case for the court.
However, we find no effect, thus providing additional evidence against the non-
judicial channels (policing and prosecutors). Similarly, in Column V and VI we
17 Interestingly, we don’t find a positive relationship between being black and sentence length, which
is somewhat different than other work in this literature. It could be that blacks are more often arrested
with less serious crimes (even within observed charge categories).
18 We do not observe the number of charges for Alabama, Virginia, and Washington.
15Table 4—Fox News and Sentencing Decisions: Heterogeneity by Defendant Characteristics
Dependent variable: Log sentencing length in months
I II III IV V VI VII VIII IX X
Characteristic Black Hispanic Female Drug-related crimes DUI crimes
OLS 2SLS OLS 2SLS OLS 2SLS OLS 2SLS OLS 2SLS
Nielsen share (Fox) 0.018*** 0.010 0.021*** 0.073** 0.022*** 0.064** 0.019*** 0.015 0.023*** 0.071**
[0.0000] [0.6956] [0.0000] [0.0154] [0.0000] [0.0221] [0.0000] [0.6119] [0.0000] [0.0122]
Nielsen share x 0.015** 0.154** 0.016** -0.029 0.004 0.045 0.013** 0.202*** -0.002 -0.002
Characteristic [0.0255] [0.0280] [0.0382] [0.6945] [0.3702] [0.1710] [0.0203] [0.0038] [0.8589] [0.9752]
16
Characteristic -0.029 -0.303** 0.035 0.133 -0.156*** -0.245*** - - - -
[0.1688] [0.0274] [0.2994] [0.3856] [0.0000] [0.0004] - - - -
R-squared 0.393 0.388 0.393 0.392 0.393 0.392 0.393 0.383 0.393 0.392
Partial R-squared 0.031 0.031 0.030 0.030 0.030
F-stat. of excl. inst. 18.137 32.377 22.173 21.806 17.214
Observations 4,971,048 4,960,185 4,971,048 4,960,185 4,971,048 4,960,185 4,971,048 4,960,185 4,971,048 4,960,185
Note: All columns include state-year FEs. The dependent variable is the inverse hyperbolic sine of the sentencing length. All Columns use
baseline specification from Column VI of Table V.A. Characteristic coefficients in Columns VII–X are absorbed by crime type fixed effects.
We report F-statistics and partial R2 for the first endogenous variable (Nielsen share, Fox). Standard errors clustered by county. P-values
are in brackets. *** pfind no evidence that Fox News affect the predicted sentence length based on
charges.
Table B4 reports reduced form and 2SLS placebo regressions where we use
endogenous and instrumental variable at year t and outcome variables for years
t − 15 in Columns I–IV and t − 10 in Columns V–XII. Neither reduced form nor
the second stage is significant throughout the table; we also find no effect of Fox
channel position on lagged outcomes in the subsamples of states with appointed
and elected judges (Columns IX–XII). In Table B5 we show that Fox News chan-
nel position had no effect on sentencing length before it became exceptionally
conservative (i.e., before 2005, see Column II). We also show that the positions
of Golf channel, Playboy, and Trinity Broadcast Network (Christian TV) have
no reduced form effect on sentencing (Column III–V). However, in Column VI,
we find a negative effect for A&E. This is interesting because A&E specializes in
broadcasting true crime shows, and judges may be less lenient in counties where
crime issues are more salient to voters. Finally, Figure B6 compares our true
reduced form estimate to the distribution of estimates obtained from regressing
sentence length on fake Fox channel position 500 times; the true coefficient has
by far the largest magnitude.
Next we provide additional robustness checks to address possible exclusion re-
striction violations. First, in Columns II–V of Appendix Table B3 we include
additional control variables that may correlate with channel position: past Repub-
lican vote share, share of rural population, past crime rates, and past sentencing.
While some of these variables appear to be significant and have expected signs,
our results hold. They also hold when we include all of these controls together in
Column VI.
Since our Fox News data come in two pieces (2005–2008 and 2010–2017), in
Table B2 we also check whether our results hold on the subsamples. Both OLS
and 2SLS hold for the 2010–2017 sample; however, the first stage on the subsample
of 2005–2008 is weak (F-statistic equals 3.5) and the second-stage coefficient is
insignificant (although OLS coefficient is positive and significant). Our results are
not driven by a particular statistical artifact and hold if we omit any combination
of 5 states.
VI. Discussion and Concluding Remarks
This paper has shown evidence that conservative television media exposure has
a causal effect on judge decision-making. When Fox News has higher viewership
due to lower channel numbers, that makes judges harsher in their sentencing.
This result adds to previous work showing that Fox News has an effect on voter
attitudes (Martin and Yurukoglu, 2017); here we have established that it also has
an influence on judges (in the high-stakes decision of how long to incarcerate a
person). Adding to work showing that judges respond to political incentives (Ash
and MacLeod, 2017), we have established that politicized information (and not
just incentives) matter for judge decision-making.
17In the heterogeneous effects section, we showed that the effect of Fox News is
focused on black defendants, and on drug-related crimes. The racialized discourse
around crime indicated in Figure 2 appears to sway judges on the ground to in-
crease disparities. This result adds to the large literature on racial discrimination
in the U.S. criminal justice system (e.g., Fagan and Ash, 2017), and specifically
in the context of the war on drugs (Banks, 2003). We establish a racial bias in
the effect of conservative discourse on criminal justice decisions, and this is linked
to drug crimes. As Blacks are disproportionately arrested for non-violent drug-
related offenses, the effect could be driven by racial bias in media messaging.
Alternatively, it could be that “tough-on-drugs” rather than “tough-on-crime”
rhetoric matters in this setting. In future work we will try to distinguish which
types of rhetoric are more distinctive of Fox News.
As a step in this direction, we started to examine how Google search activity is
related to Fox News viewership. In Figure B7, we visualize the reduced form at the
DMA level for the effect of Fox News channel position on searches for “crime,”
in Panel A, and on a racial slur, in Panel B (as done in Stephens-Davidowitz,
2014). These binscatters are residualized on state fixed effects and controls for
the channel positions of the other networks. While there is no effect for crime,
there is a negative effect for the slur. That is, places with lower Fox channel
position (and therefore higher Fox viewership) have more racism expressed in
Google searches. The reduced form relationship is statistically significant with
p = 0.088.
We see an effect for elected, but not appointed, judges. This is consistent
with an electoral mechanism, where Fox News affects judge decisions by shifting
voter attitudes, rather than shifting the policy preferences of judges directly. Our
findings suggest that judges are time-consistent in their desire to appeal to the
voters and not trying to be tough-on-crime closer to the election date. These
regressions work by subsampling states; however, so we cannot rule out selective
differences in responsiveness across states.
Finally, the effect of Fox News on elected judges becomes weaker in the run-up to
the election date. One interpretation of this result is that politicized information
and politicized incentives are substitutes, rather than complements. As electoral
pressures become stronger, media effects are reduced. Another possibility is that
Fox News content becomes more election-focused, and less devoted to crime, in
the run-up to elections. We will try to distinguish these explanations in future
work.
More generally, in our follow-up work we plan to use text-analysis methods to
recover which ideas in Fox News are driving our effects. Using recent developments
in high-dimensional instrumental-variables methods (e.g., Belloni et al., 2012;
Ash, 2016), we will ask what features of cable news discourse have an impact on
sentencing. The goal is a greater understanding of the political economy of media
and criminal justice. The evidence produced by this research program will be
useful to judges, policymakers, and the public.
18REFERENCES
Allcott, Hunt, and Matthew Gentzkow. 2017. “Social media and fake news in the 2016 election.”
Journal of Economic Perspectives, 31(2): 211–36.
Arceneaux, Kevin, Martin Johnson, René Lindstädt, and Ryan J Vander Wielen. 2016.
“The influence of news media on political elites: Investigating strategic responsiveness in congress.”
American Journal of Political Science, 60(1): 5–29.
Ash, Elliott. 2016. “The political economy of tax laws in the U.S. states.”
Ash, Elliott, and W Bentley MacLeod. 2015. “Intrinsic motivation in public service: Theory and
evidence from state supreme courts.” The Journal of Law and Economics, 58(4): 863–913.
Ash, Elliott, and W Bentley MacLeod. 2017. “Elections as Incentive and Selection Device: The
Case of State Supreme Courts.”
Ash, Elliott, Daniel L Chen, and Suresh Naidu. 2017. “Ideas have consequences: The impact of
economics on American justice.”
Ash, Elliott, Daniel L Chen, and Wei Lu. 2017. “Polarization of US Circuit Court Judges: A
Machine Learning Approach.”
Banks, R Richard. 2003. “Beyond profiling: Race, policing, and the drug war.” Stanford Law Review,
571–603.
Belloni, Alexandre, Daniel Chen, Victor Chernozhukov, and Christian Hansen. 2012. “Sparse
models and methods for optimal instruments with an application to eminent domain.” Econometrica,
80(6): 2369–2429.
Berdejó, Carlos, and Daniel L Chen. 2017. “Electoral cycles among us courts of appeals judges.”
The Journal of Law and Economics, 60(3): 479–496.
Berdejó, Carlos, and Noam Yuchtman. 2013. “Crime, punishment, and politics: an analysis of
political cycles in criminal sentencing.” Review of Economics and Statistics, 95(3): 741–756.
Boxell, Levi, Matthew Gentzkow, and Jesse M Shapiro. 2017. “Greater Internet use is not
associated with faster growth in political polarization among US demographic groups.” Proceedings
of the National Academy of Sciences, 201706588.
Burbidge, John B., Lonnie Magee, and A. Leslie Robb. 1988. “Alternative Transformations to
Handle Extreme Values of the Dependent Variable.” Journal of the American Statistical Association,
83(401): 123–127.
Chen, Daniel L, Tobias J Moskowitz, and Kelly Shue. 2016. “Decision making under the gambler’s
fallacy: Evidence from asylum judges, loan officers, and baseball umpires.” The Quarterly Journal of
Economics, 131(3): 1181–1242.
Clinton, Joshua D, and Ted Enamorado. 2014. “The national news media’s effect on Congress:
How Fox News affected elites in Congress.” The Journal of Politics, 76(4): 928–943.
Cohen, Alma, and Crystal Yang. 2018. “Judicial Politics and Sentencing Decisions.” National Bureau
of Economic Research.
DellaVigna, Stefano, and Ethan Kaplan. 2007. “The Fox News effect: Media bias and voting.” The
Quarterly Journal of Economics, 122(3): 1187–1234.
Dippel, Christian, and Michael Poyker. 2019. “How Common are Judicial Electoral Cycles in
Criminal Sentencing?” NBER working paper 25716.
Epstein, Lee, William M Landes, and Richard A Posner. 2013. The behavior of federal judges:
a theoretical and empirical study of rational choice. Harvard University Press.
Fagan, Jeff, and Elliott Ash. 2017. “New policing, new segregation? From Ferguson to New York.”
Georgetown Law Journal.
Gentzkow, Matthew, and Jesse M Shapiro. 2010. “What drives media slant? Evidence from US
daily newspapers.” Econometrica, 78(1): 35–71.
Gordon, S.C., and G.A. Huber. 2007. “The effect of electoral competitiveness on incumbent behav-
ior.” Quarterly Journal of Political Science, 2(2): 107–138.
Kessler, Daniel P, and Anne Morrison Piehl. 1998. “The Role of Discretion in the Criminal Justice
System.” Journal of Law, Economics, and Organization, 14(2): 256–256.
Lim, Claire H S. 2013. “Preferences and Incentives of Appointed and Elected Public Officials: Evidence
from State Trial Court Judges.” American Economics Review.
Lim, Claire SH, James M Jr Snyder, and David Strömberg. 2015. “The judge, the politician, and
the press: newspaper coverage and criminal sentencing across electoral systems.” American Economic
Journal: Applied Economics, 7(4): 103–135.
Lim, Claire SH, James M Snyder Jr, and David Strömberg. 2015. “The judge, the politician, and
the press: newspaper coverage and criminal sentencing across electoral systems.” American Economic
Journal: Applied Economics, 7(4): 103–135.
Martin, Greg, and Ali Yurukoglu. 2017. “Bias in Cable News: Persuasion and Polarization.” Amer-
ican Economic Review.
19Mikolov, Tomas, Ilya Sutskever, Kai Chen, Greg S Corrado, and Jeff Dean. 2013. “Distributed
representations of words and phrases and their compositionality.” 3111–3119.
Park, Kyung H. 2017. “The impact of judicial elections in the sentencing of black crime.” Journal of
Human Resources, 52(4): 998–1031.
Posner, Richard. 2008. How Judges Think. Harvard University Press.
Poyker, Michael, and Christian Dippel. 2019. “Do Private Prisons Affect Criminal Sentencing?”
NBER working paper 25715.
Snyder, James, and David Stromberg. 2010. “Press Coverage and Political Accountability.” Journal
of Political Economy, 118(2): 355–408.
Stephens-Davidowitz, Seth. 2014. “The cost of racial animus on a black candidate: Evidence using
Google search data.” Journal of Public Economics, 118: 26–40.
20Online Appendix
to
“Conservative News Media and Criminal Justice:
Evidence from Exposure to Fox News Channel”
21Data Appendix
A1. Sentencing Data
We use two separate sources of data. The first one is National Corrections
Reporting Program (ICPSR 36373). This dataset is restricted; however, one can
apply for it with IRB and get access within a month. Other data comes from
Dippel and Poyker (2019) and Poyker and Dippel (2019). Below we provide the
description of the data and how it was obtained.
Sentencing data were collected separately from each state. 14 states were willing
to share their data with us for free or at reasonable cost: Alabama, Arkansas,
Georgia, Kentucky, Maryland, Minnesota, Mississippi, Nevada, North Carolina,
Oregon, Pennsylvania, Tennessee, Texas, Virginia, and Washington.
We contacted each state with the following initial data request:
The data we are looking for has a court case (or ’sentencing event’)
as the unit of observation. In some states the data is organized by
charge (with several charges making up the case or sentencing event)
and that is equally fine. The key data that we need are:
date, month and year of sentencing;
type of crime;
length of sentencing;
type of sentencing (low-security, high security, etc);
defendant’s sex;
defendant’s race;
court identifier;
name of judge or judge identifier number;
type of court that convicted (trial, appeal, etc);
in what prison the person was sent;
We do not seek any information that identifies defendants.
Sincerely, XXX
There were 10 states that (i ) shared their sentencing data in digitized form and
(ii ) included the judge identifiers needed to estimate judge political cycles.19 The
following reports for each state the office responsible for storing the data, as well
as relevant contacts at the time we requested the data between late 2016 and late
2018. Some states had considerably longer processing times than others. These
were typically due either to backlogs of data-technicians or to having to get our
request vetted and signed off on by other individuals.
19 We also obtained sentencing data from Arkansas, Maryland, Mississippi, Nevada, Oregon, and Texas,
but these states’ data does not include judge identifiers.
221) Alabama
• Initial contact with the Sentencing Commission at http://sentencingcommission.
alacourt.gov/.
• After emailing sentencing.commission@alacourt.gov, Bennet Wright
processed our request.
• Time between data application and delivery: 16 months.
2) Colorado
• Initial contact with the Colorado Court Services Division, at https:
//www.courts.state.co.us/Administration/Division.
• Jessica Zender, the Court Programs Analyst at the Court Services
Division processed our request.
• Time between data application and delivery: 1 month.
3) Georgia
• Initial contact with Department of Corrections at www.dcor.state.
ga.us/Divisions/ExecutiveOperations/OPS/OpenRecords.
• After emailing open.records@gdc.ga.gov it was recommended we go
through their ‘Media Inquiries’ under +1-478-992-5247, where Jamila
Coleman coordinated our request with their data technicians.
• Time between data application and delivery: 3 months.
4) Kentucky
• We spoke on the phone to Cathy Schiflett at the Kentucky Courts
Research and Statistics Department.
• She guided us to https://courts.ky.gov/Pages/default.aspx, where
we had to select ‘Statistical Reports’ and then submit our data request.
• Daniel Sturtevant handled our request.
• Time between data application and delivery: 9 months.
5) Minnesota
• Initial contact with the Minnesota Sentencing Guidelines Commission
at http://mn.gov/sentencing-guidelines/contact/contact-us.jsp.
• Email address: sentencing.guidelines@state.mn.us.
• Kathleen Madland was the Research Analyst who processed our re-
quest.
• Time between data application and delivery: 2 months.
6) North Carolina
23• Initial contact though www.ncdoj.gov/Top-Issues/Public-Integrity/
Open-Government/Understanding-Public-Records.aspx.
• Then we were put in touch with the North Carolina Administrative
Office of the Courts, where our data request was processed by the
‘Remote Public Access’ data technicians;
• Time between data application and delivery: 3 months.
7) Pennsylvania
• In Pennsylvania, sentencing data can be requested from the Sentencing
Commission at
http://pcs.la.psu.edu/data/request-and-obtain-data-reports-and-data-sets/
sentencing/data-sets.
• Leigh Tinik processed our request.
• Time between data application and delivery: 1 month.
8) Tennessee
• Initial contact with Tennessee’s Department of Corrections at www.tn.
gov/correction/article/tdoc-prison-directory.
• Tanya Washington, the DOC’s Director of Decision Support (Research
& Planning), processed our request.
• Time between data application and delivery: 6 months.
9) Virginia
• Initial contact was through a web form of the Virginia Criminal Sen-
tencing Commission at www.vcsc.virginia.gov/.
• After being initially denied on the grounds that FOIA requests could
only be processed for Virginia residents, we called +1-804-225-4398,
and were eventually approved after speaking to the director Meredith
Farrar-Owens.
• Time between data application and delivery: 3 months.
10) Washington
• Initial contact with the Department of Corrections at www.doc.wa.
gov/aboutdoc/publicdisclosure.asp, where Duc Luu processed our
request.
• We use essentially the same data as Berdejó and Yuchtman (2013).
• Time between data application and delivery: 2 weeks.
24A2. Judicial Biography Data
All data about judge electoral cycles was taken from ballotpedia.org. The
site contains information about the judges of each circuit court (or equivalent) for
each state. The individual page of each judge contains data for age and gender of
a judge, the dates when she was appointed/elected, date of retirement (if already
retired), name of governor by whom she was appointed (if appointed), and whom
the judge replaced.
To collect the data research assistants started with the contemporary judges,
collected their data, and proceeded with their predecessor judges. This procedure
resulted in collecting information for approximately 80% of the judges mentioned
in the sentencing data. For the states where the name of a judge was known we
searched those judges individually on the sites of their courts and added them to
the dataset.
Six of the states in this paper include judge names or identifiers in the sentencing
data: Alabama, Georgia, Kentucky, North Carolina, Tennessee, and Washington.
We coded up judge biographies, including when they are up for re-election. Where
judges are identified by name, merging the judge biographies is straightforward.
Where only judge identifiers are given, these identifiers still almost always include
a variant of the judges’ initials. When they do not include initials, we match on
entry and exit dates.
Additional Results
Table B1—Fox News and Additional Outcomes
Dependent variable:
I II III IV V VI
Predicted sentence
1(Incarceration) # of charges
length
OLS 2SLS OLS 2SLS OLS 2SLS
Nielsen share (Fox) -0.003 -0.014 1.099* 0.701 -0.001 -0.000
[0.3158] [0.2885] [0.0644] [0.3931] [0.2522] [0.9477]
R-squared 0.33 0.33 0.05 0.05 0.788 0.787
Partial R-squared 0.094 0.157 0.085
F-stat. of excl. inst. 76.9 226.6 62.055
Observations 2,523,787 2,521,497 1,857,597 1,856,053 3,007,773 3,005,483
Note: All columns include state-year FEs. The dependent variable is the inverse hyperbolic sine
of the sentencing length. All Columns use baseline specification from Column VI of Table V.A.
Standard errors clustered by FIPS. P-values are in brackets. *** pPanel A. First Stage
Panel B. Reduced Form
Figure B1. First Stage and Reduced Form: Graphical Results
Note: Binscatter diagrams for the first stage (Panel A) and reduced form (Panel B).
26Panel A (CNN) Panel B (MSNBC)
Figure B2. OLS relation: CNN/MSNBC Viewership and Incarceration Length
Note: This Figure shows that higher CNN and MSNBC viewership are associated with higher
sentencing crosssectionally, although the relationship is weaker than with Fox News.
Panel A (CNN) Panel B (MSNBC)
Figure B3. First Stage: CNN/MSNBC Channel Positions and Viewership
Note: This Figure shows that we can get a first stage for CNN, but not for MSNBC.
27Panel A (CNN) Panel B (MSNBC)
Figure B4. Reduced Form: CNN/MSNBC Channel Positions and Incarceration Length
Note: This Figure shows that there are weak reduced form effects, which is negative for CNN
(the same as Fox) but positive for MSNBC (the opposite of Fox).
Figure B5. First-Stage Coefficients (by State)
28You can also read