A Snapshot: The State of STEM in Florida - January 2010 - Florida Center for Research in Science, Technology, Engineering, and Mathematics
←
→
Page content transcription
If your browser does not render page correctly, please read the page content below
A Snapshot:
                        The State of STEM in Florida
                                                          January 2010

Florida Center for Research in Science, Technology, Engineering, and Mathematics
Forward

In January of 2009, Enterprise Florida’s Strategy Council issued a Discussion Paper that outlined its findings relative to the current state of STEM – science,
technology, engineering and mathematics – education and the need for a STEM proficient workforce to advance Florida’s innovation economy. The findings
indicate that 15 of the 20 fastest growing jobs through 2014 will require substantial math and science preparation, and that Florida, as well as the United
States more generally, is failing to develop an adequate supply of STEM‐capable workers. Florida’s increasingly knowledge‐based economy is driven by
innovation, which has as its foundation a dynamic and well‐educated workforce equipped with STEM knowledge and skills. While the economy calls for a
larger and more proficient STEM workforce, enrollment and success in those courses is declining. As a state and nation, we are losing ground.

In response to this information, leaders from the business, education, policy, and research communities have pledged to work collaboratively to create and
implement a business‐led, evidence‐based, STEM plan that will position Florida as a leader in market relevant STEM talent development and retention. This
plan will link the needs of targeted industries with education and training to create and sustain a seamless system for STEM education in Florida.

We submit this report of the current state of STEM in Florida to serve as a resource describing achievement and performance baseline data to be used in the
development of a strategic STEM plan. As a result of advancements in technology and an increasingly global economy, Floridians today compete in an
international job market. Therefore, we begin this report by comparing the performance of K‐12 students in our nation to that of students in other nations,
using findings from both the Trends in International Mathematics and Science Study (TIMSS) and the Programme for International Student Assessment (PISA).
Sources of information on the achievement of Florida’s K‐12 students include the National Assessment of Educational Programs (NAEP), the Florida
Comprehensive Assessment Test (FCAT), student enrollment in upper level courses, and student achievement on Advanced Placement (AP) exams. Within the
Florida State University System (SUS) and Independent Colleges and Universities of Florida (ICUF), we examine metrics including course enrollment, majors
chosen, and degrees awarded across a variety of STEM fields. Additionally, we utilize these sources for evidence regarding the relative performance of females
and minorities. In order to advance our state’s economy, we must focus on improving the STEM proficiency of ALL Floridians. To achieve this aim, Florida has
adopted the Next Generation Sunshine State Standards, identifying the deep content knowledge and skills that each student must demonstrate, and is revising
the FCAT accordingly. Finally, we indicate sources of information for describing the current STEM workforce in Florida. Science and Engineering Indicators
2010, produced biennially by the National Science Board, contains state trends in science and technology. These indicators are useful in examining Florida’s
STEM progress, and in determining its national rankings. We hope that this STEM education and workforce information may be of use to business leaders as
they define the regional and statewide needs of Florida‐ the demand side of the workforce equation.

Submitted by Laura B. Lang, Ph.D.*, Mabry Gaboardi, Ph.D., Frank Fuller, Ph.D., & Christine Johnson, M.S.
* Primary contact (llang@fsu.edu, 850‐980‐5034)

                                                                                                                                                             2
Contents
USA Compared to Other Nations........................................ 4                     High School Graduation Rates...................................... 29

   TIMSS Science ................................................................ 5         College Freshmen......................................................... 30

   TIMSS Mathematics ....................................................... 6              STEM Bachelor’s Degrees (SUS) ................................... 31

   PISA Science ................................................................... 7       STEM Advanced Degrees (SUS) .................................... 32

   PISA Mathematics .......................................................... 8            STEM Bachelor’s Degrees (ICUF) .................................. 33

Florida: A National and International Comparison ............. 9                            STEM Advanced Degrees (ICUF) ................................... 34

   NAEP Science 2005....................................................... 10              STEM Degrees: Florida and the US ............................... 35

   NAEP Mathematics 2009.............................................. 11                   Females in STEM: Degrees ........................................... 36

   Florida and Other Nations: Science.............................. 12                      Minorities in STEM: Degrees ....................................... 38

   Florida and Other Nations: Math ................................. 13                     NGSS Standards............................................................ 40

   Access to Challenging Courses ..................................... 14                   Secondary Teacher Certification .................................. 41

   Advanced Placement (AP) Scores................................. 15                       K‐12 Education: Funding .............................................. 42

   Public Perception about STEM ..................................... 16                    State Universities: Funding........................................... 43

The State of STEM in Florida............................................. 17                STEM in the Workforce ................................................ 44

   FCAT Science ................................................................ 18         STEM Academic Output................................................ 45

   FCAT Mathematics ....................................................... 19              STEM in Business .......................................................... 46

   FCAT Mathematics: Higher Performers........................ 20                           R&D Funding ................................................................ 47

   FCAT Mathematics: Districts ........................................ 21                  Workforce Information Sources ................................... 48

   State Proficiency Standards: Grade 4 Math ................. 22                           Highest Wage Occupations .......................................... 49

   State Proficiency Standards: Grade 8 Math ................. 23                           Florida’s Economic Dashboard ..................................... 50

   Females in Science: K‐12 .............................................. 24               Florida’s Talent Supply Chain ....................................... 51

   Females in Mathematics: K‐12 ..................................... 25                    Roadmap to Florida’s Future........................................ 52

   Females in STEM: K‐12 ................................................. 26           References ........................................................................ 53

   Minorities in Math: FCAT ............................................. 27            Notes................................................................................. 56

   Minorities in Math: NAEP............................................. 28
                                                                                                                                                                                    3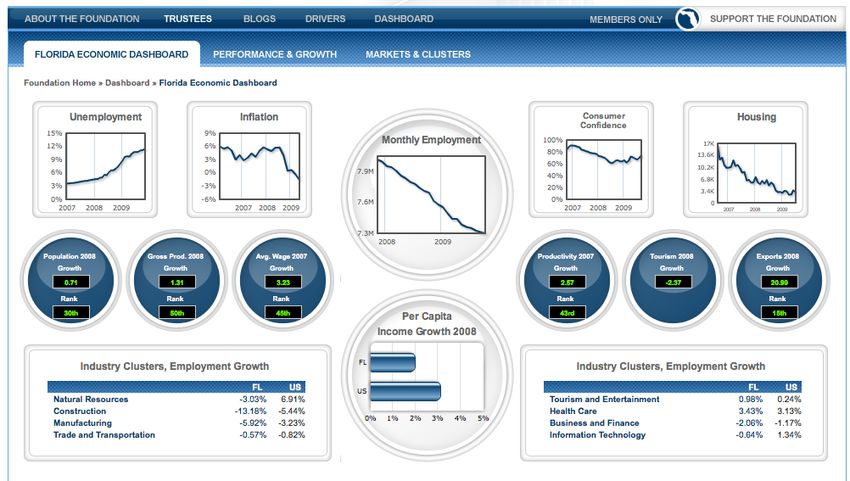
USA Compared to Other Nations

                                                            The studies below provide evidence for comparing K‐12 Science and Mathematics
                                                            achievement of students in the USA to that of students in other countries.

The USA and Globalization
                                                                         International Studies of Student Performance
                                                                             Trends in International Mathematics and Science Study (TIMSS)
“A substantial portion of our workforce finds itself
in direct competition for jobs with lower‐wage                               •  Administered by the International Association for the Evaluation
workers around the globe, and leading‐edge
                                                                                of Educational Achievement.
scientific and engineering work is being
accomplished in many parts of the world.”                                    • TIMSS data have been collected every four years since 1995,
                                                                                with most recent data collected in 2007.
“...workers in virtually every sector must now face                          Programme for International Student Assessment (PISA)
competitors who live just a mouse‐click away in
Ireland, Finland, China, India, or dozens of other                           •    Administered by the Organisation for Economic Co‐operation
nations whose economies are growing.”
                                                                                  and Development.
                                                                             •    PISA assessments have been carried out in 2000, 2003 and 2006.
  ‐ National Academy of Sciences, National Academy of        “…the TIMSS 2007 assessment was administered to carefully drawn probability samples of
          Engineering, and Institute of Medicine. (2007).
                                                             students from the target populations in each country. The target populations were
      Rising Above the Gathering Storm: Energizing and
                                                             students enrolled in the fourth grade or eighth grade of formal schooling...”
Employing America for a Brighter Economic Future, p. 1.

                                                                                                       TIMSS & PIRLS International Study Center. (2008).

                                                             For additional information about TIMSS, see http://nces.ed.gov/timss/faq.asp#7

                                                                                                                                                    4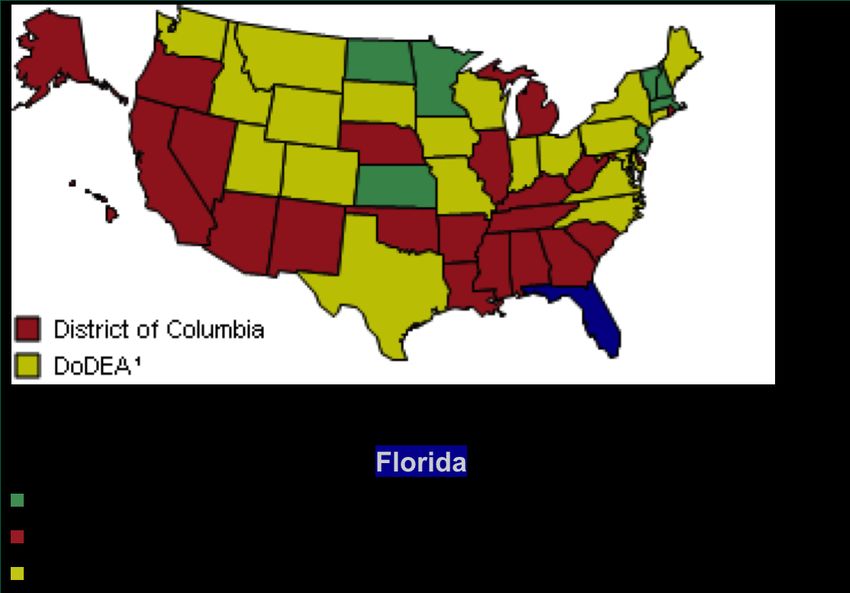
TIMSS Science

                                                                 Trends in International Mathematics and Science Study (TIMSS) primarily
                                                                 measures the degree to which 4th and 8th grade students have learned
                                                                 mathematics and science concepts and skills likely to have been taught in school.
The USA and Globalization                                                     TIMSS Science 2007: Nations Surpassing the USA

                                                            Grade 4 Science                          Avg.    Grade 8 Science                             Avg.
“Because other nations have, and probably will                                                       Score                                               Score
                                                            TIMSS scale average                      500     TIMSS scale average                         500
continue to have, the competitive advantage of a
                                                            Singapore                                587     Singapore                                   567
low wage structure, the United States must
                                                            Chinese Taipei                           557     Chinese Taipei                              561
compete by optimizing its knowledge‐based
                                                            Hong Kong SAR                            554     Japan                                       554
resources, particularly in science and technology,
                                                            Japan                                    548     Korea, Rep. of                              553
and by sustaining the most fertile environment for
                                                            Russian Federation                       546     England                                     542
new and revitalized industries and the well‐paying
                                                            England                                  542     Hungary                                     539
jobs they bring.”
                                                            United States                            539     Czech Republic                              539
                                                                                                             Slovenia                                    538
                                                                                                             Hong Kong SAR                               530
  ‐ National Academy of Sciences, National Academy of
                                                                                                             Russian Federation                          530
          Engineering, and Institute of Medicine. (2007).
      Rising Above the Gathering Storm: Energizing and                                                       United States                               520
Employing America for a Brighter Economic Future, p. 4.     28 countries scored below the USA                37 countries scored below the USA

                                                            Average scores of nations surpassing the USA when assessed for Science as part of the
                                                            TIMSS. Shading indicates statistical significance (p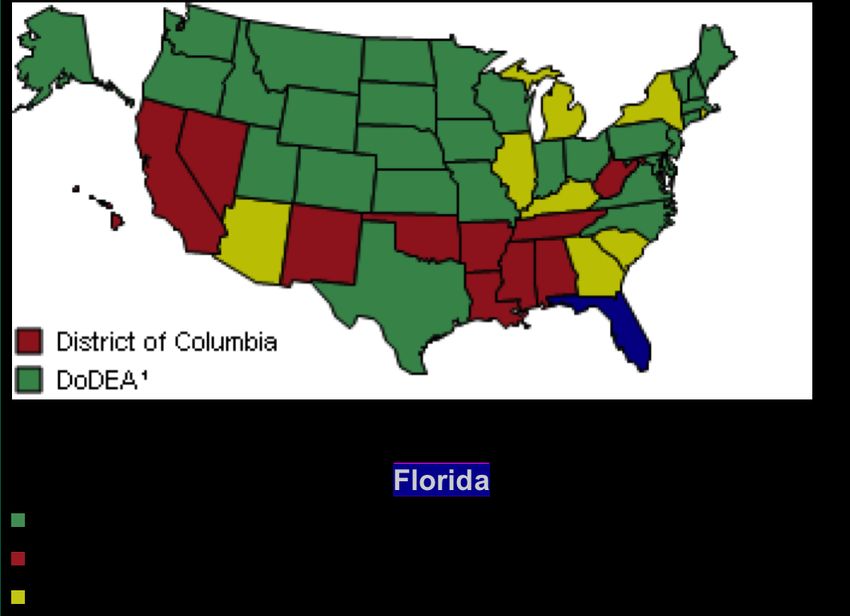
TIMSS Mathematics

                                                        Trends in International Mathematics and Science Study (TIMSS) primarily
                                                        measures the degree to which 4th and 8th grade students have learned
                                                        mathematics and science concepts and skills likely to have been taught in school.
Education and the Economy
                                                                     TIMSS Mathematics 2007: Nations Surpassing the USA

                                                     Grade 4 Mathematics                      Avg.     Grade 8 Mathematics                        Avg.
“If the United States had in recent years closed
                                                                                              Score                                               Score
the gap between its educational achievement
                                                     TIMSS scale average                      500      TIMSS scale average                        500
levels and those of better‐performing nations
                                                     Hong Kong SAR                            607      Chinese Taipei                             598
such as Finland and Korea, GDP in 2008 could
                                                     Singapore                                599      Korea, Rep. of                             597
have been $1.3 trillion to $2.3 trillion higher.
                                                     Chinese Taipei                           576      Singapore                                  593
This represents 9 to 16 percent of GDP.”
                                                     Japan                                    568      Hong Kong SAR                              572
                                                     Russian Federation                       544      Japan                                      570
                                                     England                                  541      Hungary                                    517
“The recurring annual economic cost of the           Netherlands                              535      England                                    513
international achievement gap is substantially       United States                            529      Russian Federation                         512
larger than the deep recession the United                                                              United States                              508
States is currently experiencing.”                   25 countries scored below the USA                 39 countries scored below the USA

                                                     Average scores of nations surpassing the USA when assessed for Mathematics part of the
                  ‐ McKinsey & Company. (2009).      TIMSS. Shading indicates statistical significance (p
PISA Science

                                                     PISA seeks to measure how well young adults at age 15 can use their knowledge
                                                     and skills to meet real‐life challenges, rather than merely the extent to which they
                                                     have mastered a specific school curriculum.
Importance of Quality STEM Education
                                                                                                    PISA Science 2006

                                                                         600
“The Bureau of Labor Statistics projects that
employment in science and engineering                                    550

                                                       Average Score
occupations will grow 70 percent faster than                             500
the overall growth for all occupations.”                                 450

            ‐ Tapping America’s Potential. (2008).                       400
         Gaining Momentum, Losing Ground, p. 4.
                                                                         350
                                                                         300
The conclusion of a study of 50 countries:

  “Educational quality – measured by what
people know – has powerful effects on
individual earnings, on the distribution of
income, and on economic growth.”

                 ‐ Hanushek & Wößmann (2007).                          OECD nations scoring measurably above the USA average score (p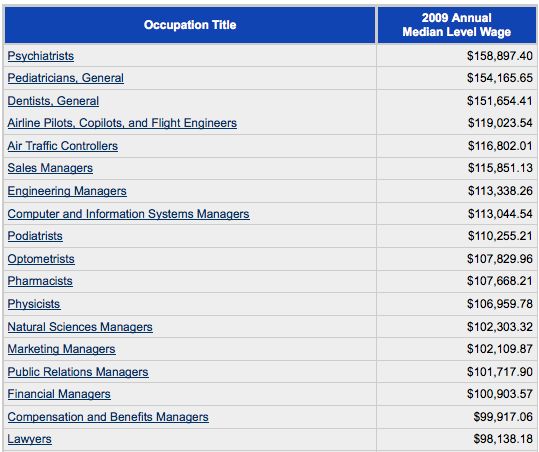
PISA Mathematics

                                                     PISA seeks to measure how well young adults at age 15 can use their knowledge and skills to
                                                     meet real‐life challenges, rather than merely the extent to which they have mastered a
                                                     specific school curriculum.

                                                                                      PISA Mathematics 2006
STEM Achievement and the
Economy                                              600
                                     Average Score   550
                                                     500

“Average test scores in                              450
mathematics and science that                         400
are larger by one standard                           350
deviation…are associated                             300
with an average annual
growth rate in GDP per capita
that is two percentage points
higher over a 40‐year period
(1960‐2000).”

 ‐ Hanushek & Wößmann (2007).                                  OECD nations scoring measurably above the USA average score (p
Florida: A National and International Comparison
                                                   The evidence below allows us to compare K‐12 Science and Mathematics
                                                   achievement of students in Florida to that of students in the rest of the nation.

                                                            Sources of Information on Student Performance
The State’s Role in STEM Education
                                                        National Assessment of Educational Progress (NAEP)

                                                            •  Administered by the National Assessment Governing Board and the U.S.
“Many states have adopted effective                            Department of Education
innovation practices—if not yet a                           • Representative sample of students assessed.
comprehensive innovation agenda—by                          • Results are reported at the state level for grades 4 and 8.
making investments in K–12 education and                    • Most recent science assessment released in 2005. Most recent mathematics
raising science, technology, engineering,                      assessment released in 2009.
and math (STEM) standards; using their role
                                                        “Since NAEP assessments are administered uniformly using the same sets of test
as the main funders of higher education to
                                                        booklets across the nation, NAEP results serve as a common metric for all states...”
improve these institutions’ production of
                                                        – National Center for Education Statistics, http://nces.ed.gov/nationsreportcard/about/
math and science‐related degrees; and
linking research and development to key                 Student Enrollment in Upper Level Courses
industrial, economic, and labor and skills
targets.”                                                   •   Reported by the National Center for Public Policy and Higher Education.

             ‐ National Governors Association,
       Innovation America: A Final Report, p. 2.        Student Achievement in Advanced Placement Exams

                                                            •   Administered by the College Board.

                                                                                                                                                  9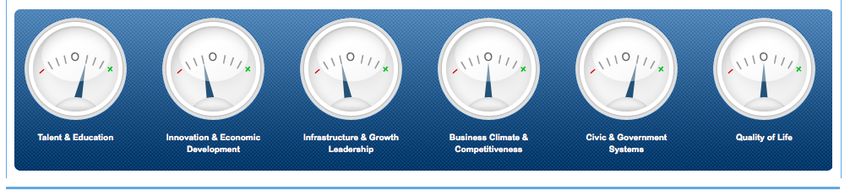
NAEP Science 2005

                                                                 Florida’s Science Performance Relative to Other States

                                       Fourth grade students in Florida perform on par with their national peers, while 8th grade
                                       students in Florida perform below the national average.

                           4th Grade                                                                      8th Grade

                                                              150                                                                          141
    States performing above the national average                                    States performing above the national average
    States performing at the national average                                       States performing at the national average
    States performing below the national average                                    States performing below the national average
    Insufficient Data                                                               Insufficient Data

The national average score was 149.                                          The national average score was 147.
 Data Source: National Assessment of Educational Progress. (NAEP). 2005 is the only year for which NAEP Science data for Florida are available.
             th                                                                                                                                   10
 Websites: 4 grade: http://nationsreportcard.gov/science_2005/s0107.asp
            th
           8 grade: http://nationsreportcard.gov/science_2005/s0107.asp?tab_id=tab2&subtab_id=Tab_1#chart
NAEP Mathematics 2009
Florida’s Mathematics Performance Relative to Other States
Fourth grade students in Florida slightly outperform their national peers, while 8th grade students
in Florida perform slightly below the national average.
4th Grade 8th Grade
State/Jurisdiction performance relative to Florida:
7 scored higher 31 scored higher
23 scored lower 12 scored lower
21 not significantly different 8 not significantly different
National average score: 239 National average score: 282
Average of Florida’s students: 242 Average of Florida’s students: 279
Data source: National Center for Education Statistics. (2009). NAEP Mathematics 2009 State Snapshot Reports. Additional NAEP Mathematics Data from
11
2003, 2005, and 2007 are available in Notes, Section A.
Florida from 2003, 2005, and 2007. Florida’s scores and the national averages are as follows (national average, Florida):Florida and Other Nations: Science
A comparison between science achievement of Florida’s students and students in other nations is
possible by statistically linking NAEP and TIMSS.
Percent of students at or above proficient on science achievement tests
Comparison between grade 8 2005 NAEP state science results for Florida and grade 8 2003 TIMSS national science results for the percent at and above
proficient based on NAEP achievement levels projected on to the TIMSS scale
Data Source: Phillips, G. W. (2007). Chance Favors the Prepared Mind: Mathematics and Science Indicators for Comparing States and Nations, p. 35.
See Notes, Section B for information on the linking of NAEP and TIMSS.
12Florida and Other Nations: Math
“Although there is considerable variation in state performance, states are not as variable as nations. Even the
highest achieving states within the United States were still significantly below the highest achieving countries,
and the lowest performing states were still significantly higher than the lowest achieving countries.”
‐ Phillips, G. W. (2007). Chance Favors the Prepared Mind: Mathematics and Science Indicators for Comparing States and Nations, p. 1,2.
Percent of students at or above proficient on mathematics achievement tests
Comparison between grade 8 2007 NAEP state mathematics results for Florida and grade 8 2003 TIMSS national mathematics results for the percent at
and above proficient based on NAEP achievement levels projected on to the TIMSS scale
Data Source: Phillips, G. W. (2007). Chance Favors the Prepared Mind: Mathematics and Science Indicators for Comparing States and Nations, p. 35.
13
See Notes, Section B for information on the linking of NAEP and TIMSS.Access to Challenging Courses
Compared to states that rate the highest in terms of preparing students for
college, far fewer students in Florida are enrolled in upper‐level mathematics and
science courses.
Raising the Bar for STEM Education Percent of students enrolled in courses with challenging subject matter
College students who took Algebra II or higher
in high school are more than twice as likely to
feel prepared for math expectations in college
Florida1
(60% feel well prepared) than students who 9th to 12th graders taking at least one upper level math course2 42%
did not take Algebra II (26% feel well
prepared). 9th to 12th graders taking at least one upper level science course3 27%
Also, non‐college students who took Algebra II
or higher are far more likely to say they are
Top States4
prepared for the math they will face at work 9th to 12th graders taking at least one upper level math course2 64%
(68%) than non‐college students who did not
take algebra II (46%). 9th to 12th graders taking at least one upper level science course3 40%
‐ Achieve, Inc. (2005).
Rising to the Challenge: Are High School 1‐ Data on course taking in grades 9‐12 were not updated for Florida in the 2008 Measuring
Graduates Prepared for College and Work? Up Report, so the 2006 report data (for 2003‐04) are shown.
2‐ Upper level math courses are Geometry, Algebra 2, Trigonometry, or higher.
3‐ Upper level science courses are Chemistry, Physics, or advanced Life, Physical, or Earth
Other states have already raised the bar for Sciences.
high school graduation requirements in 4‐ Top states=median of top 5 performing states on each indicator.
mathematics. Data Source: The National Center for Public Policy and Higher Education. (2006). Measuring Up 2006:
‐ See http://www.achieve.org/StateProfiles. The State Report Card on Higher Education, Florida.
14Advanced Placement (AP) Scores
Florida exceeds the national average in overall performance on Advanced
Placement exams, scoring higher than the national average on most subjects
EXCEPT mathematics and science.
The Need for Qualified STEM Teachers
Percent of all 2008 high school graduates scoring 3 or above
“Research indicates that a highly qualified
on one or more AP exams
teacher is one of the most important factors in
raising student achievement, yet according to
the Bureau of Labor Statistics, school districts Art
across the country have difficulty hiring
Language
qualified math and science teachers.”
Science
‐ Tapping America’s Potential. (2008).
Gaining Momentum, Losing Ground, p. 4.
Math
STEM
USA
The Need for High Expectations English
Florida
Four out of five college students (82 percent) Social Science
and non‐college students (80 percent) say that
they would have worked harder if their schools All exams
had demanded more of them, set higher
academic standards, and raised expectations 0 5 10 15 20
on the amount of coursework and studying
Percent
required for a diploma.
th ®
‐ Achieve, Inc. (2005). Data Source: College Board. (2009). The 5 Annual AP Report to the Nation:
Rising to the Challenge: Are High School Florida Supplement.
Graduates Prepared for College and Work?
15Public Perception about STEM
What Parents Say
•Increasing the number and quality of math and science courses would improve high school education in the USA
(67%).
•It’s crucial for most of today’s students to learn higher‐level math skills like advanced algebra and calculus ‐ the
STEM Public Awareness gateway to success in college and work (62%).
HOWEVER:
“As leaders in government, •57% say their child takes enough math and science now.
business and education
move forward to address •The percentage of parents who see a serious problem in their own public schools not teaching enough math and
this issue, as they build a science declined between 1996 (52%) and 2006 (32%.)
strong leadership
consensus to act, they may
be well advised to reach
out to parents and
students directly as well.” What Students Say
‐ Public Agenda. (2006). •Most students in grades 6‐12 want schools to prepare them for good jobs in a competitive world.
Reality Check 2006, p. 2.
HOWEVER:
•Only 50% say strong math and science skills are absolutely essential for their future.
•Only 28% think kids are not taught enough math and science.
•Almost 4 in 10 say they would be “really unhappy” in a career that required “doing a lot of math or science”.
Source: Public Agenda. (2006). Reality check 2006, Issue no. 1: Are Parents and Students Ready for More Math and Science? 16The State of STEM in Florida
The information sources below allow us to evaluate K‐12 science and
mathematics achievement of students in Florida, including:
Florida and Education • Overall STEM performance
• Performance in particular STEM areas
• Gender‐specific performance
• Ethnicity‐specific performance
“Florida’s underperformance in educating its
young population could limit the state’s access
to a competitive workforce and weaken its Sources of Information on Student STEM Performance in Florida
economy over time. As the well‐educated baby
K‐12
boomer generation begins to retire, the
• Florida Comprehensive Assessment Test (FCAT)
diverse young population that will replace it
o Administered by the Florida Department of Education
does not appear prepared educationally to
• National Assessment of Educational Progress (NAEP)
maintain or enhance the state’s position in a
global economy.”
o Administered by the National Assessment Governing Board and the U.S.
Department of Education
‐ The National Center for Public Policy and Higher • Course enrollment/completion
Education. (2006). Measuring up 2006: The State
• Advanced Placement (AP) examinations
Report Card on Higher Education, Florida. p. 3.
o Administered by the College Board
Higher Education
• College readiness
• College degrees awarded
17FCAT Science
The FCAT is a criterion‐referenced test that measures how well Florida students are meeting the Sunshine
State Standards, adopted by the Florida Board of Education.
Percent of students at or above grade level on FCAT Science
55 55
Grade 5 Grade 8 Grade 11
50 50
46
46% 2009
45 45
Percent, %
Percent, %
43 41%
42
41
40 40 40
38 38 37%
37 37
35 35 35
33
32
30 29 30
28 28
25 25
2003 2004 2005 2006 2007 2008 2009 5 8 11
School Year Grade
Major Findings:
• There have been considerable improvements in performance at grades 5 and 8 since 2003,
but much more improvement is needed.
• Currently less than 50% of Florida’s students perform at or above grade level in science.
• Performance levels decline from grades 5 to 11.
Data Source: Florida Department of Education. (2009d). Science Scores: Statewide Comparison for 2003 to 2009. 18FCAT Mathematics
The FCAT is a criterion‐referenced test that measures how well Florida students are meeting the Sunshine
State Standards, adopted by the Florida Board of Education.
Percent of students at or above grade level on FCAT Mathematics
85
Grade 3 Grade 5 Grade 8 Grade 10 100
76
78
78%
75%
2009
75 80
74 68% 69%
72 66%
62% 60%
Percent, %
Percent, %
69 69 55%
68
67 60
66
65 64
65 65
63 63 63 63
62
61
59
60
59
60
59
60
59
40
57 57
56 56
55 55
53 20
52 52 52
48 48
45 0
2001 2002 2003 2004 2005 2006 2007 2008 2009 3 4 5 6 7 8 9 10
School Year Grade
Major Findings:
• The percent of students scoring at or above grade level has increased for all grades. Florida is moving in the right direction.
• The size of the increase was greatest in the elementary grades. More momentum is needed, especially in the upper grades.
• Florida’s students score higher in mathematics than in science, but many students are still below grade level.
Data Source: Florida Department of Education. (2009c). Mathematics Scores: Statewide Comparison for 2001 to 2009, http://fcat.fldoe.org/fcinfopg.asp
19FCAT Mathematics: Higher Performers
FCAT Performance: Percent of students performing at Basic, Proficient,
and Advanced Levels
Grade 4 Grade 8
100 100
Major Findings: 80 80
26 27 31 31 34 32
Percent, %
Percent, %
19 20 22 24 26 26 27 29
60 60
40 32 34 37 38 40 32
For all years shown, a 36 37 36 31 31 32 33 34 35
greater percent of 10th 20
24 23 21 21
20
22 22 21 20 20
19 18 18 19 19
grade students scored at 0 0
advanced levels than did 2002 2003 2004 2005 2006 2007 2008 2002 2003 2004 2005 2006 2007 2008
4th or 8th grade students. School Year School Year
Grade 10 Advanced, FCAT Levels 4 & 5
The percent of students
100
scoring at the advanced Proficient, FCAT Level 3
levels increased between 80
Percent, %
38 36 37 41
2002 and 2008 for each 60 35 36 39 Basic, FCAT Level 2
grade. The greatest 40
25 24 26 27 26 28 28 Below Basic (FCAT Level 1) not shown
increase (15 percentage 20
21 20 21 22 20
points) occurred in the 4th 0
19 19 Data Source: Center on Education Policy. (2009). State Test
grade. Score Trends through 2007‐08. Are Achievement Gaps Closing
2002 2003 2004 2005 2006 2007 2008
and Is Achievement Rising for All?
School Year
20FCAT Mathematics: Districts
Grades 3‐10 performing on grade level and above
(FCAT Mathematics 2009)
Concern: The majority of school districts in Florida are
facing challenges in teaching mathematics.
• In 2009, over 2/3 of the districts in Florida had fewer
than 68% of their Grade 3‐10 student population % At Grade
performing on grade level and above in mathematics.
Level and Above
• Only 8 districts had at least 74% of their Grade 3‐10
student population performing on grade level and
above in mathematics.
For the ten school districts with the highest student
enrollment, accounting for ~60% of PreK‐12 student
enrollment, the percentages of students at grade level and
above are as follows:
Percent of student
Districts population at grade
level or above
Percent of students who scored 3 or above on the Florida Comprehensive
Dade, Duval, Polk 47-63
Hillsborough, Lee, Assessment Test (FCAT) in mathematics in each school district
Orange, Pinellas 63-68
Data Sources: Florida Department of Education, http://fcat.fldoe.org;
Broward, Palm Beach 68-74
Florida Department of Education. (2010). Membership in Florida’s Public Schools, Fall 2009.
Brevard 74-79
21State Proficiency Standards: Grade 4 Math
State assessments in each of the 50 states have a proficiency standard, a "cut‐off" score indicating the level of
achievement required to be considered proficient in a particular grade and subject. States develop their own tests
(e.g., FCAT in Florida) and set their own proficiency standards, which vary considerably. NAEP provides a common
metric for comparing this “cut‐off” score, or bar, set by each state. Only Massachusetts sets the bar higher than
the NAEP Proficient standard in both 4th and 8th grade mathematics. The vast majority of states, including
Florida, set the bar between NAEP Basic and Proficient standards.
Comparison between grade 4 state requirements for proficiency in mathematics, projected onto the NAEP scale
330
280
254
NAEP Score
Proficient (249)
245
245
240
239
239
238
237
236
236
234
230
233
231
229
229
228
226
226
225
225
224
224
223
223
222
220
220
220
220
219
219
219
217
217
217
216
216
213
213
213
230
208
206
205
204
204
201
198
Basic (214)
180
Washington
West Virginia
South Carolina
Vermont
Louisiana
Wisconsin
Virginia
Massachusetts
Missouri
New Hampshire
Hawaii
Minnosota
Rhode Island
Maine
Montana
New Mexico
North Carolina
Florida
Indiana
Arkansas
North Dakota
California
Ohio
Delaware
South Dakota
Nevada
Pennsylvania
Connecticut
Oregon
Iowa
Idaho
Texas
Wyoming
New Jersey
Kansas
Alaska
Arizona
Georgia
Oklahoma
Illinois
Maryland
Alabama
Mississippi
Michigan
Colorado
Tennessee
Kentucky
New York
NAEP scale equivalent scores for the state grade 4 mathematics standards for proficient performance, by state, 2007
Data Source: National Center for Education Statistics. (2009). Mapping State Proficiency Standards Onto NAEP Scales: 2005‐2007, Figure 3.
22
For details on the linking of state assessments and the NAEP, and a definition of basic and proficient levels, see Notes, Section C.State Proficiency Standards: Grade 8 Math
State assessments in each of the 50 states have a proficiency standard, a "cut‐off" score indicating the level of
achievement required to be considered proficient in a particular grade and subject. States develop their own tests
(e.g., FCAT in Florida) and set their own proficiency standards, which vary considerably. NAEP provides a common
metric for comparing how high different states set the bar. Florida sets the bar higher in 4th grade relative to
other states, but lower than many other states in the 8th grade.
Comparison between grade 8 state requirements for proficiency in mathematics, projected onto the NAEP scale
330
312
302
294
Proficient (299)
289
286
286
286
285
284
282
281
279
279
279
279
278
277
273
272
272
271
271
266
270
270
268
268
267
267
NAEP Score
266
265
265
265
264
280
262
262
262
260
259
259
253
253
252
251
249
243
234
Basic (262)
230
180
Washington
South Carolina
Wyoming
New York
Texas
Virginia
West Virginia
Massachusetts
Hawaii
Missouri
Minnesota
Maine
Vermont
New Mexico
New Hampshire
Montana
Rhode Island
North Dakota
Maryland
Arkansas
New Jersey
Delaware
Pennsylvania
South Dakota
Kansas
North Carolina
Arizona
Louisiana
Indiana
Ohio
Nevada
Florida
Alaska
Idaho
Iowa
Oregon
Mississippi
Wisconsin
Michigan
Colorado
Illinois
Alabama
Connecticut
Oklahoma
Georgia
Tennessee
California
Kentucky
NAEP scale equivalent scores for the state grade 8 mathematics standards for proficient performance, by state, 2007
Data Source: National Center for Education Statistics. (2009). Mapping State Proficiency Standards Onto NAEP Scales: 2005‐2007, Figure 3.
23
For details on the linking of state assessments and the NAEP, and a definition of basic and proficient levels, see Notes, Section C.Females in Science: K‐12
The science achievement gap between males and females begins in elementary school
and widens in the upper grades. Males consistently outperform females in all grade
levels tested.
Percent of students at or above grade level on FCAT Science
"The jobs of the future are going to require of
the workers a basic understanding of the 50
fundamental principles of mathematics and
science. If we do not in some way persuade 40
girls to study such subjects in elementary and
secondary school, they are automatically
Percent, %
cutting themselves out of a great many job 30
opportunities."
20 Female
Male
10
- U.S. Representative Vernon Ehlers (R-Michigan)
Nuclear physicist and member of the
House Subcommittee on Research and Science Education,
0
AAAS. (2009). Testifying before U.S. House
Subcommittee, Leshner Details Gender Gap in 2006 2007 2008 2006 2007 2008 2006 2007 2008
Science and Engineering.
Grade 5 Grade 8 Grade 11
Percent of students who scored 3 or above on the Florida Comprehensive
Assessment Test (FCAT) in science
24
Data Source: Florida Department of Education, http://fcat.fldoe.orgFemales in Mathematics: K‐12
There is minimal to no gender gap in average achievement relative to Florida’s mathematics
standards as measured by the FCAT. Males and females perform similarly at all grade levels.
Percent of students at or above grade level on FCAT Mathematics
“Average gender differences are small or
100
nonexistent, and our society’s focus on
them has diverted attention from the
essential task of raising the scores of both 80
boys and girls.”
Percent, %
60
‐ National Mathematics Advisory Panel. (2008).
Foundations for Success: The Final Report of the 40 Female
National Mathematics Advisory Panel, p. 32.
Male
20
0
06 07 08 06 07 08 06 07 08 06 07 08 06 07 08 06 07 08 06 07 08 06 07 08
Grade 3 Grade 4 Grade 5 Grade 6 Grade 7 Grade 8 Grade 9 Grade 10
Percent of students who scored 3 or above on the FCAT in mathematics
Data Source: Florida Department of Education, http://fcat.fldoe.org
25Females in STEM: K‐12
Males consistently outperform females on Advanced Placement exams in
mathematics and science.
Percent of Florida AP test‐takers in each gender group scoring 3 or above in 2008
“In general, researchers have found that girls
and women have less confidence in their math Computer Science AB
abilities than males do and that from early
adolescence, girls show less interest in math or Computer Science A
science careers.” Calculus BC
“However, it is important to note that not all Calculus AB
girls have less confidence and interest in Environmental Science
mathematics and science, and that girls, as
well as boys, who have a strong self‐concept Physics
regarding their abilities in math or science are Chemistry
more likely to choose and perform well in
elective math and science courses and to Biology Females Males
select math‐ and science‐related college Overall
majors and careers."
0 10 20 30 40 50 60 70 80 90
‐ Institute of Education Sciences. Encouraging Percent, %
Girls in Math and Science, (2007). p. 6
Percent of Florida students who scored 3 or above on Advanced Placement Exams
th ®
Data Source: College Board (2009). The 5 Annual AP Report to the Nation: Florida Supplement.
26Minorities in Math: FCAT
In Florida, achievement gaps between White, Hispanic, and African American students in FCAT
Mathematics persist across K‐12 grade levels but have decreased over time. Gaps appear in elementary
grades and increase in middle and high school.
Percent of students at or above grade level on FCAT Math: Grades 3‐10
Potential for economic gains by
improving education for all 90
Floridians 80
77
74 76
70 70 72
“If the gap between black and 66 68
63 64 62
60 58
61 White-African American
Latino student performance and
Percent, %
56
50
53 Achievement Gap by
white student performance had 49 48
46 46
41 42 41 43 Grade in 2009
been similarly narrowed, GDP in 40
37
34
2008 would have been between 30 31
Grades 3-5 25%
26 27 White‐African American
$310 billion and $525 billion 20
higher, or 2 to 4 percent of GDP. “
Achievement Gap 29 % Grades 6-8 30%
10
“The magnitude of this impact will 0 Grades 9 & 10 32%
rise in the years ahead as 2001 2002 2003 2004 2005 2006 2007 2008 2009
demographic shifts result in blacks Year
and Latinos becoming a larger White Hispanic African American
proportion of the population and
workforce.” Percent of students who scored 3 or above on the Florida
‐ McKinsey & Company (2009). The Comprehensive Assessment Test (FCAT) in Mathematics
Economic Impact of the Achievement
Gap in America's Schools, p. 5‐6. Data Source: Florida Department of Education, Mathematics Grade 3‐10 Achievement Level Graphs,
http://fcat.fldoe.org/fcinfopg.asp
27Minorities in Math: NAEP
On the National Assessment of Educational Progress (NAEP), the mathematics achievement gap
between Florida’s White, Black, and Hispanic students is narrowing but still persists.
4th Grade 8th Grade
300 300
270 28 points 22 points 270
Average Score
Average Score
240 240 25 points
37 points
210 210 White
Black
180 180
Hispanic
150 150
2003 2005 2007 2009 2003 2005 2007 2009
Major Findings:
• Student performance in mathematics increased over time for Black, Hispanic, and White students in both 4th and 8th grades.
• In both 4th and 8th grades, the achievement gap is greatest between Black students and White students.
• Black students improved more than White students in both 4th and 8th grades; the achievement gap narrowed from 2003 to 2009.
• In 8th grade the gap has narrowed more (12 points) than in the 4th grade (6 points).
• However, the 8th grade gap (25 points) remains higher than the 4th grade gap (22 points).
28
Data Source: NAEP Data Explorer, http://nces.ed.gov/nationsreportcard/naepdata/High School Graduation Rates
Though high school graduation rates have improved in Florida, gaps persist between White, Hispanic,
and African American students.
Percent of high school students graduating
(a) Excluding GEDs (b) Including GEDs
100 100
90 90
80 80
70 State 70 State
Percent, %
Percent, %
60 60
White White
50 50
40 40
African African
30 American 30 American
20 Hispanic 20 Hispanic
10 10
0 0
2004-05 2005-06 2006-07 2007-08 2008-09 2002-03 2003-04 2004-05 2005-06 2006-07 2007-08
School Year School Year
The above rates were calculated (a) using the National Governors Association’s (NGA) recommended method, mandated by the Florida Legislature
in 2006 (standard and special diplomas included; GEDs excluded), and (b) using Florida’s regular method including standard diplomas, special
diplomas and GEDs.
Data Source: Florida Department of Education. (2009b). Florida Public High School Graduation Rates, 2007‐08.
29College Freshmen
Among incoming freshmen in the USA, Engineering and Biological Sciences are the most
popular choices for student STEM majors. Mathematics and Physical Sciences are the least
popular, while interest in Computer Science has varied considerably during the last three
decades.
Florida high school graduates in 2007
who required remediation at post‐
Intended major of incoming USA freshmen
secondary institutions based on entry‐
level tests (CPT, SAT‐I, ACT): 14
• Graduates entering Florida’s community 12 Engineering
colleges:
10
Biological
– 44% in mathematics
8 Science
– 32% in reading
Percent, %
– 27% in writing Computer
6
Science
• Graduates entering Florida’s state
4
universities: Physical
Science
2
– 3% in mathematics
Mathematics
– 2% in reading 0
– 2% in writing
1980
1982
1984
1986
1988
1990
1992
1994
1996
1998
2000
2002
2004
2006
2008
‐ Florida Department of Education. (2009a). Year
Florida Public High School Graduates: State
Summary by Type of Institution Attended. Data Source: Higher Education Research Institute. (2009). The American Freshman: National Norms
for Fall 2008.
30STEM Bachelor’s Degrees: SUS
Within Florida’s State University System (SUS) , the highest number of bachelor’s degrees in
STEM fields are awarded in Health Professions/Clinical Sciences and Engineering. The
fewest degrees are awarded in Mathematics and Physical Sciences.
“STEM majors accounted for 14
STEM Bachelor’s degrees awarded in Florida’s State University System
percent of all undergraduates
enrolled in U.S. postsecondary 4,500
Health Professions
education in 2003–04 and 15 and Clinical
4,000
percent of 2003–04 high school Number of degrees awarded Sciences
graduates who were enrolled in 3,500 Engineering
postsecondary education in 2006.”
3,000
“Roughly one‐third of students
2,500 Biological &
who entered a STEM field during Biomedical
the first year switched to a non‐ 2,000 Sciences
STEM field over the next 6 years.”
Computer &
1,500 Information Science
‐ National Center for Education 1,000
Physical Sciences
Statistics. (2009). Students Who Study
500
Science, Technology, Engineering and
Mathematics (STEM) in Post‐
0
Secondary Education, pp. 17‐18. Mathematics &
98-99 99-00 00-01 01-02 02-03 03-04 04-05 05-06 06-07 07-08 Statistics
School Year
Data Source: Florida Board of Governors, Interactive University Database, http://www.flbog.org/resources/iud/
For a definition of Health Professions and Clinical Sciences, see Notes, Section D.
31STEM Advanced Degrees: SUS
In the State University System (SUS), the number of master's degrees awarded has risen over the last
decade in Engineering and the Health Professions, while the number of master's degrees in other STEM
fields have remained about the same. The number of doctorates awarded in STEM fields has risen over the
last decade in the Physical Sciences, Biological/Biomedical Sciences, and particularly in Engineering and the
Health Professions. However, the number of doctorates awarded in Mathematics and
Computer/Information Sciences have remained about the same.
STEM master’s degrees awarded in Florida’s SUS STEM doctorate degrees awarded in Florida’s SUS
2,000 400
Health Professions &
Number of degrees awarded
Clinical Sciences
Number of degrees awarded
350
1,600
Engineering 300
1,200 250
Biological & 200
800 Biomedical Sciences
150
Computer & 100
400 Information Sciences
50
0 Physical Sciences
0
Mathematics &
Statistics
Data Source: Florida Board of Governors, Interactive University Database, http://www.flbog.org/resources/iud/
For a definition of Health Professions and Clinical Sciences, see Notes, Section D.
32STEM Bachelor’s Degrees: ICUF
At Florida's 28 Independent Colleges and Universities, the number of bachelor's degrees in
nursing is on the rise, while degrees in engineering have shown no change. Degrees in
computer/information science vary year to year, and show no net increase.
Independent Colleges and Universities of
Florida (ICUF) STEM bachelor’s degrees awarded at the Independent Colleges and
Universities of Florida (ICUF)
Florida's Independent Colleges and
Universities consist of 28 private, non‐profit 1200
educational institutions accredited by the
1000 Nursing
Southern Association of Colleges & Schools
Number of degrees
(SACS). As of 2008‐09, six of these institutions
800
offered bachelor's degrees in Engineering, with
the largest number awarded at Embry‐Riddle Engineering
600
Aeronautical University, Florida Institute of
Technology and University of Miami. The same 400
Computer &
year, 22 of the 28 institutions offered Information
200
Computer/Information Science bachelor's Sciences
degrees, with St. Leo University, Florida 0
Institute of Technology and Nova Southeastern 2005-06 2006-07 2007-08 2008-09
University offering the largest number. Ten
institutions offered bachelor's degrees in
Nursing, with Florida Hospital College of Data Source: Atherton, B. (2009). 2008‐2009 Accountability Report: Quality, Productivity,
Health Sciences, Jacksonville University, Barry Diversity, and Access. p. 36. http://www.icuf.org/_resources/publications/2008‐
2009%20Final%20Accountability%20Report%20PDF.pdf
University and Nova Southeastern University
accounting for the largest number.
33STEM Advanced Degrees: ICUF
Independent Colleges and Universities of Florida (ICUF) report graduate degrees awarded in Nursing,
Engineering and Computer/Information Sciences. In Nursing, the number of master’s degrees awarded
has generally risen, while the number of doctorates has declined. Master’s degrees in
Computer/Information Sciences have remained about the same. Other trends are difficult to interpret
because of year‐to‐year variations, resulting in part from the small number of degrees awarded.
STEM master’s degrees awarded at the ICUF STEM doctorate degrees awarded at the ICUF
300 60
250 Nursing 50
Number of degrees
Number of degrees
200 40
150 Engineering 30
100 20
Computer &
50 Information 10
Sciences
0 0
2005-06 2006-07 2007-08 2008-09 2005-06 2006-07 2007-08 2008-09
Data Source: Atherton, B. (2009). 2008‐2009 Accountability Report: Quality, Productivity, Diversity, and Access. p. 36.
http://www.icuf.org/_resources/publications/2008‐2009%20Final%20Accountability%20Report%20PDF.pdf
34STEM Degrees: Florida and the US
Relatively few 18‐24 year‐olds in Florida hold bachelor’s degrees in the Natural Sciences and
Engineering (NS&E)1 compared to 18‐24 year olds in the rest of the nation. Florida compares
more favorably to other states and the nation on the percent of NS&E degrees awarded at the
advanced level (master’s and doctorate degrees).
Major Findings:
Florida is below the US average, Florida's States
States with
Quartile US performing
below the states with the largest Indicator (1=highest,
Florida
Average
largest
2 highest on
economies 3
economies, and below the states 4=lowest) NAEP
with the highest NAEP achievement
in:
• The number of NS&E Bachelor's degrees in NS&E conferred
bachelor’s degrees per 1,000 individuals 18-24 years old 4th 5.8 8.1 7.1 11.0
conferred relative to the
population of college‐age NS&E degrees as share of higher
individuals, and education degrees conferred 3rd 15.8% 17.6% 18.1% 18.4%
• The percent of total
degrees conferred in NS&E Advanced NS&E degrees as share of
NS&E degrees conferred 2nd 24.6% 25.0% 27.2% 21.5%
(including bachelor’s
master’s and doctorate
1. For the listing of degrees included in Natural Sciences and Engineering, see Notes, Section E.
degrees).
2.Average of data from California, New York, and Texas.
th th
3. Average of data from 10 states with highest NAEP scores (average of 4 and 8 grade scores from 2009 Math and 2005
About 1/4 of all NS&E degrees Science; Massachusetts, New Hampshire, Vermont, North Dakota, Montana, Minnesota, South Dakota, Maine, Wisconsin,
conferred in Florida are at the New Jersey).
advanced level. This is on par with Data Source: 2007 Data. Original Sources: a‐ National Center for Education Statistics and b‐ US Census Bureau. Reported
the national average and only in: National Science Board. (2010). Science and Engineering Indicators 2010.
slightly below other states with the
35
largest economies.Females in STEM: Degrees
Percent of STEM bachelor’s degrees awarded to females compared to males
S’s
Engineering Computer/Information Science
100% 100%
Major Findings: 80% 80%
60% 60%
40% 40% 29% 30% 28% 28% 28%
24% 22% 21% 22% 21% 24% 24%
In Engineering males far 19% 20% 20% 19% 19% 18% 17% 14%
20% 20%
outnumber females and the
gap has remained constant 0% 0%
over time.
In Computer/ Information School year School Year
Science males far outnumber
females and the gap has
Physical Sciences
increased since 2000. 100%
80% Males
In the Physical Sciences,
Females
males outnumber females, 60% 47% 46%
40% 43% 43%
44%
39% 43% 46% 40%
but the gap is smaller than in 40%
Engineering or Data Source: Florida Board of Governors, Interactive
20%
Computer/Information University Database, http://www.flbog.org/resources/iud/
Science. 0% Data Source:
School Year 36Females in STEM: Degrees
The number of bachelor’s degrees awarded to females in Biological and Biomedical Sciences
outnumbers the bachelor’s degrees awarded to males. In the Health Professions and Clinical Sciences,
the gap is even wider. For both fields, the gap is increasing over time.
STEM Professions and the Job
Market Forecast Percent of STEM bachelor’s degrees awarded to females as compared to males
S’s
Health care tops the list of Biological/ Biomedical Sciences Health Professions/ Clinical Sciences
industry subsectors forecasted to 100% 100%
account for 86% of job growth
80% 80%
through 2016.
60% 60%
46% 44%
42% 39% 40%
38% 39% 38% 37%
40% 33% 40%
‐ Executive Office of the President, 20% 17% 17%
15% 13% 14% 13% 14% 14% 15%
Council of Economic Advisors. (2009). 20% 20%
Preparing the Workers of Today for
the Jobs of Tomorrow. 0% 0%
School Year School Year
Males Females
Data Source: Florida Board of Governors, Interactive University Database, http://www.flbog.org/resources/iud/
For a definition of Health Professions and Clinical Sciences, see Notes, Section D.
37Minorities in STEM: Degrees
Percent of bachelor’s degrees in STEM fields, by ethnicity,
relative to undergraduate enrollment
Engineering Computer/Information Science
70% 70%
Compared to the percent of 60% 60%
undergraduate enrollment 50% 50%
(gray bars): 40% 40%
30% 30%
In both Engineering and 20%
20%
Computer/Information Science: 10%
10%
0%
• Asians and non‐resident 0%
White Hispanic Black Asian Non‐res.
aliens are overrepresented; Alien White Hispanic Black Asian Non‐res.
Alien
• Blacks and Whites are
underrepresented.
Biological/Biomedical Sciences
In Biological/Biomedical 70% Bachelor’s degrees awarded in 2007‐
Sciences: 60% 2008 by the State University System
50%
• Asians are 40% Undergraduate enrollment (all fields)
30% in the State University System in 2007
overrepresented;
20%
• Blacks and Whites are 10%
underrepresented. 0%
White Hispanic Black Asian Non‐res. Data Source: Florida Board of Governors, Interactive
Alien University Database, http://www.flbog.org/resources/iud/
38Minorities in STEM: Degrees
Percent of bachelor’s degrees in STEM fields, by ethnicity,
relative to undergraduate enrollment
Compared to the percent of Physical Science Mathematics
70% 70%
undergraduate enrollment 60% 60%
(gray bars): 50% 50%
40% 40%
In the Physical Sciences: 30% 30%
20% 20%
• Asians are 10% 10%
overrepresented; 0% 0%
• Blacks are White Hispanic Black Asian Non‐res. White Hispanic Black Asian Non‐res.
Alien Alien
underrepresented
In Mathematics:
Health Professions/Clinical Sciences
• Whites and Asians are 70% Bachelor’s degrees awarded in 2007‐
60%
overrepresented; 2008 by the State University System
50%
• Hispanics and Blacks are 40% Undergraduate enrollment (all fields)
underrepresented. 30% in the State University System in 2007
20%
In Health Professions/Clinical 10%
0%
Sciences:
White Hispanic Black Asian Non‐res.
Alien Data Source: Florida Board of Governors, Interactive
• Blacks are
University Database, http://www.flbog.org/resources/iud/
overrepresented;
• Whites and Hispanics are For a definition of Health Professions and Clinical Sciences, see Notes, Section D. 39
underrepresented.NGSS Standards
Recently Florida adopted the Next Generation Sunshine State Standards (NGSSS), which
require all students to demonstrate a greater, in‐depth proficiency in math and science.
A newly revised FCAT will test the performance of students relative to these standards.
Next Generation Sunshine State Standards (NGSSS):
What will Florida’s new standards require of
• Revised K‐12 content standards identifying what Florida students need to know
students? and be able to do at each grade level.
• Learning important topics and concepts in‐depth. • Aligned with national initiatives of the American Association for the Advancement
of Science, the National Council of Teachers of Mathematics, and Achieve, Inc.
• More critical thinking and reasoning: compare,
contrast, explain, justify, estimate, evaluate, • Developed by teachers, district specialists, and university faculty with input from
analyze, synthesize. the public and business community.
• Mastering specific mathematics and science • Adopted in Sept 2007 (Mathematics) and Feb 2008 (Science).
content at each grade level; less grade‐to‐grade
repetition.
Website for the NGSSS: http://www.floridastandards.org/index.aspx
What will Florida’s new standards require of
Measures for assessing the impact of the NGSSS:
teachers?
Revising the FCAT: The FCAT will measure student achievement relative to the new, more
• Deeper content knowledge in science and rigorous NGSSS in 2011 for Mathematics, 2012 for Science. In the meantime, school districts
mathematics. are required to incorporate the new standards into their curricula.
• Increased knowledge and skill in mathematics Developing End‐of‐Course Exams: Students taking required courses in Mathematics and
and science teaching. Science will be expected to pass an end‐of‐course test. These tests are currently being
developed. The field‐testing of the first exam, Algebra I, will occur in May of 2010.
• New ways to assess student performance and to
help all students maximize their learning.
For a comparison of Florida’s Standards with those from other states/nations, see Notes, 40
Section F.Secondary STEM Teacher Certification
In Florida, college graduates may become certified to teach mathematics or science if they have the
appropriate education training and at least the following coursework in mathematics and science:
Elementary Education (K‐6):
• STEM credits are not required for state certification of elementary teachers,
although specific teacher preparation programs may require them.
Middle Grades Only (5‐9):
• Middle Grades Integrated Curriculum Certification:
Middle and Upper Grades (6‐12):
o 12 semester hours in each mathematics and
• Certification in Mathematics:
science.
o 30 semester hours in mathematics, including:
• Middle Grades Mathematics Certification:
6 semester hours in calculus,
o 18 semester hours in mathematics, including
credit in geometry,
the following disciplines:
credit in probability or statistics,
calculus, precalculus, or
credit in abstract or linear algebra; or
trigonometry;
o specialization requirements completed for physics, plus 21
geometry; and
semester hours including the above list.
probability or statistics.
• Certification in Separate Areas of Science (biology, chemistry, earth‐
• Middle Grades General Science Certification:
space science, or physics):
o 18 semester hours in science, including the
o 30 semester hours in science, including 21 semester hours in
following:
the area with associated laboratory experience; or
biological science;
o specialization requirements completed for another science area
chemistry or physics; and
(biology, chemistry earth‐space science, or physics) plus 18
earth‐space science or earth science.
semester hours in area of certification.
Data Source: Florida Department of Education http://www.fldoe.org/edcert/subjlist.asp 41
Additional information about credentials of Florida’s current secondary public school teachers has been requested from the Florida Department of Education.You can also read