ON THE JOINT EXPLOITATION OF OPTICAL AND SAR SATELLITE IMAGERY FOR GRASSLAND MONITORING
←
→
Page content transcription
If your browser does not render page correctly, please read the page content below
The International Archives of the Photogrammetry, Remote Sensing and Spatial Information Sciences, Volume XLIII-B3-2020, 2020
                                                 XXIV ISPRS Congress (2020 edition)

    ON THE JOINT EXPLOITATION OF OPTICAL AND SAR SATELLITE IMAGERY FOR
                          GRASSLAND MONITORING

                                             A. Garioud1,2, ∗, S. Valero2 , S. Giordano1 , C. Mallet1
                   1
                   Univ. Gustave Eiffel, IGN-ENSG, LaSTIG, Saint-Mande, FRANCE - firstname.lastname@ign.fr
       2
           CESBIO, Université de Toulouse, CNES/CNRS/INRAE/IRD/UPS, Toulouse, FRANCE - silvia.valero@cesbio.cnes.fr

                                                         Commission III, WG III/6

KEY WORDS: Time-series, Data fusion, Sentinels, Regression, NDVI, Recurrent Neural Networks, Gap filling, Ablation Study.

ABSTRACT:

Time series of optical and Synthetic Aperture RADAR (SAR) images provide complementary knowledge about the cover and use
of the Earth surface since they exhibit information of distinct physical nature. They have proved to be particularly relevant for
monitoring large areas with high temporal dynamics and related to significant ecosystem services. Grasslands are such crucial
surfaces, both in terms of economic and environmental issues and the automatic and frequent monitoring of their agricultural
practices is required for many purposes. To address this problem, the deep-based SenDVI framework is presented. SenDVI proposes
an object-based methodology to estimate NDVI values from Sentinel-1 SAR observations and contextual knowledge (weather,
terrain). Values are regressed every 6 days for compliance with monitoring purposes. Very satisfactory results are obtained with this
low-level multimodal fusion strategy (R2 =0.84 on a Sentinel-2 tile). Finer analysis is however required to fully assess the relevance
of each modality (Sentinel-1, Sentinel-2, weather, terrain) and feature sets and to propose the simplest conceivable framework.
Results show that not all features are necessary and can be discarded while others have a mandatory contribution to the regression
task. Moreover, experiments prove that accuracy can be improved by not saturating the network with non-essential information
(among contextual knowledge in particular). This allows to move towards more operational solution.

            1. INTRODUCTION AND MOTIVATION                                 resolution, with global coverage, and with a temporal revisit of
                                                                           5/6 days at mid-latitudes.
1.1    Context
                                                                           1.2   Problem Statement
Accurate and regular monitoring of terrestrial biomass is today
an essential need in environmental, economic, and social terms.            For vegetation monitoring, e.g., grasslands, optical sensors are
Among vegetation, grasslands are crucial ecosystems: they are              mostly preferred as recently enlightened in (Griffiths et al., 2020)
the second most represented land cover surfaces throughout the             and (Liu et al., 2020). These sensors capture the interaction of
world after forests. They support many so-called ecosystem ser-            light with the chemical properties of the target, efficiently de-
vices, such as carbon storage, prevention of soil erosion, pro-            scribing the vivacity and photosynthetic activity of the plants.
duction of quality food, and preservation of biodiversity (Bengts-         However, optical data suffer from the recurring presence of
son et al., 2019, Buchmann et al., 2019). Remote sensing has               clouds, resulting in numerous missing data, which can last from
proved to be a suitable tool to monitor in such a direction (Atzber-       a few days to a few months. It prevents meeting the require-
ger, 2013, Weiss et al., 2020). Initial efforts have explored the          ments of dense surveillance of grasslands (Kolecka et al., 2018).
needs and challenges of regular monitoring of agricultural prac-           Most monitoring approaches integrating optical satellite data
tices such as mowing, grazing or ploughing on grasslands (Gari-            are based on the exploitation of derived vegetation indices (Ali
oud et al., 2019). Quantifying and determining the nature of               et al., 2017, Pasqualotto et al., 2019, Tiscornia et al., 2019).
these technical acts is important since they affect the quality of         Among these indices, NDVI is still widely used for its simpli-
grassland ecosystem services. The key identified factor is the             city and ease of interpretation (Stendardi et al., 2019, Solano-
periodicity of monitoring. Many grasslands have a prominent                Correa et al., 2020, Belgiu, Csillik, 2018). To deal with cloud
part in production systems: they are intensively farmed. Grass             coverage, most of the studies apply a gap filling step to recon-
regrowth can be favoured by nitrogen inputs or favourable cli-             struct missing values in time-series with available cloudless im-
matic conditions. As a result, biomass values can return to their          ages. Among traditional gap-filling methods, common practice
initial state after only about ten days following a technical act.         relies on a linear (or splines) interpolation method between the
Thus, reliable weekly measurements are required.                           cloudless date preceding and following the missing one. This
Satellite constellations allowing a temporal revisit of the order          approach has shown its effectiveness especially in classification
of a few days, coupled with a free-access policy have emerged              tasks (Vuolo et al., 2017, Fauvel et al., 2020). Nevertheless, for
in the recent years. Possibilities of Earth Observation applic-            a precise follow-up of the targets evolution and especially in the
ations in monitoring vegetation status have steadily increased             case of abrupt and rapid phenomena such as management prac-
(Frampton et al., 2013, Mercier et al., 2020). The Sentinel                tices on grasslands, these techniques do not allow for a proper
satellites of the European Copernicus program allow the joint              handling of missing data.
exploitation of optical and SAR data with similar high spatial             The integration of various optical sensors from different satel-
                                                                           lites has been proposed in (Claverie et al., 2018, Li, Guo, 2018,
∗   Corresponding author                                                   Griffiths et al., 2019). This strategy however leads to problems

                                                     This contribution has been peer-reviewed.
                       https://doi.org/10.5194/isprs-archives-XLIII-B3-2020-591-2020 | © Authors 2020. CC BY 4.0 License.                 591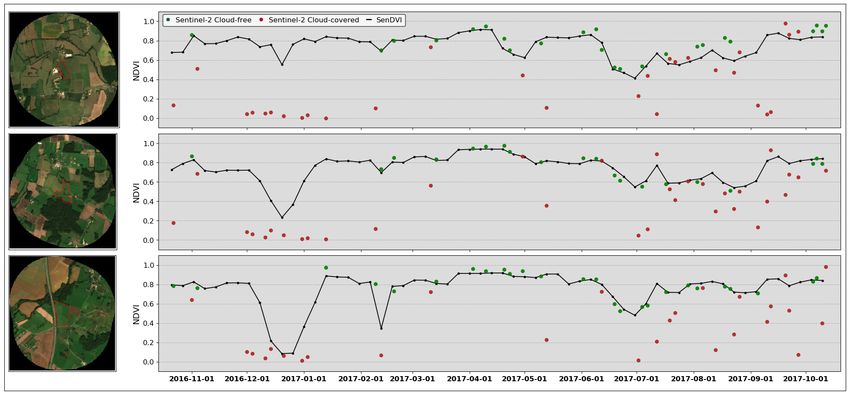
The International Archives of the Photogrammetry, Remote Sensing and Spatial Information Sciences, Volume XLIII-B3-2020, 2020
                                               XXIV ISPRS Congress (2020 edition)

of spatial and radiometric standardization between data sources.    the two types of features described in the following have been
Despite an increase in the number of images, relying on optical     considered :
imagery alone only diminishes the missing data issue.
Synthetic Aperture Radar (SAR) data has therefore been in-          Sentinel derived features consist of 53 optical Level-2A S2 im-
creasingly exploited. As an active remote sensing source, it        ages from which NDVI is calculated. The pre-processing is car-
is capable of acquiring data day and night. The radio frequency     ried out by the MAJA chain which integrates cloud and shadow
transmission power of the SAR sensors also allows them to be        masks. 60 ascending and 60 descending orbit images from S1
cloud insensitive. On the ground, SAR sensors interact with the     are available during the agricultural season. σ0 values (VV, VH,
dielectric and geometric properties of the target. As a result,     and VV/VH polarization), and 6-day InSAR coherence (VV
these data are affected by climatic events (rain, frost, humid-     and VH polarization) are derived. In order to take into account
ity), as well as by the effects of ground relief. Although monit-   incidence angles and acquisition times, the ascending and des-
oring of grasslands with SAR data only shows satisfactory res-      cending orbits of Sentinel-1 are independently processed. For
ults (Buckley, Smith, 2010, Siegmund et al., 2016, Tamm et al.,     each parcel, mean, median, and standard deviation of the op-
2016, Zalite et al., 2016, Chiboub et al., 2019), most of stud-     tical and SAR satellite bands are computed. Additionally, for
ies are either relying on full polarimetry (giving access to the    each SAR feature, slope between each date and the previous
Radar Vegetation Index) or on Very High Resolution (VHR)            one is given for individual parcels as well as the mean slope for
data. Both are difficult to access and not compliant with dense     parcels in a spatial neighborhood (e.g., 2km) around this parcel.
monitoring requirements.
                                                                    Contextual information are derived from ancillary data and
1.3   Motivation and contribution                                   from acquisition metadata. 25 climatic variables (e.g. rain,
                                                                    temperature, frost, etc.) are extracted from the Météo France
The joint exploitation of optical and SAR data is necessary to      SAFRAN-ISBA dataset since weather has a strong effect on
monitor grasslands with high regular temporal sampling. These       S1 signals and grasslands (Moreira et al., 2019). These vari-
techniques mainly focuses on independent processing of optical      ables are daily provided and computed for each parcel from the
and SAR data with a late fusion strategy. High-level fusion         nearest weather station. 5 topographic descriptors (e.g. height,
schemes are based on complex ad-hoc decision rules defined on       exposition, slope, etc.) are given with a 5 m resolution Di-
restricted areas. They often rely on empirically tuned paramet-     gital Surface Model provided by IGN-France. Temporal con-
ers. Few works propose a low-level fusion of optical and SAR        text (e.g., week number, month, season) is given to each input
data, mainly for image-to-image translations tasks (Merkle et       date, as well as time shift separating Sentinel-1 and Sentinel-2
al., 2017, He, Yokoya, 2018, Hughes et al., 2019). In a similar     acquisitions. The LPIS agronomic type of the grassland is also
direction, supervised regression of optical and SAR data for ve-    provided (22 grassland classes on the area).
getation parameter retrieval has been proposed in (Baghdadi et
al., 2016) using Neural Networks or with Gaussian Processes in      Because of the prerequisites of the method described below,
(Pipia et al., 2019), both for LAI estimation. In (Scarpa et al.,   Sentinel-1 and contextual data are all standardized by channel.
2018) Convolutional Neural Networks are adopted for NDVI            With less Sentinel-2 data available, a common temporal grid
S1/S2 reconstruction but focused on short time series, discard-     between S2 and S1 data is required for the regression task. S2
ing the temporal information. In parallel, a first low-level fu-    data is interpolated by the nearest neighbor method on the S1
sion approach has been suggested in (Garioud et al., 2019) en-      descending acquisition grid.
abling the regression of S1 SAR observations to S2 NDVI val-
                                                                    2.2   Method
ues. This Reccurent Neural Network framework integrates con-
textual data (weather/terrain) provided from external sources. It
                                                                    The Sentinels-NDVI (SenDVI) network is based on Recurrent
allows the regression task to refine the satellite measurements.
                                                                    Neural Networks (RNN) and follows the preliminary works de-
Nevertheless, the model relies on a number of important and
                                                                    scribed in (Garioud et al., 2019). Refined with a two-branch
sometimes difficult to access sources of information. In this
                                                                    approach in order to integrate contextual information more ac-
paper, we target to:
                                                                    curately, the network is assessed by its capacity to reconstruct
                                                                    NDVI time-series on a high temporal sampling. A deep learn-
  • Explore the relationship between optical, SAR and con-          ing approach was chosen for the task since it generally offers
    textual data by proposing a deep-based network for a re-        better results than traditional machine learning approaches such
    gression task. The analysis is two-fold: on the basis of        as Random Forest or Support Vector Machine (Ienco et al.,
    physical understanding and computational constraints.           2017, Reichstein et al., 2019, Kamilaris, Prenafeta-Boldú, 2018).
  • Quantify, for various feature sets, for scalability and auto-   This method allows to alleviate the issue of selecting input data,
    mation purposes, gains and losses in accuracy. We aim           permits to explore voluminous data and solve complex regres-
    to select the required input data for satisfactory regression   sion configurations.
    results.                                                        SenDVI aims to learn the statistical relationships among multi-
                                                                    sensor multi-variate time-series. Sentinel-1 features are con-
                                                                    sidered as inputs and Sentinel-2 cloud-free NDVI values as la-
      2. PROPOSED REGRESSION FRAMEWORK                              bels. Cloud mask associated to each S2 date is used to select
                                                                    the cloudy dates among the time-series for each parcel. These
2.1   Data                                                          dates are not considered for computing the loss (Mean Squared
                                                                    Error loss function) during the training phase since they may
The study area is located on the South-East of France covering      not be reliable labels.
a Sentinel-2 tile (T31TFM).The French Land-Parcel Identifica-
tion System (LPIS) is used to retrieve 23, 850 parcels of grass-    The network is divided into three blocks as shown in Figure 2.
lands from the studied area. Agricultural season from October       The first block consists of two separate branches, one for as-
2016 to October 2017 is considered. For each grassland parcel,      cending and one for descending SAR acquisitions. This block is

                                               This contribution has been peer-reviewed.
                 https://doi.org/10.5194/isprs-archives-XLIII-B3-2020-591-2020 | © Authors 2020. CC BY 4.0 License.              592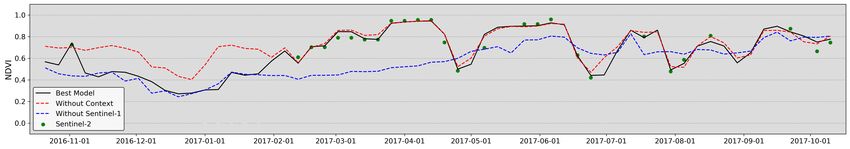
The International Archives of the Photogrammetry, Remote Sensing and Spatial Information Sciences, Volume XLIII-B3-2020, 2020
                                               XXIV ISPRS Congress (2020 edition)

 Figure 1. Comparison between predicted NDVI time-series obtained by the SenDVI network and actual Sentinel-2 NDVI values for
 three grassland parcels (left). Green dots indicates valid non-cloudy Sentinel-2 values while red dots are cloudy days (missing data).
  Black line shows the SenDVI network prediction with high temporal sampling. It follows correctly the non-cloudy values and keep
                                                      high frequencies of the signal.

used to encode both SAR data and contextual data with Multi-
Layer Perceptrons (MLPs) composed of successive linear re-
gression layers, normalization, non-linear activation (i.e. Rec-
tified Linear Units layer), and dropout. The outputs of each
branch are merged by element-wise multiplication (Hadamard
product) in order to apply contextual measurements to SAR
observations. Finally, ascending and descending branches are
concatenated in a single weighted feature vector for each date
corresponding to the input data of the second block.
The second block performs the recurrent learning of the SAR-
to-optical regression parameters for each date. The Recurrent
Networks have the advantage of retaining a memory of past ob-
servations through gating mechanisms. This capability is par-
ticularly effective for time series and is suitable for vegetation
measurements with periodicity. A bi-directional Gated Recur-
rent Unit (GRU) network was chosen. It exhibits similar results
to other types of RNNs for fewer parameters (Ndikumana et al.,
2018, Zhao et al., 2019).
Lastly, the third block decodes the outputs of the second block
with an in-depth funnel-shaped MLP. It results in a single value
of NDVI for each date.                                                Figure 2. Schematic overview of the proposed SenDVI Network.

2.3   Validation of SenDVI framework
                                                                      All SenDVI results provided hereafter are the average results
The input data used to train and validate SenDVI is composed          obtained of 5 runs of a model configuration. Each model has a
of 25 Sentinel-1 values and 92 contextual values per branch.          5-fold cross-validation with 3/5 of the dataset retained for train-
Performance evaluation of the SenDVI network is measured              ing (14,310 parcels), 1/5 for validation during training and the
with three standard regression quality metrics: coefficient of de-    remaining 1/5 for testing (each of the 4,470 parcels). During
termination (R2 ), Mean Absolute Error (MAE) and Root Mean            each fold, the test parcels on which the metrics are calculated
Squared Error (RMSE). Metrics are only calculated on dates            are different. With the use of one GPU NVIDIA RTX 2080,
where Sentinel-2 data was not affected by clouds.                     one run of a 5-fold cross-validation model takes about 1 hour
The hyper-parameters of the model are empirically defined. A          and 20 minutes in total for 150 epochs per fold.
learning rate of 10−3 is used with a batch size of 128 and the        Although Sentinel-1 and Sentinel-2 sensors do not measure the
Adam optimizer is selected. The encoding MLPs are 4-layer             same physical phenomena, nor under the same conditions, the
deep and the decoding MLPs are 6-layer deep. The dropout              SenDVI regression architecture shows a satisfactory quality for
during encoding is set to 0.2 while the dropout during decod-         time-series reconstruction. Between S2 cloudless NDVI values
ing starts at 0.4 and is reduced for each subsequent layer. The       and SenDVI-derived NDVI values, a mean R2 of 0.84, MAE
GRU hidden size is set to 256 and is dropout-exempt. The result       of 0.038 and RMSE of 0.058 were obtained for the five runs
model has about 1.5 million parameters.                               (Table 1).

                                               This contribution has been peer-reviewed.
                 https://doi.org/10.5194/isprs-archives-XLIII-B3-2020-591-2020 | © Authors 2020. CC BY 4.0 License.                  593
The International Archives of the Photogrammetry, Remote Sensing and Spatial Information Sciences, Volume XLIII-B3-2020, 2020
XXIV ISPRS Congress (2020 edition)
Mean Median Std and without the VV/VH ratio band. Results shown that the
best performances are not obtained by the full model, which
R2 0.8410 0.8430 0.0039 is ranked in 4th position. We can however notice a limited dif-
MAE 0.0388 0.0385 0.0007 ference.
RMSE 0.0586 0.0583 0.0009
The best results are obtained by removing the information re-
Table 1. SenDVI regression scores over grasslands. lated to the temporal context. This information is in fact in-
duced by the stable sequencing (e.g. every 6 days) of the time-
Qualitative assessment can be performed through visual inspec- series. Somehow duplicating this information is therefore not
tion of reconstructed time-series by looking at Figure 1. Results necessary and does not provide relevant additional information.
show very satisfactory reconstructed NDVI time-series. Our The use of a GRU rather than an Long short-term memory
method is able to (i) reconstruct the signal despite significant (LSTM) network, which has a dedicated long-term memory
temporal gaps and (ii) preserve main breakpoints, which are vector, may also explain the low contribution of this feature.
crucial for detecting human activity. In average for the whole Nevertheless, tests done by replacing the GRU with an LSTM
dataset, only 26 images are exploitable among the 53 available. do not seem to affect the importance of this feature. The model
More than half of the image set over a year is obscured by without the topographic information obtains also equivalent res-
clouds and therefore do not provide information on the parcel ults, even if this information seems important at first glance.
vegetation evolution. With the help of the low-level fusion from Indeed, the topographic feature provides information on the
SenDVI, even when significant gaps exists (e.g., >1 month, see topography related to the area but also on the exposition of
left part of the signals in Figure 1), 60 reliable values are en- each parcels that could be related to the aiming specifications
sured every year. Our results are therefore compliant with the of the sensor. However without this information the standard
requirements of weekly measurements needed in an accurate deviation between the five runs is the lowest among the tested
monitoring of grasslands. configurations. Agronomic type of the grassland parcel also
does not seem to influence the results. Although 22 agronomic
classes are present in the area, 61.78% of the parcels are repres-
3. OPTICAL, SAR AND ANCILLARY DATA :
ented by a single class and 95.9% of the total are spread over
BEHAVIOR AMONG REGRESSION TASK
3 classes (long rotation grassland of 6 years or more, perman-
ent grassland of 5 years minimum, temporary grassland of 5
The reconstructed NDVI time-series show satisfactory statist-
years or less). Moreover, these 3 classes are mainly discrimin-
ical as well as visual results. However, the acquisition and
ated by the inter-annual duration of the grassland cover and do
pre-processing steps for the various features can be tedious,
not necessarily distinguish between different agronomic types.
cost-intensive, and therefore not in line with operational con-
VV/VH ratio band often appears to be the most correlated with
straints. A first question arises about the need to process the
NDVI (Fieuzal et al., 2013, Veloso et al., 2017, El Hajj et al.,
large amount of input data. The second question is the assess-
2019), albeit hiding this information to the network input has
ment of which input and contextual information are mostly es-
little impact on the regression capability. Although, the stand-
sential for this regression task. Therefore, the qualitative and
ard deviation between runs is more significant. The MLPs used
quantitative analysis of the contribution of each feature is stud-
for encoding in the first block of the network (Section 2.2) are
ied by an ablation study. Considering the two different types
certainly efficient to compute similar simple information such
of inputs described in 2.1, each feature within the two categor-
as a ratio of two values. Their preliminary calculation therefore
ies will be removed one by one for training a new model. The
appears to be negligible.
same metrics as in 2.3 are computed allowing to compare the
regression accuracy of the model without the feature of interest
against the full model. The rank of the model among the con- 3.1.1 Contextual features. Among the contextual features,
figurations is also given according to the R2 score of the con- the time shift (delta) between the acquisition date of Sentinel-2
figuration (the highest being rank 1). The so-called full model and the interpolated Sentinel-1, the climate information as well
consists of 5 runs of 5-fold cross-validated models with the full as the information from neighboring parcels are the most im-
set of data as presented in 2.3 and is our baseline. The split- portant ones. For these three features, their removal results in a
ting of the dataset (train, validation, test) as well as the net- larger standard deviation of the accuracy scores. Time-delta in-
works hyper-parameters and architecture (e.g. encoder depth formation is visibly more expressive for the network than tem-
and sizes, learning rate and hidden layer size of RNN and de- poral context (e.g. moment within the year, etc.). Climatic con-
coder depth and sizes) are equally fixed for all the experiments. ditions have a direct impact on the state of the vegetation. This
information therefore seems adequate to regress NDVI values
3.1 Ablation study accurately. Nevertheless, it is derived from the nearest meteor-
ological station and is therefore similar for a large number of
We call ”ablation” the relevance assessment of the various fea- parcels. It seems certain that if such information with a finer
tures. We do not here evaluate the potential simplification or spatial resolution was integrated with the contextual informa-
complexity of the deep-based architecture. tion, the results would be improved. The spatial component of
We consider 16 distinct configurations of feature sets. They are contextual information (e.g. neighborhood slope) is the most
decomposed into 3 families (see the respective subsections): 6 significant. Indeed, knowing the average evolution of neigh-
context features, 5 features derived from Sentinel-1, and 5 more bouring parcels for the network makes it possible to frame the
generic sets (called global features) will be separately removed. evolution of the parcel of interest within a range. The suppres-
Main results are shown in Figure 3. For the 16 configurations, sion of this information thus leads to a drop in the regression
the median R2 value is 0.8227 and the standard deviation is score to 0.8227. Since the information given is only a simple
0.064. Five configurations exhibit very close scores, with a R2 mean, more elaborate metrics on the evolution of neighboring
value around 0.84: the full model, the model without the fea- parcels such as spatial entropy (Gao et al., 2014) or Moran’s
tures related to topography, temporal context, agronomic type, Index (Das, Ghosh, 2017) could improve the results.
This contribution has been peer-reviewed.
https://doi.org/10.5194/isprs-archives-XLIII-B3-2020-591-2020 | © Authors 2020. CC BY 4.0 License. 594The International Archives of the Photogrammetry, Remote Sensing and Spatial Information Sciences, Volume XLIII-B3-2020, 2020
XXIV ISPRS Congress (2020 edition)
Figure 3. Ablation study of the SenDVI Sentinel-1 to Sentinel-2 NDVI regression task. Mean MSE, RMSE and R2 as well as
standard deviation of R2 (red bar) for five runs of each configuration are provided. Ranks are given in terms of R2 scores.
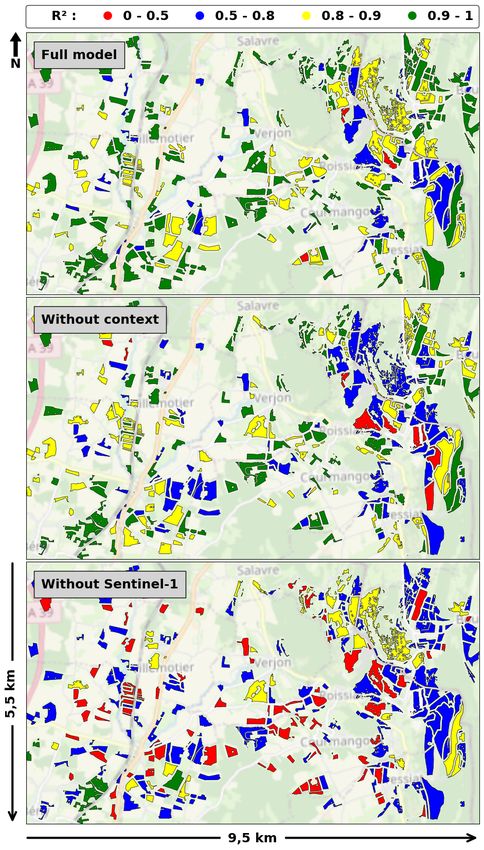
3.1.2 Satellite features. Regarding the five Sentinel-1 fea- the dates when the Sentinel-2 values were available. For the
tures, their removal leads to a greater drop in scores as for the cloudy dates mainly at the beginning of the season, however, a
contextual features. This is not true for the ratio band (see distinction is present which by visual analysis reflects less the
above). Comparing σ0 features (which measure the propor- evolution of the plot. Another global family considered are the
tion of signal backscattered by the target), and coherence fea- ascending and descending acquisitions of Sentinel-1. Indeed,
tures (which calculates the interferometric stability of the target the integration of the two orbits requires twice as much storage
between two dates), we assess that the sigma bands have less and processing. The ablation of all the descending acquisitions
relevance than that the coherence information (R2 =0.8044 and allows the network to obtain a score of 0.8166 compared to
0.7890, respectively). Since two acquisition dates are embed- 0.7929 for the descending acquisitions. On the study area, sig-
ded with coherence, the later is particularly less affected by cli- nificant relief is present on the eastern part. Many of the grass-
matic effects. Moreover, as a proxy for change between two lands parcel are thus not visible by SAR acquisitions in des-
dates, coherence tends to introduce less variance between meas- cending orbit, explaining the difference in these results. This
urements. As a result, coherence information can be considered distinction could also be caused by the difference in time-deltas
important in time-series analysis. Regarding both VV and VH between Sentinel-2 measurements and ascending and descend-
polarization channels, the removal of VV has more impact than ing acquisitions. Figure 5 illustrates the inconsistency in R2
VH (0.7909 against 0.8138). Nevertheless, physically, the results among global features removed. Overall, parcels de-
VH polarization should be more sensitive to vegetation growth crease in regression accuracy as more information is removed.
since vertical structures cause depolarization of the wave and For few parcels however the full model shows lower results.
thus increased its response sensitivity. Finally, the cloud mask wasn’t used for loss calculation. This
suppression results in a considerable decrease in accuracy with
3.1.3 Global features. Finally, full families of attributes are a R2 of 0.75. Despite intrinsic errors of the mask (omission
considered for ablation. Removing one by one context features and commission of clouds and shadows), his usefulness remains
does not result in a significant loss of regression quality. Nev- significant.
ertheless, when removing all of the context features, the regres-
sion score drops to 0.7982 (-0.05). This result demonstrates 3.2 Computational and storage efficiency
the relevance of multimodality and ancillary data for such a
regression task. Then, Sentinel-1 attributes are removed from Operational mapping requires network optimization and simpli-
the network (and thus also contextual data related to the neigh- city while keeping high performances (Mallet, Le Bris, 2020).
borhood). This configuration gives the lowest regression score The first ablation study is informative in terms of regression
(0.5662). The network, fed only with the climate, topography, quality. Nevertheless, in order to reduce storage and prepro-
temporal context, and agronomic type features of the parcel, cessing requirements, other configurations have been tested. All
does not correctly estimate NDVI values over grasslands. An the features were first iteratively removed: the interdependence
example of differences in regression on a parcel is given in Fig- of these features must be analyzed for the purpose of proposing
ure 4. It is apparent that without the Sentinel-1 data the time- a satisfactory network with a minimal number of inputs.
series shows very little dynamics, based mainly on the evol-
ution of contextual features. The model without the contex- Among the contextual information, the topography and climatic
tual features seems very close to the full model, especially for features often require the acquisition of proprietary data with
This contribution has been peer-reviewed.
https://doi.org/10.5194/isprs-archives-XLIII-B3-2020-591-2020 | © Authors 2020. CC BY 4.0 License. 595The International Archives of the Photogrammetry, Remote Sensing and Spatial Information Sciences, Volume XLIII-B3-2020, 2020
XXIV ISPRS Congress (2020 edition)
Figure 4. Results of different reconstructions of NDVI time series with various feature sets for one grassland parcel. Only non-cloudy
S2 values are shown. It shows that SenDVI can restore the signal despite clouds (S1 features) while keeping only significant high
frequencies (context features).
the minimal impact on the score is retained and the operation
is repeated from this configuration. We consider satisfactory a
regression score close to 0.84. Results are provided in Table 2.
At a certain point, regression scores are increasing. One pos-
sible explanation is that essential data are kept but with approx-
imately same number of parameters, the network has further
opportunity to explore this inputs and therefore achieves better
high-level representation. Indeed, by removing the topography,
time shift between acquisitions (deltas), and temporal context,
the scores of R2 reaches 0.8438. Similarly these three fea-
tures had little impact on the scores obtained in the ablation
study. In the same way, meteorological and agronomic inform-
ation about grasslands can be neglected. This conclusion is in
agreement with the ablation study above on the agronomic type
but the results following the ablation of the climatic informa-
tion are more surprising. Indeed, removing only the climate
information scores lower than when it is removed with a set of
features.
Add. Removed feature R2 MAE RMSE
Topography 0.8430 0.0381 0.0586
- Time-deltas 0.8429 0.0384 0.0583
- Temporal context 0.8438 0.0380 0.0576
- Climate 0.8428 0.0383 0.0579
- Agronomic type 0.8411 0.0393 0.0586
Table 2. Features removed from the SenDVI network that
preserve a satisfactory regression score, starting with the
topographic set. Removing other attributes would negatively
impact the regression quality.
Removing all of the features (Table 2) provides the best res-
ults (i.e. above R2 =0.84) of all configurations while requiring
Figure 5. Visual assessment of R2 values for the full model less data. Removing σ0 ratio band VV/VH in this case makes
against two ablation studies removing global features (without the score drop at 0.8355. For the other features (Sentinel-1 or
contextual features and without Sentinel-1 features). global ones), in all cases, the scores were significantly worse.
spatial interpolation. Topographic information do not seem to
provide crucial information to the network. Digital Terrain Mod- 4. DISCUSSION
els with higher spatial resolution may favorably impact the ac-
curacy of SenDVI. However, they are bound not to be available The network integrates numerous multi-modal data: both satel-
at large scales. lite data and data aimed at contextualizing the measurements
(i.e. topographic, climatic data). It was appropriate to assess
Topographic features were thus first removed from the network which features were most contributing to the regression. The
entries and the remaining contextual features were suppressed results presented above allow to draw preliminary conclusions
one by one. The configuration with the topographic informa- but are certainly not generally applicable: a single Sentinel-2
tion and the additional contextual information removed having tile is not sufficient.
This contribution has been peer-reviewed.
https://doi.org/10.5194/isprs-archives-XLIII-B3-2020-591-2020 | © Authors 2020. CC BY 4.0 License. 596The International Archives of the Photogrammetry, Remote Sensing and Spatial Information Sciences, Volume XLIII-B3-2020, 2020
XXIV ISPRS Congress (2020 edition)
Contextual features are derived from external sources, which These time series allow weekly monitoring of the evolution of
may be acquired or exploited differently. Specifically, topo- the vegetation, objective identified for the detection of manage-
graphic and climatic data can be handled in different ways. ment practices on grasslands. The development of a change
Topographic data have not been standardized by the orientation point detection framework will be based on these reconstruc-
of the Sentinel-1 acquisition plan. Fluctuations found in the ted time series. Since the proposed regression method is based
data are likely not to reflect actual variations from one parcel to solely on Sentinel-1 data, both an on-line and off-line method
another. can be implemented. A multi-task learning approach based on
Climate measurements are (i) daily averaged, and (ii) provided SenDVI architecture seems to be a promising direction.
with a coarse spatial resolution (no dense sampling), with signi-
ficant disparities depending on the location. For ascending and
ACKNOWLEDGEMENTS
descending orbits, the acquisition times are not the same (be-
ginning of the morning and end of the afternoon, respectively).
This difference is therefore not taken into account in the con- This research has been funded by the Agence pour le Développe-
textualisation effort. In addition, there are a limited number of ment Et la Maı̂trise de l’Énergie (ADEME) and the Centre Na-
weather stations in the area, whose values are interpolated. This tional d’Études Spatiales (CNES).
results in (i) a highly variable accuracy of the measurements de-
pending on the location of the plots and (ii) in similar values for REFERENCES
neighboring parcels.
The agronomic type is also subject to uncertainty. In addition Ali, I., Cawkwell, F., Dwyer, E., Green, S., 2017. Modeling
to the fact that such classes are highly imbalanced, it includes Managed Grassland Biomass Estimation by Using Multitem-
a declarative bias due to the financial subsidies granted by the poral Remote Sensing Data—A Machine Learning Approach.
IEEE Journal of Selected Topics in Applied Earth Observations
French Paying Agency and the constraints imposed on certain and Remote Sensing, 10(7), 3254-3264.
classes.
Atzberger, C., 2013. Advances in Remote Sensing of Agri-
This analysis determines that contextual data provided a gain in culture: Context Description, Existing Operational Monitoring
regression accuracy. Counter-intuitively, however, the ablation Systems and Major Information Needs. Remote Sensing, 5(2),
949–981.
study scores show that the most important features are all de-
rived from Sentinel-1 data (i.e., neighborhood as most import- Baghdadi, N., El Hajj, M., Zribi, M., Fayad, I., 2016. Coup-
ant context feature). In order to improve these results, it would ling SAR C-Band and Optical Data for Soil Moisture and Leaf
Area Index Retrieval Over Irrigated Grasslands. IEEE Journal
therefore be advisable to extract from external sources, features of Selected Topics in Applied Earth Observations and Remote
more specifically tailored in relation to Sentinel-1 acquisitions Sensing, 9(3), 1229-1243.
and the parcels of interest. The improvement of the neigh-
borhood feature, through a graph-based approach for example, Belgiu, M., Csillik, O., 2018. Sentinel-2 cropland mapping us-
ing pixel-based and object-based time-weighted dynamic time
would support a complete data-driven approach that could also warping analysis. Remote Sensing of Environment, 204, 509 -
surely lead to at least similar results. 523.
Several points are nevertheless conclusive: (i) a simple approach
integrating only contextual data types does not provide satis- Bengtsson, J. et al., 2019. Grasslands—more important for eco-
system services than you might think. Ecosphere, 10(2).
factory regression scores; (ii) InSAR coherence although re-
quiring costly calculations is a significant information, and (iii) Buchmann, N., Fuchs, K., Feigenwinter, I., Gilgen, A. K., 2019.
”the more data, the better” approach often associated with deep Multifunctionality of permanent grasslands: ecosystem ser-
learning does not necessarily apply despite a dedicated solution vices and resilience to climate change. Improving sown grass-
lands through breeding and management, 24, European Grass-
(two branches, attention mechanisms). land Federation EGF, 19 – 26.
Areas for improvement in the network architecture are related Buckley, J. R., Smith, A. M., 2010. Monitoring grasslands with
to the strategy proposed to integrate the contextual data into Radarsat 2 quad-pol imagery. IGARSS, 3090–3093.
the SenDVI architecture. The common Hadamard product used Chiboub, O., Kallel, A., Frison, P.-L., Lopes, M., 2019. Monit-
here could be improved. The use of more dedicated networks, oring of grasslands management practices using interferometric
such as a Transformer (Vaswani et al., 2017, Sainte Fare Garnot products Sentinel-1. Advances in Remote Sensing and Geo In-
et al., 2020), could improve the results. The hypothesis of signi- formatics Applications, 239–242.
ficantly increasing the size of the network could also potentially Claverie, M., Ju, J., Masek, J. G., Dungan, J. L., Vermote, E. F.,
provide better results. However, for most uses, and with a per- Roger, J.-C., Skakun, S. V., Justice, C., 2018. The Harmon-
spective of automation and deployment over large areas, this ized Landsat and Sentinel-2 surface reflectance data set. Remote
option is not feasible. Sensing of Environment, 219, 145 - 161.
Das, M., Ghosh, S. K., 2017. Measuring Moran’s I in a Cost-
5. CONCLUSION Efficient Manner to Describe a Land-Cover Change Pattern in
Large-Scale Remote Sensing Imagery. IEEE Journal of Selec-
ted Topics in Applied Earth Observations and Remote Sensing,
The SenDVI neural network based regression model proposes 10(6), 2631-2639.
a multi-sensor approach allowing to obtain time series of high
temporal sampling of vegetation indices that do not suffer from El Hajj, M., Baghdadi, N., Wigneron, J.-P., Zribi, M., Albergel,
C., Calvet, J.-C., Fayad, I., 2019. First Vegetation Optical Depth
the traditional missing data due to clouds. Resulting highly Mapping from Sentinel-1 C-band SAR Data over Crop Fields.
sampled time series showed satisfactory profiles and regression Remote Sensing, 11(23).
scores. The ablation study made it possible to select the fea-
Fauvel, M., Lopes, M., Dubo, T., Rivers-Moore, J., Frison, P.-
tures needed for this purpose and to propose a strategy integ- L., Gross, N., Ouin, A., 2020. Prediction of plant diversity in
rating less data and therefore less pre-processing and storage grasslands using Sentinel-1 and -2 satellite image time series.
requirements. Remote Sensing of Environment, 237, 111536.
This contribution has been peer-reviewed.
https://doi.org/10.5194/isprs-archives-XLIII-B3-2020-591-2020 | © Authors 2020. CC BY 4.0 License. 597The International Archives of the Photogrammetry, Remote Sensing and Spatial Information Sciences, Volume XLIII-B3-2020, 2020
XXIV ISPRS Congress (2020 edition)
Fieuzal, R., Baup, F., Marais-Sicre, C., 2013. Monitoring Ndikumana, E., Ho Tong Minh, D., Baghdadi, N., Courault, D.,
Wheat and Rapeseed by Using Synchronous Optical and Radar Hossard, L., 2018. Deep Recurrent Neural Network for Agri-
Satellite Data—From Temporal Signatures to Crop Parameters cultural Classification using multitemporal SAR Sentinel-1 for
Estimation. Advances in Remote Sensing, 2(2), 162-180. Camargue, France. Remote Sensing, 10(8).
Frampton, W. J., Dash, J., Watmough, G., Milton, E. J., 2013. Pasqualotto, N. et al., 2019. Retrieval of Evapotranspiration
Evaluating the capabilities of Sentinel-2 for quantitative estim- from Sentinel-2: Comparison of Vegetation Indices, Semi-
ation of biophysical variables in vegetation. ISPRS Journal of Empirical Models and SNAP Biophysical Processor Approach.
Photogrammetry and Remote Sensing, 82, 83 - 92. Agronomy, 9(10).
Gao, S., Zhu, Z., Liu, S., Jin, R., Yang, G., Tan, L., 2014. Pipia, L., Muñoz-Marı́, J., Amin, E., Belda, S., Camps-Valls,
Estimating the spatial distribution of soil moisture based on G., Verrelst, J., 2019. Fusing optical and SAR time series for
Bayesian maximum entropy method with auxiliary data from LAI gap filling with multioutput Gaussian processes. Remote
remote sensing. International Journal of Applied Earth Obser- Sensing of Environment, 235, 111452.
vation and Geoinformation, 32, 54 - 66.
Reichstein, M., Camps-Valls, G., Stevens, B., Jung, M., Denz-
Garioud, A., Giordano, S., Valero, S., Mallet, C., 2019. Chal- ler, J., Carvalhais, N., Prabhat, 2019. Deep learning and process
lenges in Grassland Mowing Event Detection with Multimodal understanding for data-driven Earth system science. Nature,
Sentinel Images. MultiTemp. 566(7743), 195-204.
Griffiths, P., Nendel, C., Hostert, P., 2019. Intra-annual reflect- Sainte Fare Garnot, V., Landrieu, L., Giordano, S., Chehata, N.,
ance composites from Sentinel-2 and Landsat for national-scale 2020. Satellite image time series classification with pixel-set
crop and land cover mapping. Remote Sensing of Environment, encoders and temporal self-attention. CVPR.
220, 135-151.
Scarpa, G., Gargiulo, M., Mazza, A., Gaetano, R., 2018. A
Griffiths, P., Nendel, C., Pickert, J., Hostert, P., 2020. Towards CNN-Based Fusion Method for Feature Extraction from Sen-
national-scale characterization of grassland use intensity from tinel Data. Remote Sensing, 10(2), 236.
integrated Sentinel-2 and Landsat time series. Remote Sensing Siegmund, R., Grant, K., Wagner, M., Hartmann, S., 2016.
of Environment, 238, 111124. Satellite-based monitoring of grassland: assessment of harvest
dates and frequency using SAR. Remote Sensing for Agricul-
He, W., Yokoya, N., 2018. Multi-Temporal Sentinel-1 and -2 ture, Ecosystems, and Hydrology XVIII, 9998.
Data Fusion for Optical Image Simulation. ISPRS International
Journal of Geo-Information, 7(10). Solano-Correa, Y. T., Bovolo, F., Bruzzone, L., Fernández-
Prieto, D., 2020. A Method for the Analysis of Small Crop
Hughes, L. H., Merkle, N., Bürgmann, T., Auer, S., Schmitt, Fields in Sentinel-2 Dense Time Series. IEEE Transactions on
M., 2019. Deep learning for SAR-optical image matching. IG- Geoscience and Remote Sensing, 58(3), 2150-2164.
ARSS, 4877–4880.
Stendardi, L., Karlsen, S. R., Niedrist, G., Gerdol, R., Zebisch,
Ienco, D., Gaetano, R., Dupaquier, C., Maurel, P., 2017. Land M., Rossi, M., Notarnicola, C., 2019. Exploiting Time Series
Cover Classification via Multitemporal Spatial Data by Deep of Sentinel-1 and Sentinel-2 Imagery to Detect Meadow Phen-
Recurrent Neural Networks. IEEE Geoscience and Remote ology in Mountain Regions. Remote Sensing, 11(5).
Sensing Letters, 14(10), 1685-1689.
Tamm, T., Zalite, K., Voormansik, K., Talgre, L., 2016. Relat-
Kamilaris, A., Prenafeta-Boldú, F., 2018. Deep learning in ag- ing Sentinel-1 Interferometric Coherence to Mowing Events on
riculture: A survey. Computers and Electronics in Agriculture, Grasslands. Remote Sensing, 8(10), 802.
147, 70 - 90.
Tiscornia, G., Baethgen, W., Ruggia, A., Do Carmo, M., Cec-
Kolecka, N., Ginzler, C., Pazur, R., Price, B., Verburg, P., 2018. cato, P., 2019. Can we Monitor Height of Native Grasslands in
Regional Scale Mapping of Grassland Mowing Frequency with Uruguay with Earth Observation? Remote Sensing, 11(15).
Sentinel-2 Time Series. Remote Sensing, 10(8), 1221.
Vaswani, A., Shazeer, N., Parmar, N., Uszkoreit, J., Jones, L.,
Li, Z., Guo, X., 2018. Non-photosynthetic vegetation biomass Gomez, A. N., Kaiser, L., Polosukhin, I., 2017. Attention is all
estimation in semiarid Canadian mixed grasslands using ground you need. NIPS.
hyperspectral data, Landsat 8 OLI, and Sentinel-2 images. In-
ternational Journal of Remote Sensing, 39(20), 6893-6913. Veloso, A., Mermoz, S., Bouvet, A., Le Toan, T., Planells, M.,
Dejoux, J.-F., Ceschia, E., 2017. Understanding the temporal
Liu, J., Atzberger, C., Huang, X., Shen, K., Liu, Y., Wang, L., behavior of crops using Sentinel-1 and Sentinel-2-like data for
2020. Modeling grass yields in Qinghai Province, China, based agricultural applications. Remote Sensing of Environment, 199,
on MODIS NDVI data–an empirical comparison. Frontiers of 415–426.
Earth Science.
Vuolo, F., Ng, W.-T., Atzberger, C., 2017. Smoothing and gap-
Mallet, C., Le Bris, A., 2020. Current challenges in opera- filling of high resolution multi-spectral time series: Example of
tional very high resolution land-cover mapping. The Interna- Landsat data. International Journal of Applied Earth Observa-
tional Archives of the Photogrammetry, Remote Sensing and tion and Geoinformation, 57, 202 - 213.
Spatial Information Sciences, XLIII-B2-2020.
Weiss, M., Jacob, F., Duveiller, G., 2020. Remote sensing for
Mercier, A., Betbeder, J., Baudry, J., Roux], V. L., Spicher, agricultural applications: A meta-review. Remote Sensing of
F., Lacoux, J., Roger, D., Hubert-Moy, L., 2020. Evaluation Environment, 236, 111402.
of Sentinel-1 & 2 time series for predicting wheat and rape-
seed phenological stages. ISPRS Journal of Photogrammetry Zalite, K., Antropov, O., Praks, J., Voormansik, K., Noorma,
and Remote Sensing, 163, 231 - 256. M., 2016. Monitoring of Agricultural Grasslands With Time
Series of X-Band Repeat-Pass Interferometric SAR. IEEE
Merkle, N., Fischer, P., Auer, S., Müller, R., 2017. On the pos- Journal of Selected Topics in Applied Earth Observations and
sibility of conditional adversarial networks for multi-sensor im- Remote Sensing, 9(8), 3687-3697.
age matching. IGARSS, 2633–2636.
Zhao, H., Chen, Z., Jiang, H., Jing, W., Sun, L., Feng,
Moreira, A., Fontana, D. C., Kuplich, T. M., 2019. Wavelet ap- M., 2019. Evaluation of Three Deep Learning Models for
proach applied to EVI/MODIS time series and meteorological Early Crop Classification Using Sentinel-1A Imagery Time
data. ISPRS Journal of Photogrammetry and Remote Sensing, Series—A Case Study in Zhanjiang, China. Remote Sensing,
147, 335 - 344. 11(22).
This contribution has been peer-reviewed.
https://doi.org/10.5194/isprs-archives-XLIII-B3-2020-591-2020 | © Authors 2020. CC BY 4.0 License. 598You can also read


