Learning from pandemics: using extraordinary events can improve disease now-casting models
←
→
Page content transcription
If your browser does not render page correctly, please read the page content below
Learning from pandemics: using extraordinary
                                         events can improve disease now-casting models
                                         Sara Mesquita+1 , Cláudio Haupt Vieira+3 , Lı́lia Perfeito1 , and Joana Gonçalves-Sá1,2,3,4*
                                         1 Social  Physics and Complexity Lab - SPAC, LIP, Avenida Prof. Gama Pinto, 1600-078 Lisboa, Portugal
                                         2 Physics   Department, Avenida Rovisco Pais, Instituto Superior Técnico, 1049-001, Lisboa, Portugal
                                         3 Nova School of Business and Economics, Rua da Holanda, 2775-405 Carcavelos, Portugal
                                         4 Instituto Gulbenkian de Ciência, Rua da Quinta Grande, 2780-156 Oeiras, Portugal
arXiv:2101.06774v1 [cs.LG] 17 Jan 2021

                                         * joana.gsa@tecnico.ulisboa.pt
                                         + these authors contributed equally to this work

                                         ABSTRACT

                                         Online searches have been used to study different health-related behaviours, including monitoring disease outbreaks. An
                                         obvious caveat is that several reasons can motivate individuals to seek online information and models that are blind to
                                         people’s motivations are of limited use and can even mislead. This is particularly true during extraordinary public health
                                         crisis, such as the ongoing pandemic, when fear, curiosity and many other reasons can lead individuals to search for health-
                                         related information, masking the disease-driven searches. However, health crisis can also offer an opportunity to disentangle
                                         between different drivers and learn about human behavior. Here, we focus on the two pandemics of the 21st century (2009-
                                         H1N1 flu and Covid-19) and propose a methodology to discriminate between search patterns linked to general information
                                         seeking (media driven) and search patterns possibly more associated with actual infection (disease driven). We show that by
                                         learning from such pandemic periods, with high anxiety and media hype, it is possible to select online searches and improve
                                         model performance both in pandemic and seasonal settings. Moreover, and despite the common claim that more data is
                                         always better, our results indicate that lower volume of the right data can be better than including large volumes of apparently
                                         similar data, especially in the long run. Our work provides a general framework that can be applied beyond specific events and
                                         diseases, and argues that algorithms can be improved simply by using less (better) data. This has important consequences,
                                         for example, to solve the accuracy-explainability trade-off in machine-learning.

                                         Introduction
                                         Infectious diseases pose great health risks to human populations worldwide. To mitigate these risks, public health institutions
                                         have set up surveillance systems that attempt to rapidly and accurately detect disease outbreaks. These systems typically
                                         include sentinel doctors and testing labs, and enable a timely response which can limit and even stop outbreaks. However,
                                         even when in place, detection and mitigation mechanisms can fail, leading to epidemics and, more rarely, pandemics, as we
                                         are currently experiencing. In fact, disease surveillance mechanisms that only rely on highly trained personnel, are typically
                                         expensive, limited, and slow. It has been extensively argued that these should be complemented with "Digital Era" tools,
                                         such as online information, mobility patterns, or digital contact-tracing1–3 . Online behaviours, such as searches on Google,
                                         have proven to be very relevant tools, as health information seeking is a prevalent habit of online users4 . This methodology
                                         has been applied to follow other epidemics, such as Dengue5–7 , Avian Influenza8, and Zika surveillance9. In the case of
                                         Influenza, a very common infectious disease, the potential of online-based surveillance methods gained large support with the
                                         launch of Google Flu Trends (GFT), in 200810. GFT attempted to predict the timing and magnitude of influenza activity by
                                         aggregating flu-related search trends and, contrary to traditional surveillance methods, provided reports in near real-time11,
                                         without the need for data on clinical visits and lab reports. More recently, many others have found strong evidence that the
                                         collective search activity of flu-infected individuals seeking health information online provides a representative signal of flu
                                         activity12–16 . However, flu infection is not the sole (and perhaps not even the strongest) motivation for individuals to seek flu-
                                         related information online17. This is particularly true during extraordinary times, such as pandemics, when it is reasonable to
                                         expect individuals to have various degrees of interest, ranging from curiosity to fear, to actual disease18 . In fact, the GFT model
                                         missed the first wave of the 2009 flu pandemic and overestimated the magnitude of the severe 2013 seasonal flu outbreak, in
                                         the USA17, 19 . This led many authors to suggest that high media activity can lead to abnormal Google search trends, possibly
                                         leading to estimation errors17, 20–24 . This "media effect" was also observed by others studying Zika25–27 , and contributed to
                                         the disenchantment with the potential of such tools, particularly during such "extraordinary times".

                                                                                                          1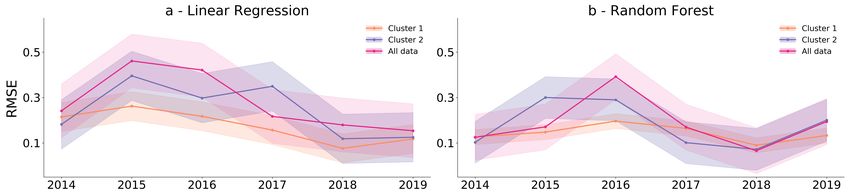
However, if we could decouple searches mostly driven by media, anxiety, or curiosity, from the ones related with actual
disease, we could not only improve disease monitoring, we could also deepen our understanding of online human behavior. In
the case of Google search trends, identifying what terms are more correlated with media exposure and reducing their influence
in the model is crucial to correct past errors.
     In this paper, we propose that the characteristics that make pandemics unique and hard to now-cast, such as media hype,
can also be used as opportunities for two main reasons: 1) as pandemics tend to exacerbate behaviors, the noise (media) is of
the same order of magnitude as the signal (cases), making it more visible, allowing us to discriminate between the two; and
2) because information seeking becomes less common as the pandemic progresses18, 28 and these different dynamics can be
used when selecting the search terms. In fact, instead of ignoring pandemic periods, studying what happens during the worst
possible moment can help us understand which are the search-terms more associated with the disease and the ones that were
prompted by media exposure. This solution might avoid over-fitting and enable the predictive model to be more robust over
time, especially during seasonal events. Therefore, we focus on the only two XXI century WHO declared pandemics and
aim at learning from pandemics to now-cast seasonal epidemics (or secondary waves of the same pandemic), and improving
current models by incorporating insights from information-seeking behavior.
     The first pandemic of the XXI century was caused by an Influenza A(H1N1)09pdm strain (pH1N1), which emerged in
Mexico in February 200929. By June 2009, pH1N1 had spread globally with around 30 000 confirmed cases in 74 countries.
In most countries pH1N1 displayed a bi-phasic activity: a spring-summer wave and a fall-winter wave30, 31 . The fall-winter
wave was overall more severe than the spring-summer wave as it coincided with the common flu season (in the Northern
Hemisphere), that typically provides optimal conditions for flu transmission32 . The pandemic was officially declared to be
over in August 2010 and a total of 18 449 laboratory-confirmed pH1N1 attributable deaths were counted (WHO, 2009). This
number was later revised and pH1N1 associated mortality is now believed to have been 15 times higher than the original
official number33. The second pandemic of this century, was caused by the SARS-CoV-2 virus, first identified in the last day
of 2019 in the Chinese province of Wuhan. To date, Covid-19 has infected more than 78 million people and killed more than
1,7 million people worldwide.
     Both Covid-19 and influenza viruses cause respiratory diseases with manifestations ranging from asymptomatic or mild
to severe disease and death. They share a range of symptoms and trigger similar public health measures due to common
transmission mechanisms. Both pandemics have a led to a great surge in media reports and public attention across many
platforms, from traditional to online social media. However, there are several differences between the two pandemics: there is
still a lot of uncertainty and lack of knowledge surrounding the SARS-CoV-2 virus, including its lethality (although it is certain
to be higher than the flu for older age-groups), whether it displays seasonal behaviour, its transmission frequency and patterns,
whether infection confers lasting immunity, or what are its long-term health effects, respiratory or not34–38 . Moreover, the
Covid-19 pandemic led to unique public health measures and what might be considered the largest lockdown in history, with
authorities implementing several preventive measures from social distancing to isolating entire countries. These restrictions
have been instrumental in reducing the impact of the pandemic, but most decision-makers acknowledged the need to loosen
the confinement measures. In the interest of economic and social needs, several countries re-opened schools and businesses,
and many experienced surges in cases and deaths39, often referred to as second and even third waves. At this point, and as
vaccines start to be distributed mostly in developed countries, all tools that can help us in identifying outbreaks are of utmost
importance and different countries are deploying different measures such as conditional movement and contact tracing apps.
     For all these reasons, improving fast, online surveillance is even more crucial now than it was in 2009, and there are already
several studies on using online data to explain and forecast Covid-19 dynamics40–45 . However, and despite its potential,
separating what is media hype from reporting of actual disease cases (be it on Google, Facebook, or any other platform),
and understanding their impact on collective attention, has been considered a huge challenge. One of the main reasons is
that the patterns are intertwined with the actual spread of a disease within a population. Therefore, we learn from the 2009
flu pandemic and propose a system to reduce the signal to noise ratio on online-searches and now-cast the current Covid-
19 pandemic. The 2009 influenza offers a great case study as it was extensively researched: precise signals of pandemic
flu infections were obtained through large-scale laboratory confirmations46, several studies analyzed the media’s behaviour
during the pandemic47–49 , including the collection of news pieces and news counts, and as the pandemic emerged at a period
of widespread Internet usage50 , several online datasets are available (including the collective behaviour of millions of users
through their search trends on Google). Building on these datasets and by adding insights from human behaviour, we apply
our framework to the current Covid-19 pandemic and provide a robust and possibly generalizable system.

Results
Dynamics of media reports and online searches do not match disease cases
Improving signal (disease) to noise ratio is fundamental in disease surveillance. As extraordinary events, such as pandemics,
tend to become the dominant story nearly everywhere, fear and curiosity can increase and so do searches for information.

                                                                                                                             2/11
First we asked whether there is a correspondence between the number of cases (for both the 2009 flu and Covid-19), media
reports, and searches on Google for disease-related terms (flu and Covid-19, respectively). We focused on the US in the case
of the 2009 flu and Spain during the Covid-19 pandemic. These are countries that had a large number of cases, good data
availability and, in the case of Spain, already a strong second Covid-19 wave, as detailed in the methods. Figure 1 shows the
number of confirmed infections, news mentions and GT searches in the United States for the 2009 pandemic (a) and in Spain
for the current one (b). Since news now travel faster than pathogenic agents, the news peak for the 09 flu pandemic (figure 1a)
had its peak on the last week of April, while the first peak in cases happened later, at the end of June. More relevant is that
by the time H1N1 infections had its highest peak in the US (in October/November, during regular flu season), the frequency
of online searches for "flu" and news mentions had significantly reduced. In the case of the Covid-19 pandemic (figure 1b),
the early news mentions began in late 2019 when the disease was identified in China, but the first cases in Spain were only
identified in February 2020 (for a similar analysis on the US case see the supplementary materials). As observed before, there
was a disconnect between the intensity of the disease and both its visibility in media and the volume of Google searches17, 19 ,
raising the important question of whether we can discriminate between different drivers of online searches.
Figure 1. Flu and Covid-19 cases during the 2009 and 2020 pandemics in US (a) and Spain (b), respectively. a -
Normalized weekly cases of flu (orange), media mentions (purple), and Google-trends searches for the term "flu" (pink) in
the United States of America from March 2009 to March 2010. b - Normalized weekly cases of Covid-19 (orange), media
mentions (purple), and Google-trends searches for the term "Covid-19" (pink) between February and November 2020. All
datasets are normalized to their highest value in the period. We can see a quick increase in media activity in both situations
that precedes the number of cases of infection. In both panels, searches for the terms ’flu’ or ’Covid-19’, display a pattern
more similar to the media activity trend (Pearson correlation between the search term and media of 0.85 for the flu pandemic
and 0.44 for Covid-19 pandemic, compared to 0.27 and -0.03 between the search term and cases of infection, respectively).
Online searches have different patterns
Given that the searches for "flu" and "Covid-19" do not closely follow the variation in the number of confirmed cases, we asked
if we could identify particular search terms, with higher correlation with the disease progression. We started by selecting a
large number of search terms, related to each disease (see supplementary materials for the full list), all of which could be a
priori considered useful for now-casting. Using hierarchical clustering, we identified three distinct clusters in both the 2009 flu
and COVID-19 (2a and 2d). Figures 2b and 2e show the centroids of each cluster, revealing the existence of different dynamics.
In the case of the flu in the US, one cluster has a strong peak in the second half of 2009, another has the strongest (almost
unique) peak in the first half, and a third cluster has much less clearly defined peaks (figure 2b). The first cluster (orange)
shows a strong correlation with the number of pH1N1 confirmed cases (r = 0.78, p = 4 × 10⁻¹⁶) and a lower correlation with
media (r = 0.60, p = 2 × 10⁻⁸), while the second cluster (purple) has the opposite trend (figure 2c, r = 0.16, p = 0.2 with
pH1N1 cases and r = 0.83, p = 3 × 10⁻²⁰ with media). The third has an intermediate correlation with the flu cases and poor
with the media reports. As an additional test, we asked whether there was evidence that cases or media preceded any of the
clusters. We performed a Granger causality test and show that that media precedes cluster 2 but not cluster 1 (supplementary
materials). Neither cases nor media showed significant results for clusters 1 or 3. The grouping of the search terms is not
intuitive from their meaning. Interestingly, there is no clear pattern on the search-terms that could have indicated that some
would be more correlated with cases or media attention. For example, symptoms such as ’fever’ or ’cough’, appear on cluster
3, together with ’Guillaume-Barré syndrome’ and disinfectant’, while cluster 1 contains ’vaccine’ and ’treatment’ along with
the strain of the virus and ’hand sanitizer’.
3/11In the case of Covid-19, the clusters are not so well defined, as shown by the smaller relative length of the internal branches
of the clustering dendrogram (figure 2d). This is likely due to a) the smaller time-frame considered (roughly half of that of
H1N1 - figure 1) b), the lower search volume, explained by the much smaller population of Spain when compared to the US,
and c) the real-time nature of the analysis. Still, we could identify three clear clusters and a very similar pattern (figure 2e):
the first cluster (again orange) shows two broad peaks, the second larger than the first. The second cluster (purple) shows a
clear first plateau, between March and May 2020, and the third cluster (green) a much sharper peak, encompassing little over
one month. When we repeated the correlation analysis, we again identified a cluster (C1, orange) that strongly correlates with
the number of cases (r = 0.71, p = 8 × 10⁻⁶) but less with the media (r = 0.52, p = 0.003), and a cluster (C2, purple) with
the opposite pattern (a correlation with cases of r = 0.13, p = 0.45 and with media of r = 0.71, p = 2 × 10⁻⁶ ) (figure 2f).
Cluster 3 (green) correlates poorly with both the number of confirmed cases and media attention. Thus, and despite the strong
entanglement and time-coincidence between the cases and the media, particularly in the case of the current pandemic, these
results show that 1) not all pandemic-related search trends show the same patterns, and 2) some of the patterns may be driven
by media attention whereas others by the number of cases.
a b c
Flu 2009 USA
d e f
Covid-19 Spain
Figure 2. Different patterns of searches during pandemics Top panels refer to the 2009 flu pandemic in the USA, bottom
panels refer to the COVID-19 pandemic in Spain. a - Dendrogram summarizing the hierarchical clustering of Google Trends
search terms for the flu pandemic in US. Three clusters are very salient. b - Centroid and standard deviation over time for
each cluster. The cluster colors correspond to the clusters in a. c - Pearson correlation between the cluster centroid and either
the flu cases (top) or the media mentions (bottom).* denotes 0.01 < p-value < 0.05, ** denotes p-value < 0.001, and ns a non
significant p-value. d - Dendrogram summarizing the hierarchical clustering of Google Trends search terms for Covid-19 in
Spain. e - Shows the centroid and standard deviation over time for each cluster. The cluster colors correspond to the clusters
in d. f - Pearson correlation between the cluster centroid and either the Covid-19 cases (top) or the media mentions (bottom).
4/11Pandemic search-terms can be used to improve seasonal forecasting
That very similar search-terms display such different time patterns is interesting in itself but only useful if they have predictive
power. Therefore, we asked whether the search terms identified as correlating with the number of confirmed cases (during
a pandemic) could be used to forecast seasonal epidemics. The rationale is that if we can reduce the noise caused by the
media coverage and identify the terms that are more resilient to outside factors, we can make seasonal forecasting more robust.
Therefore, our goal was not to devise the best possible model, but rather to test whether particular search terms perform better
than others. To do this, we took advantage of extensively available seasonal flu data and chose two simple models: a linear
regression and the non-linear random forest (details in the Methods). We then tested the predictive power of the models when
we used all search terms from figure 2A (that we call "All data") or just the terms from the identified clusters in figure 2b. For
both models and all dataset variations, we used three years of data to predict the fourth and assessed the performance of the
model only on the prediction season (see Methods for details). Figure 3 and table 1 show the performance of the two models
(Figure 3a and 3b) measured by the root-mean-square error (RME) and the coefficient of determination, R2 . In general, both
models perform similarly, with a mean R2 above 0.7. In both cases, using all data (pink line) is not better than just using the
terms more correlated with the number of cases during the pandemic (cluster 1, orange line), and on average cluster 1 performs
better than all terms in both the linear regression (R2 = 0.81 for cluster 1 vs R2 = 0.71 for all data) and random forest(R2 =
0.86 for cluster 1 vs R2 = 0.81 for all data). It can also be observed that cluster 1 terms (orange) tend to have a more consistent
performance (shown by the smaller standard deviation: σ̂ = 0.08 for cluster 1 in the case of linear regression and σ̂ = 0.06 for
random forest vs σ̂ = 0.163 in the case of linear regression and σ̂ = 0.104 for random forest when considering all data).
It is important to note that some of the features from clusters 2 and 3 might be better local predictors, and that can explain
the performance of the models when using all search terms, but overall, using only the pre-identified terms of cluster 1 is
better.
This indicates that 1) insights from pandemics can be used in seasonal forecasting models, and 2) refining the search-term
selection, by selecting the ones less sensitive to media hype, might reduce over-fitting and improve model robustness.
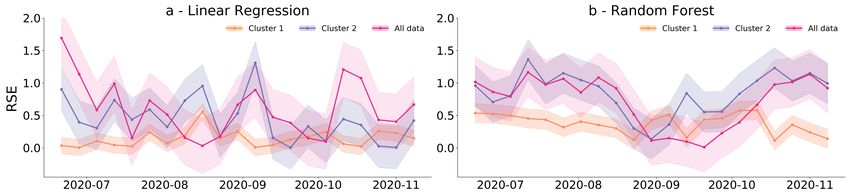
Figure 3. Performance comparison of model predictions for the flu pandemic. a shows the mean squared error for the
linear regression and b for the Random Forest model. Both use Google search terms from figure 2a as independent variables
to predict the seasonal flu cases between 2014 and 2019. Each dot represents the squared difference between the prediction
and the empirical data, averaged over one season. Cluster 1 (orange) shows better results in almost all seasons and has a
smaller standard deviation (shaded area) when compared to cluster 2 (purple) or all data (pink). In both cases, three years
were used as training and the models were tested on the following year, in a sliding window process.
Improving a model for Covid-19
We then asked whether these results could be used in the current pandemic. This is a more challenging setting for several
reasons: first, the data is arriving in close to real-time and with varying quality (the number of tests, the criteria for testing,
and the reporting formats have been changing with time, even for the same country); second, there is no indication that Covid-
19 might become a seasonal disease and the periodicity of new outbreaks, if any, remains unknown; third, reporting is now
happening in many different online platforms, at an even faster pace than in 2009, and more importantly fourth, we do not
have a large number of past seasons to train our models on. Still, we employed a similar approach to test whether the rationale
of the flu pandemic could be applied to Covid-19. The US pandemic situation has been particular, with different states having
widely different infection rates and risk levels51 . Also, at the time of this study, there were no states with clear strong second
waves or evidence of seasonality. Therefore, we focused on Spain, one of the first countries to have a clear and strong second
wave and trained the models on the first (February-June) wave to try to now-cast the second (June-November) wave. Still,
data for the US can be found in the supplementary materials with results very consistent with what we observed in the case of
Spain. Figure 4 shows that, again, using only the features from cluster 1 (orange) offers a much better prediction than using
5/11the search-terms from clusters 2 (purple) or 3 (supplementary materials), despite the fact that cluster 1 has a much smaller
number of terms. The result is particularly striking in the case of the random forest (figure 4b, compare pink and orange).
These results further support the idea that by selecting online data, using a semi-manual approach, it is possible to improve
disease now-casting.
Figure 4. Performance comparison of model predictions for Covid-19. a shows the mean squared error for the linear
regression and b for the random forest model. Both use Google search terms from figure 2d as independent variables to
predict the second wave (June to November) of Covid-19 in Spain. Each dot shows the squared difference between the
prediction and the empirical data in each week. Cluster 1 (orange) presents better results in almost all seasons and has a
smaller standard deviation (shaded area) when compared to cluster 2 (purple) or all data (pink). In both cases, the first wave
was used to train the model.
Table 1. Model results for both pandemics.
Flu Covid-19
L. Regression Random Forest L. Regression Random Forest
R2 RMSE R2 RMSE R2 RMSE R2 RMSE
Cluster 1 0.83 0.17 0.86 0.14 0.96 0.04 0.84 0.16
Cluster 2 0.76 0.25 0.82 0.18 0.70 0.30 0.20 0.80
All data 0.72 0.28 0.81 0.19 0.46 0.54 0.35 0.65
Discussion
In the past, the inclusion of online data in surveillance systems has both improved the disease prediction ability over traditional
syndromic surveillance systems, while also showing some very obvious caveats. Online-data based surveillance systems have
many limitations and challenges, including noisy data, demographic bias, privacy issues, and, often, very limited prediction
power. Previous approaches have assumed that if a search-term is a good predictor of cases in one year, it will be a good
predictor in the following years11, 52 , when in fact, search terms may be associated with both cases and media hype in a
particular year, but soon loose association with one or the other (especially when media interest fades). Moreover, and taking
into consideration that these approaches often use a single explanatory-variable, meaning the model ignores the variability
in individual search query tendencies over time, it can happen that terms highly correlated with disease cases in a certain
moment can be highly correlated with media reports as well, but over time some might lose their association with one or
another. However, and despite the described limitations, there are several successful examples of using online behaviour as a
proxy for "real-world" behaviour in disease settings and it is increasingly clear that such data can offer insights not limited to
disease forecasting16, 53–56 .
Pandemics have been particularly ignored in digital now-casting because they represent (hopefully) rare events when peo-
ple’s behaviour changes, making forecasting even more challenging. A large part of these behavioural changes is driven by the
excess media attention: people become curious and possibly afraid, and start looking for more (different?) information. This
is in contrast with seasonal outbreaks where there isn’t so much relative media attention, there is more common knowledge,
and people’s online searches might be primarily driven by actual disease. In general, the notions that online search-data is
too noisy and that the models used have limited prediction power have led people to try to increase the type and quantity of
data, or to build more complex models. However, we argue that this tension, between using the large potential of online data
and the so-called "data hubris", can be balanced in the opposite direction, by including behavioural knowledge and human
curation, to reduce the amount of data required, while keeping the models simple and explainable.
6/11In this study, we applied this approach to two pandemics and showed that, contrary to general arguments of "more data
trumps smarter algorithms"57 we can use such extraordinary events to improve seasonal forecasting, and argue that lowering
the volume of data can reduce over-fitting while maintaining the quality of the predictions. This was done by actively discrimi-
nating between search queries that are very sensitive to media from queries possibly more driven by symptoms. Our approach
combines elements of human curation and blind statistical inference. On the one hand our initial term list is based on knowl-
edge of the disease. On the other, the clustering algorithm is blind to the actual meaning of the terms. This leads to unusual
term-pairings such as the fact that "oseltamivir" (cluster 2), a drug used to treat flu is separate from "flu treatment" (cluster
1). We can explain this separation by considering that the media is more likely to mention the name of the drug, but that sick
people might not remember it. However a priori we might not think this distinction was important. Finally, the choice of the
best cluster is again based on human curation by looking at the correlations with media and cases, which we postulate are the
main drivers behind search queries. In many general now-casting problems, a similar semi-automated approach is probably
more fruitful than a fully automated, data-hungry methodology. This approach can also be particularly useful in countries
where data is sparse or suffers from significant bias or delays. Even within Europe, data collection and reporting have been
inconsistent, limiting global epidemiological analysis57 . Methods as the one we describe here cannot replace the need for
strong, centralized, data collection systems (through the European, American or other CDCs) but might help to fill existing
gaps, while surveillance networks are built or reinforced.
In addition to improving now-casting models, finding different search patterns in Google Trends can offer insights into
the behaviours of internet users. Specifically, by clustering search trends on a topic we can ask whether there are different
motivations behind them. If there are hypotheses about what those motivations are, they can also be tested by correlating with
centroids as we do here. For example, the search terms from the media-related clusters (clusters 2) could be further analyzed
to discriminate which terms are more often found in newspapers versus television, offering insight into the preferred news
media. This methodology opens new doorways into connecting online and offline behaviour.
Overall, we add to the ongoing work on using digital tools and online data to improve disease monitoring and propose a new
tool to now-cast infectious diseases, combining statistical tools and human curation, that can prove useful in the monitoring
of the current and future pandemics and epidemics.
Methods
Data and Sources
Selected countries and time period.
Data for the 2009 pandemic was collected for the USA, from March 2009 to August 2019, as it offered reliable data on a
large number of people. This was not possible for Covid-19 as this pandemic is reaching different states at different times
and second or third waves are mostly caused by surges in new states than as a nation-wide, simultaneous epidemic. Still,
supplemental text shows that three clusters are observed, one more correlated with cases than the rest. Data for the Covid-19
pandemic was collected for Spain, from January 2nd to November 15th 2020, as it was the country with highest number of
reliable second-wave cases, offering at least one training and one testing period.
Google search trends
Data from Google search trends (GT)58 was extracted from the United States and Spain both for flu and Covid-19 pandemics,
through the GT API. It provides a normalized number of queries for a given keyword, time and country11, 59 . Search terms
were selected to cover various aspects of pandemic and seasonal flu, and Covid-19, such as symptoms, antivirals, personal
care, institutions and pandemic circumstantial terms.This was done with the help of "related queries" option that Google
Trends provides, returning what people also search for when they search for a specific term. Terms that contained many
"zeros" interspersed with high values were indicative of low search volume and were removed. In the end we had 49 flu-
related weekly search trends in the United States and 63 Covid-related terms in Spain. Time periods were December 2019 to
September 2020 in the case of Spain and September 2009 to September 2019, in the case of the USA, to cover pre-pandemic,
pandemic and post-pandemic periods. In the case of the US flu pandemic, search-terms were extracted for each season
separately, with a season being defined as going from September 1st to October 1st the following year. GT time series were
extracted in September 2020 in the case of Spain, and July 2020 in the case of the US. Data was binned in a weekly resolution,
to match that of reported cases and remove daily variation. Both word lists are reported in the supplemental text.
News media
The pandemic flu, United States media dataset contains the weekly count of both TV news broadcast and print media, that
mentioned "flu" or "influenza". It includes NBC, CBS, CNN, FOX and MSNBC networks, obtained from the Vanderbilt
Television News Archive60, and The New York Times, from the NYT API (https://developer.nytimes.com/). The Covid-19
media dataset, for both the USA and Spain was obtained through Media Cloud61, an online open-source platform containing
7/11extensive global news corpus starting in 2011. The query "Covid-19 OR Coronavirus" was used to track media coverage of
the pandemic over time. It aggregated articles that had 1 keyword, the other or both. For the case of the US, we searched
the collection "United States - National" (#34412234) and "United States - State & Local" (#38379429), which includes 271
national and 10,457 local media sources, respectively. For Spain we used collection "Spain - National" (#34412356) which
includes 469 media sources, and Spain - State & Local(#38002034), including 390 media sources.
Infectious Disease Data
Data of confirmed infections from both pH1N1 and SARS-CoV-2 are publicly available. For US pH1N1 cases were extracted
from the CDC’s National Respiratory and Enteric Virus Surveillance System62 . In the case of Covid-19 in the US, data from
national and state-level cases were extracted ECDC’s Our World in Data63 and from New York Times64 , respectively, in
August 2020. In the case of Covid-19 in Spain, data was obtained from the WHO39 .
Analysis
Hierarchical clustering
Google search terms were independently extracted from Google Trends65. While all search queries include a 100, not all
include a zero (if there were no weeks with less than 1% of the maximum weekly volume), so all series were re-scaled
between 0 and 100. These were clustered using hierarchical clustering, computing the pairwise Euclidean distance between
words and using Ward’s linkage method (an agglomerative algorithm) to construct the dendrograms shown in 2. clustering
was performed in Python, using scipy.cluster.hierarchy.dendrogram66. The number of clusters was determined through visual
inspection of the dendrogram. This task was performed using data from the pandemic period, which for H1N1 pandemic was
between March 2009 and August 2010, and for Covid-19 from December 2019 to September 2020.
Modeling and Evaluation
The datasets for seasonal flu were collected similarly to those of the pandemic. They are aggregated by week and seasons
were defined by visual inspection, varying from season to season, over the 9 years of data. Each dataset (cases and search time
series) in each season was standardized so its mean value was 0 and its standard deviation was 1. The model was trained with
3 seasons and tested with the 4th . In the case of Covid-19 in Spain, the data was split around the week with the fewest number
of cases (June). The first wave was then used to train and the second to test.
Linear Regression
In each case, a model of the form
Ii = β0 + β1 × W1 + β1 × W1 + ... + βn × Wn + εi (1)
was trained, where Ii is the number of infections in week i, β0 is the intercept, β1 to βn are the coefficients of each search
term and εi is the error. The coefficients were estimated as to minimize the sum of the square of the errors across all weeks.
the regression was implemented in Python using sklearn.linear_model.LinearRegression67 with default parameters.
Random Forest
For each dataset, a random forest model was trained using sklearn.ensemble.RandomForestRegressor68 implemented in
Python. The hyperparameters - number of estimators, max features and max depth - were selected through cross validation
using GridSearchCV from [10,20,50,100,200,500,1000], [0.6,0.8,"auto","sqrt"] and [2,4,5,6] respectively.
Acknowledgments
The authors would like to thank members of the SPAC lab for comments and critical reading of the manuscript. This
work was partially funded by FCT grant DSAIPA/AI/0087/2018 to JGS and by PhD fellowships SFRH/BD/139322/2018
and 2020.10157.BD to CHV and SM, respectively.
Author contributions statement
All authors participated in project conception, data analysis, and paper writing.
8/11Additional information
References
1. Hay, S. I., George, D. B., Moyes, C. L. & Brownstein, J. S. Big data opportunities for global infectious disease surveillance.
PLoS med 10, e1001413 (2013).
2. Ferretti, L. et al. Quantifying sars-cov-2 transmission suggests epidemic control with digital contact tracing. Science 368
(2020).
3. Salathe, M. et al. Digital epidemiology. PLoS Comput. Biol 8, e1002616 (2012).
4. Fox, S. Online health search 2006 (Pew Internet & American Life Project, 2006).
5. Chan, E. H., Sahai, V., Conrad, C. & Brownstein, J. S. Using web search query data to monitor dengue epidemics: a new
model for neglected tropical disease surveillance. PLoS neglected tropical diseases 5, e1206 (2011).
6. Althouse, B. M., Ng, Y. Y. & Cummings, D. A. Prediction of dengue incidence using search query surveillance. PLoS
Negl Trop Dis 5, e1258 (2011).
7. Husnayain, A., Fuad, A. & Lazuardi, L. Correlation between google trends on dengue fever and national surveillance
report in indonesia. Glob. Heal. Action 12, 1552652 (2019).
8. Mollema, L. et al. c. J. medical Internet research 17, e128 (2015).
9. Teng, Y. et al. Dynamic forecasting of zika epidemics using google trends. PloS one 12, e0165085 (2017).
10. Google flu trends. https://web.archive.org/web/20121022154915/http://www.google.org/flutrends/about/how.html. Ac-
cessed: 2020-12-22.
11. Ginsberg, J. et al. Detecting influenza epidemics using search engine query data. Nature 457, 1012–1014 (2009).
12. Hickmann, K. S. et al. Forecasting the 2013–2014 influenza season using wikipedia. PLoS Comput. Biol 11, e1004239
(2015).
13. Lamb, A., Paul, M. & Dredze, M. Separating fact from fear: Tracking flu infections on twitter. In Proceedings of the
2013 Conference of the North American Chapter of the Association for Computational Linguistics: Human Language
Technologies, 789–795 (2013).
14. Santillana, M. et al. Combining search, social media, and traditional data sources to improve influenza surveillance. PLoS
Comput. Biol 11, e1004513 (2015).
15. Sharpe, J. D., Hopkins, R. S., Cook, R. L. & Striley, C. W. Evaluating google, twitter, and wikipedia as tools for influenza
surveillance using bayesian change point analysis: a comparative analysis. JMIR public health surveillance 2, e161
(2016).
16. Won, M., Marques-Pita, M., Louro, C. & Gonçalves-Sá, J. Early and real-time detection of seasonal influenza onset.
PLoS computational biology 13, e1005330 (2017).
17. Lazer, D., Kennedy, R., King, G. & Vespignani, A. The parable of google flu: traps in big data analysis. Science 343,
1203–1205 (2014).
18. Towers, S. et al. Mass media and the contagion of fear: the case of ebola in america. PloS one 10, e0129179 (2015).
19. Olson, D. R., Konty, K. J., Paladini, M., Viboud, C. & Simonsen, L. Reassessing google flu trends data for detection of
seasonal and pandemic influenza: a comparative epidemiological study at three geographic scales. PLoS Comput. Biol 9,
e1003256 (2013).
20. Copeland, P. et al. Google disease trends: an update. In International Society of Neglected Tropical Diseases 2013, 3
(2013).
21. Funk, S. et al. Nine challenges in incorporating the dynamics of behaviour in infectious diseases models. Epidemics 10,
21–25 (2015).
22. Shih, T.-J., Wijaya, R. & Brossard, D. Media coverage of public health epidemics: Linking framing and issue attention
cycle toward an integrated theory of print news coverage of epidemics. Mass Commun. & Soc. 11, 141–160 (2008).
23. Collinson, S. & Heffernan, J. M. Modelling the effects of media during an influenza epidemic. BMC public health 14,
376 (2014).
24. Collinson, S., Khan, K. & Heffernan, J. M. The effects of media reports on disease spread and important public health
measurements. PloS one 10, e0141423 (2015).
9/1125. Tizzoni, M., Panisson, A., Paolotti, D. & Cattuto, C. The impact of news exposure on collective attention in the united
states during the 2016 zika epidemic. PLoS computational biology 16, e1007633 (2020).
26. Dillard, J. P., Li, R. & Yang, C. Fear of zika: Information seeking as cause and consequence. Heal. Commun. 1–11
(2020).
27. Yang, C., Dillard, J. P. & Li, R. Understanding fear of zika: Personal, interpersonal, and media influences. Risk Analysis
38, 2535–2545 (2018).
28. Tausczik, Y., Faasse, K., Pennebaker, J. W. & Petrie, K. J. Public anxiety and information seeking following the h1n1
outbreak: blogs, newspaper articles, and wikipedia visits. Heal. communication 27, 179–185 (2012).
29. Mena, I. et al. Origins of the 2009 h1n1 influenza pandemic in swine in mexico. Elife 5, e16777 (2016).
30. Brammer, L. et al. Surveillance for influenza during the 2009 influenza a (h1n1) pandemic–united states, april 2009–
march 2010. Clin. Infect. Dis. 52, S27–S35 (2011).
31. Devaux, I. et al. Initial surveillance of 2009 influenza a (h1n1) pandemic in the european union and european economic
area, april–september 2009. Eurosurveillance 15, 19740 (2010).
32. Shaman, J. & Kohn, M. Absolute humidity modulates influenza survival, transmission, and seasonality. Proc. Natl. Acad.
Sci. 106, 3243–3248 (2009).
33. Dawood, F. S. et al. Estimated global mortality associated with the first 12 months of 2009 pandemic influenza a h1n1
virus circulation: a modelling study. The Lancet infectious diseases 12, 687–695 (2012).
34. Carlson, C. J., Gomez, A. C., Bansal, S. & Ryan, S. J. Misconceptions about weather and seasonality must not misguide
covid-19 response. Nat. Commun. 11, 1–4 (2020).
35. Greenhalgh, T., Knight, M., Buxton, M., Husain, L. et al. Management of post-acute covid-19 in primary care. bmj 370
(2020).
36. Arunachalam, P. S. et al. Systems biological assessment of immunity to mild versus severe covid-19 infection in humans.
Science 369, 1210–1220 (2020).
37. Del Rio, C., Collins, L. F. & Malani, P. Long-term health consequences of covid-19. Jama 324, 1723–1724 (2020).
38. Kanzawa, M., Spindler, H., Anglemyer, A. & Rutherford, G. W. Will coronavirus disease 2019 become seasonal? The J.
infectious diseases 222, 719–721 (2020).
39. Who coronavirus disease. https://covid19.who.int/. Accessed: 2020-10-01.
40. Kogan, N. E. et al. An early warning approach to monitor covid-19 activity with multiple digital traces in near real-time.
arXiv preprint arXiv:2007.00756 (2020).
41. Dewhurst, D. R. et al. Divergent modes of online collective attention to the covid-19 pandemic are associated with future
caseload variance. arXiv preprint arXiv:2004.03516 (2020).
42. Liu, D. et al. A machine learning methodology for real-time forecasting of the 2019-2020 covid-19 outbreak using
internet searches, news alerts, and estimates from mechanistic models. arXiv preprint arXiv:2004.04019 (2020).
43. Ayyoubzadeh, S. M., Ayyoubzadeh, S. M., Zahedi, H., Ahmadi, M. & Kalhori, S. R. N. Predicting covid-19 incidence
through analysis of google trends data in iran: data mining and deep learning pilot study. JMIR Public Heal. Surveillance
6, e18828 (2020).
44. Lu, T. & Reis, B. Y. Internet search patterns reveal clinical course of disease progression for covid-19 and predict
pandemic spread in 32 countries. medRxiv (2020).
45. Effenberger, M. et al. Association of the covid-19 pandemic with internet search volumes: a google trendstm analysis.
Int. J. Infect. Dis. (2020).
46. Panning, M. et al. Detection of influenza a (h1n1) v virus by real-time rt-pcr. Eurosurveillance 14, 19329 (2009).
47. Duncan, B. How the media reported the first days of the pandemic (h1n1) 2009: results of eu-wide media analysis.
Eurosurveillance 14, 19286 (2009).
48. Klemm, C., Das, E. & Hartmann, T. Swine flu and hype: a systematic review of media dramatization of the h1n1 influenza
pandemic. J. Risk Res. 19, 1–20 (2016).
49. Reintjes, R. et al. “pandemic public health paradox”: time series analysis of the 2009/10 influenza a/h1n1 epidemiology,
media attention, risk perception and public reactions in 5 european countries. PloS one 11, e0151258 (2016).
10/1150. Seybert, H. & Lööf, A. Internet usage in 2010–households and individuals. Eurostat. data Focus. 50–2010 (2010).
51. Chande, A. et al. Real-time, interactive website for us-county-level covid-19 event risk assessment. Nat. Hum. Behav. 4,
1313–1319 (2020).
52. Cook, S., Conrad, C., Fowlkes, A. L. & Mohebbi, M. H. Assessing google flu trends performance in the united states
during the 2009 influenza virus a (h1n1) pandemic. PloS one 6, e23610 (2011).
53. Choi, H. & Varian, H. Predicting the present with google trends. Econ. record 88, 2–9 (2012).
54. Moat, H. S., Preis, T., Olivola, C. Y., Liu, C. & Chater, N. Using big data to predict collective behavior in the real world
1. Behav. Brain Sci. 37, 92–93 (2014).
55. Stephens-Davidowitz, S. The cost of racial animus on a black candidate: Evidence using google search data. J. Public
Econ. 118, 26–40 (2014).
56. Vosen, S. & Schmidt, T. Forecasting private consumption: survey-based indicators vs. google trends. J. forecasting 30,
565–578 (2011).
57. Flaxman, S. et al. Estimating the effects of non-pharmaceutical interventions on covid-19 in europe. Nature 584, 257–261
(2020).
58. Google trends. https://trends.google.com/trends/?geo=US. Accessed: 2020-10-16.
59. Carneiro, H. A. & Mylonakis, E. Google trends: a web-based tool for real-time surveillance of disease outbreaks. Clin.
infectious diseases 49, 1557–1564 (2009).
60. Sood, G. & Laohaprapanon, S. Vanderbilt TV News Abstracts, DOI: 10.7910/DVN/BP2JXU (2020).
61. Media cloud. https://mediacloud.org/. Accessed: 2021-01-04.
62. Flunet. https://www.who.int/influenza/gisrs_laboratory/flunet/en/. Accessed: 2020-06-18.
63. Our world in data. https://github.com/owid/covid-19-data/tree/master/public/data. Accessed: 2020-08-20.
64. New york times covid-19 data. https://github.com/nytimes/covid-19-data. Accessed: 2020-08-20.
65. Stephens-Davidowitz, S. & Varian, H. A hands-on guide to google data. further details on construction can be found on
Google Trends page (2014).
66. Scipy clustering. https://docs.scipy.org/doc/scipy/reference/generated/scipy.cluster.hierarchy.dendrogram.html.
67. Linearregression. https://scikit-learn.org/stable/modules/generated/sklearn.linear_model.LinearRegression.htmll.
68. Randomforestregressor. https://scikit-learn.org/stable/modules/generated/sklearn.ensemble.RandomForestRegressor.html.
11/11Learning from pandemics: using extraordinary events can improve
disease now-casting models - supplemental document
January 19, 2021
arXiv:2101.06774v1 [cs.LG] 17 Jan 2021
CONTENTS
1 Full List of search terms for Flu US and Covid-19 Spain 2
2 Model results for Flu US and Covid-19 Spain 4
3 Covid-19 in the USA 4
A Cases and media mention for Covid-19 in the USA . . . . . . . . . . . . . . . . . . . 4
B Search Terms . . . . . . . . . . . . . . . . . . . . . . . . . . . . . . . . . . . . . . . . . 4
C Clusters . . . . . . . . . . . . . . . . . . . . . . . . . . . . . . . . . . . . . . . . . . . . 5
D Nowcasting . . . . . . . . . . . . . . . . . . . . . . . . . . . . . . . . . . . . . . . . . 5
4 Granger causality 6
11. FULL LIST OF SEARCH TERMS FOR FLU US AND COVID-19 SPAIN
Fig. S1. Google trends search terms dendogram for US. The dendrogram was obtained
through agglomerative hierarchical clustering using Euclidean distance and Ward’s linkage cri-
terion. The pandemic period (March 2009-July 2010) was used and three distinct clusters were
identified: Cluster 1 (orange), Cluster 2 (purple), Cluster 3 (green).
Collected terms US - Flu pandemic:
H1N1, Vaccine, Flu vaccine, Flu contagious, Flu shot, Flu safety, Flu how long, Influenza A,
Hand sanitizer, Flu medicine, Flu treatment, Flu test, Flu symptoms, Spanish Flu, Flu 1918, Pan-
demic, Mexican Flu, WHO, Epidemic, Outbreak, Zanamivir, Surgical mask, Relenza, Flu pre-
cautions, N95 mask, Oseltamivir, Flue, Swine flu, Flu news, Flu cure, Flu (-vaccine), Influenza
(-vaccine), Flu transmission, CDC, Avian influenza, Influensa, Swine flu deaths, Tamiflu, Flu Pre-
vention, Antiviral, Swine flu symptoms, Disinfectant, Fever, Contagious, Guillain-barre, Runny
nose, Sore throat, Sick, Cough
2Fig. S2. Collected terms Spain(ES) dendrogram. The dendrogram was obtained through ag-
glomerative hierarchical clustering using Euclidean distance and Ward’s linkage criterion. The
selected period to build the clusters was between December 2019 to September 2020. Three
clusters were identified and search terms membership can be observed: Cluster 1 (orange),
Cluster 2 (purple) and Cluster 3 (green).
Collected terms ES - Covid-19 pandemic:
pcr, diarrea covid, sintomas covid, covid dolor de garganta, tos covid, cuando aparecen sin-
tomas covid, tiempo contagio covid, test covid, contagio covid, covid hoy, vacuna covid, as-
intomáticos covid, asintomáticos, segunda ola, datos coronavirus, muertos, coronavirus test,
coronavirus hoy, N95, test anticuerpos coronavirus, ffp2, mascarilla kn95, confinamiento, covid-
19, mascarilla, cansancio coronavirus, covid españa, sars cov 2, coronavirus, coronavirus noti-
cias, tratamiento coronavirus, aislamiento, dolor muscular coronavirus, pandemia, vitamina C,
gripe, medicamentos coronavirus, crisis coronavirus españa, cuarentena, neumonía, UCI, gripe
española, vomitos coronavirus, vacuna coronavirus, olfato, anosmia, gripe y coronavirus, coron-
avirus síntomas, sintomas coronavirus, lavarse las manos, epidemia, coronavirus oms, muertes
gripe 2019, infectados coronavirus, coronavirus tos, casos coronavirus, coronavirus china, tos
fiebre, tos sin fiebre, fiebre, tos seca, paracetamol, tos
32. MODEL RESULTS FOR FLU US AND COVID-19 SPAIN
Flu Covid-19
L. Regression Random Forest L. Regression Random Forest
R2 RMSE R2 RMSE R2 RMSE R2 RMSE
Cluster 1 0.83 0.17 0.86 0.14 0.96 0.04 0.84 0.16
Cluster 2 0.76 0.25 0.82 0.18 0.70 0.30 0.20 0.80
Cluster 3 0.50 0.50 0.53 0.47 0.55 0.45 0.44 0.56
All data 0.72 0.28 0.81 0.19 0.46 0.54 0.35 0.65
We collected weekly counts of laboratory-confirmed cases of all strains of flu combined for USA.
3. COVID-19 IN THE USA
A. Cases and media mention for Covid-19 in the USA
Data from Google search trends (GT), news media and Covid-19 infection cases for the USA
was extracted from January 26th to November 15th 2020. We used GT API to obtain the weekly
search terms volume, news media was extracted using Media Cloud [? ] and the infection cases
collected using the Covid-19 tracking API from The Atlantic[? ].
Fig. S3. Covid-19 cases during the 2020 pandemic in the US. Weekly cases of Covid-19 (in
orage), media mentions (in purple) and the search volume for the search term ’Covid-19’ in
the United States of America from January 2020 until mid November 2020. We can see a quick
increase in media activity that precedes the number of cases of infection. Also, some search
terms, like ’Covid-19’, have very similar apparent trends to media activity.
B. Search Terms
Collected terms US - Covid-19 pandemic:
covid-19 testing, covid-19 symptoms, hot spots, covid pneumonia, covid cough, chest pain
covid, covid symptoms, covid, loss taste, covid cold symptoms, vaccine, pcr, pcr test, flu shot,
stay home, anosmia, when will quarantine end, nk95, contact tracing, covid-19 news, icu beds,
icu, loss taste and smell, loss of smell, covid anosmia, quarantine, isolation, coronavirus cases,
covid-19 map, coronavirus covid-19, pandemic, coronavirus deaths, spanish flu, flu 2019, flu
deaths, deaths, ffp2, covid virus, covid-19 cases, chest pain, nhs, corona, dry cough, coronavirus,
cdc, outbreak, epidemic, coronavirus symptoms, sore throat, fever, cold symptoms, coronavirus
4symptoms vs cold, cold flu symptoms, flu symptoms, influenza, pneumonia symptoms, cough
and fever, respiratory infection, pneumonia, cough, flu, oseltamivir tamiflu, oseltamivir phos-
phate, rsv, oseltamivir, tamiflu, symptoms influenza, bronchitis contagious, robitussin, bronchi-
tis pneumonia, bronchitis
C. Clusters
We chose to identify the search terms that best characterize search behavior across the United
States. This selection was used to predict new cases across the country. To better understand
whether we could also predict new infections locally, we selected three states that had two well-
defined waves of infections (train with one wave to test on the second wave). However, the
search terms included in each state were not always the same, as terms containing zeros were
discarded.
a b
c
Fig. S4. Different patterns of searches during the Covid-19 pandemic from January to
November 2020 in the USA. a - Dendrogram summarizing the hierarchical clustering of
Google Trends search terms for the Covid-19 pandemic in US. Three clusters are very salient.
b - Centroid and standard deviation over time for each cluster. The cluster colors correspond
to the clusters in a. c - Pearson correlation between the cluster centroid and either the Covid-19
cases (top) or the media mentions (bottom).* denotes 0.01 < p-value < 0.05, ** denotes p-value <
0.001, and ns a non significant p-value.
D. Nowcasting
Models were trained with the first wave of Covid-19 cases for all the USA, and the second wave
was used to test model predictions. From the results shown in Table S1 we can see that better
predictions were obtained with Cluster 1, the one more correlated with cases, in both models.
5Covid-19 USA
Random Forest Linear Regression
R2 RMSE R2 RMSE
All data 0.63 0.37 0.35 0.65
Cluster 1 0.85 0.15 0.87 0.13
Cluster 2 -0.6 1.06 -25.29 26.29
Cluster 3 -0.46 1.46 -130.99 131.99
Table S1. Predictions results obtained using linear regression and random forest models for the
Covid-19 pandemic in the USA.
4. GRANGER CAUSALITY
To test whether there was evidence of causality between media, the news and each of the clusters,
a lagged regression model was fitted to the data:
L
C (t) = ∑ bτ × x i ( t + τ ) + ǫi (S1)
τ =1
where C(t) are the autoregressed values of the cluster centroid at week t (autoregression was
performed using the function diff in R [? ] with order 1), bτ are the fitted regression coefficients,
xi (t) are the values of the time series to be tested at week t and ǫi are the residuals. L is the
number of lags tested, which was chosen as the one explaining more variance in C, using the
function VARselect [? ]. Lags up to four weeks were tried. Granger causality was tested by
σ
computing G = log( σij ), where σj and σi are the variance of the residuals in the autoregression
and in the lagged regression, respectively. G is expected to follow a χ2 distribution with L
degrees of freedom. The test was implemented using grangertest [? ].
Flu
Cases Media
Order G statistic p value Order G statistic p value
Cluster 1 2 1.95 0.15 4 1.94 0.11
Cluster 2 3 0.52 0.67 4 11.95 3 × 10⁻⁷
Cluster 3 2 1.91 0.16 45 1.21 0.31
Covid-19 Spain
Cases Media
Order G statistic p value Order G statistic p value
Cluster 1 1 0.03 0.86 1 0.15 0.70
Cluster 2 1 0.95 0.34 1 0.03 0.86
Cluster 3 2 0.76 0.48 1 0.79 0.38
Table S2. Results of a Granger-causality test on whether confirmed cases (left-side columns)
or media (right side columns) preceded the centroids of each cluster. We only find evidence of
Granger-causality in the case of flu media mentions and cluster 2. In the table, "Order" repre-
sents the number of lagged weeks.
6You can also read