Media Reports of the COVID-19 Pandemic: A Computational Text Analysis of English Reports in China, the UK, and the US - Scientific ...
←
→
Page content transcription
If your browser does not render page correctly, please read the page content below
Advances in Journalism and Communication, 2021, 9, 47-62
                                                                                                https://www.scirp.org/journal/ajc
                                                                                                          ISSN Online: 2328-4935
                                                                                                            ISSN Print: 2328-4927

Media Reports of the COVID-19 Pandemic:
A Computational Text Analysis of
English Reports in China, the UK,
and the US

Shuran Yang1*, Wenxiang Zhang2, Zhao Yuan3
1
 Faculty of Humanities and Social Science, University of Basel, Basel, Switzerland
2
 Faculty of Information Engineering, Tibet University for Nationalities, Xianyang, China
3
 Faculty of Biosciences, Heidelberg University, Heidelberg, Germany

How to cite this paper: Yang, S. R., Zhang,   Abstract
W. X., & Yuan, Z. (2021). Media Reports of
the COVID-19 Pandemic: A Computation-         This study explored how news outlets, China Daily (CD), Cable News Net-
al Text Analysis of English Reports in Chi-   work (CNN), and Daily Mail (DM) have reported the COVID-19 pandemic.
na, the UK, and the US. Advances in Jour-
                                              Mainstream media is a credible communication path to guide public atten-
nalism and Communication, 9, 47-62.
https://doi.org/10.4236/ajc.2021.92004        tion on COVID-19. Computational text analysis contributes to understanding
                                              media activities about the pandemic and promotes health information com-
Received: March 7, 2021                       munication. The word frequency statistics and lexical diversity highlighted
Accepted: May 8, 2021
                                              how pandemic reports changed in the early outbreak. A cluster analysis illu-
Published: May 11, 2021
                                              strated the frequency and semantic relationship between the highly frequent
Copyright © 2021 by author(s) and             words from CD, CNN, and DM reports. Sentiment analysis was based on
Scientific Research Publishing Inc.           natural language processing when analyzing the sentiment of all headlines
This work is licensed under the Creative
                                              and the sentiment of the different words in the headlines. This study also
Commons Attribution International
License (CC BY 4.0).                          discussed similarities and differences in the coverage by the three different
http://creativecommons.org/licenses/by/4.0/   media outlets at various stages of the outbreak. Three media reported com-
                Open Access                   prehensive coverage of the pandemic. Since they are based in different coun-
                                              tries, their focus and the numbers of reports are different at different stages.
                                              The richness of the vocabulary and the degree of emotion are related to their
                                              media attributes. These results can help health departments exchange infor-
                                              mation, guide accurate public awareness, and eliminate public fears regarding
                                              misconceptions about the pandemic.

                                              Keywords
                                              Computational Text Analysis, COVID-19, Cluster Analysis,
                                              Sentiment Analysis, Media Studies

DOI: 10.4236/ajc.2021.92004 May 11, 2021                         47                   Advances in Journalism and Communication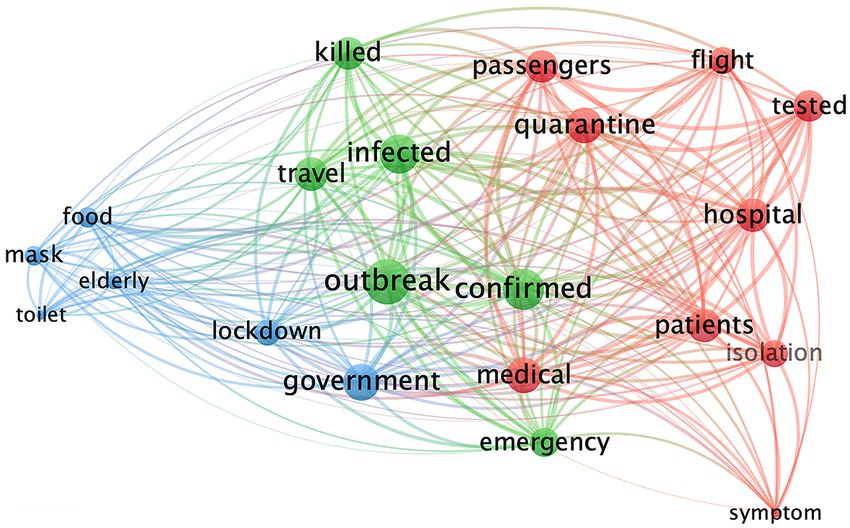
S. R. Yang et al.

                              1. Introduction
                              Worldwide, the media’s reports on significant events have greatly influenced
                              the public’s perception, most recently evidenced by the daily coverage of the
                              COVID-19 pandemic. Since late December 2019, multiple cases with symptoms
                              of unexplained viral pneumonia occurred in Wuhan, China. By February 2020,
                              the localized outbreak in China had evolved into a global outbreak.
                                People can quickly obtain an unprecedented amount of content from online
                              platforms beyond their inner social networks. Since everyone can communicate
                              their opinion on social media platforms, these sites become burdened with mi-
                              sinformation, including the spread of rumors and “fake news”, which are often
                              difficult to verify (Bode & Vraga, 2018; van der Meer & Jin, 2020). Users tend to
                              obtain information that adheres to their views of the world and ignores opposing
                              information, establishing what is known as an “echo chamber” (Mocanu, Rossi,
                              Zhang, Karsai, & Quattrociocchi, 2015). Algorithms mediate and promote con-
                              tent according to users’ preferences and attitudes, thereby facilitating informa-
                              tion exchange (Kulshrestha et al., 2017). It profoundly impacts the construction
                              of social concepts and narrative frameworks. The spread of uncertain informa-
                              tion and concepts can cause group differentiation and negatively affect user
                              emotions (Bakshy, Messing, & Adamic, 2015). Thus, the spread of misinforma-
                              tion in mainstream media is dangerous, perhaps even fatal.
                                Communication researchers have found that respondents who tend to obtain
                              information from mainstream media are more aware of the disease’s lethality
                              and how to protect themselves (Ball & Maxmen, 2020). In the middle of March,
                              Fox News reported that hydroxychloroquine was robust against COVID-19. In
                              response to the Fox News report, Stanford University clarified that the author
                              was not a consultant, and the university was not involved. Although correcting
                              the misinformation, it has widely spread on social media platforms to the extent
                              that it covered up accurate information. This misinformation communication
                              has caused medication shortages, poisoning, and death (Donovan, 2020). The
                              spread of misinformation in mainstream media is dangerous and can even turn
                              out deadly.
                                According to the media dependency theory (Ball-Rokeach, 1998; Ball-Rokeach,
                              1985), people mainly depend on the media to acquire the information needed in
                              hazardous conditions (Jang & Baek, 2019; Seo, 2019). The mainstream media’s
                              impact is evident; the information they release should be as accurate as possible
                              (McCombs & Shaw, 2016). Therefore, examining the differences in the reporting
                              habits of distinct media outlets is important. This includes whether cultural, re-
                              gional, and media differences have affected the development of the pandemic and
                              people’s perception of the pandemic in each country; whether the media outlets
                              disseminate credible information; and whether their reporting promoted panic.
                                Media from China, the UK, and the US were chosen as research objects. The
                              goal of the study was to understand the patterns in informing the public by three
                              major media outlets in each country. Computational text analysis was performed

DOI: 10.4236/ajc.2021.92004                        48                  Advances in Journalism and Communication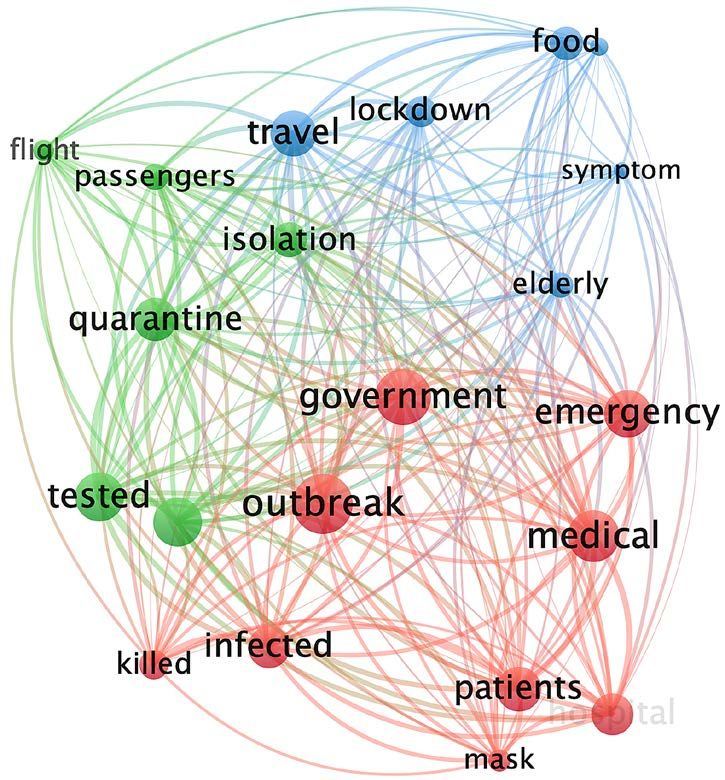
S. R. Yang et al.

                              for mining the data, and visual data analysis was applied to visualize the patterns
                              of the COVID-19 pandemic (DiMaggio, 2015). This study discusses similarities
                              and differences in the way the media from these three countries reported on the
                              COVID-19 pandemic. The following research questions (RQs) were asked: What
                              are the news reports trends concerning the pandemic (RQ1)? What did these
                              media outlets report at different stages (RQ2)? Was the sentiment expressed in
                              the headlines of their coverage positive or negative (RQ3)?
                                This study contributes to clearing up national or regional media discourses on
                              the pandemic. Besides, it develops a valuable model for hot news reports, public
                              opinion research, and media effects research in the future.

                              2. Computational Text Analysis
                              Content analysis of text-based data is generally accepted as a popular method in
                              social sciences (Grimmer & Stewart, 2013). Various computational techniques
                              have been developed in computer science, bioinformatics, psychology, linguis-
                              tics, and communication (e.g. computational communication research) (Nelson,
                              2017). Artificial intelligence knowledge, such as natural language processing
                              (NLP), deep learning, and data mining, suggests implicit connections between
                              data and how entities express, infer, predict, and visualize relationships between
                              texts and concepts (Socher et al., 2013). The content analysis framework for
                              health communication is explored in research on new methods suitable for
                              combining computational research and humanities (Medford, Saleh, Sumarso-
                              no, Perl, & Lehmann, 2020).
                                The application of algorithms and mathematical models to text-based data has
                              injected new vitality into content analysis through interdisciplinary collabora-
                              tion (Agerri, Artola, Beloki, Rigau, & Soroa, 2015; Alm, Roth, & Sproat, 2005).
                              NLP and other machine learning methods provide support and analyses of text
                              data to construct newer and faster computing methods, especially for big data
                              research (Agerri et al., 2015; DiMaggio, 2015; Scharkow, 2013). Additional soft-
                              ware packages have been developed to bundle algorithms and simplify their ap-
                              plication in conventional text analysis projects (Oh et al., 2020) (i.e. Stanford
                              NLP used in my research).
                                Many researchers are still skeptical about the role of computers in processing
                              content 21. Human behavior is the core content of this type of research, which is
                              not easy to elucidate using simple data-based methods (Hancock, Landrigan, &
                              Silver, 2007). This article provides a hybrid approach for developing language
                              and text analysis, which offers a comprehensive interpretation of the texts and
                              incorporates the rigorous, reliable, and repeatable computational text analysis
                              method.

                              3. Methods
                              3.1. Data Collection
                              In this research, Python version 3.7 was used for data processing and analysis (C.

DOI: 10.4236/ajc.2021.92004                        49                   Advances in Journalism and Communication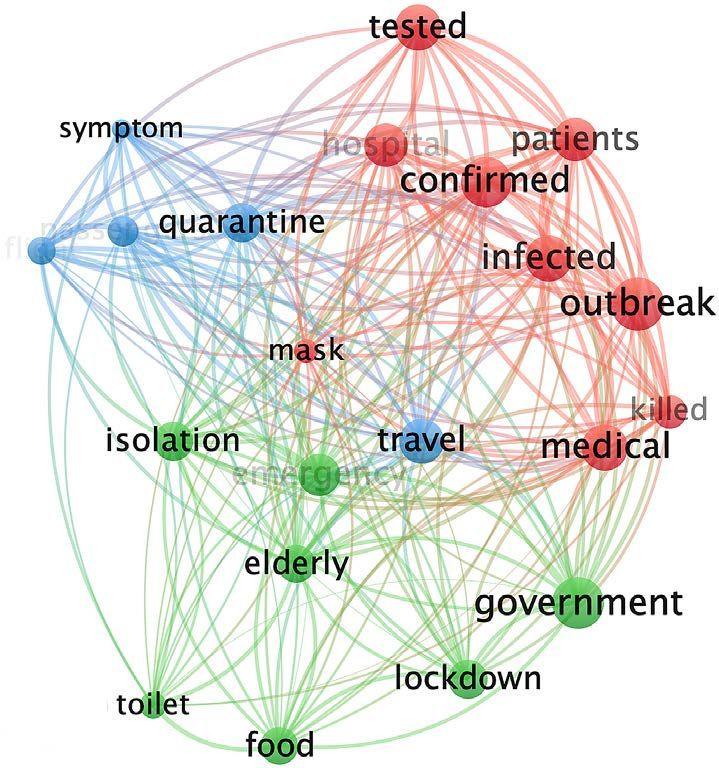
S. R. Yang et al.

                              Luthra and D. Mittal, 2010). This study employed a computational text analysis
                              approach of coverage between 9 January 2020 (the first report about the pan-
                              demic) and 31 March 2020. At the beginning of the outbreak, the pandemic
                              erupted in China and spread to Europe and America. This particular period is
                              essential for examining media reactions related to the early COVID-19 outbreak.

                              3.2. Lexical Diversity (LD)
                              LD is used for content analysis of vocabulary richness (McCarthy & Jarvis, 2010;
                              Yu, 2010). LD is a measure of the number of different words used in a text (Jo-
                              hansson, 2009). One of the most common methods for measuring LD is to use
                              the ratio of unique lexical items divided by the ratio of the total number of
                              words in text samples; i.e. the type-token ratio (TTR) (Bates et al., 1988; Ferga-
                              diotis, G., Wright, H. H., & West, 2013). This study examined the lexical seman-
                              tics between the different media outlets.

                              3.3. Cluster Analysis
                              This study used keywords such as “COVID-19”, “pandemic”, etc. to capture the
                              media’s coverage. Word frequency analysis was performed and high-frequency
                              words were discussed. Using VOSviewer, a cluster analysis was performed (van
                              Eck & Waltman, 2010, 2013). Focusing on the frequencies of single words in the
                              coverage and visualizing these frequencies through cluster analysis to view the
                              most common topics is critical.

                              3.4. Sentiment Analysis
                              Sentiment analysis is an NLP method that classifies sentiment towards news re-
                              port headlines. This study used two methods for sentiment analysis. First, key-
                              words that appeared in headlines were analyzed. Positive, neutral, and negative
                              words were tallied, based on the study by Pang and Li (Pang & Lee, 2005).
                              Second, based on a new type of recurrent neural network (RNN) (Socher et al.,
                              2013), the Stanford Sentiment Treebank was built on a grammatical structure
                              which is a deep recursive model of semantic composition on a sentiment tree.
                              The semantic space might be handy; however, the meaning of longer phrases
                              cannot be expressed in a principled way. It primarily relied on the sentence
                              structure to construct the representation of the entire sentence and measure the
                              sentiment according to the meaning of longer phrases.

                              4. Results
                              4.1. News Coverage Trend of COVID-19
                              From the perspective of global information dissemination, English is still the
                              most widespread language. Therefore, this study chose these three media as re-
                              search objects. China Daily (CD) is a representative of English-language media
                              in China. Cable News Network (CNN) and Daily Mail (DM) are both main-
                              stream English media with a universal influence worldwide. The first report on

DOI: 10.4236/ajc.2021.92004                        50                     Advances in Journalism and Communication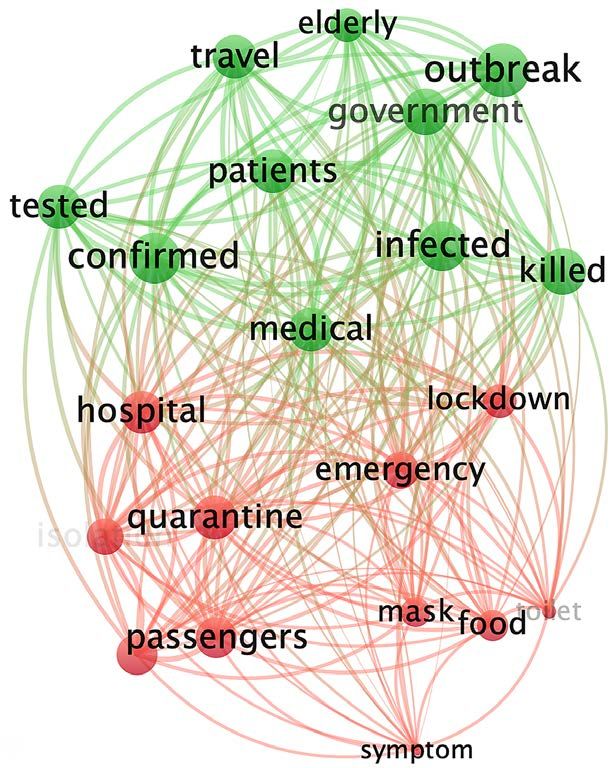
S. R. Yang et al.

                              COVID-19 was published on CNN, DM, and CD on 9 January 2020. Therefore,
                              all related reports published from 9 January 2020 to 31 March 2020 were in-
                              cluded in the dataset. A total of 16,705 reports on COVID-19 were obtained, in-
                              cluding 7400 articles from CD, 2204 articles from CNN, and 7101 articles from
                              DM. CD has paid attention to the pandemic since 9 January 2020. CNN and DM
                              have not reported many reports in the previous period, but they both have kept a
                              constant focus. The number of reports has a cycle of seven days a week. On the
                              weekends, the number has decreased significantly, owing to fewer editorial staff
                              on the weekends. Depending on the occurrence and development of the pan-
                              demic outbreak, time was divided into two parts: the localized outbreak in China
                              (9 January 2020 to 21 February 2020) and the global pandemic stage (22 Febru-
                              ary 2020 and 31 March 2020) Figure 1 illustrates the pattern of increased reports
                              from individual peaks. In Stage 1, the number of CD reports positively corre-
                              lated with the number of new cases in China, and the number of reports by CNN
                              and DM positively correlated with their own country’s new cases in Stage 2. The
                              number of CD reports did not change with the number of new global cases.
                                These results indicate the intensity of covering COVID-19. Concerning tem-
                              poral distribution, the reports of CD showed a marked increase from 9 January
                              to 2 February whereas the number of reports from 3 February to 31 March was
                              steady. DM’s reports showed an apparent increase from 22 January onward,
                              climbing again on 23 February. The number of reports gradually increased.
                              CNN’s reports did not change significantly in Stage 1; although, there were con-
                              siderable increases in the number of reports posted on 29 January 04 February
                              and 10 February. The overall trend was comparatively similar to that of DM.
                              Table 1 shows the changes in the number of reports of the three media at dif-
                              ferent stages.

                              4.2. Word Frequency Statistics and LD
                              In the word frequency, high-frequency words were sorted from high to low
                              (Figure 2). From 9 January to 31 March, 26,735, different words were used
                              568,582 times by CNN; 4,807,762 words were used 57,382 times by DM, and
                              39,455 words were used in 1,636,758 instances by CD. Articles, prepositions,
                              conjunctions, and other words that were not specific to the topic were beyond
                              the statistical scope of this study.

                              Table 1. Number, proportion, and mean reports by CD, CNN, and DM in the two dif-
                              ferent stages.

                                                           Stage 1                              Stage 2

                                           Number      Proportion    Mean          Number     Proportion        Mean

                                 CD            3078        41.59%    69.96           4322       58.41%          110.82

                                CNN            287         13.02%    18.41           1917       86.98            287

                                 DM            810         11.41%    161.31          6291       88.59%           1917

DOI: 10.4236/ajc.2021.92004                           51                     Advances in Journalism and Communication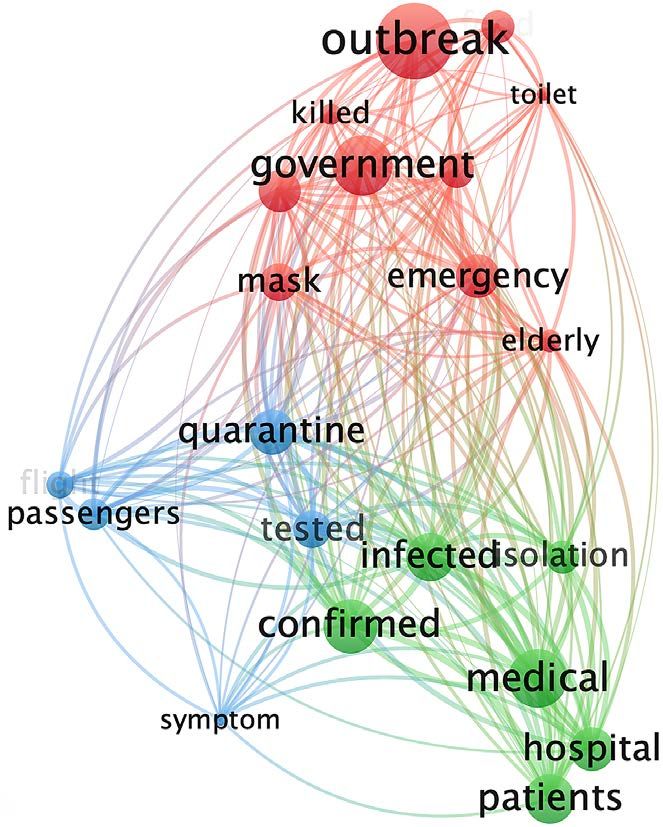
S. R. Yang et al.

Figure 1. Number of reports by day on CNN, DM, and CD from 9 January 2020 to 31 March 2020.

                                                  Figure 2. Measures of lexical diversity using the TTR.

                                       The LD was calculated based on the number of articles, the word count, and
                                     the unique word count published over this period (Tweedie & Baayen, 1998).
                                     Compared with CD and CNN, each DM report used the most words; however,
                                     the TTR was the lowest for DM as compared to the other two. The TTR results
                                     of CNN and CD were similar; however, CNN’s TTR was more concentrated than
                                     CDs. It is worth noting that Hong Kong ranked evenly in the DM and CD re-
                                     ports for historical and political reasons. Before 1997, Hong Kong was a British
                                     colony. The Chinese government resumed the exercise of sovereignty over Hong
                                     Kong on July 1, 1997. Owing to Australia’s membership in the Commonwealth,
                                     the British media pay attention to Australia. Australia ranks very high in the DM
                                     report than others.

DOI: 10.4236/ajc.2021.92004                                52                    Advances in Journalism and Communication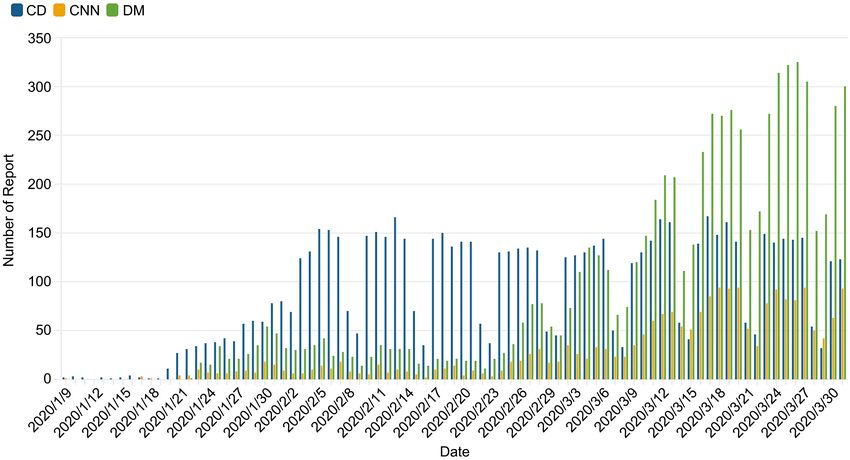
S. R. Yang et al.

                                After deleting prepositions, conjunctions, and other words in these news re-
                              ports that were not topic-specific, the top 30 high-frequency words were selected
                              for subsequent analysis. The results show that different media were all focused
                              on similar topics about this global pandemic. All media paid attention to the
                              changes in the outbreak in different countries, the number of cases, and the re-
                              spective government’s responses. Owing to geographical reasons, the frequency
                              of both “China” and “Daily” was high in CD. CNN repeatedly featured “the US”
                              and “CNN”. “UK” appeared in DM for the same reason. “Trump” and “presi-
                              dent” appeared more often on CNN than others, suggesting that the President of
                              the United States plays a dominant role in the public sphere. Moreover, Trump
                              keenly expressed his opinions on social media platforms, prominently Twitter:
                              every time he posted a social media statement, he received considerable atten-
                              tion (Lee & Xu, 2018).
                                According to the content analysis, CNN and DM preferred to use “tell” to
                              quote other people’s statements, while CD opted for an objective narrative; thus,
                              “photo(s)” appeared more often. Interestingly, the frequency of “Australian” was
                              very high in DM’s reporting.

                              4.3. Cluster Analysis
                              A cluster analysis was conducted on the high-frequency keywords in the reports
                              between 9 January and 31 March 2020. Through the empirical judgment me-
                              thod, 23 high-frequency keywords with strong descriptiveness and contribution
                              to the topic were selected from CNN, DM, and CD. This highlights the differences
                              between different media concerning frequency and variation (Figures 3-5).
                                From the cluster analysis, news reports on the pandemic mainly revolved
                              around four themes: 1) the pandemic situation and confirmed cases of COVID-19,
                              2) how to control the disease, 3) travel concerns, and 4) health and medical
                              treatment concerns.

                              Figure 3. Cluster analysis of CD in stage 1 and 2.

DOI: 10.4236/ajc.2021.92004                          53                     Advances in Journalism and Communication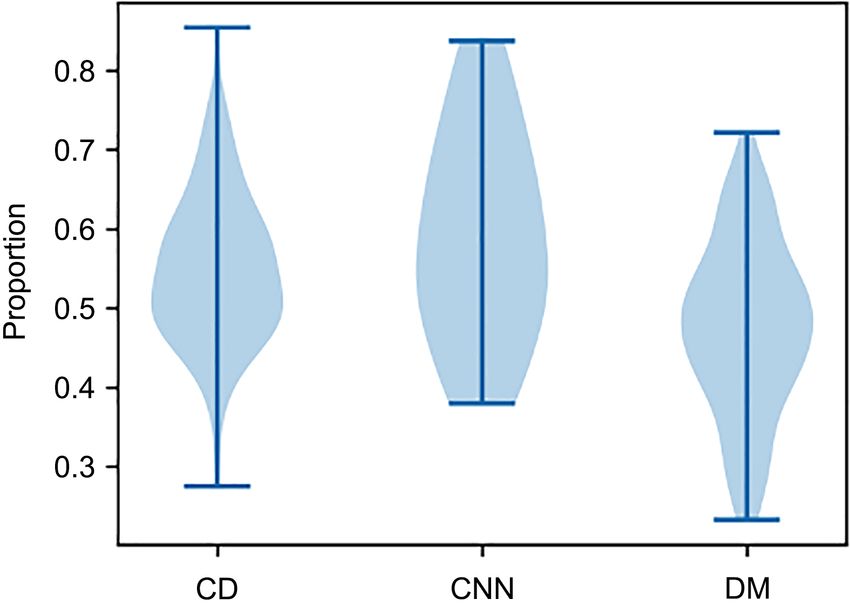
S. R. Yang et al.
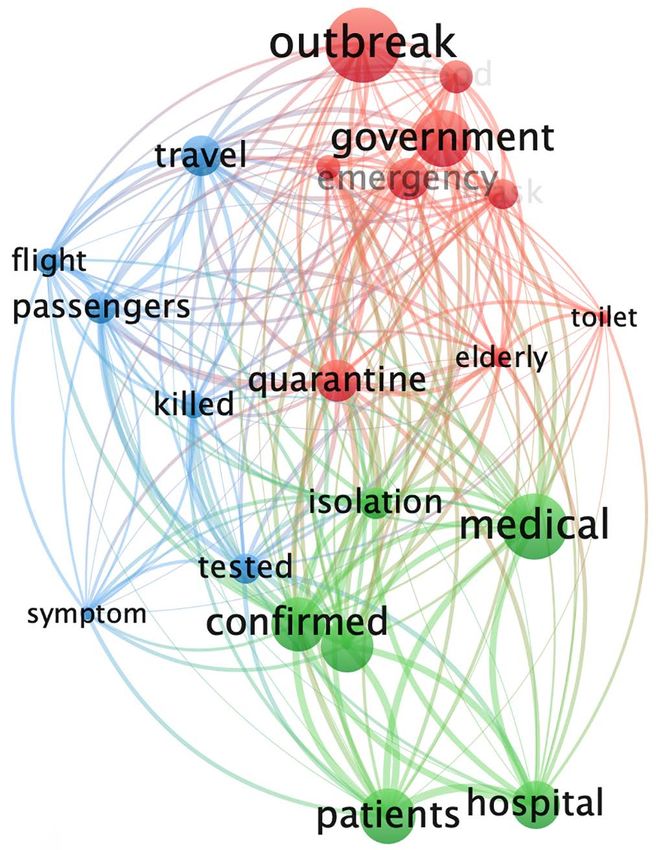
Figure 4. Cluster analysis of CNN in stage 1 and 2.
Figure 5. Cluster analysis of DM in stage 1 and 2.
In Stage 1, these mainstream media mainly reported on localized outbreaks in
China. CNN’s reports mainly focused on Themes 1 and 2 and tended to fol-
low-up on the pandemic outbreak. DM reported “outbreaks” related to Theme 1
and Theme 4 formed a set. Theme 3 and Theme 4 constituted the other group.
At this stage, both CD and DM were intensely concerned with Theme 4.
In Stage 2, the outbreak developed into a global pandemic. The focus of the
reports shifted from China to global developments and the situation in the re-
spective countries. The coverage was still closely related to these four themes.
The “outbreak” in CD’s coverage was still strongly related to “government”.
CNN’s “outbreak” began to connect to “government” and “medical”. In DM,
“outbreak” was also strongly related to “medical”. During this time, CNN and
DM discussed their own countries’ medical conditions.
Figure 4 shows that in DM and CNN, the word “killed” was the high frequency
in Stage 1, during the outbreak in China. This term decreased in frequency during
DOI: 10.4236/ajc.2021.92004 54 Advances in Journalism and CommunicationS. R. Yang et al.
Stage 2. In CD, this term’s frequency was comparatively lower during both stages.
4.4. Sentiment Analysis
In the news report, the headline is critical (Blom & Hansen, 2015). It helps the
audience decide whether to continue reading. Therefore, sentiment analysis was
used for all headlines in the dataset (Rameshbhai & Paulose, 2019). Two senti-
ment analysis methods were employed. This set of values indicates the attitudes
and opinions of each medium regarding the outbreak. One is to analyze every
word in the headline. Sematic vector spaces have been extensively used as fea-
tures for single words (Turney & Pantel, 2010). The more significant the propor-
tion of positive and negative words in the headline, the more exaggerated it is.
According to the results (Table 2), the proportion of positive and negative
words was the highest in DM as compared to CNN and CD. This indicates that
this newspaper preferred to use exaggerated expressions to attract readers. CD
had the lowest percentage of positive and negative words as compared to CNN
and DM. Its headline expression was closer to the objective narrative. Through-
out Stages 1 and 2, the format of news headlines in the dataset did not change
much, and the style was relatively consistent.
The other is to analyze the entire headline. According to the RNN model re-
sults for sentiment analysis (Oh et al., 2020) (Table 3), each headline was mainly
negative about the pandemic. During Stage 1, the negative sentiments of the
three media were relatively consistent. In Stage 2, the Chinese situation took a
better turn; thus, CD reduced their negative sentiment. Interestingly, in the
global pandemic stage, CNN’s negative sentiment was much lower as compared
to CD. CNN’s reports were relatively optimistic. When some of the headlines
were extracted for content analysis, the results showed that CNN did not fully
support Trump’s points of view and instead questioned his policies. Among
these positive headlines, some indicated that China’s outbreak was controlled
and efficient. Overall, CNN’s attitude at the time of reporting was relatively pos-
itive and did not rely too much on the expression or evocation of emotions.
During Stage 1, the negative emotions expressed or evoked by DM were of the
highest degree using exaggerated emotional vocabulary; during the pandemic
phase, they slightly decreased but still remained at a high level.
Table 2. Results of sentiment analysis for each word of the headlines in CD, CNN, and
DM.
CD CNN DM
1 Positive Negative Positive Negative Positive Negative
Stage 1 41.88% 14.13% 49.06% 22.50% 58.48% 64.91%
Stage 2 41.59% 16.10% 49.48% 21.47% 65.93% 61.26%
Total 41.71% 15.29% 49.42% 21.60% 65.11% 61.67%
DOI: 10.4236/ajc.2021.92004 55 Advances in Journalism and CommunicationS. R. Yang et al.
Table 3. Results of the recurrent neural network model analysis for each headline in CD,
CNN, and DM.
CD CNN DM
2 Positive Negative Positive Negative Positive Negative
Stage 1 12.53% 51.40% 4.06% 61.30% 3.16% 78.13%
Stage 2 8.31% 29.91% 3.65% 24.31% 4.55% 67.56%
Total 8.40% 32.28% 3.37% 24.16% 4.36% 67.94%
5. Discussion
In a global health crisis, misinformation does not lead people, such as people
starting to take untested medication, ignoring public health advice, and even
boycotting a prospective vaccination. Misinformation provides a hotbed for the
pandemic to attack anywhere. It is impossible to stop the spread of misinforma-
tion, even if social media platforms already stepped up their efforts to remove
misinformation and lead people to reliable sources (Ball & Maxmen, 2020).
Mainstream media plays a decisive role in guiding people and conveying reliable
information.
The mainstream media in each country (the United Kingdom, the United
States of America, and the PR China) are the main channels for public informa-
tion about the pandemic. Online news in the mainstream media also took full
advantage of the network to be time-sensitive. The three selected mainstream
media outlets have the standard features of fast communication, a sufficient
number of reports, high reporting density, representative samples, and interna-
tional perspective in each country. However, their attributes are different: CD is
an official newspaper operated by the Chinese government; CNN is a commer-
cial news broadcast operated by a corporation, the Warner Media group; and
DM is a known representative of the so-called “yellow press” (Örnebring &
Jönsson, 2004).
CNN and DM similarly constructed reports in Stage 1. They had the same
curve of change in the volume of articles, and both focused on all four themes.
However, the emphasis was different. In Stage 1, the content of CD’s reports
mainly consisted of descriptions of the pandemic, government measures, know-
ledge and science, news about medical workers, information about help and do-
nations, dispelling misinformation, and some media reviews on the outbreak.
The content of CNN’s reports mainly focused on the condition of the pandemic,
Chinese government measures, and media reviews of measures taken in China
The coverage was relatively objective and comprehensive; but it also lacked
awareness of the crisis and warning. Compared to the others, DM has more “at-
titude”. It followed the development of the pandemic in China and the Chinese
government’s measures and doubts about the pandemic and the measures taken.
In Stage 2, the changes in the volume of manuscripts issued by the three media
were nearly identical. They jointly paid attention to the pandemic’s international
DOI: 10.4236/ajc.2021.92004 56 Advances in Journalism and CommunicationS. R. Yang et al.
issues and the changes, measures, and available medical treatment in the respec-
tive countries.
All three media reports revolved around three words: “outbreak”, “govern-
ment”, and “medical”. These were the most used terms in the four main themes
in both stages. The strong correlation with “government” was mainly related to
government measures. The words are closely associated with the development of
the pandemic and government decisions. The proportion of socially active words
such as “travel” and “flight” in Theme 3 increased in the second stage and were
related.
CD paid more attention to “masks” than the other media. The difference in
the frequency of the word “masks” depended on whether different countries re-
quired people to wear masks to guide public health measures. Perhaps CD men-
tioned masks more often because China emphasized that wearing a mask is the
most effective protective measure. At this stage, the United Kingdom and the
United States believed that masks were only necessary for sick people. However,
in Stage 2, British and American media reported more on masks, which signifi-
cantly impacted the audience’s decision to wear masks.
Rumors triggered by emergencies all have an inevitable life cycle, and the de-
velopment of rumors will gradually disappear from inception, followed by the
birth of new rumors (Shibutani, 1966). As a special kind of unexpected event,
the pandemic has a prolonged impact cycle; therefore, the rumors triggered by
the pandemic have a long emergence period. The public and media have consis-
tently maintained high-level attention. In Stage 1, the number of new cases per
day in China was positively correlated with the daily reports in CD. The number
of new cases per day positively affected the number of daily reports. The correla-
tion between the number of new cases per day and the number of daily reports
was not significant in the second half of Stages 1 and 2. Changes in the number
of new cases per day did not directly affect the number of daily reports. In Stage
2, CNN and DM presented the same situation as the CD in Stage 1.
In the first half of each country’s pandemic, the spread of the pandemic di-
rectly affected the increase in the number of reports. As the pandemic stabilizes
in increments, the measures taken by different governments were widely ac-
cepted. Public opinion slowed until it reached a relatively stable state. During
this stage, the rumors continued to change; but the cycle of change slowed.
Changes in the pandemic would no longer directly affect the number of pan-
demic-related reports. However, the government introduced relevant guidance
and regulations that would break this stable situation. For example, on 23 Janu-
ary 2020, Wuhan, China locked down, and on 9 March Italy proposed a lock-
down from 10 March onward. These sparked another wave of public opinion
and rumors. The number of reports increased dramatically. Each time the gov-
ernment made pandemic-related announcements, it should anticipate the sub-
sequent actions triggered by public opinions following the media release, such as
lockdown regulations, wearing masks in public places, and other related regula-
DOI: 10.4236/ajc.2021.92004 57 Advances in Journalism and CommunicationS. R. Yang et al.
tions. The information released was followed by demonstrations that resulted in
mass gatherings, which results in infection. Media attitudes and opinions should
be used to promote or control the occurrence and development of these beha-
viors.
CNN had the highest overall vocabulary richness. The DM’s vocabulary rich-
ness was slightly lower than that of the CD. However, CNN and DM both used
English as their mother tongue. As the so-called yellow press, DM uses simpli-
fied language and exaggerated headlines. According to the sentiment analysis,
the proportion of positive and negative words in CD was smaller than in the
other two. It preferred neutral words. In Stage 1, the negative words were even
higher than the positive words, indicating that DM has a particular negative
emotion for China’s localized outbreak. In Stage 2, although positive words were
slightly higher than negative words, both had a large proportion. The DM head-
lines were the most exaggerated to garner attention. Regarding overall sentiment
analysis, CNN’s and DM’s reports focused heavily on the Chinese outbreak un-
der review and were very negative overall. Once the disease had engulfed the
whole world, CNN’s negative headlines reduced significantly. When the out-
break was more severe in each respective country, negative sentiment was re-
ported less. CD had the smallest before-and-after change in positive and nega-
tive sentiment of all three media outlets. In Stage 2, when the outbreak in China
was already under control, and the world outbreak was trending, the negative
sentiment of CD increased by almost 2% from Stage 1. The negative sentiment
was mainly related to the widespread knowledge of the pandemic and the cur-
rent situation. In Stage 1, the negative sentiment reported by CNN and DM fo-
cused on China’s pandemic. In Stage 2, CD’s negative sentiment focused on its
own respective pandemic situation, the spread of protection knowledge, and the
pandemic situation in other countries.
The sentiment analysis and LD correlated with the media attributes: CNN
targeted the more educated public; the state officially operates the CD. The posi-
tive and negative words were not rich, mainly based on the objective narrative
and strict attitude. The news sources were well-founded. DM relied heavily on
exaggerated headlines to arouse potential readers’ interest in reading and
tempting them to invest in the media. The average literacy level of the audience
was lower than that of others, meaning that the words were simple to read 39.
However, the number of extremely positive and negative two extremes was high.
Headlines with more positive and negative words were more stimulating and
have their attitudes. However, news content published during outbreaks is likely
to spread quickly and generate public opinions. If the media target an audience
with a low overall literacy level, such news is more likely to promote the spread-
ing of rumors.
Individuals’ need for pandemic-related information rises rapidly based on
their safety and rights. If the information cannot be obtained from the authorita-
tive official channels, the public will blindly adopt the information from other
DOI: 10.4236/ajc.2021.92004 58 Advances in Journalism and CommunicationS. R. Yang et al.
channels, which leaves considerable room for rumors to survive. Internet ru-
mors spread with high efficiency. If rumors are spread unchecked, individuals’
sense of uncertainty and insecurity will gradually deepen, and public opinions
and rumors will get out of control and even threaten people’s lives. Mainstream
media, as the leading voice channel for public affairs communication, should
assume corresponding responsibility. Through objective and truthful reporting
of emergencies, media outlets should reasonably help the public vent dissatisfac-
tion and express opinions, thereby alleviating or eliminating public dissatisfac-
tion and insecurity, maintaining stable social relationships.
Researchers were trying to use interdisciplinary methods for text analysis. Re-
searchers express, infer, predict, and visualize the relationship between text and
concepts through computational text analysis. According to people-oriented
communication studies, researchers find new ways to combine computational
research and humanism within the content analysis framework in health com-
munication.
6. Implications
This study had some limitations. First, the length of the articles varied greatly,
which may have affected data analysis. Analyzing articles of a similar length
from the same date on the same topic would yield more accurate results. Second,
as data were mined only from CNN, DM, and CD, there was still much room for
optimizing data volume and data dimensions. Data mining on the same timeline
on social media networks is necessary and combines data with media report data
(Demszky et al., 2019; Ordun, Purushotham, & Raff, 2020) The final step is to
formulate a practical management and prediction model through machine learn-
ing. For instance, understanding users’ engagement in the related COVID-19 tags
on social media platforms and understanding users’ sentimental dynamics be-
hind the COVID-19 pandemic could help explore mainstream media’s effect in a
crisis and design more efficient social behavior models for efficiently solving mi-
sinformation communication. Lastly, sentiment analysis is not a magic wand. It
depends heavily on the psychological theories behind it; for example, whether a
sentiment analysis is based on discrete emotions (Ekman & Friesen, 1971) or va-
lence and arousal (Kim & Klinger, 2018).
Acknowledgments
Thank Prof. Gerhard Lauer for his comments on drafts. The Chinese Scholar-
ship Council is gratefully acknowledged for financial support to my doctoral
studies.
Author Contributions
Conceptualization, formal analysis, investigation, visualization, data curation,
writing—original draft preparation, Shuran Yang.; methodology, Shuran Yang
and Zhao Yuan.; resources, Zhao Yuan and Wenxiang Zhang.; All authors have
DOI: 10.4236/ajc.2021.92004 59 Advances in Journalism and CommunicationS. R. Yang et al.
read and agreed to the published version of the manuscript.
Conflicts of Interest
The authors declare no conflicts of interest regarding the publication of this pa-
per.
References
Agerri, R., Artola, X., Beloki, Z., Rigau, G., & Soroa, A. (2015). Big Data for Natural Lan-
guage Processing: A Streaming Approach. Knowledge-Based Systems, 79, 36-42.
https://doi.org/10.1016/j.knosys.2014.11.007
Alm, C. O., Roth, D., & Sproat, R. (2005). Emotions from Text: Machine Learning for
Text-Based Emotion Prediction. HLT/EMNLP 2005 Human Language Technology
Conference and Conference on Empirical Methods in Natural Language Processing,
Proceedings of the Conference, Vancouver, 6-8 October 2005, 579-586.
https://doi.org/10.3115/1220575.1220648
Bakshy, E., Messing, S., & Adamic, L. A. (2015). Exposure to Ideologically Diverse News
and Opinion on Facebook. Science, 348, 1130-1132.
https://doi.org/10.1126/science.aaa1160
Ball, P., & Maxmen, A. (2020). The Epic Battle against Coronavirus Misinformation and
Conspiracy Theories. Nature, 581, 371-374.
https://doi.org/10.1038/d41586-020-01452-z
Ball-Rokeach, S. J. (1985). The Origins of Individual Media-System Dependency: A Soci-
ological Framework. Communication Research, 12, 485-510.
https://doi.org/10.1177/009365085012004003
Ball-Rokeach, S. J. (1998). A Theory of Media Power and a Theory of Media Use: Differ-
ent Stories, Questions, and Ways of Thinking. Mass Communication and Society, 1,
5-40. https://doi.org/10.1080/15205436.1998.9676398
Bates, E., Bretherton, I., Snyder, L., Beeghly, M., Shore, C., McNew, S. et al. (1988). From
First Words to Grammar: Individual Differences and Dissociable Mechanisms. New
York: Cambridge University Press.
Blom, J. N., & Hansen, K. R. (2015). Click Bait: Forward-Reference as Lure in Online
News Headlines. Journal of Pragmatics, 76, 87-100.
https://doi.org/10.1016/j.pragma.2014.11.010
Bode, L., & Vraga, E. K. (2018). See Something, Say Something: Correction of Global
Health Misinformation on Social Media. Health Communication, 33, 1131-1140.
https://doi.org/10.1080/10410236.2017.1331312
Luthra, C., & Mittal, D. (2010). Firebug 1.5: Editing, Debugging, and Monitoring Web
Pages. Birmingham: Packt Publishing.
Demszky, D., Garg, N., Voigt, R., Zou, J., Shapiro, J., Gentzkow, M., & Jurafsky, D.
(2019). Analyzing Polarization in Social Media: Method and Application to Tweets on
21 Mass Shootings. 2019 Proceedings of NAACL, Minneapolis, June 2019, 2970-3005.
https://doi.org/10.18653/v1/N19-1304
DiMaggio, P. (2015). Adapting Computational Text Analysis to Social Science (and Vice
Versa). Big Data & Society, 2, 2053951715602908.
https://doi.org/10.1177/2053951715602908
Donovan, J. (2020). Social-Media Companies Must Flatten the Curve of Misinformation.
Nature. https://doi.org/10.1038/d41586-020-01107-z
DOI: 10.4236/ajc.2021.92004 60 Advances in Journalism and CommunicationS. R. Yang et al.
Ekman, P., & Friesen, W. V. (1971). Constants across Cultures in the Face and Emotion.
Journal of Personality and Social Psychology, 17, 124-129.
https://doi.org/10.1037/h0030377
Fergadiotis, G., Wright, H. H., & West, T. M. (2013). Measuring Lexical Diversity in
Narrative Discourse of People with Aphasia. American Journal of Speech-Language
Pathology, 22, S397-S408. https://doi.org/10.1044/1058-0360(2013/12-0083)
Grimmer, J., & Stewart, B. M. (2013). Text as Data: The Promise and Pitfalls of Automatic
Content Analysis Methods for Political Texts. Political Analysis, 21, 267-297.
https://doi.org/10.1093/pan/mps028
Hancock, J. T., Landrigan, C., & Silver, C. (2007). Expressing Emotion in Text-Based
Communication. Conference on Human Factors in Computing Systems—Proceedings,
San Jose, 28 April-3 May 2007, 929-932. https://doi.org/10.1145/1240624.1240764
Jang, K., & Baek, Y. M. (2019). When Information from Public Health Officials Is Un-
trustworthy: The Use of Online News, Interpersonal Networks, and Social Media dur-
ing the MERS Outbreak in South Korea. Health Communication, 34, 991-998.
https://doi.org/10.1080/10410236.2018.1449552
Johansson, V. (2009). Lexical Diversity and Lexical Density in Speech and Writing: A
Developmental Perspective. Working Papers in Linguistics, 53, 61-79.
Kim, E., & Klinger, R. (2018). A Survey on Sentiment and Emotion Analysis for Compu-
tational Literary Studies (pp. 1-26). http://arxiv.org/abs/1808.03137
Kulshrestha, J., Eslami, M., Messias, J., Zafar, M. B., Ghosh, S., Gummadi, K. P., & Kara-
halios, K. (2017). Quantifying Search Bias: Investigating Sources of Bias for Political
Searches in Social Media. Proceedings of the ACM Conference on Computer Sup-
ported Cooperative Work, CSCW, Portland, 25 February-1 March 2017, 417-432.
https://doi.org/10.1145/2998181.2998321
Lee, J., & Xu, W. (2018). The More Attacks, the More Retweets: Trump’s and Clinton’s
Agenda Setting on Twitter. Public Relations Review, 44, 201-213.
https://doi.org/10.1016/j.pubrev.2017.10.002
McCarthy, P. M., & Jarvis, S. (2010). MTLD, vocd-D, and HD-D: A Validation Study of
Sophisticated Approaches to Lexical Diversity Assessment. Behavior Research Me-
thods, 42, 381-392. https://doi.org/10.3758/BRM.42.2.381
McCombs, M., & Shaw, D. (2016). The Agenda-Setting Function of Mass Media. Agenda
Setting: Readings on Media, Public Opinion, and Policymaking, 36, 17-26.
https://doi.org/10.1086/267990
Medford, R. J., Saleh, S. N., Sumarsono, A., Perl, T. M., & Lehmann, C. U. (2020). An
“Infodemic”: Leveraging High-Volume Twitter Data to Understand Early Public Sen-
timent for the Coronavirus Disease 2019 Outbreak. Open Forum Infectious Diseases, 7,
ofaa258. https://doi.org/10.1093/ofid/ofaa258
Mocanu, D., Rossi, L., Zhang, Q., Karsai, M., & Quattrociocchi, W. (2015). Collective At-
tention in the Age of (Mis)information. Computers in Human Behavior, 51, 1198-1204.
https://doi.org/10.1016/j.chb.2015.01.024
Nelson, L. K. (2017). Computational Grounded Theory: A Methodological Framework.
Sociological Methods & Research, 49, 3-42. https://doi.org/10.1177/0049124117729703
Oh, H. J., Hove, T., Paek, H. J., Lee, B., Lee, H., Song, S. K., Jurafsky, D. et al. (2020). Re-
cursive Deep Models for Semantic Compositionality over a Sentiment Treebank. Asian
Journal of Communication, 17, 1198-1204.
Ordun, C., Purushotham, S., & Raff, E. (2020). Exploratory Analysis of Covid-19 Tweets
Using Topic Modeling, UMAP, and DiGraphs, (March).
http://arxiv.org/abs/2005.03082
DOI: 10.4236/ajc.2021.92004 61 Advances in Journalism and CommunicationS. R. Yang et al.
Örnebring, H., & Jönsson, A. M. (2004). Tabloid Journalism and the Public Sphere: A
Historical Perspective on Tabloid Journalism. Journalism Studies, 5, 283-295.
https://doi.org/10.1080/1461670042000246052
Pang, B., & Lee, L. (2005). Seeing Stars: Exploiting Class Relationships for Sentiment Ca-
tegorization with Respect to Rating Scales. ACL-05-43rd Annual Meeting of the Asso-
ciation for Computational Linguistics, Proceedings of the Conference, Ann Arbor, June
2005, 115-124. https://doi.org/10.3115/1219840.1219855
Rameshbhai, C. J., & Paulose, J. (2019). Opinion Mining on Newspaper Headlines Using
SVM and NLP. International Journal of Electrical and Computer Engineering, 9,
2152-2163. https://doi.org/10.11591/ijece.v9i3.pp2152-2163
Scharkow, M. (2013). Thematic Content Analysis Using Supervised Machine Learning:
An Empirical Evaluation Using German Online News. Quality & Quantity, 47, 761-773.
https://doi.org/10.1007/s11135-011-9545-7
Seo, M. (2019). Amplifying Panic and Facilitating Prevention: Multifaceted Effects of
Traditional and Social Media Use during the 2015 MERS Crisis in South Korea. Jour-
nalism and Mass Communication Quarterly, 56, 837-849.
https://doi.org/10.1177/1077699019857693
Shibutani, T. (1966). Improvised News: A Sociological Study of Rumor. Improvised
News: A Sociological Study of Rumor. Oxford: Bobbs-Merrill.
Socher, R., Perelygin, A., Wu, J. Y., Chuang, J., Manning, C. D., Ng, A. Y., & Potts, C.
(2013). Recursive Deep Models for Semantic Compositionality over a Sentiment Tree-
bank. EMNLP 2013 Conference on Empirical Methods in Natural Language Processing,
Proceedings of the Conference, Washington, USA, Octorber 2003, 1631-1642.
Turney, P. D., & Pantel, P. (2010). From Frequency to Meaning : Vector Space Models of
Semantics. Journal of Artificial Intelligence Research, 37, 141-188.
https://doi.org/10.1613/jair.2934
Tweedie, F. J., & Baayen, R. H. (1998). How Variable May a Constant Be? Measures of
Lexical Richness in Perspective. Computers and the Humanities, 32, 323-352.
https://doi.org/10.1023/A:1001749303137
van der Meer, T. G. L. A., & Jin, Y. (2020). Seeking Formula for Misinformation Treat-
ment in Public Health Crises: The Effects of Corrective Information Type and Source.
Health Communication, 35, 560-575. https://doi.org/10.1080/10410236.2019.1573295
van Eck, N. J., & Waltman, L. (2010). Software Survey: VOSviewer, a Computer Program
for Bibliometric Mapping. Scientometrics, 84, 523-538.
https://doi.org/10.1007/s11192-009-0146-3
van Eck, N. J., & Waltman, L. (2013). {VOSviewer} Manual. Leiden: Univeristeit Leiden,
(November). http://www.vosviewer.com/documentation/Manual_VOSviewer_1.6.1.pdf
Yu, G. (2010). Lexical Diversity in Writing and Speaking Task Performances. Applied
Linguistics, 31, 236-259. https://doi.org/10.1093/applin/amp024
DOI: 10.4236/ajc.2021.92004 62 Advances in Journalism and CommunicationYou can also read