Aberrations of biochemical indicators in amyotrophic lateral sclerosis: a systematic review and meta-analysis
←
→
Page content transcription
If your browser does not render page correctly, please read the page content below
Cheng et al. Translational Neurodegeneration            (2021) 10:3
https://doi.org/10.1186/s40035-020-00228-9

 REVIEW                                                                                                                                            Open Access

Aberrations of biochemical indicators in
amyotrophic lateral sclerosis: a systematic
review and meta-analysis
Yangfan Cheng1,2, Yongping Chen1,2 and Huifang Shang1,2*

  Abstract
  Accumulating evidence has suggested that the pathological changes in amyotrophic lateral sclerosis (ALS) are not
  only confined to the central nervous system but also occur in the peripheral circulating system. Here, we performed
  a meta-analysis based on the PubMed, EMBASE, EBSCO, and CNKI databases, to find out biochemical indicators
  associated with energy metabolism, iron homeostasis, and muscle injury that are altered in ALS patients and their
  correlations with ALS phenotypes. Forty-six studies covering 17 biochemical indicators, representing 5454 ALS
  patients and 7986 control subjects, were included in this meta-analysis. Four indicators, including fasting blood
  glucose level (weighted mean difference [WMD] = 0.13, 95% CI [0.06–0.21], p = 0.001), serum ferritin level (WMD =
  63.42, 95% CI [48.12–78.73], p < 0.001), transferrin saturation coefficient level (WMD = 2.79, 95% CI [1.52–4.05], p <
  0.001), and creatine kinase level (WMD = 80.29, 95% CI [32.90–127.67], p < 0.001), were significantly higher in the
  ALS patients, whereas the total iron-binding capacity (WMD = − 2.42, 95% CI [− 3.93, − 0.90], p = 0.002) was
  significantly lower in ALS patients than in the control subjects. In contrast, the other 12 candidates did not show
  significant differences between ALS patients and controls. Moreover, pooled hazard ratios (HR) showed significantly
  reduced survival (HR = 1.38, 95% CI [1.02–1.88], p = 0.039) of ALS patients with elevated serum ferritin levels. These
  findings suggest that abnormalities in energy metabolism and disruption of iron homeostasis are involved in the
  pathogenesis of ALS. In addition, the serum ferritin level is negatively associated with the overall survival of ALS
  patients.
  Keywords: Amyotrophic lateral sclerosis, Biochemical indicators, Energy homeostasis, Iron metabolism, Creatinine kinase

Background                                                                            within 5 years of disease onset due to respiratory paraly-
Amyotrophic lateral sclerosis (ALS) is a relentlessly pro-                            sis [3]. The ALS etiology is unfortunately poorly
gressive paralytic disease characterized by degeneration                              understood.
of upper and lower motor neurons, which occurs follow-                                  A recent epidemiological study has shown that the
ing insidious focal weakness and spreads to most skeletal                             mean age for typical ALS disease onset is 61.8 ± 3.8
muscles, including the diaphragm [1, 2]. To date, there                               years [4], whereas the diagnosis of ALS has been re-
is no curative treatment for ALS and most patients die                                ported to be delayed for over 1 year due to the signifi-
                                                                                      cant overlap of clinical manifestations with other
* Correspondence: hfshang2002@126.com                                                 conditions in the early stages of ALS [5]. Therefore, ex-
1
 Department of Neurology, Laboratory of Neurodegenerative Disorders, Rare             ploring robust biomarkers is essential for the diagnosis
Disease Center, West China Hospital, Sichuan University, Chengdu 610041,
China
                                                                                      of ALS. Biochemical indices in the blood or cerebro-
2
 National Clinical Research Center for Geriatric, Laboratory of                       spinal fluid (CSF) are readily available compared to the
Neurodegenerative Disorders, West China Hospital, Sichuan University,                 brain tissue; they are regarded as indicators, and may
Chengdu 610041, China

                                       © The Author(s). 2021 Open Access This article is licensed under a Creative Commons Attribution 4.0 International License,
                                       which permits use, sharing, adaptation, distribution and reproduction in any medium or format, as long as you give
                                       appropriate credit to the original author(s) and the source, provide a link to the Creative Commons licence, and indicate if
                                       changes were made. The images or other third party material in this article are included in the article's Creative Commons
                                       licence, unless indicated otherwise in a credit line to the material. If material is not included in the article's Creative Commons
                                       licence and your intended use is not permitted by statutory regulation or exceeds the permitted use, you will need to obtain
                                       permission directly from the copyright holder. To view a copy of this licence, visit http://creativecommons.org/licenses/by/4.0/.
                                       The Creative Commons Public Domain Dedication waiver (http://creativecommons.org/publicdomain/zero/1.0/) applies to the
                                       data made available in this article, unless otherwise stated in a credit line to the data.
Cheng et al. Translational Neurodegeneration   (2021) 10:3                                                       Page 2 of 12

also be involved in the development of disease, thus hav-       sharing the same cohort; and (3) reviews, case reports,
ing been studied widely. Accumulating evidence has sug-         editorials, and abstracts for conferences.
gested that some indicators associated with energy
homeostasis, including glucose [6–8], lipid [9–11] and          Data extraction
protein levels [12–14], are aberrant in ALS patients.           For each study included, the following items were ex-
Moreover, abnormal iron metabolism [15–17] and cre-             tracted: publication year, author name, location of the
atinine kinase [18–20] have been reported in ALS pa-            trial, sample size, age and sex of participants (ALSs and
tients. However, these studies have not reached a               controls), and case ascertainment. Furthermore, the
consensus; thus, a systematic meta-analysis is needed to        mean and standard deviation (SD) of levels of biochem-
clarify the changes in biochemical indicators in ALS and        ical indicators, and HR with 95% CI were also extracted.
make a better prognosis.                                        Data presented in different units or other expression
   In this review, we set out to go over the literature to      forms were converted to conform to the requirements
examine if the commonly reported clinical biochemical           [22, 23].
indicators, which include total cholesterol (TC), low-
density lipoprotein (LDL), high-density lipoprotein             Statistical analysis
(HDL), triglyceride (TG), fasting blood glucose (FBG),          The mean and SD of biochemical indicator concentra-
fasting insulin, glucose in CSF, total protein in CSF,          tions were used to generate the effect size (ES) calcu-
CSF/serum albumin quotient (Qalb), serum albumin,               lated as the weighted mean difference (WMD), to
serum total protein, ferritin, transferrin, iron, total iron-   compare the differences between ALS patients and con-
binding capacity (TIBC), transferrin saturation coeffi-         trols. To eliminate the bias from healthy/disease control
cient (TSC), and creatine kinase (CK), are aberrant in          and demographics of the study populations, separate
ALS patients, and analyze their associations with patient       analyses were carried out to examine the findings more
survival.                                                       carefully. We used a pooled HR with 95% CI to evaluate
                                                                the association of blood biochemical indicators that
Methods                                                         show significant difference between ALS patients and
Literature search strategy and selection criteria               controls, with survival time. For papers that provided
Systematic review and meta-analysis was performed ac-           Kaplan-Meier survival analyses, we transformed the fig-
cording to the Preferred Reporting Items for Systematic         ure into a data sheet and used the log rank test to obtain
Review and Meta-Analyses guidelines [21]. The PubMed,           the HR and 95% CI [24]. The I2 statistic and Cochrane
EMBASE, EBSCO and CNKI databases were systematic-               Q test were used to analyze between-study heterogeneity
ally searched until January 2020, using search terms of         [25]. If I2 < 50% and p > 0.1 in the Q test, which means
“amyotrophic lateral sclerosis OR ALS OR Lou Gehrig’s           no obvious heterogeneity, the fixed-effects model was
disease” AND “cholesterol OR triglycerides OR lipid” for        used to calculate the pooled estimate. Otherwise, the
lipid metabolism, “fasting glucose OR blood glucose OR          random-effects model was used for data with substantial
blood sugar OR glycated hemoglobin A OR HbA1c OR                heterogeneity. Subgroup analysis and meta-regression
hyperglycemia OR hypoglycemia OR glycemic index” for            were conducted to explore potential sources of hetero-
glycometabolism, “albumin OR prealbumin OR pre-                 geneity. Publication bias was determined using the Egger
albumin OR globulin” for protein metabolism, “ferritin          test, as described previously [26]. To evaluate the stabil-
OR transferrin OR iron” for iron metabolism, and “creat-        ity, we also performed sensitivity analysis by omitting
ine kinase OR CK” for muscle injury. All papers were            each study in turn. All data were analyzed using STATA
reviewed for titles and abstracts. References of the rele-      (version 15.0) software. p < 0.05 was considered statisti-
vant articles were also reviewed to identify eligible           cally significant.
articles.
   The inclusion criteria for eligible articles were as fol-    Results
lows: (1) written in English or Chinese; (2) providing          Characteristics of the included studies
definite diagnostic criteria for ALS patients; (3) being a      As shown in Fig. 1, a systematic review of the literature
case-control study or a cohort study; (4) the control           identified 2803 papers from online databases. After
group included healthy controls or several other neuro-         screening titles and abstracts of these papers, 2482 pa-
logical disorders (ONDs); and (5) reporting quantitative        pers were excluded, and 321 papers were further evalu-
values of blood biochemical indicators in case-control          ated via a full-text review. After excluding articles
studies, hazard ratio (HR) with 95% confidence interval         without valid data, review articles, meta-analyses and
(CI), or figures or tables of survival analyses. The exclu-     case reports, 46 original articles were finally selected for
sion criteria were as follows: (1) studies in animals or        the meta-analysis, which covered a total of 17 biochem-
cell lines; (2) duplicate reports or different papers           ical indicators in the serum or CSF in 5454 ALS patients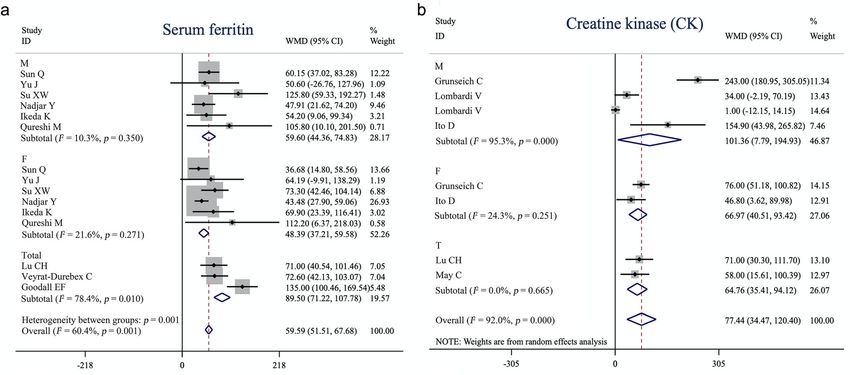
Cheng et al. Translational Neurodegeneration       (2021) 10:3                                                              Page 3 of 12

 Fig. 1 Flowchart of the literature search according to Preferred Reporting Items for Systematic Review and Meta-Analyses

and 7986 controls [8, 13, 16–18, 27–67]. Table S1 shows                    patients with ALS and controls. HDL-C was lower in
the characteristics of each study.                                         ALS patients in Asia (WMD = − 3.06, 95% CI [− 5.99,
                                                                           − 0.13], p = 0.041), but was significantly higher in the
Quantitative synthesis                                                     USA (WMD = 13.87, 95% CI [6.93–20.82], p < 0.001)
As shown in the forest plot (Fig. 2), fixed-effects meta-                  and European studies (WMD = 3.11, 95% CI [0.20–
analysis was performed to compare the FBG, TIBC, and                       6.01], p = 0.036) (Fig. 3b). Separate analyses of other
TSC between ALS patients and controls, whereas for                         indicators based on ethnicity are shown in Figure S1.
serum ferritin and CK, we applied a random-effects
model. The levels of FBG (WMD = 0.13, 95% CI [0.06–                        Investigation of heterogeneity
0.21], p = 0.001), serum ferritin (WMD = 63.42, 95% CI                     The heterogeneity analysis showed that the FBG, total
[48.12–78.73], p < 0.001), TSC (WMD = 2.79, 95% CI                         protein and glucose in CSF, TIBC, and TSC% did not
[1.52–4.05], p < 0.001), and CK (WMD = 80.29, 95% CI                       show heterogeneity among studies, while Qalb, serum
[32.90–127.67], p < 0.001) were significantly higher in                    ferritin, and serum iron presented substantial between-
the ALS patients, whereas TIBC (WMD = − 2.42, 95%                          study heterogeneity, whereas evident heterogeneity
CI [− 3.93, − 0.90], p = 0.002) was significantly lower in                 among studies was shown for TC, LDL-C, HDL-C, TG,
the ALS patients, compared to the controls (Table 1). In                   fasting insulin, serum albumin, serum total protein,
contrast, no significant difference was found in lipid me-                 serum transferrin, and CK (Table 1).
tabolism markers including TC, HDL-C, LDL-C, and                             We then explored if there were potential variables that
TG, fasting serum insulin, serum albumin, serum total                      could explain the heterogeneity. As two indicators
protein, serum transferrin, serum iron, CSF glucose, CSF                   (serum ferritin I2 = 67.6%, p = 0.001; CK I2 = 93.2%, p <
total protein and Qalb. Considering that some ONDs                         0.001) that were of statistical importance between ALS
per se are associated with peripheral biochemical                          patients and controls also showed evident heterogeneity
changes, we conducted a separate analysis based on the                     between studies as described above, they were further
control group to confirm our findings (Table 2). The                       subjected to a meta-regression and subgroup analysis.
serum transferrin level was significantly lower in ALS                       Meta-regression analysis suggested that sex (male%)
patients than in healthy controls (WMD = − 0.13, 95%                       and the mean age of ALS patients did not have a moder-
CI [− 0.17, − 0.08], p < 0.001) but not significantly differ-              ate effect on the significant association between serum
ent from that in patients with ONDs (WMD = 0.81, 95%                       ferritin levels and ALS patients. Nevertheless, meta-
CI [− 1.34, 2.96], p = 0.46) (Fig. 3a). Furthermore, by                    regression of sample size showed a significant associ-
performing a separate analysis based on ethnicity, we                      ation between sample size and WMD for studies analyz-
found ethnographic heterogeneity on HDL-C between                          ing serum ferritin (I2_res = 39.79%, regression coefficient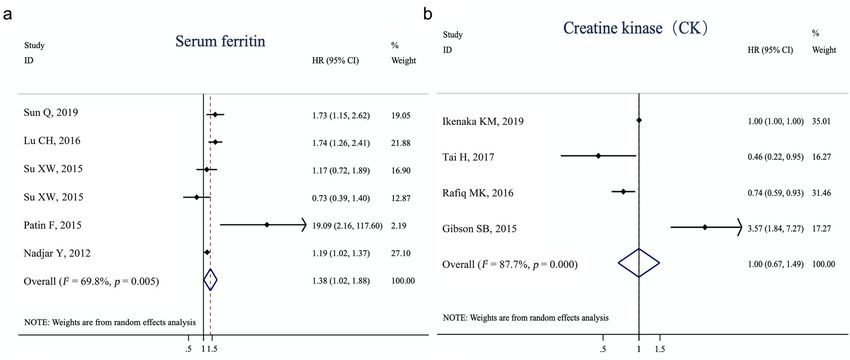
Cheng et al. Translational Neurodegeneration         (2021) 10:3                                                                           Page 4 of 12

 Fig. 2 Forest plot showing the quantitative synthesis of fasting blood glucose (a), serum ferritin (b), creatine kinase (c), transferrin saturation
 coefficient (d) and total iron binding capacity (e) in amyotrophic lateral sclerosis patients and controls. Values and the corresponding 95%
 confidence intervals of individual studies are indicated by short solid lines. The weighted mean difference (WMD) and 95% confidence intervals
 are indicated by diamonds

[SE] = − 0.10 [0.04], 95% CI [− 0.18, − 0.01], p = 0.03).                     also showed a significant association between sample
Meanwhile, sex (male%), mean age of ALS patients, and                         size and WMD for studies analyzing CK (I2_res =
disease duration did not affect the outcome of CK meta-                       80.53%, regression coefficient [SE] = 0.17 [0.05], 95% CI
analysis. Similarly, meta-regression of the sample size                       [0.05–0.28], p = 0.02).
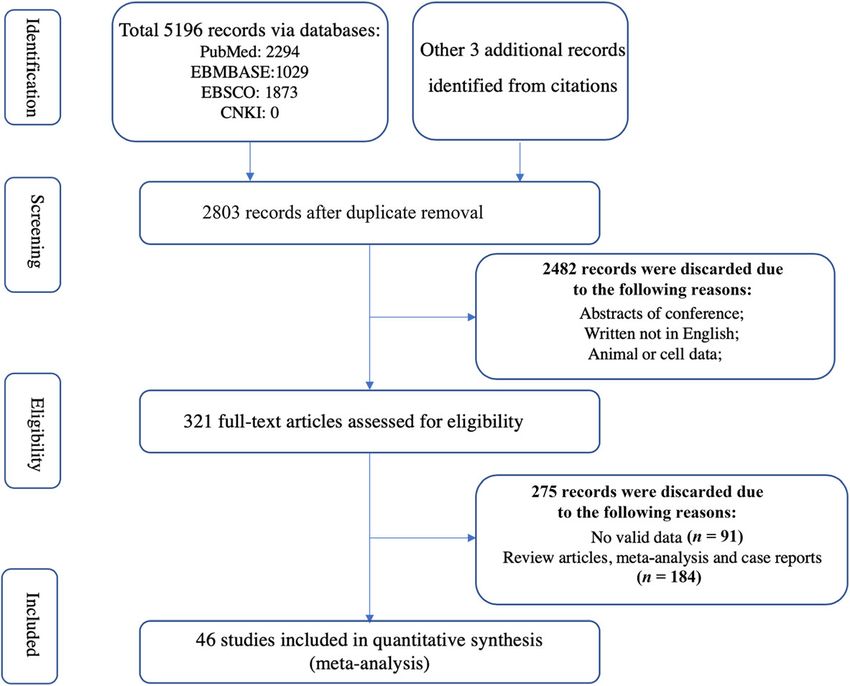
Table 1 Summary of comparative outcomes for measurements of biochemical indicators in blood and CSF
Biochemical                   No. of        No. of           Main effect                                                                        Heterogeneity                               Publication bias
indicator                     studies       ALS/
                                                             WMD         Lower 95%CI           High 95% CI         z score       p value        df        p value         I2 statistic      Egger intercept         p value
                                            controls*
Total cholesterol             17            2801/4545        4.44        −2.62                 11.50               1.23          0.22           21        < 0.001         89.40%            1.42                    0.23
                                                                                                                                                                                                                              Cheng et al. Translational Neurodegeneration

LDL-C                         13            2677/4347        0.46        −6.56                 7.47                0.13          0.90           16        < 0.001         95.10%            0.24                    0.88
HDL-C                         14            2707/4376        1.67        −0.89                 4.24                1.28          0.20           17        < 0.001         86.70%            2.57                    0.02
TG                            11            2366/2261        0.11        −9.15                 9.37                0.02          0.98           12        < 0.001         83.90%            −2.13                   0.05
Fasting blood glucose         9             301/241          0.13        0.06                  0.21                3.38          0.001          9         0.39            5.60%             0.51                    0.35
                                                                                                                                                                                                                              (2021) 10:3

Fasting insulin               6             94/88            −6.79       −29.27                15.70               0.59          0.55           6         < 0.001         89.70%            2.19                    0.59
CSF glucose                   3             132/91           0.04        −0.10                 0.18                0.54          0.59           2         0.18            41.50%            1.91                    0.56
CSF total protein             6             417/165          −1.53       −5.19                 2.12                1.31          0.19           4         0.64            0.00%             −0.11                   0.89
Qalb                          7             627/212          0.44        −0.51                 1.39                0.91          0.36           6         0.001           72.20%            −0.47                   0.72
Serum albumin                 3             630/611          −1.52       −5.53                 2.48                0.74          0.46           2         < 0.001         94.80%            5.37                    0.002
Serum total protein           3             705/690          −0.44       −1.03                 0.14                1.49          0.14           2         < 0.001         98.80%            15.64                   0.25
Serum ferritin                9             1661/1219        63.42       48.12                 78.73               8.12          < 0.001        15        0.001           67.60%            1.89                    0.06
Serum transferrin             7             1163/718         0.07        −0.58                 0.72                0.21          0.83           10        < 0.001         99.60%            −0.41                   0.96
Serum iron                    6             974/659          0.34        −0.68                 1.36                0.66          0.51           7         0.012           61.10%            −2.18                   0.15
TIBC                          3             236/304          −2.42       −3.93                 −0.90               3.12          0.002          3         0.29            19.60%            0.05                    0.99
TSC %                         3             858/486          2.79        1.52                  4.05                4.33          < 0.001        3         0.96            0                 1.02                    0.35
Creatine kinase               5             229/1843         80.29       32.90                 127.67              3.32          0.001          6         < 0.001         93.20%            5.51                    0.27
Abbreviations: ALS amyotrophic lateral sclerosis, CSF cerebrospinal fluid, df degrees of freedom, HDL-C high-density lipoprotein cholesterol, LDL-C low-density lipoprotein cholesterol, NA not available, Qalb CSF/serum
albumin quotient, TC total cholesterol, TG triglyceride, TIBC total iron binding capacity, TSC transferrin saturation coefficient, WMD weighted mean difference. * controls include healthy controls and other neurological
diseases controls
                                                                                                                                                                                                                              Page 5 of 12
Cheng et al. Translational Neurodegeneration (2021) 10:3 Page 6 of 12
Table 2 Separate analyses based on control group for comparing biochemical indicator levels in blood and CSF
Biochemical vs HC vs ONDsa
indicator
No. of No. of ALS/ WMD Lower High p No. of No. of ALS/ WMD Lower High p
studies controls 95%CI 95% CI value studies controls 95%CI 95% CI value
Total 16 2762/4479 3.98 −3.48 11.44 0.30 1 39/66 10.87 −1.22 22.96 0.08
cholesterol
LDL-C 13 2677/4347 0.46 −6.56 7.47 0.90 0 NA NA NA NA NA
HDL-C 14 2707/4376 1.67 −0.89 4.24 0.20 0 NA NA NA NA NA
TG 11 2366/2261 0.11 −9.15 9.37 0.98 0 NA NA NA NA NA
Fasting blood 8 220/204 0.13 0.05 0.21 0.001 1 81/37 0.20 −0.23 0.63 0.37
glucose
Fasting insulin 6 94/88 −6.79 −29.27 15.70 0.55 0 NA NA NA NA NA
CSF glucose 1 20/20 −0.05 −0.37 0.27 0.76 2 112/71 0.06 −0.10 0.21 0.45
CSF total 0 NA NA NA NA NA 5 312/153 −1.45 −5.13 2.24 0.44
proteinb
Qalb 1 14/20 2.00 −2.94 6.94 0.43 5 508/180 0.46 −0.55 1.47 0.37
Serum albumin 3 630/611 −1.52 −5.53 2.48 0.46 0 NA NA NA NA NA
Serum total 3 705/690 −0.44 −1.03 0.14 0.14 0 NA NA NA NA NA
protein
Serum ferritin 9 1638/1217 63.43 48.12 78.73 < 2 572/255 58.72 29.23 88.21 <
0.001 0.001
Serum 6 974/659 −0.13 −0.17 −0.08 < 2 184/83 0.81 −1.34 2.96 0.46
transferrinc 0.001a
Serum iron 6 974/659 0.34 −0.68 1.37 0.51 1 72/38 −0.49 −2.70 1.71 0.66
TIBC 3 236/304 −2.42 −3.93 −0.90 0.002 1 72/38 −1.74 −5.39 1.91 0.35
TSC % 3 858/486 2.79 1.52 4.05 < 0 NA NA NA NA NA
0.001
Creatine kinase 5 229/1843 80.29 32.90 127.67 0.001 0 NA NA NA NA NA
Abbreviations: ALS amyotrophic lateral sclerosis, CI confidence interval, CSF cerebrospinal fluid, HC healthy control, HDL-C high-density lipoprotein cholesterol, LDL-
C low-density lipoprotein cholesterol, NA not available, OND other neurological disease, Qalb CSF/serum albumin quotient, TG triglyceride, TIBC total iron-binding
capacity, TSC% transferrin saturation coefficient, WMD weighted mean difference
a
: ONDs are other neurological diseases excluding ALS-related disease. Note: only one study compared ALS with lower motor neuron disease on total protein in
CSF [Süssmuth. S. 2010]
b
: Süssmuth. S et al. compared total protein in CSF and Qalb between ALS patients and lower motor neuron disease but the results did not have statistical
significance (CSF total protein: WMD = −6.90, 95% CI [− 36.23–22.43], p = 0.65; Qalb: WMD = 2.00, 95% CI [−2.94–6.94], p = 0.47)
c
: By performing a separate analysis based on control group, serum transferrin showed a significant decrease in ALS patients compared with healthy controls
other than ONDs
For serum ferritin, subgroup analysis based on sex (n = there were significantly higher CK levels in male (n = 3,
6 studies) revealed no heterogeneity among studies either WMD = 101.36, 95% CI [7.79–194.93], p = 0.03) and fe-
in males (Q = 5.57, I2 = 10.3%, p = 0.35) or in females (Q male (n = 2, WMD = 66.97, 95% CI [40.51–93.42], p <
= 6.38, I2 = 21.6%, p = 0.271) (Fig. 4a), and ferritin was sig- 0.001) ALS patients. However, the between-study hetero-
nificantly elevated in both male (WMD = 59.60, 95% CI geneity was increased in the male group (Q = 63.38, I2 =
[44.36–74.83], p < 0.001) and female (WMD = 48.39, 95% 95.3%, p < 0.001), and decreased in the female group (n =
CI [37.21–59.58], p < 0.001) ALS patients compared with 2, Q = 1.32, I2 = 24.3%, p = 0.251) (Fig. 4b).
that in sex-matched controls. In addition, after stratifying
studies into the large sample group (sample size greater Potential publication bias assessment and sensitivity
than average) and the small sample group (sample size less analysis
than the average), the heterogeneity was reduced to I2 < Sensitivity analysis demonstrated that the pooled WMDs
50% (large sample group: Q = 13.25, I2 = 47.2%, p = 0.07; of FBG, ferritin, TIBS, TBC%, and CK were stable, which
small sample group: Q = 11.37, I2 = 47.2%, p = 0.08). Both indicated that the results were not affected by any single
the large (n = 8, WMD = 53.85, 95% CI [45.07–62.64], p study. Furthermore, Egger’s test showed that there was
< 0.001) and small sample groups (n = 7, WMD = 59.59, no risk of publication bias among studies analyzing FBG,
95% CI [51.51–67.68], p < 0.001) showed increased levels ferritin, TIBS, TBC%, and CK indicators in ALS
of serum ferritin in ALS patients. Compared with controls, (Table 1).Cheng et al. Translational Neurodegeneration (2021) 10:3 Page 7 of 12 Fig. 3 Forest plot showing separate analysis of serum transferrin based on control type (a) and high-density lipoprotein cholesterol based on ethnicity (b). Values and the corresponding 95% confidence intervals of individual studies are indicated by short solid lines. The weighted mean difference (WMD) and 95% confidence intervals are indicated by diamonds Association analysis model was used because there was substantial hetero- Among the studies included in the meta-analysis, five geneity among the studies related to ferritin (Q[df=5] = studies underwent a survival analysis of serum ferritin 16.56, I2 = 69.8%, p = 0.005). The pooled HR suggested levels and four studies underwent a survival analysis of significantly reduced survival (HR = 1.38, 95% CI [1.02– CK levels in ALS patients. Given that their conclusions 1.88], p= 0.04) of ALS patients with elevated serum fer- were not consistent, we then conducted a meta-analysis ritin levels, whereas CK levels did not affect the survival of the association of high vs. low levels of ferritin and of patients with ALS (HR = 1.00, 95% CI [0.67–1.49], p= CK with the overall survival of ALS patients. The associ- 0.99). No publication bias was identified in the Egger test ations between serum ferritin or CK levels and survival (serum ferritin: Egger intercept = 1.35, p > 0.34; CK: are shown in the forest plot (Fig. 5). The random-effects Egger intercept = − 0.036, p > 0.87). The characteristics Fig. 4 Forest plot showing subgroup analysis of serum ferritin (a) and creatine kinase (b) based on sex. M: male group, F: female group, Total: combined male and female patients. Values and the corresponding 95% confidence intervals of individual studies are indicated by short solid lines. The weighted mean difference (WMD) and 95% confidence intervals are indicated by diamonds
Cheng et al. Translational Neurodegeneration         (2021) 10:3                                                                            Page 8 of 12

 Fig. 5 Forest plot showing associations of serum ferritin (a) and creatine kinase (b) levels with the overall survival in ALS patients. Pooled hazard
 ratios (HR) suggest significantly reduced survival in ALS patients with elevated serum ferritin, whereas creatine kinase levels did not play a
 significant role in the survival of ALS patients. Ratios and the corresponding 95% confidence intervals of studies are indicated by short solid lines.
 The averaged ratios and 95% confidence intervals are indicated by diamonds

and summary statistics of studies included in the meta-                       significantly lower in ALS patients than in healthy con-
analysis of survival are provided in Tables S2−S3.                            trols, suggesting that the disruption of iron homeostasis
  The number of studies which showed precise bio-                             is involved in the pathophysiological process of ALS
chemical values and survival analysis on FBG (n = 1),                         [69]. Ferritin as a marker of body iron storage plays a
TSC (n = 0), and TIBC (n = 0) was not sufficient for                          role in iron sequestration where it functions as a ferroxi-
meta-analysis; therefore, we did not perform meta-                            dase, converting Fe2+ to Fe3+ as iron is internalized and
analysis on the associations of the three indicators with                     sequestered in the ferritin mineral core [70, 71]. As fer-
patient survival.                                                             ritin can prevent iron from generating reactive oxygen
                                                                              species, it is considered to have an anti-oxidative cellular
Discussion                                                                    function [72, 73]. Under chronic inflammatory condi-
In this meta-analysis study, we compared 17 biochemical                       tions, the ferritin levels are increased and TIBC, which is
indicators between 5454 ALS patients and 7986 control                         a measure of total serum transferrin (apotransferrin,
subjects from 46 original studies, and found evidence of                      monotransferrin, and diferric transferrin), could be de-
significantly higher FBG, ferritin, TSC and CK, and sig-                      creased [74]. Therefore, the disruption of iron homeosta-
nificantly lower TIBC in ALS patients than in controls.                       sis might be the result of immune system activation [75],
Only FBG presented a small ES (0 < ES < 1), while the                         which is considered as one of the pathogeneses of ALS.
other four indicators showed results associated with a                        TSC is often elevated in patients with HFE-linked
large ES (ES > 1). In addition, within the five ALS-linked                    hemochromatosis, while the H63D HFE gene poly-
indicators, we found that the elevated serum ferritin                         morphism is considered as a risk factor for ALS [55, 76,
levels were associated with reduced survival in patients                      77]. Moreover, some imaging studies [78, 79] have sug-
with ALS. Sensitivity analysis indicated that the findings                    gested that ALS patients may be affected by iron over-
on FBG, ferritin, TIBC, TSC and CK in the ALS patients                        load. Our meta-analysis showed a negative association
would not be affected by any single study included, sug-                      between serum ferritin levels and survival in ALS pa-
gesting the robustness of these results.                                      tients. Previous studies [80–82] have shown that the
  The difference in these clinical biochemical indicators                     conservative iron chelation therapy may potentially serve
between ALS patients and controls suggests that ALS is                        as a treatment option to reduce iron accumulation and
a multi-systemic disease with motor neuron degener-                           improve prognosis in ALS patients. Furthermore, our
ation, rather than a restricted central nervous system                        meta-analysis of survival data suggested the predictive
disorder [68]. Among the five ALS-associated indicators                       role of serum ferritin in disease prognosis; thus, the fer-
identified in the meta-analysis, three are related to iron                    ritin level could be used as a tool to stratify patients in
metabolism. In addition, the serum transferrin level was                      clinical trials. However, it remains to clarify whether the
Cheng et al. Translational Neurodegeneration (2021) 10:3 Page 9 of 12 disruption of iron homeostasis is a cause or a conse- ethnicity may have an effect on the ALS phenotype. To quence of ALS development, why ALS patients have in- our knowledge, this is the first report of the creased iron body storage and how it relates to phenomenon of HDL-C. More research is needed to decreased survival. Further studies are needed to address confirm this result. these questions. The difference between the current Heterogeneity analysis using the I2 statistic and meta-analysis and the previous one [83] was that we Cochrane Q test showed that the between-study hetero- conducted a more comprehensive literature search that geneity of the 17 biochemical indicators varied from zero included more studies, with some inconsistent results, to high. Among the five indicators identified as associ- and that we analyzed the association between ALS pa- ated with ALS, only serum ferritin and CK showed tients and survival time and found a negative correlation medium to high heterogeneity among studies. Therefore, between ferritin level and the overall survival. we performed meta-regression analysis and subgroup Regarding the elevation of CK levels in ALS patients, analysis of these two indicators to explore confounders Ito found that the serum CK was elevated not only in of the between-study heterogeneity. Meta-regression the early stages of ALS but also before its onset, analysis suggested that the outcomes of both serum fer- achieved a maximum level around onset, and then de- ritin and CK might be influenced by the sample size, but clined after onset [18]. The pathophysiological mecha- not by other potential factors including sex (male%) and nisms underlying this phenomenon might be the muscle mean age of ALS patients. Due to the lack of complete cramp or active muscle denervation leading to the eleva- data on disease duration in studies involving serum fer- tion of serum CK [84]. In addition, a study has reported ritin, we only conducted the meta-regression analysis on denervation-induced membrane instability in muscle tis- disease duration for CK, and found no influence of dis- sue and leakage of CK into the blood [85]. Hence, it is ease duration on the result. Therefore, the sample size of reasonable to suggest that the elevation of serum CK in each study investigating serum ferritin and CK is one of ALS is caused by membrane instability or the destruc- the sources of heterogeneity, as partially confirmed by tion of muscle tissue due to the denervation and hyper- subgroup analysis of serum ferritin stratified by sample excitability of motor neurons [18]. Regarding the size. Subgroup analysis of serum ferritin stratified by sex increase in FBG, there might be impaired control of fast- not only reduced the heterogeneity between studies but ing glucose levels and dysfunction of the glucose-insulin also consistently revealed a significant association of fer- axis in patients with ALS. Considering the absence of ritin with ALS, suggesting that sex was the second con- beta cell dysfunction, fasting insulin levels and HbA1c founder of heterogeneity. Interestingly, Sun et al. [31] did not significantly differ between ALS patients and also found different distribution of serum ferritin in controls, suggesting no evidence of insulin resistance male and female patients with multiple system atrophy. [86], which is not consistent with our previous original For CK, despite the evident association in subgroup ana- study [6]. The potential mechanism underlying the ele- lysis based on sex, the between-study heterogeneity in vation of FBG may be the chronic oxidative stress result- male patients remained high, while the heterogeneity in ing from higher energy expenditure than intake in female patients decreased significantly, suggesting that patients with ALS [68]. That is to say, some ALS pa- sex might be a confounder of between-study heterogen- tients with bulbar paralysis leading to dysphagia and an eity for CK. increase in resting energy expenditure [87–89] develop There were some limitations in this study. First, some hypometabolism due to the denervation-linked muscle studies included in this analysis did not provide informa- wasting. Long-term hypometabolism can activate tion on disease duration or disease status, which pre- chronic oxidative stress [90]. Therefore, the elevation of vented us from performing a subgroup analysis of FBG levels is related to the oxidative stress, which also whether the differences in these indicators were associ- participates in the development of ALS. However, as de- ated with disease duration or severity. Second, we did scribed in our previous study [6], the FBG test is an ex- not find indicators linked with energy metabolism in the cellent test for the “in the moment” glucose level, which, CSF between patients with ALS and control subjects. however, provides limited information on the trend of Due to the hypothesis that CSF is a window to the brain, glucose level change over time. This is a limitation of more biochemical indicators in the CSF should be inves- our meta-analysis as there was not enough data on tigated in further studies. Third, we did not perform HbA1c or postprandial blood glucose hours after eating meta-analysis on the associations of FBG, TSC and TIBC a meal, preventing us from evaluating changes in glucose with survival due to the limited number of studies. Last, level over time in ALS patients compared with that in none of the biomarkers discussed in this meta-analysis controls. Regarding the interesting finding of ethno- are specific to ALS, and thus do not have potential use graphic heterogeneity of HDL-C difference between ALS as diagnostic markers. Therefore, the indicators identi- patients and controls, we suppose that the patient fied in our study should be confirmed in the future.
Cheng et al. Translational Neurodegeneration               (2021) 10:3                                                                                Page 10 of 12

   In conclusion, the findings of our meta-analysis re-                              Consent for publication
vealed elevated FBG, ferritin, TSC, and CK levels and                                Not applicable.

decreased TIBC in patients with ALS. In addition, the
                                                                                     Competing interests
serum ferritin level was negatively associated with the                              The authors declare that they have no competing interests.
overall survival of patients with ALS. These results pro-
vide further evidence that abnormalities in energy me-                               Received: 9 October 2020 Accepted: 23 December 2020

tabolism, disruption of iron homeostasis caused by
oxidative stress, and abnormal immune activation par-                                References
ticipate in the pathophysiological process of ALS. Fur-                              1. Kiernan MC, Vucic S, Cheah BC, Turner MR, Eisen A, Hardiman O, et al.
ther studies are required to address whether these                                       Amyotrophic lateral sclerosis. Lancet. 2011;377(9769):942–55.
                                                                                     2. Brown RH, Al-Chalabi A. Amyotrophic lateral sclerosis. N Engl J Med. 2017;
abnormalities are causes or consequences of ALS devel-                                   377(2):162–72.
opment and how they influence ALS. More studies are                                  3. Rothstein JD. Current hypotheses for the underlying biology of amyotrophic
needed to translate the treatment potential of conserva-                                 lateral sclerosis. Ann Neurol. 2009;65(Suppl 1):S3–9.
                                                                                     4. Chiò A, Logroscino G, Traynor BJ, Collins J, Simeone JC, Goldstein LA, et al.
tive iron chelation to benefit ALS patients.                                             Global epidemiology of amyotrophic lateral sclerosis: a systematic review of
                                                                                         the published literature. Neuroepidemiology. 2013;41(2):118–30.
Supplementary Information                                                            5. Andersen PM, Abrahams S, Borasio GD, de Carvalho M, Chio A, Van Damme
The online version contains supplementary material available at https://doi.             P, et al. EFNS guidelines on the clinical management of amyotrophic lateral
org/10.1186/s40035-020-00228-9.                                                          sclerosis (MALS)--revised report of an EFNS task force. Eur J Neurol. 2012;
                                                                                         19(3):360–75.
                                                                                     6. Qian-Qian W, Yongping C, Bei C, Ru Wei O, Lingyu Z, Yanbing H, et al.
 Additional file 1: Table S1. Characteristics of included studies                        Blood hemoglobin A1c levels and amyotrophic lateral sclerosis survival. Mol
 measuring biochemical indicator levels in blood and CSF. Table S2.                      Neurodegener. 2017;12:1–7.
 Characteristics and summary statistics of studies showing the association           7. Mariosa D, Hammar N, Malmström H, Ingre C, Jungner I, Ye W, et al. Blood
 of serum ferritin with survival in ALS patients. Table S3. Characteristics              biomarkers of carbohydrate, lipid, and apolipoprotein metabolisms and risk
 and summary statistics of studies showing the association of creatine                   of amyotrophic lateral sclerosis: a more than 20-year follow-up of the
 kinase with survival in ALS patients.                                                   Swedish AMORIS cohort. Ann Neurol. 2017;81(5):718–28.
 Additional file 2: Fig. S1. Forest plot showing separate analysis of total          8. Pradat PF, Bruneteau G, Gordon PH, Dupuis L, Bonnefont-Rousselot D,
 cholesterol, low-density lipoprotein cholesterol, triglyceride, fasting blood           Simon D, et al. Impaired glucose tolerance in patients with amyotrophic
 glucose, fasting insulin, CSF glucose, CSF total protein, Qalb, serum albu-             lateral sclerosis. Amyotroph Lateral Scler. 2010;11(1–2):166–71.
 min, serum total protein, serum ferritin, serum transferrin, serum iron,            9. González De Aguilar JL. Lipid biomarkers for amyotrophic lateral sclerosis.
 total iron binding capacity, transferrin saturation coefficient and creatine            Front Neurol. 2019;10:284.
 kinase based on ethnicity, respectively. Values and the corresponding               10. Chen X, Yazdani S, Piehl F, Magnusson PKE, Fang F. Polygenic link between
 95% confidence intervals of individual studies are indicated by short solid             blood lipids and amyotrophic lateral sclerosis. Neurobiol Aging. 2018;67:202
 lines. The weighted mean difference (WMD) and 95% confidence intervals                  e1-.e6.
 are indicated by diamonds.                                                          11. Abdel-Khalik J, Yutuc E, Crick PJ, Gustafsson J, Warner M, Roman G, et al.
                                                                                         Defective cholesterol metabolism in amyotrophic lateral sclerosis. J Lipid
                                                                                         Res. 2017;58(1):267–78.
Abbreviations                                                                        12. Chio A, Calvo A, Bovio G, Canosa A, Bertuzzo D, Galmozzi F, et al.
ALS: Amyotrophic lateral sclerosis; CI: Confidence interval; CK: Creatine kinase;        Amyotrophic lateral sclerosis outcome measures and the role of albumin
CSF: Cerebrospinal fluid; ES: Effective size; HDL: High-density lipoprotein;             and creatinine: a population-based study. JAMA Neurol. 2014;71(9):1134–42.
HR: Hazard ratios; LDL: Low-density lipoprotein; NDDs: Neurodegenerative             13. Chen X, Wei QQ, Chen Y, Cao B, Ou R, Hou Y, et al. Clinical disease stage
diseases; Qalb: CSF/serum albumin quotient; SD: Standard deviation; TC: Total            related changes of serological factors in amyotrophic lateral sclerosis.
cholesterol; TG: Triglyceride; TIBC: Total iron-binding capacity; TSC: Transferrin       Amyotroph Lateral Scler Frontotemporal Degener. 2019;20(1–2):53–60.
saturation coefficient; WMD: Weighted mean difference                                14. Mandrioli J, Rosi E, Fini N, Fasano A, Raggi S, Fantuzzi A, et al. Changes in
                                                                                         routine laboratory tests and survival in amyotrophic lateral sclerosis. Neurol
Acknowledgements                                                                         Sci. 2017;38(12):2177–82.
We would like to thank all authors of the original research studies included         15. Masaldan S, Bush AI, Devos D, Rolland AS, Moreau C. Striking while the iron
in this meta-analysis. We thank Dr. Yang Zhang from Department of Neuro-                 is hot: Iron metabolism and ferroptosis in neurodegeneration. Free Radic
surgery, West China Hospital for help with software issues and English                   Biol Med. 2019;133:221–33.
writing.                                                                             16. Zheng Y, Gao L, Wang D, Zang D. Elevated levels of ferritin in the
                                                                                         cerebrospinal fluid of amyotrophic lateral sclerosis patients. Acta Neurol
Authors’ contributions                                                                   Scand. 2017;136(2):145–50.
YPC and HS designed the whole study and gave suggestions on revising the             17. Lu CH, Allen K, Oei F, Leoni E, Kuhle J, Tree T, et al. Systemic inflammatory
article. YFC searched and selected the studies, analyzed the data, drafted and           response and neuromuscular involvement in amyotrophic lateral sclerosis.
revised the article. YPC prepared figures. All authors read and approved the             Neurol Neuroimmunol Neuroinflamm. 2016;3(4):e244.
final manuscript.                                                                    18. Ito D, Hashizume A, Hijikata Y, Yamada S, Iguchi Y, Iida M, et al. Elevated
                                                                                         serum creatine kinase in the early stage of sporadic amyotrophic lateral
Funding                                                                                  sclerosis. J Neurol. 2019;266(12):2952–61.
This meta-analysis was supported by the National Key Research and Develop-           19. Andrés-Benito P, Moreno J, Domínguez R, Aso E, Povedano M, Ferrer I.
ment Program of China (2016YFC0901504).                                                  Inflammatory gene expression in whole peripheral blood at early stages of
                                                                                         sporadic amyotrophic lateral sclerosis. Front Neurol. 2017;8:546.
Availability of data and materials                                                   20. Wendt S, Dedeoglu A, Speer O, Wallimann T, Beal MF, Andreassen OA.
All data generated or analyzed during this study are included in this article            Reduced creatine kinase activity in transgenic amyotrophic lateral sclerosis
and its supplementary materials.                                                         mice. Free Radic Biol Med. 2002;32(9):920–6.
                                                                                     21. Moher D, Liberati A, Tetzlaff J, Altman DG. Preferred reporting items for
Ethics approval and consent to participate                                               systematic reviews and meta-analyses: the PRISMA statement. PLoS Med.
Not applicable.                                                                          2009;6(7):e1000097.
Cheng et al. Translational Neurodegeneration (2021) 10:3 Page 11 of 12
22. Wan X, Wang W, Liu J, Tong T. Estimating the sample mean and standard homeostasis in ALS. Evidence against the hypothesis that elevated 27-
deviation from the sample size, median, range and/or interquartile range. hydroxycholesterol is a pathogenic factor. PLoS One. 2014;9(11):e113619.
BMC Med Res Methodol. 2014;14:135. 45. Wills AM, Hubbard J, Macklin EA, Glass J, Tandan R, Simpson EP, et al.
23. Higgins JP, Thomas J, Chandler J, Cumpston M, Li T, Page MJ, et al. Cochrane Hypercaloric enteral nutrition in patients with amyotrophic lateral sclerosis:
Handbook for Systematic Reviews of Interventions. Hoboken: Wiley; 2019. a randomised, double-blind, placebo-controlled phase 2 trial. Lancet. 2014;
https://onlinelibrary.wiley.com/doi/abs/10.1002/9781119536604.ch12. 383(9934):2065–72.
24. Tierney JF, Stewart LA, Ghersi D, Burdett S, Sydes MR. Practical methods 46. Huang R, Guo X, Chen X, Zheng Z, Wei Q, Cao B, et al. The serum lipid
for incorporating summary time-to-event data into meta-analysis. Trials. profiles of amyotrophic lateral sclerosis patients: a study from south-West
2007;8:16. China and a meta-analysis. Amyotroph Lateral Scler Frontotemporal
25. Mittlböck M, Heinzl H. A simulation study comparing properties of Degener. 2015;16(5–6):359–65.
heterogeneity measures in meta-analyses. Stat Med. 2006;25(24):4321–33. 47. Blasco HPP, Nadal-Desbarats LP, Pradat P-FMDP, Gordon PHMDP, Antar C, Veyrat-
26. Irwig L, Macaskill P, Berry G, Glasziou P. Bias in meta-analysis detected by a Durebex CP, et al. Untargeted 1H-NMR metabolomics in CSF: toward a
simple, graphical test. Graphical test is itself biased. BMJ. 1998;316(7129):470 diagnostic biomarker for motor neuron disease. Neurology. 2014;82(13):1167–74.
author reply 470-1. 48. Veyrat-Durebex C, Corcia P, Mucha A, Benzimra S, Mallet C, Gendrot C, et al.
27. Wu Y, Yang X, Li X, Wang H, Wang T. Elevated cerebrospinal fluid Iron metabolism disturbance in a French cohort of ALS patients. Biomed
homocysteine is associated with blood-brain barrier disruption in Res Int. 2014;2014:485723.
amyotrophic lateral sclerosis patients. Neurol Sci. 2020;41(7):1865–72. 49. Yang JW, Kim SM, Kim HJ, Kim JE, Park KS, Kim SH, et al. Hypolipidemia in
28. Grunseich C, Patankar A, Amaya J, Watts JA, Li D, Ramirez P, et al. Clinical patients with amyotrophic lateral sclerosis: a possible gender difference? J
and molecular aspects of senataxin mutations in amyotrophic lateral Clin Neurol. 2013;9(2):125–9.
sclerosis 4. Ann Neurol. 2020;87(4):547–55. 50. Ticozzi N, Tiloca C, Mencacci NE, Morelli C, Doretti A, Rusconi D, et al.
29. Costa J, Streich L, Pinto S, Pronto-Laborinho A, Nimtz M, Conradt HS, et al. Oligoclonal bands in the cerebrospinal fluid of amyotrophic lateral sclerosis
Exploring cerebrospinal fluid igg n-glycosylation as potential biomarker for patients with disease-associated mutations. J Neurol. 2013;260(1):85–92.
amyotrophic lateral sclerosis. Mol Neurobiol. 2019;56(8):5729–39. 51. Ikeda K, Hirayama T, Takazawa T, Kawabe K, Iwasaki Y. Relationships
30. Ikenaka KMDP, Atsuta NMDP, Maeda YP, Hotta YP, Nakamura RMDP, Kawai between disease progression and serum levels of lipid, urate, creatinine and
KP, et al. Increase of arginine dimethylation correlates with the progression ferritin in Japanese patients with amyotrophic lateral sclerosis: a cross-
and prognosis of ALS. Neurology. 2019;92(16):e1868–e77. sectional study. Intern Med. 2012;51(12):1501–8.
31. Sun Q, Yang F, Wang H, Cui F, Li Y, Li S, et al. Elevated serum ferritin level as 52. Nadjar Y, Gordon P, Corcia P, Bensimon G, Pieroni L, Meininger V, et al.
a predictor of reduced survival in patients with sporadic amyotrophic lateral Elevated serum ferritin is associated with reduced survival in amyotrophic
sclerosis in China: a retrospective study. Amyotroph Lateral Scler lateral sclerosis. PLoS One. 2012;7(9):1–6.
Frontotemporal Degener. 2019;20(3–4):186–91. 53. Sutedja NA, van der Schouw YT, Fischer K, Sizoo EM, Huisman MH, Veldink
32. Lombardi V, Querin G, Ziff OJ, Zampedri L, Martinelli I, Heller C, et al. Muscle JH, et al. Beneficial vascular risk profile is associated with amyotrophic lateral
and not neuronal biomarkers correlate with severity in spinal and bulbar sclerosis. J Neurol Neurosurg Psychiatry. 2011;82(6):638–42.
muscular atrophy. Neurology. 2019;92(11):e1205–e11. 54. Süssmuth SD, Sperfeld AD, Ludolph AC, Tumani H. Hypercapnia is a
33. Barros A, Dourado MET Jr, Pedrosa LFC, Leite-Lais L. Association of copper possible determinant of the function of the blood-cerebrospinal fluid barrier
status with lipid profile and functional status in patients with amyotrophic in amyotrophic lateral sclerosis. Neurochem Res. 2010;35(7):1071–4.
lateral sclerosis. J Nutr Metab. 2018;2018:5678698. 55. Mitchell RM, Simmons Z, Beard JL, Stephens HE, Connor JR. Plasma
34. Rossi D, Volanti P, Brambilla L, Colletti T, Spataro R, La Bella V. CSF biomarkers associated with ALS and their relationship to iron homeostasis.
neurofilament proteins as diagnostic and prognostic biomarkers for Muscle Nerve. 2010;42(1):95–103.
amyotrophic lateral sclerosis. J Neurol. 2018;265(3):510–21. 56. Chio A, Calvo A, Ilardi A, Cavallo E, Moglia C, Mutani R, et al. Lower serum
35. Kułakowska A, Tarasiuk J, Kapica-Topczewska K, Chorąży M, Pogorzelski R, lipid levels are related to respiratory impairment in patients with ALS.
Kulczyńska-Przybik A, et al. Pathophysiological implications of actin-free Gc- Neurology. 2009;73(20):1681–5.
globulin concentration changes in blood plasma and cerebrospinal fluid 57. Dupuis L, Corcia P, Fergani A, De Aguilar JL, Bonnefont-Rousselot D, Bittar R,
collected from patients with Alzheimer's disease and other neurological et al. Dyslipidemia is a protective factor in amyotrophic lateral sclerosis.
disorders. Adv Clin Exp Med. 2018;27(8):1075–80. Neurology. 2008;70(13):1004–9.
36. Yu J, Wang N, Qi F, Wang X, Zhu Q, Lu Y, et al. Serum ferritin is a candidate 58. Qureshi M, Brown RH Jr, Rogers JT, Cudkowicz ME. Serum ferritin and metal
biomarker of disease aggravation in amyotrophic lateral sclerosis. Biomed levels as risk factors for amyotrophic lateral sclerosis. Open Neurol J. 2008;2:
Rep. 2018;9(4):333–8. 51–4.
37. Kim SM, Noh MY, Kim H, Cheon SY, Lee KM, Lee J, et al. 25- 59. Goodall EF, Haque MS, Morrison KE. Increased serum ferritin levels in
Hydroxycholesterol is involved in the pathogenesis of amyotrophic lateral amyotrophic lateral sclerosis (ALS) patients. J Neurology. 2008;255(11):1652–6.
sclerosis. Oncotarget. 2017;8(7):11855–67. 60. Sohmiya M, Tanaka M, Suzuki Y, Tanino Y, Okamoto K, Yamamoto Y. An
38. Delaye JB, Patin F, Piver E, Bruno C, Vasse M, Vourc'h P, et al. Low IDL-B and increase of oxidized coenzyme Q-10 occurs in the plasma of sporadic ALS
high LDL-1 subfraction levels in serum of ALS patients. J Neurol Sci. 2017; patients. J Neurol Sci. 2005;228(1):49–53.
380:124–7. 61. Yushchenko M, Weber F, Mäder M, Schöll U, Maliszewska M, Tumani H, et al.
39. Nagase M, Yamamoto Y, Miyazaki Y, Yoshino H. Increased oxidative stress in Matrix metalloproteinase-9 (MMP-9) in human cerebrospinal fluid (CSF):
patients with amyotrophic lateral sclerosis and the effect of edaravone elevated levels are primarily related to CSF cell count. J Neuroimmunol.
administration. Redox Rep. 2016;21(3):104–12. 2000;110(1–2):244–51.
40. Feneberg E, Steinacker P, Volk AE, Weishaupt JH, Wollmer MA, Boxer A, et al. 62. Ludolph AC, Langen KJ, Regard M, Herzog H, Kemper B, Kuwert T, et al.
Progranulin as a candidate biomarker for therapeutic trial in patients with Frontal lobe function in amyotrophic lateral sclerosis: a
ALS and FTLD. J Neural Transm (Vienna). 2016;123(3):289–96. neuropsychologic and positron emission tomography study. Acta
41. Henriques A, Blasco H, Fleury MC, Corcia P, Echaniz-Laguna A, Robelin L, Neurol Scand. 1992;85(2):81–9.
et al. Blood cell palmitoleate-palmitate ratio is an independent prognostic 63. Harris MD, Davidson MB, Rosenberg CS. Insulin antagonism is not a primary
factor for amyotrophic lateral sclerosis. PLoS One. 2015;10(7):e0131512. abnormality of amyotrophic lateral sclerois but is related to disease severity.
42. Su XW, Clardy SL, Stephens HE, Simmons Z, Connor JR. Serum ferritin is J Clin Endocrinol Metab. 1986;63(1):41–6.
elevated in amyotrophic lateral sclerosis patients. Amyotroph Lateral Scler 64. Jockers-Wretou E, Vassilopoulos D. Serum creatine kinase B subunit levels in
Frontotemporal Degener. 2015;16(1/2):102–7. neurogenic atrophies. J Neurol. 1985;232(4):236–9.
43. May C, Nordhoff E, Casjens S, Turewicz M, Eisenacher M, Gold R, et al. Highly 65. Reyes ET, Perurena OH, Festoff BW, Jorgensen R, Moore WV. Insulin
immunoreactive IgG antibodies directed against a set of twenty human resistance in amyotrophic lateral sclerosis. J Neurol Sci. 1984;63(3):317–24.
proteins in the sera of patients with amyotrophic lateral sclerosis identified 66. Murai A, Miyahara T, Tanaka T, Kaneko T, Sako Y, Kameyama M.
by protein array. PLoS One. 2014;9(2):e89596. Abnormalities of lipoprotein and carbohydrate metabolism in degenerative
44. Wuolikainen A, Acimovic J, Lövgren-Sandblom A, Parini P, Andersen PM, diseases of the nervous system--motor neuron disease and spinocerebellar
Björkhem I. Cholesterol, oxysterol, triglyceride, and coenzyme Q degeneration. Tohoku J Exp Med. 1983;139(4):365–76.Cheng et al. Translational Neurodegeneration (2021) 10:3 Page 12 of 12
67. Moxley RT, Griggs RC, Forbes GB, Goldblatt D, Donohoe K. Influence of 90. Daulatzai MA. Cerebral hypoperfusion and glucose hypometabolism: key
muscle wasting on oral glucose tolerance testing. Clin Sci (Lond). 1983; pathophysiological modulators promote neurodegeneration, cognitive
64(6):601–9. impairment, and Alzheimer's disease. J Neurosci Res. 2017;95(4):943–72.
68. Dupuis L, Pradat PF, Ludolph AC, Loeffler JP. Energy metabolism in
amyotrophic lateral sclerosis. Lancet Neurol. 2011;10(1):75–82.
69. Kim Y, Connor JR. The roles of iron and HFE genotype in neurological
diseases. Mol Asp Med. 2020;75:100867.
70. Knovich MA, Storey JA, Coffman LG, Torti SV, Torti FM. Ferritin for the
clinician. Blood Rev. 2009;23(3):95–104.
71. Singh AV, Vyas V, Montani E, Cartelli D, Parazzoli D, Oldani A, et al.
Investigation of in vitro cytotoxicity of the redox state of ionic iron in
neuroblastoma cells. J Neurosci Rural Pract. 2012;3(3):301–10.
72. Arosio P, Levi S. Ferritin, iron homeostasis, and oxidative damage. Free Radic
Biol Med. 2002;33(4):457–63.
73. Sheykhansari S, Kozielski K, Bill J, Sitti M, Gemmati D, Zamboni P, et al.
Redox metals homeostasis in multiple sclerosis and amyotrophic lateral
sclerosis: a review. Cell Death Dis. 2018;9(3):348.
74. Kell DB, Pretorius E. Serum ferritin is an important inflammatory disease
marker, as it is mainly a leakage product from damaged cells. Metallomics.
2014;6(4):748–73.
75. Ganz T, Nemeth E. Iron homeostasis in host defence and inflammation. Nat
Rev Immunol. 2015;15(8):500–10.
76. Tisato V, Zuliani G, Vigliano M, Longo G, Franchini E, Secchiero P, et al.
Gene-gene interactions among coding genes of iron-homeostasis proteins
and APOE-alleles in cognitive impairment diseases. PLoS One. 2018;13(3):
e0193867.
77. Gemmati D, Zeri G, Orioli E, De Gaetano FE, Salvi F, Bartolomei I, et al.
Polymorphisms in the genes coding for iron binding and transporting
proteins are associated with disability, severity, and early progression in
multiple sclerosis. BMC Med Genet. 2012;13:70.
78. Acosta-Cabronero J, Machts J, Schreiber S, Abdulla S, Kollewe K, Petri S,
et al. Quantitative susceptibility MRI to detect brain iron in amyotrophic
lateral sclerosis. Radiology. 2018;289(1):195–203.
79. Adachi Y, Sato N, Saito Y, Kimura Y, Nakata Y, Ito K, et al. Usefulness of SWI
for the detection of iron in the motor cortex in amyotrophic lateral
sclerosis. J Neuroimaging. 2015;25(3):443–51.
80. Golko-Perez S, Amit T, Bar-Am O, Youdim MB, Weinreb O. A novel iron
chelator-radical scavenger ameliorates motor dysfunction and improves life
span and mitochondrial biogenesis in SOD1(G93A) ALS mice. Neurotox Res.
2017;31(2):230–44.
81. Moreau C, Danel V, Devedjian JC, Grolez G, Timmerman K, Laloux C, et al.
Could conservative iron chelation lead to neuroprotection in amyotrophic
lateral sclerosis? Antioxid Redox Signal. 2018;29(8):742–8.
82. Devos D, Cabantchik ZI, Moreau C, Danel V, Mahoney-Sanchez L, Bouchaoui
H, et al. Conservative iron chelation for neurodegenerative diseases such as
Parkinson's disease and amyotrophic lateral sclerosis. J Neural Transm
(Vienna). 2020;127(2):189–203.
83. Wang L, Li C, Chen X, Li S, Shang H. Abnormal serum iron-status indicator
changes in amyotrophic lateral sclerosis (ALS) patients: a meta-analysis.
Front Neurol. 2020;11:380.
84. Tai H, Cui L, Liu M, Guan Y, Li X, Shen D, et al. Creatine kinase level and its
relationship with quantitative electromyographic characteristics in
amyotrophic lateral sclerosis. Clin Neurophysiol. 2018;129(5):926–30.
85. Linkhart TA, Wilson BW. Appearance of acetylcholinesterase and creatine
kinase in plasma of normal chickens after denervation. J Neurol Sci. 1975;
26(2):193–201.
86. Borai A, Livingstone C, Abdelaal F, Bawazeer A, Keti V, Ferns G. The
relationship between glycosylated haemoglobin (HbA1c) and measures of
insulin resistance across a range of glucose tolerance. Scand J Clin Lab
Invest. 2011;71(2):168–72.
87. Desport JC, Preux PM, Magy L, Boirie Y, Vallat JM, Beaufrère B, et al. Factors
correlated with hypermetabolism in patients with amyotrophic lateral
sclerosis. Am J Clin Nutr. 2001;74(3):328–34.
88. Desport JC, Torny F, Lacoste M, Preux PM, Couratier P. Hypermetabolism in
ALS: correlations with clinical and paraclinical parameters. Neurodegener
Dis. 2005;2(3–4):202–7.
89. Funalot B, Desport JC, Sturtz F, Camu W, Couratier P. High metabolic level
in patients with familial amyotrophic lateral sclerosis. Amyotroph Lateral
Scler. 2009;10(2):113–7.You can also read