Gastroenterology and Hepatology - An International Journal of - PredictImmune
←
→
Page content transcription
If your browser does not render page correctly, please read the page content below

An International Journal of
                                 Gastroenterology
                                 and Hepatology

 A blood based prognostic biomarker in IBD
Daniele Biasci, James C Lee, Nurulamin M Noor, Diana R Pombal,
Monica Hou, Nina Lewis, Tariq Ahmad, Ailsa Hart, Miles Parkes,
       Eoin F McKinney, Paul A Lyons, Kenneth G Smith

                   Gut 2019;68:1386-1395
               doi:10.1136/gutjnl-2019318343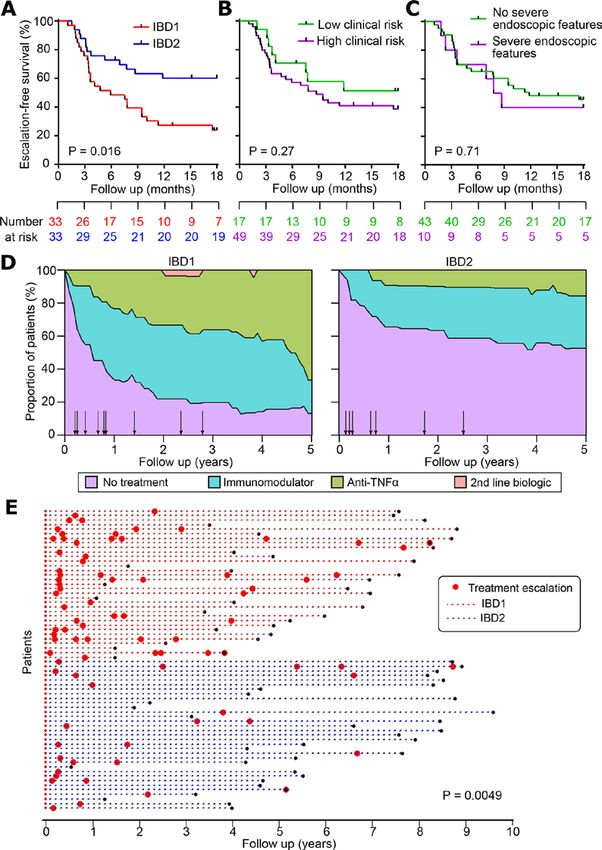
Inflammatory bowel disease

                                  ORIGINAL ARTICLE

                                  A blood-based prognostic biomarker in IBD
                                  Daniele Biasci,1 James C Lee, 1,2 Nurulamin M Noor,1 Diana R Pombal,1,2
                                  Monica Hou,3 Nina Lewis,4 Tariq Ahmad,5 Ailsa Hart,6,7 Miles Parkes,1
                                  Eoin F McKinney,1,2 Paul A Lyons,1,2 Kenneth G C Smith1,2

Ź Additional material is          ABSTRACT
published online only. To view    Objective We have previously described a prognostic                Significance of this study
please visit the journal online
(http://dx.doi.org/10.1136/       transcriptional signature in CD8 T cells that separates
gutjnl-2019-318343).              patients with IBD into two phenotypically distinct                 What is already known about this subject?
                                  subgroups, termed IBD1 and IBD2. Here we sought to                 Ź The course of Crohn’s disease (CD) and UC
1
 Department of Medicine,                                                                                 varies considerably between patients, but
University of Cambridge,          develop a blood-based test that could identify these
Cambridge, UK                     subgroups without cell separation, and thus be suitable                reliable prognostic markers are not available
2
 Cambridge Institute of           for clinical use in Crohn’s disease (CD) and ulcerative                in clinical practice. This hinders disease
Therapeutic Immunology &          colitis (UC).                                                          management because treatment approaches
Infectious Disease, University of                                                                        that would be optimal for patients with
                                  Design Patients with active IBD were recruited before
Cambridge, Cambridge, UK                                                                                 indolent disease—characterised by infrequent
3
 PredictImmune Ltd, Cambridge, treatment. Transcriptomic analyses were performed on
UK                                purified CD8 T cells and/or whole blood. Phenotype                     flare-ups that can be readily controlled by
4
 Nottingham University            data were collected prospectively. IBD1/IBD2 patient                   first-line therapy— will inevitably undertreat
Hospitals NHS Trust,              subgroups were identified by consensus clustering                      those with progressive disease. Conversely,
Nottingham, UK                                                                                           strategies that would appropriately control
5
 University of Exeter Medical     of CD8 T cell transcriptomes. In a training cohort,
School, Exeter, UK                machine learning was used to identify groups of genes                  frequently relapsing, progressive disease will
6
 St Mark’s Hospital, London, UK (’classifiers’) whose differential expression in whole                   expose patients with more quiescent disease
7
 Antigen Presentation Research    blood recreated the IBD1/IBD2 subgroups. Genes from                    to the risks and side effects of unnecessary
Group, Imperial College,                                                                                 treatment. We have previously described a
                                  the best classifiers were quantitative (q)PCR optimised,
London, UK                                                                                               CD8 T cell gene expression signature that
                                  and further machine learning was used to identify the
                                  optimal qPCR classifier, which was locked down for                     corresponds to differences in T cell exhaustion,
Correspondence to
Dr James C Lee and                further testing. Independent validation was sought in                  is detectable during active untreated disease
Professor Kenneth G C Smith,      separate cohorts of patients with CD (n=66) and UC                     (including at diagnosis) and predicts disease
Cambridge Institute of            (n=57).                                                                course in both UC and CD. However, the need
Therapeutic Immunology &                                                                                 for cell separation and microarray-based gene
                                  Results In both validation cohorts, a 17-gene qPCR-
Infectious Disease, Jeffrey Cheah                                                                        expression analysis would make this difficult to
Biomedical Centre, Cambridge      based classifier stratified patients into two distinct
Biomedical Campus, University     subgroups. Irrespective of the underlying diagnosis,                   translate to clinical practice.
of Cambridge, Cambridge, CB2      IBDhi patients (analogous to the poor prognosis IBD1               What are the new findings?
0AW, UK; jcl65@cam.ac.uk,         subgroup) experienced significantly more aggressive
kgcs2@cam.ac.uk                                                                                      Ź We have developed, optimised and
                                  disease than IBDlo patients (analogous to IBD2),                       independently validated a whole blood qPCR-
DB and JCL contributed equally. with earlier need for treatment escalation (hazard                       based classifier—designed to identify the
                                  ratio=2.65 (CD), 3.12 (UC)) and more escalations                       IBD1 and IBD2 patient subgroups—that can
Received 22 January 2019          over time (for multiple escalations within 18 months:
Revised 11 March 2019                                                                                    reliably predict prognosis in patients with CD
                                  sensitivity=72.7% (CD), 100% (UC); negative predictive                 or UC from diagnosis without the need for
Accepted 4 April 2019
                                  value=90.9% (CD), 100% (UC)).                                          cell separation. We also present a detailed
                                  Conclusion This is the first validated prognostic                      phenotypic update on the disease course
                                  biomarker that can predict prognosis in newly diagnosed                experienced by patients in either the IBD1/IBDhi
                                  patients with IBD and represents a step towards                        or IBD2/IBDlo subgroups, incorporating both
                                  personalised therapy.                                                  expanded patient cohorts and substantially
                                                                                                         longer follow-up. This affords new insights into
                                                                                                         the spectrum of therapies that are differentially
                                  INTRODUCTION                                                           required in these patient subgroups and
                                  In recent years, there has been a growing realisation                  reinforces their association with disease
© Author(s) (or their             that the future of IBD management needs to incor-                      prognosis.
employer(s)) 2019. Re-use
permitted under CC BY.            porate a personalised approach to therapy, in which
Published by BMJ.                 the right treatment can be given to the right patient
                                  at the right time.1 This now represents a key goal               In truth, this ambition is shared across many disease
 To cite: Biasci D, Lee JC,
                                  in IBD and was recently named as one of the most                 areas, motivated by developments in oncology
 Noor NM, et al. Gut Epub
 ahead of print: [please          important research priorities by the James Lind                  where personalised therapy has been achieved
 include Day Month Year].         Alliance priority-setting partnership2—a group                   using biomarkers that can accurately predict cancer
 doi:10.1136/                     of clinicians, patients and other stakeholders who               outcome and response to therapy.3 4 The poten-
 gutjnl-2019-318343               sought to identify important areas of unmet need.                tial advantages of personalised medicine in IBD
                                                Biasci D, et al. Gut 2019;0:1–10. doi:10.1136/gutjnl-2019-318343                                             1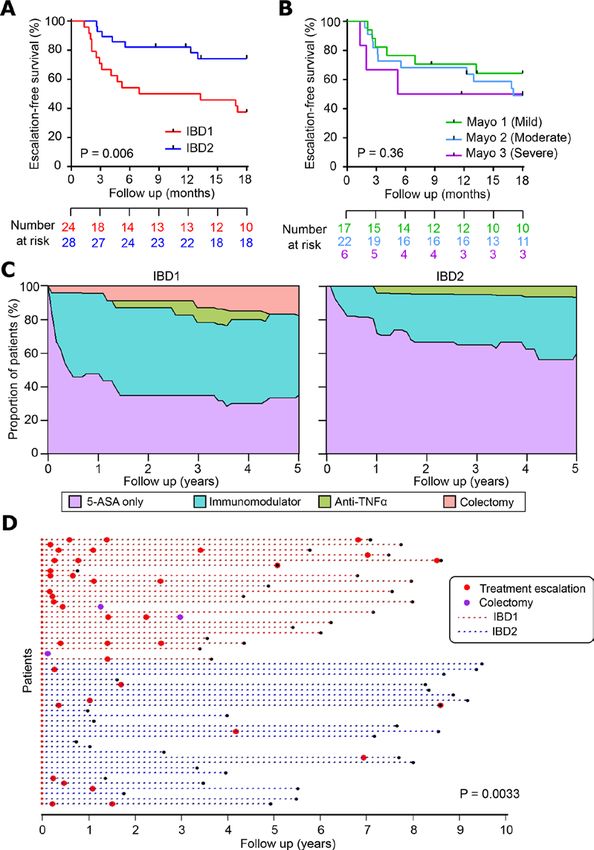
Inflammatory bowel disease
therapy, were recruited from a specialist IBD clinic at Adden-
Significance of this study brooke’s hospital, Cambridge, before commencing treatment. A
stable dose of topical or oral 5-ASA was permitted if patients had
How might it impact on clinical practice in the foreseeable been diagnosed previously. All subjects were recruited between
future? 2008 and 2014 and were aged 18 years or older. Most (86/118)
Ź The qPCR-based classifier has performance characteristics were recruited at the time of diagnosis. All patients were diag-
that compare favourably with prognostic biomarkers nosed with CD or UC based on standard endoscopic, histolog-
currently in use in oncology and should be sufficient to ical and radiological criteria and were treated in accordance with
guide therapy from diagnosis in patients with CD or UC. This national and international guidelines using a conventional step-up
represents an important step towards personalised therapy strategy within the UK National Health Service. Disease activity
in IBD. was assessed by considering symptoms, clinical signs, blood tests
(C reactive protein, haemoglobin and albumin), stool markers
(calprotectin) and endoscopic assessment where indicated. To be
are clear. First, this would anticipate the marked variability in enrolled, patients had to have active disease confirmed by one or
prognosis that occurs between patients5 6 and which means that more objective marker (raised CRP, raised calprotectin or endo-
‘one-size-fits-all’ approaches cannot optimally treat everyone scopic evidence of active disease) in addition to active symptoms
(either because they are ineffective in some or unnecessarily and/or signs (table 1). Clinicians were blinded to the biomarker
risky in others). Second, it would enable clinicians to better results. Detailed phenotype data were collected prospectively.
use the growing armamentarium of IBD therapies to improve All participants provided written informed consent.
clinical outcomes.7 For example, it is well recognised that early
use of combination therapy (anti-tumour necrosis factor (TNF)
Sample preparation
α monoclonal antibodies and an immunomodulator) is one of
A 110 mL venous blood sample was taken from patients at enrol-
the most effective treatments in CD,8 particularly when given
ment. PBMCs were immediately extracted and CD8 T cells were
early in the disease course,9 10 but that indiscriminate use of
positively selected, as described previously.16 Following purifi-
this strategy would be prohibitively expensive and expose many
FDWLRQFHOOVZHUHO\VHGDQGO\VDWHVVWRUHGDWï&51$ZDV
patients to side effects of drugs that they do not require. Unfor-
subsequently extracted using RNeasy Mini Kits (Qiagen) and
tunately, in IBD—as in most autoimmune and inflammatory
quantified using a NanoDrop1000 Spectrophotometer (Ther-
diseases—biomarkers that can reliably predict disease course
moFisher). Of the total blood draw, 2.5 mL were collected into a
from diagnosis are not available, precluding the delivery of
PAXgene Blood RNA tube IVD (PreAnalytix), which was stored
personalised therapy.
DWï&:KROHEORRG51$ZDVVXEVHTXHQWO\H[WUDFWHGXVLQJ
We have previously reported that hypothesis-free inspection
a PAXgene 96 Blood RNA kit (PreAnalytix) according to the
of CD8 T cell gene expression data from patients with active,
manufacturer’s instructions.
untreated autoimmune disease can identify thousands of genes
whose differential expression defines two distinct patient
subgroups.11 12 Notably, these subgroups were not detectable Microarray processing and analysis
using unsupervised analysis of unseparated peripheral blood Following assessment of RNA quality (2100 Bioanalyzer, Agilent
mononuclear cells (PBMCs) from the same patients.11 12 In all Technologies), 200 ng RNA was processed for hybridisation onto
of the diseases studied, including CD and UC, these subgroups Affymetrix Human Gene 1.0 ST microarrays (CD8 T cell samples,
were clinically indistinguishable at enrolment, but patients n=118) or Affymetrix Human Gene 2.0 ST microarrays (whole
within them subsequently experienced contrasting disease blood samples, n=69) according to the manufacturer’s instruc-
courses, characterised by differences in the time to first relapse tions. Raw data were preprocessed (background corrected,
and the number of treatment escalations required over time.11 12 normalised, quality checked and batch normalised) using Biocon-
More recent work has ascribed the gene signature to inter-pa- ductor packages (http://www.bioconductor.org/) in R (http://
tient differences in T cell exhaustion13: the phenomenon by www.r-project.org/): affy,17 vsn,18 arrayQualityMetrics19 and
which effector T cells progressively lose their ability to respond sva.20 For CD8 T cell data, unsupervised consensus clustering
to target antigens. T cell exhaustion was originally reported as was performed to identify the IBD1/IBD2 subgroups, as previ-
a consequence of chronic viral infection14 but is now recognised ously described.12 Of note, IBD1/IBD2 status was not included
to occur with persistent auto-antigens.13 15 Consistent with being as a covariate in the batch normalisation of whole blood samples
less able to respond to disease-related antigens, patients with to reduce any downward bias in estimating the generalisation
more T cell exhaustion had a better prognosis, characterised by error during leave-one-out cross-validation (LOOCV).
a longer time to disease relapse and fewer flares over time.13
Here, we describe how we have developed, optimised and Biomarker development
independently validated a whole blood biomarker—designed Following preprocessing, a statistical (machine) learning
to identify the IBD1/IBD2 subgroups—that can predict the method—logistic regression with an adaptive Elastic-Net
course of UC and CD from diagnosis. Additionally, we present a penalty21 —was applied to the whole blood transcriptomic data
detailed phenotypic update regarding the clinical consequences to identify genes that could be used to calculate the probability
of being in the IBD1 (exhaustion low) or IBD2 (exhaustion high) of an individual belonging to the IBD1/IBD2 subgroups. Penal-
subgroups. ised regression methods are a useful tool to regularise models,
and thus control overfitting, during biomarker discovery.22 The
MATERIALS AND METHODS adaptive Elastic-Net method in particular combines the strengths
Patient recruitment (training cohort for biomarker discovery of the ridge penalty and the adaptively weighted lasso shrinkage
and CD8 T cell cohort—Cambridge) penalty and can address the technical challenges in these data.21
Patients with active CD and UC, who were not receiving These were: high dimensionality (ie, number of samples is
concomitant corticosteroids, immunomodulators or biological substantially smaller than number of genes), multicollinearity
2 Biasci D, et al. Gut 2019;0:1–10. doi:10.1136/gutjnl-2019-318343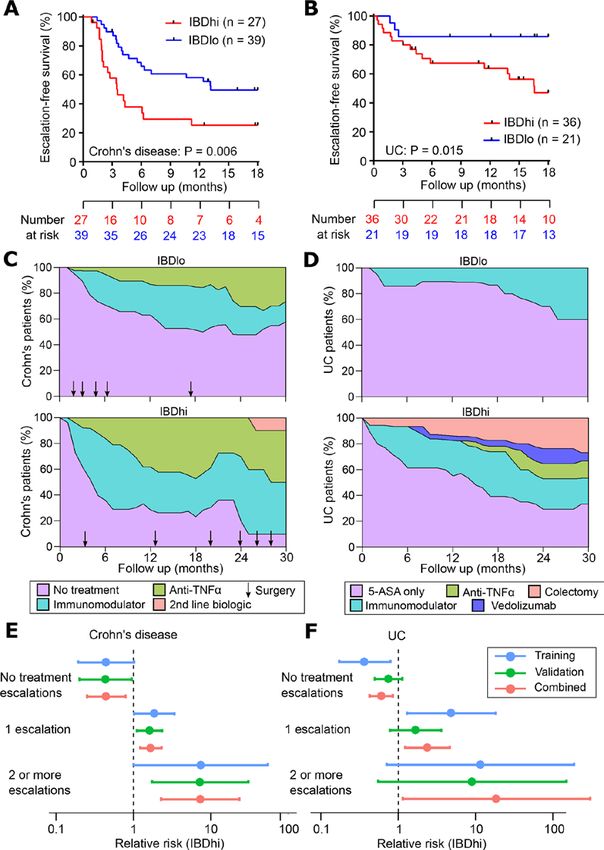
Inflammatory bowel disease

 Table 1       Baseline patient characteristics in CD8 T cell cohort
                                               CD                                                                   UC
                                               IBD1 (n=33)               IBD2 (n=33)               P value          IBD1 (n=24)               IBD2 (n=28)                P value
 Age (years)                                    30.3 (25.3–36.1)          30.3 (23.2–38.7)          0.98             43.8 (30.9–50.4)          40.5 (29.1–54.0)          0.92
 Gender (% male)                                14 (42.4%)                13 (39.4%)                1.00             13 (54.2%)                13 (46.4%)                0.78
 Current smoker                                 10 (28.6%)                12 (33.3%)                0.79              1 (4.2%)                   0 (0%)                  0.46
 Newly diagnosed                                27 (81.8%)                24 (72.7%)                0.56             15 (62.5%)                20 (71.4%)                0.56
 Disease duration (years)                        0.0 (0.0–0.0)              0.0 (0.0–0.0)           0.78              0.0 (0.0–2.2)              0.0 (0.0–3.6)           0.76
 Haemoglobin (g/L)                              12.5 (11.7–13.3)          13.1 (11.8–13.6)          0.63             14.0 (12.8–14.4)          13.0 (12.3–14.6)          0.26
 CRP (mg/L)                                     26 (16–39)                25 (10–59)                0.60              6 (3–23)                   4 (2–21)                0.26
 Albumin (g/L)                                  35 (32–37)                37 (34–39)                0.14             39 (37–41)                39 (37–41)                0.96
 Disease distribution:
   CD – L1 (ileal)                               9 (27.3%)                13 (39.4%)                0.43              –                         –                        –
   CD – L2 (ileocolonic)                        11 (33.3%)                  9 (27.3%)               0.79              –                         –                        –
   CD – L3 (colonic)                            13 (39.4%)                 11 (33.3%)               0.80              –                         –                        –
   CD – L4 (upper GI)                            2 (6.1%)                   3 (9.1%)                1.00              –                         –                        –
   Perianal                                      6 (18.2%)                  3 (9.1%)                0.48              –                         –                        –
   UC – E1 (proctitis)                           –                         –                       –                  5 (20.8%)                  8 (28.6%)               0.75
   UC – E2 (left sided)                          –                         –                       –                  9 (37.5%)                11 (39.3%)                1.00
   UC – E3 (extensive)                           –                         –                       –                 10 (41.7%)                  9 (32.1%)               0.57
 Prospective follow-up (years)                   4.9 (3.6–7.4)              5.3 (4.3–8.3)           0.24              5.6 (3.6–7.1)              5.5 (2.4–8.4)           0.54
 Data shown in parentheses indicate median (IQR) for continuous variables or percentages for dichotomous variables. Statistical significance was calculated using a Mann-
 Whitney test (two tailed) for continuous variables and Fisher’s exact test (two tailed) for dichotomous variables. Disease distribution was classified according to the Montreal
 Classification.27
 CD, Crohn’s disease; CRP, C reactive protein.

(ie, expression of many genes is correlated, with the need to                                 3 reference genes from 69 samples. Following normalisation
avoid selecting multiple correlated genes in the model) and                                   by feature standardisation, an identical penalised regression
requirement for a sparse and interpretable model (ie, need for                                strategy was applied to this qPCR dataset to identify an optimal
a limited number of genes in a classifier in which the contribu-                              classification model comprising 16 informative and 2 reference
tion of each can be interpreted). The initial model was deter-                                genes. To refine this model for use on unscaled data, a prerequi-
mined using a classic Elastic-Net (implemented in the gcdnet                                  site for use in a clinical setting, an additional round of penalised
package23 in R) followed by adaptive Elastic-Net training using                               logistic regression was applied using the cvglmnet function in
equations reported in the original description of the method.21                               the glmnet package22 in R. This uses iterative cross-validation
In brief, the optimal classification rule to identify the IBD1/IBD2                           undertaken concurrently to facilitate automatic identification of
subgroups was learnt from the whole blood microarray data by                                  the optimal, or most regularised, model (using accuracy of IBD1/
defining many different combinations of model hyperparame-                                    IBD2 classification as a performance metric). This identified a
ters, which were then used to fit a corresponding number of                                   17-gene model (15 informative and 2 reference genes) with an
candidate models (2100) to the whole blood expression data.                                   error within 1 SE of the minimum mean cross-validated error,
Model selection was performed using the Bayesian Information                                  which was considered the most regularised (as recommended
Criterion (BIC), where the highest BIC corresponds to the best                                by the authors of this approach22). This 17-gene classifier was
model (online supplementary table 1). BIC was defined as:                                     ‘locked-down’ so that no further changes could be made and
                                                                                            was then tested in the validation cohorts. Patients in the qPCR

               %,&        − OQ /̂ − N · OQ Q                                        (n)       subgroup analogous to IBD1 were termed ‘IBDhi’ and patients
                                                                                              in the subgroup analogous to IBD2 were termed ‘IBDlo’.
  where k=degrees of freedom (the number of genes incorpo-
rated), n=number of samples and (L)=log likelihood function
for the model. The generalisation error of the selected model                                 Validation cohorts
was estimated using nested LOOCV.24                                                           One hundred and twenty-three patients with active IBD (66
                                                                                              CD, 57 UC) were recruited before commencing treatment from
qPCR classifier development                                                                   specialist clinics in four UK teaching hospitals (in Cambridge,
A list of 39 candidate and 3 reference genes was taken forward                                Nottingham, Exeter and London). All subjects were recruited
to qPCR classifier development using TaqMan gene expression                                   between 2009 and 2017 and were aged 18 years or older. The
assays (online supplementary table 2). Following reverse tran-                                median follow-up was 1.9 years (IQR: 1.3–3.2 years). Of these
scription of whole blood RNA, qPCR was performed in triplicate                                patients, 115 (93%) were newly diagnosed (61 CD, 54 UC).
using a Roche LightCycler 480, and transcript abundance was                                   Prospective follow-up data were collected for all patients, who
FDOFXODWHGXVLQJWKH¨¨&7PHWKRGEDVHGRQWKHPHDQRIWHFK-                                  were treated at the discretion of their gastroenterologists in
nical replicates. The correlation between microarray and qPCR                                 accordance with national and international guidelines. Clini-
expression values was then used to filter the candidate gene                                  cians were blinded to gene expression analyses. From each
list (six were removed due to poor correlation). This resulted                                patient, a 2.5 mL venous blood sample was collected into a
in a dataset containing expression values for 33 candidate and                                PAXgene Blood RNA tube IVD (PreAnalytix), which was stored
Biasci D, et al. Gut 2019;0:1–10. doi:10.1136/gutjnl-2019-318343                                                                                                                    3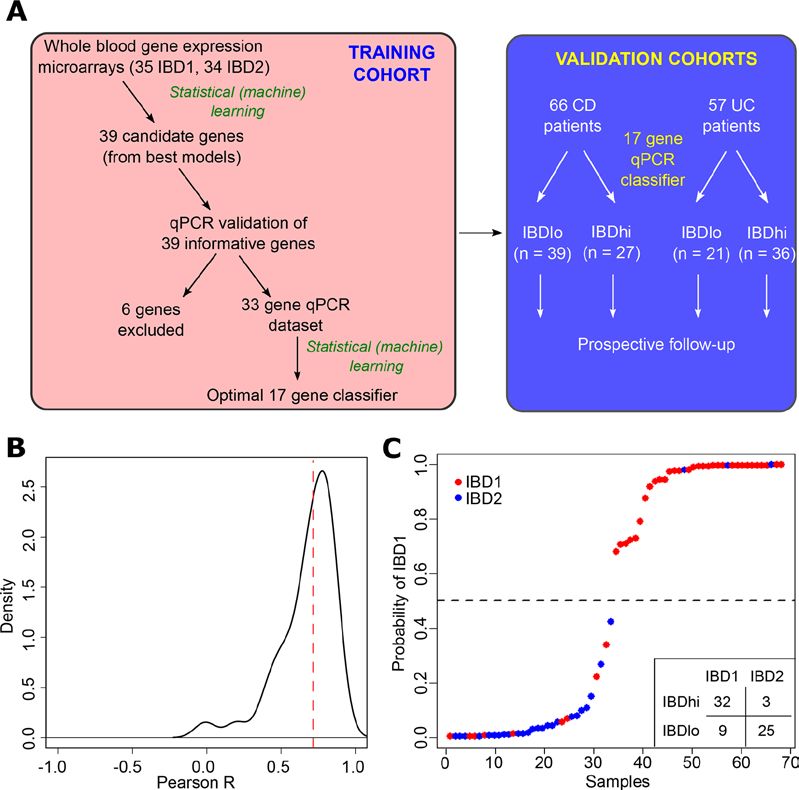
Inflammatory bowel disease
DW ï& 51$ ZDV VXEVHTXHQWO\ H[WUDFWHG TXDQWLILHG DQG statistical analyses and reporting were performed in accordance
quality checked as described above. qPCR was performed for with Strengthening the Reporting of Observational Studies in
the 15 informative and 2 reference genes within the optimal Epidemiology guidelines.25
classifier using Research-Use-Only PredictSURE IBD kits
(PredictImmune) to determine whether patients were IBDhi
or IBDlo. The clinical course experienced by the IBDhi and RESULTS
IBDlo subgroups was compared using prospectively collected Whole blood classifier development
phenotype data. Importantly, the phenotyping collection was We have previously reported that a prognostic biomarker based
blinded to the classifier designation and vice versa. All partici- on IBD1/IBD2 subgroup membership would represent a useful
pants provided written informed consent. clinical tool, given its performance characteristics.12 Nonethe-
less, it is clear that any assay that requires CD8 T cell purifica-
Statistical analysis tion and microarray analysis would be difficult to translate to
Statistical tests performed during microarray analysis or machine clinical practice. For this reason, we investigated whether we
learning are described in the relevant sections. Survival analyses could identify the same patient subgroups using whole blood,
for time-to-first-treatment-escalation were performed using a without the need for cell separation (figure 1A). To do this, we
log-rank test. Comparison of the number of treatment escala- first defined a training cohort of 69 patients (39 CD, 30 UC; 35
tions was performed using a Mann-Whitney test (two tailed for IBD1, 34 IBD2) for whom we had both CD8 T cell transcrip-
CD8 T cell analyses and one tailed for validation cohort anal- tomic data and a whole blood PAXgene Blood RNA sample (the
yses). Comparison of the clinical and laboratory data in IBD1/ latter taken at the same time as the CD8 T cell sample). Fifty
IBD2 patients was performed using Fisher’s test for dichot- of these patients were in our original report of IBD1/IBD212
omous variables or Mann-Whitney test for continuous vari- and 19 were recruited subsequently. RNA was extracted from
ables (two tailed). The α value for these analyses was 0.05. All PAXgene Blood RNA tubes, and genome-wide gene expression
Figure 1 Development of a qPCR-based whole blood prognostic biomarker. (A) Schematic depicting the workflow for the development, optimisation
and validation of the whole blood qPCR-based classifier with separate training and validation cohorts. (B) Distribution of correlation coefficients
between microarray and qPCR-based measurements of gene expression for 39 genes. (C) Confidence of assignments to IBD1 and IBD2 subgroups in
the training cohort using the qPCR classifier (15 informative and 2 reference genes). Colours indicate actual IBD1/IBD2 assignments based on CD8
T cell transcriptomic analysis (red=IBD1, blue=IBD2). Inset summary table depicts results using 0.5 cut-off for group assignment. CD, Crohn’s disease.
4 Biasci D, et al. Gut 2019;0:1–10. doi:10.1136/gutjnl-2019-318343Inflammatory bowel disease
was measured by microarray (Affymetrix Human Gene 2.0 ST because this test would be used at diagnosis, negative prediction
arrays). The resulting raw data were preprocessed to create a (ie, correctly identifying patients who do not need additional
normalised dataset that could be used for classifier development therapy) is more relevant,26 both to improve resource alloca-
(Materials and methods). To identify a whole blood classifier, we tion and not miss a ‘window of opportunity’ to optimally treat
used a machine learning method (logistic regression with adap- patients with progressive disease. In these validation cohorts,
tive Elastic-Net penalisation21) to identify models comprising the the negative predictive value for predicting multiple escalations
smallest number of most predictive genes with least redundancy. within the first 18 months was high: 90.9% in CD and 100%
A series of potential models were produced (online supplemen- in UC (figure 2E,F). These results are particularly noteworthy
tary table 1) of which the optimal model comprised 12 genes and given that the classifier was developed to predict IBD1/IBD2
resulted in accurate identification of the IBD1/IBD2 subgroups subgroup membership (being directly assessed against this in the
(p=1.6×10ï for comparison with a ‘dummy’ classifier using training cohort). In the validation cohorts, however, CD8 T cell
a binomial distribution of samples). The generalisation error transcriptomic data—and thus IBD1/IBD2 subgroup member-
for this model was estimated using LOOCV (accuracy=0.81, ship—was not available, and so the biomarker had to be assessed
95% CI 0.70 to 0.90). against the difference in prognosis that was observed in the
IBD1/IBD2 subgroups. This is one step removed from how the
classifier was developed and represents a more difficult bench-
qPCR classifier development and optimisation
mark but is ultimately what a prognostic biomarker would need
To translate this result into a clinically useful tool, we examined
to predict to be clinically useful.
the top models and selected 39 candidate genes and 3 reference
To facilitate translation of this test to clinical practice, analyt-
genes for qPCR optimisation (figure 1A, online supplementary
ical validation was also performed to assess precision, limit of
table 2, Materials and methods). Of the candidate genes, 12
detection, linearity, input RNA range and freeze/thaw cycling for
were members of the optimal microarray-based classifier, 6 were
each gene’s qPCR assay and for the combined multianalyte-de-
highly correlated with genes in the optimal classifier and 21 were
rived risk score (data not shown). The contribution of specific
selected from adaptive Elastic-Net models with lower BIC (online
sources (eg, operator and batch) to the total assay variance was
supplementary table 2). Genes that showed poor correlation
also assessed (data not shown). Together, these analytical and
with microarray data were excluded (n=6, figure 1A,B). Using
clinical validation data have resulted in a CE-marked assay that is
qPCR data, we then applied a similar statistical learning strategy
ready for clinical use (PredictSURE IBD, PredictImmune).
(Materials and methods) to identify the optimal classifier (15
informative and 2 reference genes; figure 1C, online supplemen-
tary table 3), which was locked down for further testing. Clinical phenotype over time
It is clear that the phenotypic consequences of IBDhi/IBDlo
subgroup membership mirror those observed in IBD1/IBD2
qPCR classifier validation
patients.12 However, due to their prospective collection, both of
A critical step in the development of any new biomarker is inde-
these cohorts had relatively limited follow-up (validation cohort:
pendent validation, in which the assay can be tested on samples
median 1.9 years; original CD8 T cell cohort manuscript12:
that were not included in the discovery phase. This facilitates an
median 1.6 years). To better understand the longer term conse-
assessment of whether the model will generalise to populations
quences of being in the IBD1 (IBDhi) or IBD2 (IBDlo) subgroups,
other than the one on which it was developed (figure 1A) and
we examined the extended phenotyping data from all patients
provides a more accurate estimate of the true performance char-
for whom CD8 T cell gene expression data were available. This
acteristics of the assay. We therefore tested the qPCR classifier
cohort was now larger than previously reported12 (sample size
in the validation cohorts of patients with CD and UC. When
increased from 67 to 118) and had substantially longer follow-up
applied to these independent samples, the classification algo-
(median follow-up increased from 1.6 years to 5.3 years). These
rithm assigned every patient into either the ‘IBDhi’ (analogous
increases in cohort size and follow-up enabled us to perform
to IBD1) or ‘IBDlo’ (analogous to IBD2) subgroup. In both the
a more detailed analysis of the clinical consequences of IBD1/
CD and UC validation cohorts, patients in the IBDhi and IBDlo
IBD2 subgroup membership. Baseline patient characteristics
subgroups experienced very different disease courses. Patients
are presented in table 1. Consistent with our previous findings,
in the IBDhi subgroup had consistently more aggressive disease,
all patients could be readily classified into IBD1 or IBD2 based
which was characterised by the need to escalate treatment earlier
on CD8 T cell gene expression. There were no clinical charac-
(with immunomodulators, biological therapies or surgery)
teristics at baseline that distinguished between these subgroups
and more frequently than for patients in the IBDlo subgroup
(table 1), and specifically there was no correlation between
(figure 2A–F). In the CD validation cohort, the HR for the differ-
measures of inflammation and subgroup membership.
ence in time to first escalation was 2.65 (95% CI 1.32 to 5.34;
p=0.006) and in the UC validation cohort this HR was 3.12
(95% CI 1.25 to 7.72; p=0.015) (figure 2A,B). Moreover, irre- Disease course in IBD1/IBD2 patients
spective of the underlying disease, IBDhi patients experienced a CD: 66 patients with CD were recruited of whom 51 (77.3%)
disease course that necessitated more potent therapies to achieve were newly diagnosed at enrolment. Thirty-three patients
disease remission (figure 2C,D). The sensitivity and specificity were in IBD1 and 33 in IBD2. Compared with patients in the
for predicting the need for multiple escalations within the first IBD2 subgroup, IBD1 patients had a significantly shorter time
18 months were 72.7% and 73.2% in CD and 100% and 48% to requiring a treatment escalation, as previously reported12
in UC. Of note, the relatively low specificity in UC reflects the (figure 3A). Interestingly, neither clinical parameters (any two
lower treatment escalation rate observed (36 escalations in the of: steroid requirement, ageInflammatory bowel disease Figure 2 Validation of qPCR-based classifier in independent cohorts. (A and B) Kaplan-Meier plots of escalation-free survival for the CD validation cohort (A; n=66) and the UC validation cohort (B; n=57) as stratified by the IBDhi (IBD1 equivalent) and IBDlo (IBD2 equivalent) patient subgroups. Data are censored at 18 months. Statistical significance assessed by log-rank test. (C and D) Stacked density plots demonstrating the maximum medical therapy that was required during the first 2.5 years’ prospective follow-up of the IBDhi and IBDlo subgroups in CD (C) and UC (D). Treatments were plotted hierarchically (no treatment
Inflammatory bowel disease

Figure 3 The clinical course of Crohn’s disease (CD) is different in IBD1 and IBD2 patients. (A) Kaplan-Meier plot of escalation-free survival for CD
patients in the IBD1 and IBD2 subgroups. Data are censored at 18 months. Statistical significance assessed by log-rank test. (B and C) Kaplan-Meier
plots in the same format as figure part A with patients subdivided according to clinical risk (high risk=2 or more of: age
Inflammatory bowel disease

Figure 4 The clinical course of UC is different in IBD1 and IBD2 patients. (A) Kaplan-Meier plot of escalation-free survival for UC patients in the
IBD1 and IBD2 subgroups. Data are censored at 18 months. Statistical significance assessed by log-rank test. (B) Kaplan-Meier plot in the same format
as figure part A with patients subdivided according to endoscopic disease severity at index colonoscopy. P value calculated by comparing mild and
severe cases. (C) Stacked density plots demonstrating the maximum medical therapy that was required during the first 5 years’ prospective follow-
up in the IBD1 and IBD2 subgroups. Treatments were plotted hierarchically (5-ASA only
Inflammatory bowel disease
relative risk (RR) of requiring escalation to biologic therapy         whole blood qPCR assay can be readily incorporated into stan-
(excluding those who received biologic therapy due to immu-            dard laboratory protocols.
nomodulator intolerance) was 3.0 (12/33 IBD1 patients, 4/33               There are several limitations of this work. First, the study was
IBD2 patients) (online supplementary table 4). Likewise, the RR        non-interventional, and all patients were assessed and treated
of not requiring any medical therapy in IBD1 was 0.53 (8/33            at the discretion of their gastroenterologists in accordance with
IBD1 patients, 15/33 IBD2 patients) (figure 3E, online supple-         national and international guidelines, rather than following a
mentary table 4). Total surgery rates were not significantly           formal protocol. This, however, represents real-world practice
different between the groups (10/33 IBD1, 7/33 IBD2), but the          and is the setting in which the test will ultimately be used. Second,
trend to a higher surgery rate in IBD1 mirrored that observed in       because patients were recruited before induction therapy, we do
the CD validation cohort (figure 2C) and so may simply reflect         not yet know how the biomarker would perform if treatment
a lack of power to detect an effect. Notably, all of the patients      had already been started. Nonetheless, if induction therapy was
who required a panproctocolectomy were in the IBD1 subgroup            underway, the biomarker could still be used if/when patients
(online supplementary table 4). There were two deaths during           next re-flare, since the CD8 T cell signature is readily detect-
follow-up: an IBD2 patient died from end-stage COPD and an             able during active disease.13 Clarifying the effect of concomi-
IBD1 patient died from liver failure secondary to PSC.                 tant therapy is the subject of ongoing work. Third, while the
   UC: 52 patients with UC were recruited, of whom 35 (67.3%)          performance characteristics of this assay meet the requirements
were newly diagnosed. Twenty-four patients were in IBD1 and            of a useful prognostic biomarker, we have not yet conducted an
28 in IBD2. As in the CD cohort, UC patients in the IBD1               interventional study to confirm that stratifying therapy using this
subgroup experienced more aggressive disease with significantly        biomarker would improve clinical outcomes. For this reason,
earlier need for treatment escalation (figure 4A). Notably, endo-      we have concurrently designed a biomarker-stratified trial34 to
scopic severity at baseline28 did not predict need for treatment       test whether this assay can deliver personalised therapy from
escalation (figure 4B). Over time, IBD1 patients also required         diagnosis. This trial (Predicting outcomes for Crohn’s DIsease
significantly more escalations due to recurrently active disease       using a molecular biomarker; www.crohnsprofiletrial.com) is
(figure 4C,D). There were several other similarities between the       currently recruiting in the UK and represents one of the first
UC and CD cohorts, with the probability of not needing any treat-      biomarker-stratified trials in any inflammatory disease. It will
ment escalations in IBD1 UC patients being approximately half          assess the relative benefit of ‘Top Down’ therapy (anti-TNFα
that of IBD2 UC patients (RR=0.45), and the RR of requiring            and an immunomodulator) over ‘Accelerated Step-Up’ therapy
escalation to biological therapy or colectomy in IBD1 being 4.08       in IBDhi and IBDlo patients to determine whether the biomarker
(7/24 IBD1 patients, 2/28 IBD2 patients) (figure 4C,D, online          can accurately match patients to the most appropriate treatment
supplementary table 4). Indeed, across all of the patient cohorts      for them, thereby improving outcomes by optimising disease
(CD8 T cell and whole blood) colectomies were only required            control and minimising drug toxicity.
in IBD1/IBDhi patients (7/56 IBD1 or IBDhi patients; 0/48 IBD2            In summary, we have developed, optimised and validated a
or IBDlo patients, p=0.01, two-tailed Fisher’s test). There was        whole blood gene expression biomarker that can predict prog-
one death during follow-up: an IBD1 patient who was due to             nosis in patients with either CD or UC. This provides a rational
start anti-TNFα therapy for chronically active disease died from       basis for personalised therapy in IBD and represents an important
a pulmonary embolism.                                                  step towards precision medicine for patients with CD or UC.
                                                                       Acknowledgements We are grateful to the patients who have provided samples
                                                                       for this study and to the IBD services at Addenbrooke’s Hospital, Royal Devon and
DISCUSSION                                                             Exeter Hospital, Nottingham City Hospital and St Mark’s Hospital for helping identify
A major barrier to personalised medicine in CD and UC is the           suitable patients. We would also like thank Joanne Del Buono, Jennifer Dumbleton,
lack of biomarkers to guide treatment from diagnosis. Indeed,          Lawrence Penez, Philip Hendy, Suzie Marriott and Clare Redstone for assistance with
the performance requirements for a prognostic test mean that           phenotyping.
even though several parameters have been associated with               Contributors DB, JCL, EM, PAL and KGCS conceived the study. JCL, NN, NL, TA,
prognosis in CD—including clinical features,29 serology30 and          AH and MP recruited patients and performed prospective phenotyping. DB analysed
genetic variants31—none are sufficient to guide therapy in clin-       the microarray data to generate a candidate gene list and generated a scaled qPCR-
                                                                       based model. DRP and MH generated qPCR data for use in the final classifier. EM
ical practice. Accordingly, current treatment regimens tend to         and PAL developed the final model. JCL and KGCS wrote the final manuscript with
adopt a ‘one-size-fits-all’ approach, which cannot provide safe,       input from DB, MP, EM and PAL. All authors reviewed the final manuscript.
effective and cost-efficient therapy for every patient. Here, we       Funding This work was funded by the Wellcome Trust (Interim Translation
describe the development of a practical, whole blood assay that        Award 099450/Z/12/Z and Project Grant 094227/Z/10/Z), Crohn’s and Colitis
is in direct response to this unmet need. This assay is the first      UK (Medical Research Award M/09/2), Medical Research Council (Programme
prognostic test in IBD that has validated performance charac-          Grant MR/L019027/1) and the Cambridge NIHR Biomedical Research Centre.
                                                                       Analytical validation experiments were funded by PredictImmune. JCL and EM were
teristics that can support its use as a prognostic biomarker from      supported by Wellcome Trust Intermediate Clinical Fellowships (105920/Z/14/Z and
diagnosis. Indeed, the performance characteristics of the qPCR         104064/Z/14/Z respectively) and DB by a Marie Curie PhD Fellowship (TranSVIR FP7-
classifier in both CD and UC are similar to that of existing           PEOPLE-ITN-2008 #238756). KGCS is a Wellcome Trust Investigator.
gene expression-based in vitro diagnostic tests in oncology. For       Competing interests DB, JCL, EM, PAL and KGCS are coinventors on a
example, the HR for OncotypeDX, a gene expression diag-                patent covering the method of assessing prognosis in IBD. EM, PAL and KGCS
nostic that predicts breast cancer recurrence,32 is 2.81 (95% CI       are cofounders and consultants for PredictImmune. JCL is a consultant for
1.70 to 4.64).33 Importantly, the proven benefit of early aggres-      PredictImmune.
sive therapy in IBD9 10 should only amplify the clinical benefit       Patient consent for publication Not required.
of using this assay to stratify patients at diagnosis, since IBDhi     Ethics approval Ethical approval was obtained from the Cambridgeshire Regional
patients typically experience the sort of aggressive disease that      Ethics committee (REC08/H0306/21).
should benefit most from early use of potent therapy. Collec-          Provenance and peer review Not commissioned; externally peer reviewed.
tively, these data support the early adoption of this assay in clin-   Open access This is an open access article distributed in accordance with the
ical practice, which should not be logistically difficult since a      Creative Commons Attribution 4.0 Unported (CC BY 4.0) license, which permits

Biasci D, et al. Gut 2019;0:1–10. doi:10.1136/gutjnl-2019-318343                                                                                           9
Inflammatory bowel disease
others to copy, redistribute, remix, transform and build upon this work for any 17 Gautier L, Cope L, Bolstad BM, et al. affy--analysis of Affymetrix GeneChip data at the
purpose, provided the original work is properly cited, a link to the licence is given, probe level. Bioinformatics 2004;20:307–15.
and indication of whether changes were made. See: https://creativecommons.org/ 18 Huber W, von Heydebreck A, Sültmann H, et al. Variance stabilization applied to
licenses/by/4.0/. microarray data calibration and to the quantification of differential expression.
Bioinformatics 2002;18(Suppl 1):S96–104.
19 Kauffmann A, Gentleman R, Huber W. arrayQualityMetrics--a bioconductor package
for quality assessment of microarray data. Bioinformatics 2009;25:415–6.
REFERENCES 20 Leek JT, Johnson WE, Parker HS, et al. The sva package for removing batch effects
1 Atreya R, Siegmund B. IBD in 2017: Development of therapy for and prediction of IBD
and other unwanted variation in high-throughput experiments. Bioinformatics
- getting personal. Nat Rev Gastroenterol Hepatol 2018;15:72–4.
2012;28:882–3.
2 Hart AL, Lomer M, Verjee A, et al. What are the top 10 research questions in the
21 Zou H, Zhang HH. On the adaptive elastic-net with a diverging number of parameters.
treatment of inflammatory bowel disease? A priority setting partnership with the
Ann Stat 2009;37:1733–51.
James Lind alliance. J Crohns Colitis 2017;11:204–11.
22 Friedman J, Hastie T, Tibshirani R. Regularization paths for generalized linear models
3 Sparano JA, Gray RJ, Makower DF, et al. Adjuvant chemotherapy guided by a 21-gene
via coordinate descent. J Stat Softw 2010;33:1–22.
expression assay in breast cancer. N Engl J Med 2018;379:111–21.
23 Yang Y, Zou H. An efficient algorithm for computing the HHSVM and its
4 Cardoso F, van’t Veer LJ, Bogaerts J, et al. 70-Gene signature as an aid to treatment generalizations. Journal of Computational and Graphical Statistics 2013;22:396–415.
decisions in early-stage breast cancer. N Engl J Med 2016;375:717–29. 24 Varma S, Simon R. Bias in error estimation when using cross-validation for model
5 Solberg IC, Lygren I, Jahnsen J, et al. Clinical course during the first 10 years of selection. BMC Bioinformatics 2006;7:91.
ulcerative colitis: results from a population-based inception cohort (IBSEN Study). 25 von Elm E, Altman DG, Egger M, et al. The Strengthening the Reporting of
Scand J Gastroenterol 2009;44:431–40. Observational Studies in Epidemiology (STROBE) statement: guidelines for reporting
6 Solberg IC, Vatn MH, Høie O, et al. Clinical course in Crohn’s disease: results of a observational studies. Lancet 2007;370:1453–7.
Norwegian population-based ten-year follow-up study. Clin Gastroenterol Hepatol 26 Gibson G. Going to the negative: genomics for optimized medical prescription. Nat
2007;5:1430–8. Rev Genet 2019;20:1–2.
7 Barré A, Colombel JF, Ungaro R. Review article: predictors of response to vedolizumab 27 Silverberg MS, Satsangi J, Ahmad T, et al. Toward an integrated clinical, molecular and
and ustekinumab in inflammatory bowel disease. Aliment Pharmacol Ther serological classification of inflammatory bowel disease: report of a Working Party of
2018;47:896–905. the 2005 Montreal World Congress of Gastroenterology. Can J Gastroenterol 2005;19
8 Colombel JF, Sandborn WJ, Reinisch W, et al. Infliximab, azathioprine, or combination Suppl A:5A–36.
therapy for Crohn’s disease. N Engl J Med 2010;362:1383–95. 28 Schroeder KW, Tremaine WJ, Ilstrup DM. Coated oral 5-aminosalicylic acid therapy
9 D’Haens GR. Top-down therapy for IBD: rationale and requisite evidence. Nat Rev for mildly to moderately active ulcerative colitis. A randomized study. N Engl J Med
Gastroenterol Hepatol 2010;7:86–92. 1987;317:1625–9.
10 D’Haens G, Baert F, van Assche G, et al. Early combined immunosuppression or 29 Beaugerie L, Seksik P, Nion-Larmurier I, et al. Predictors of Crohn’s disease.
conventional management in patients with newly diagnosed Crohn’s disease: an open Gastroenterology 2006;130:650–6.
randomised trial. Lancet 2008;371:660–7. 30 Ferrante M, Henckaerts L, Joossens M, et al. New serological markers in
11 McKinney EF, Lyons PA, Carr EJ, et al. A CD8+ T cell transcription signature predicts inflammatory bowel disease are associated with complicated disease behaviour. Gut
prognosis in autoimmune disease. Nat Med 2010;16:586–91. 2007;56:1394–403.
12 Lee JC, Lyons PA, McKinney EF, et al. Gene expression profiling of CD8+ T cells 31 Lee JC, Biasci D, Roberts R, et al. Genome-wide association study identifies distinct
predicts prognosis in patients with Crohn disease and ulcerative colitis. J Clin Invest genetic contributions to prognosis and susceptibility in Crohn’s disease. Nat Genet
2011;121:4170–9. 2017;49:262–8.
13 McKinney EF, Lee JC, Jayne DR, et al. T-cell exhaustion, co-stimulation and clinical 32 Paik S, Shak S, Tang G, et al. A multigene assay to predict recurrence of tamoxifen-
outcome in autoimmunity and infection. Nature 2015;523:612–6. treated, node-negative breast cancer. N Engl J Med 2004;351:2817–26.
14 Wherry EJ. T cell exhaustion. Nat Immunol 2011;12:492–9. 33 Tang G, Shak S, Paik S, et al. Comparison of the prognostic and predictive utilities of
15 Bengsch B, Ohtani T, Khan O, et al. Epigenomic-guided mass cytometry the 21-gene Recurrence Score assay and Adjuvant! for women with node-negative,
profiling reveals disease-specific features of exhausted CD8 T Cells. Immunity ER-positive breast cancer: results from NSABP B-14 and NSABP B-20. Breast Cancer
2018;48:1029–45. Res Treat 2011;127:133–42.
16 Lyons PA, Koukoulaki M, Hatton A, et al. Microarray analysis of human leucocyte 34 Parkes M, Noor NM, Dowling F, et al. PRedicting outcomes for Crohn’s dIsease using a
subsets: the advantages of positive selection and rapid purification. BMC Genomics moLecular biomarkEr (PROFILE): protocol for a multicentre, randomised, biomarker-
2007;8:64. stratified trial. BMJ Open 2018;8:e026767.
10 Biasci D, et al. Gut 2019;0:1–10. doi:10.1136/gutjnl-2019-318343The first validated
prognostic test for Crohn’s
and ulcerative colitis
1,000+
Patients tested to date
• Stratify patients by risk of frequently
relapsing disease
• Personalise treatment in the window of
opportunity
• Enable tight control and monitoring of
disease
predictimmune.com/predictsure-ibd
IBD0058 | version 1 | April 2020You can also read