Higher Levels of Neanderthal Ancestry in East Asians than in Europeans
←
→
Page content transcription
If your browser does not render page correctly, please read the page content below
INVESTIGATION

                                       Higher Levels of Neanderthal Ancestry in East
                                                           Asians than in Europeans
                          Jeffrey D. Wall,*,†,1 Melinda A. Yang,‡ Flora Jay,‡ Sung K. Kim,*,2 Eric Y. Durand,‡,3 Laurie S. Stevison,*
                                      Christopher Gignoux,* August Woerner,§ Michael F. Hammer,§ and Montgomery Slatkin‡
                       *Institute for Human Genetics and †Department of Epidemiology and Biostatistics, University of California, San Francisco, California
                          94143, ‡Department of Integrative Biology, University of California, Berkeley, California 94720, and §Department of Arizona
                                                                                  Research Laboratories, University of Arizona, Tucson, Arizona 85721

ABSTRACT Neanderthals were a group of archaic hominins that occupied most of Europe and parts of Western Asia from 30,000 to
300,000 years ago (KYA). They coexisted with modern humans during part of this time. Previous genetic analyses that compared
a draft sequence of the Neanderthal genome with genomes of several modern humans concluded that Neanderthals made a small (1–
4%) contribution to the gene pools of all non-African populations. This observation was consistent with a single episode of admixture
from Neanderthals into the ancestors of all non-Africans when the two groups coexisted in the Middle East 50–80 KYA. We examined
the relationship between Neanderthals and modern humans in greater detail by applying two complementary methods to the
published draft Neanderthal genome and an expanded set of high-coverage modern human genome sequences. We find that,
consistent with the recent finding of Meyer et al. (2012), Neanderthals contributed more DNA to modern East Asians than to modern
Europeans. Furthermore we find that the Maasai of East Africa have a small but significant fraction of Neanderthal DNA. Because our
analysis is of several genomic samples from each modern human population considered, we are able to document the extent of
variation in Neanderthal ancestry within and among populations. Our results combined with those previously published show that
a more complex model of admixture between Neanderthals and modern humans is necessary to account for the different levels of
Neanderthal ancestry among human populations. In particular, at least some Neanderthal–modern human admixture must postdate
the separation of the ancestors of modern European and modern East Asian populations.

N    EANDERTHALS were a group of archaic hominins that
     occupied large parts of Europe and West Asia from
30,000 to 300,000 years ago (KYA) (Stringer and Hublin
                                                                                      et al. 1999; Trinkaus 2007). Initial comparisons of Neander-
                                                                                      thal and modern human DNA found no evidence for a Nean-
                                                                                      derthal contribution to the modern human gene pool
1999; Hublin 2009). Their disappearance in the fossil record                          (Krings et al. 1997; Serre et al. 2004; Noonan et al. 2006).
often coincides with the first appearance of anatomically                              However, indirect studies of patterns of linkage disequilib-
modern humans (AMH) in that region (Finlayson 2004).                                  rium (LD) in contemporary human populations have consis-
Where, when, and how often Neanderthals interbred with                                tently found support for admixture between “archaic”
expanding AMH populations is still an open question. Mor-                             human groups (such as Neanderthals) and modern humans
phological studies have generally concluded that Neander-                             (Garrigan et al. 2005a,b; Plagnol and Wall 2006; Wall et al.
thals made little or no contribution to present-day human                             2009; Hammer et al. 2011; Lachance et al. 2012).
populations (Stringer and Andrews 1988; Lahr 1994), but                                  A detailed analysis of a draft Neanderthal genome and
others have suggested there was some admixture (Duarte                                five low-coverage (4·) human sequences estimated that
                                                                                      Neanderthals made a 1–4% contribution to the gene pool
Copyright © 2013 by the Genetics Society of America
                                                                                      of modern non-African populations (Green et al. 2010). The
doi: 10.1534/genetics.112.148213                                                      presence of “Neanderthal DNA” in East Asians and Melane-
Manuscript received November 30, 2012; accepted for publication February 4, 2013      sians was initially surprising because the archaeological re-
Supporting information is available online at http://www.genetics.org/lookup/suppl/
doi:10.1534/genetics.112.148213/-/DC1.                                                cord shows that Neanderthals and early modern humans
1
 Corresponding author: 513 Parnassus Ave., S965, San Francisco, CA 94143.             coexisted only in Europe and western Asia. Green and
 E-mail: wallj@humgen.ucsf.edu
2
  Present address: Sequenom, Inc., San Diego, CA 92121.
                                                                                      colleagues hypothesized that Neanderthals and modern
3
  Present address: 23andMe, Mountain View, CA 94043.                                  humans came into contact and interbred in the Middle East

                                                                                                        Genetics, Vol. 194, 199–209 May 2013          199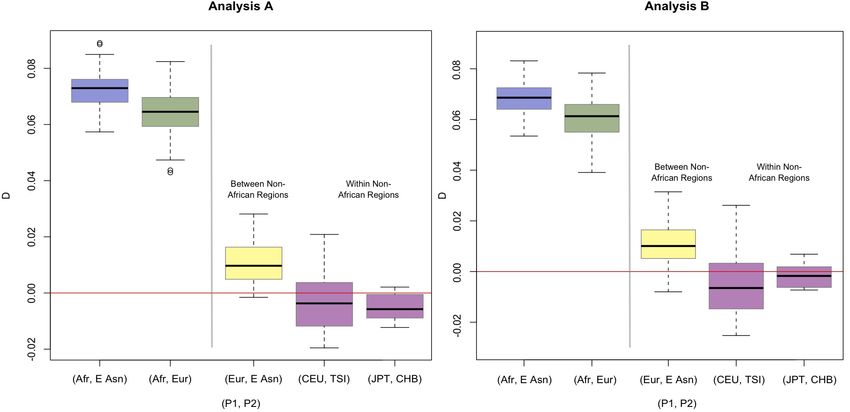
50–80 KYA, prior to the divergence of modern-day Euro-
pean and Asian populations.
    Green et al. (2010) presented three kinds of evidence in
favor of interbreeding. First, they found (using D-statistics,
a new measure of genetic similarity introduced in that arti-
cle) that the three sampled non-African genome sequences
(from a French, a Han Chinese, and a Papua New Guinean)
are more similar to the Neanderthal sequence than is either
of the two sampled African sequences (from a San and a Yor-
uban). Second, they identified several haplotypes that are in
low frequency in Europeans, absent from Africans, and pres-
ent in the Neanderthal sequence, which suggests those hap-
lotypes were derived from Neanderthals. Third, they found
many more genomic fragments in a European genome than
in an African genome that have low divergence to the Ne-
anderthal genome.
    Admixture between modern humans and Neanderthals
within the past 100,000 years (Kyr) is only one possible
explanation for these D-statistic patterns. Green et al. noted
that another potential explanation is ancient population sub-
division within Africa before both Neanderthals and modern
humans left Africa (cf. Green et al. 2010, figure 6). If there
had been long-lived (e.g., .500 Kyr) population structure
within Africa, and both Neanderthals and non-African AMH
came from the same “source” subpopulation, then Neander-
thals would be more similar to non-Africans in the absence
of any recent admixture between AMH and Neanderthals
(see Figure 1A). This intuitive argument was confirmed by
the simulation studies of Durand et al. (2011) and Eriksson
and Manica (2012), but these studies did not account for the
other two lines of evidence summarized above. Two other
studies have shown that the ancient-subdivision model is
incompatible with other aspects of the data. Yang et al.
                                                                  Figure 1 Simplified versions of models of ancient population structure (A)
(2012) demonstrated that recent admixture (Figure 1B)             or recent admixture (B) that can explain the observed levels of divergence
could be distinguished from ancient subdivision (Figure           between modern human genomes and the draft Neanderthal genome.
1A) by computing the frequency spectrum of modern                 Here T1 is the time when Neanderthals and modern humans first split,
humans, conditioned on the Neanderthal sequence having            T2 is the time when African and non-African modern human populations
                                                                  split, and T3 is the time when Neanderthals mixed with modern humans.
the derived allele and an African sequence having the an-
cestral allele. This double conditioning enriches for alleles
introduced by recent admixture if it occurred. Yang and           D-statistics among pairs of individuals from the same two
colleagues found that the doubly conditioned frequency            populations and obtain greater statistical power by combin-
spectrum in Europeans and in East Asians is consistent with       ing estimates among all pairs. The second method is an LD-
recent admixture, not with ancient subdivision. Separately,       based method similar to one introduced by Wall (2000) and
an analysis of the extent of LD at closely linked sites also      Plagnol and Wall (2006) for identifying putatively intro-
concluded that the data were consistent with recent admixture     gressed regions in modern human genomes. We use the
and not with ancient subdivision (Sankararaman et al. 2012).      draft Neanderthal genome to identify segments in the mod-
    In this study, we revisit the question of Neanderthal         ern human genome that were derived from admixture with
admixture, using an expanded data set of 42 high-coverage         Neanderthals. This method is similar to the one used by
(.45·) modern human genomic sequences, and we take                Green et al. (2010) but is less restrictive and allows quanti-
advantage of the recent high-coverage Denisova genome             fication of the differences in the number of admixed seg-
(Meyer et al. 2012) to obtain more refined estimates of            ments in different populations.
admixture proportions. We use two complementary meth-                Using both of these methods, we show there was more
ods of analysis. One is the D-statistic method introduced by      Neanderthal admixture into East Asian populations than
Green et al. (2010). D-statistics reflect site-by-site differen-   into European populations. This conclusion is consistent
ces. Because we have multiple individuals from each of sev-       with that of Meyer et al. (2012), which was based on the
eral populations, we can quantify the extent of variation in      analysis of a smaller number of modern human sequences.

200    J. D. Wall et al.
By using the high-coverage Denisova genome, we are able to        Table 1 Forty-two individual genome sequences from Complete
show that the admixture rate into East Asians is 40% higher       Genomics included in our study
than into Europeans. We conclude that admixture between           ID              Population             ID             Population
Neanderthals and modern humans did not occur at a single          NA06985            CEU              NA21732                  MKK
time and place, as suggested by Green et al. (2010). Some of it   NA06994            CEU              NA21733                  MKK
had to have occurred after the separation of East Asians and      NA07357            CEU              NA21737                  MKK
Europeans. Further, we show that there was significant Nean-       NA10851            CEU              NA21767                  MKK
                                                                  NA12004            CEU              NA18940                  JPT
derthal admixture into the Maasai population of East Africa,
                                                                  NA12889            CEU              NA18942                  JPT
probably because of secondary contact with a non-African pop-     NA12890            CEU              NA18947                  JPT
ulation rather than admixture directly from Neanderthals.         NA12891            CEU              NA18956                  JPT
                                                                  NA12892            CEU              NA20502                  TSI
                                                                  NA18526            CHB              NA20509                  TSI
                                                                  NA18537            CHB              NA20510                  TSI
Materials and Methods                                             NA18555            CHB              NA20511                  TSI
Complete genomics data                                            NA18558            CHB              NA18501                  YRI
                                                                  NA20845            GIH              NA18502                  YRI
We downloaded data from 69 publicly available genome              NA20846            GIH              NA18504                  YRI
sequences from the Complete Genomics (CGI) website                NA20847            GIH              NA18505                  YRI
                                                                  NA20850            GIH              NA18508                  YRI
(http://www.completegenomics.com/public-data/). Com-
                                                                  NA19017            LWK              NA18517                  YRI
plete Genomics sequenced a Yoruba (YRI) trio, a Centre            NA19020            LWK              NA19129                  YRI
d’Etude du Polymorphisme Humain (CEPH)/Utah (CEU)                 NA19025            LWK              NA19238                  YRI
pedigree family of 17 family members, a Puerto Rican              NA19026            LWK              NA19239                  YRI
(PUR) trio, and a diversity panel from 10 different popula-
tions. Combining these data sets and using only nonrelated,
nonadmixed individuals, we have a sample size of 42 indi-         in September 2011. This version was mapped to the human
viduals representing nine different populations (Table 1). In     reference genome hg19. We also downloaded the chimpan-
addition to 36 members of the diversity panel, we also used       zee genome pantro2 aligned to hg19 from the University of
the parents from the YRI trio and the maternal and paternal       California, Santa Cruz (UCSC) Genome Browser (http://
grandparents in the CEU pedigree. The individual genomes          hgdownload.cse.ucsc.edu/goldenPath/hg18/vsPanTro2/).
were sequenced to a minimum 45-fold coverage (Drmanac             The Neanderthal sequence was obtained by pooling reads
et al. 2010). The eight populations are Utah residents with       from the three Vindija bones (SL Vi33.16, SL Vi33.25, and SL
Northern and Western European ancestry from the CEPH              Vi33.26) that were aligned to the reference human genome
collection (CEU); Han Chinese from Beijing, China (CHB);          (Green et al. 2010). The Neanderthal data were down-
Gujarati Indians from Houston (GIH); Japanese from Tokyo          loaded from the UCSC genome browser (http://genome.
(JPT); Luhya from Webuye, Kenya (LWK); Maasai from                ucsc.edu/Neandertal/). To match the filtering used in the
Kinyawa, Kenya (MKK); Toscani from Italy (TSI); and Yor-          original Green et al. (2010) study, we used only sites with
uba from Ibadan, Nigeria (YRI). Samples from three other          a mapping quality score (MAPQ) of at least 90 and a se-
populations were also available from Complete Genomics,           quence quality .40. On average, the coverage of the Nean-
those of Mexican ancestry in Los Angeles (MXL), African-          derthal genome was 1.3-fold. We kept only sites that had
Americans from southwest Arizona (ASW), and Puerto                one, two, or three reads.
Ricans from Puerto Rico (PUR), but these were excluded               After filtering out any insertions, deletions, or ambigu-
from our analysis because of recent intercontinental admix-       ously called sites in the Complete Genomics data, we
ture. All genomic data were downloaded from Complete              merged them with the chimpanzee and Neanderthal
Genomics’ ftp site (ftp://ftp2.completegenomics.com/).            genomes. We kept only sites that had no more than two
We used two separate pipelines for filtering and processing        alleles in any of the human genomes and at which alleles
the data, optimized for the different analyses performed          were called for each human, the chimp, and the Neander-
(see below).                                                      thal. Furthermore, we considered only transversion
                                                                  differences.
D-statistic filtering
                                                                     We also obtained the high-coverage Denisova genome
For the D-statistic analyses, each individual genome was          from Meyer et al. (2012). The genome was aligned to the
aligned with the human genome assembly hg19 for consis-           human reference genome (hg19) and the average coverage
tency with the available assembly of the Neanderthal ge-          was 30x. We filtered out all sites that had ,16 reads or
nome. Since our results were somewhat unexpected, we              .46 reads. We merged these data with the data from anal-
prepared the data for analysis in two different ways to check     ysis A to compute the D-statistic and f-statistic.
for consistency. We denote these analysis A and analysis B.          For analysis B, we redownloaded the genomic data from the
   For analysis A, we used the release of the file format          Complete Genomics website (ftp://ftp2.completegenomics.
version 2.0 (software version 2.0.0.26) that was generated        com/, software version 2.0.2.15, file format version 2.0,

                                                                                           Neanderthal Ancestry in Eurasians     201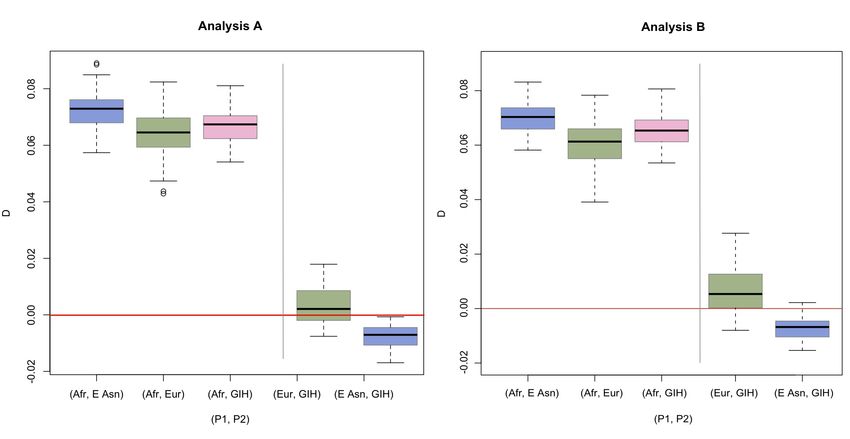
February 2012). These sequences were aligned to hg18. We        regions that included sites where over half of the individuals
applied a less stringent filter of the Neanderthal data: the     are heterozygous and only one homozygous genotype is
filtering for mapping quality and sequence quality remained      present. The coordinates for these regions are available from
the same as in analysis A, but there were no restrictions       the authors upon request.
on the number of reads per site. Finally, instead of consid-       Denisova sequence reads (Reich et al. 2010), mapped
ering the chimp genome as the outgroup, we used the an-         to the human reference genome hg18, were downloaded
cestral alleles defined by the 1000 Genomes Project from the     from the UCSC genome browser (http://genome.ucsc.edu/
Enredo-Pecan-Ortheus (EPO) pipeline (Paten et al. 2008a,b)      cgi-bin/hgTrackUi?db=hg18&c=chrX&g=bamSLDenisova).
(data downloaded from ftp://ftp.1000genomes.ebi.ac.uk/).        Consensus Neanderthal sequence generated from three bones
We refer to this outgroup as the reconstructed common           and aligned to the human reference genome hg18 was down-
ancestor (RCA).                                                 loaded from the Ensembl genome browser (http://neandertal.
    For samples from any two populations compared, we           ensemblgenomes.org/data_info.html). Samtools 0.1.18 (Li
filtered out any insertions, deletions, or ambiguously called    et al. 2009) was used to convert the BAM files into a pileup
sites. These genomic samples were then merged with the          alignment (mpileup arguments: -B -q5 -Q30) of each an-
Neanderthal genome and the RCA outgroup. This differs           cient hominin genome and hg18 for the region of interest.
from analysis A, where all populations were merged with         To compare modern human sequence tracks to ancient
the Neanderthal, Denisova, and chimp genome prior to any        hominin sequences, hg19 coordinates of interest were
comparisons between populations. We considered only sites       converted to hg18 coordinates using the UCSC genome
where the difference between the ancestral allele from the      browser tool liftOver and extracted from the pileup align-
RCA and the alternate allele is a transversion, as we did in    ments via custom perl scripts. To further compare the hu-
analysis A.                                                     man sequences to sequences of other primate genomes,
                                                                another custom perl script was used to extract the same
LD-based analysis filters
                                                                hg19 coordinates of interest from a subset of the genomes
Since the LD-based analyses primarily utilize patterns of       in the UCSC MultiZ alignments found at http://hgdownload.
extant genetic variation (and only secondarily use the draft    cse.ucsc.edu/goldenPath/hg19/multiz46way/. Computa-
Neanderthal genome), we aligned variant calls to the            tions were performed using the University of California,
updated human genome assembly (hg19), included both             San Francisco, Biostatistics High-Performance Comput-
transitions and transversions, and imposed more stringent       ing System.
filters to throw out repetitive regions. Specifically, a custom
series of Perl/C scripts and cgatools v1.3.0.9 were used to     D-statistics and estimates of admixture rates
get a common set of variants from each individual. Using
the CGI’s variant file, all polymorphic regions containing       D-statistics, introduced by Green et al. (2010), are summary
SNPs were identified and reconstructed according to CGI’s        statistics for genome sequences from four populations. Two
descriptions. These regions were then filtered for SNPs in       populations, P1 and P2, are compared to a test population,
such a way that both alleles were known for a given in-         P3. The fourth population P4 is used as an outgroup to de-
dividual and were not part of a complex variant (for exam-      termine which allele is ancestral at each site. In our case, P4
ple, a SNP on one haploid phase and a deletion on the           is the chimpanzee reference sequence (pantro2) denoted by
other phase). We then pooled all unique SNP positions           C, and P3 is the Neanderthal sequence, denoted by N. P1 and
from the full panel of samples and removed all SNPs lo-         P2 are two human sequences. The chimp reference sequence
cated within repeats and segmental duplications with            is assumed to have the ancestral allele, denoted by A. D is
a minimum size of 50 bp. Structural variants (dgv track         computed only for sites at which both of the Neanderthal
on UCSC), self chain (identity ,90%, UCSC self-chain            and one but not both of the human sequences have a differ-
track), segmental duplications (UCSC), microsatellites          ent allele, assumed to be derived and denoted by B. That is,
(UCSC), simple tandem repeats (UCSC), and repeat                only those sites with configurations ABBA and BABA are
masked sequence (UCSC) were also excluded. The final list        used, where the order is P1, P2, P3, P4. The requirement that
of SNPs was then used by CGI’s “snpdiff” tool to extract each   two copies of both the derived and the ancestral alleles be
sample’s base calls relative to the human reference genome      present greatly reduces the effect of sequencing error
(hg19, Build 37). The snpdiff output was then reformatted       (Durand et al. 2011).
to ms, PLINK, and other text-based formats for further              When only a single sequence from each population is
analyses.                                                       available,
   Subsequently, we identified numerous regions where all/                                               nABBA 2 nBABA
most individuals had heterozygous SNP calls but only one                      DðP1 ; P2 ; P3 ; P4 Þ ¼                 ;    (1)
                                                                                                        nABBA þ nBABA
homozygous genotype was present. These regions likely
reflect either alignment errors due to the Complete              where nABBA and nBABA are the numbers of sites with each of
Genomics short-read sequencing technology or errors in          the two configurations. When diploid sequences from each
the human reference genome sequence. We excluded all            individual from P1 and P2 are available, then

202    J. D. Wall et al.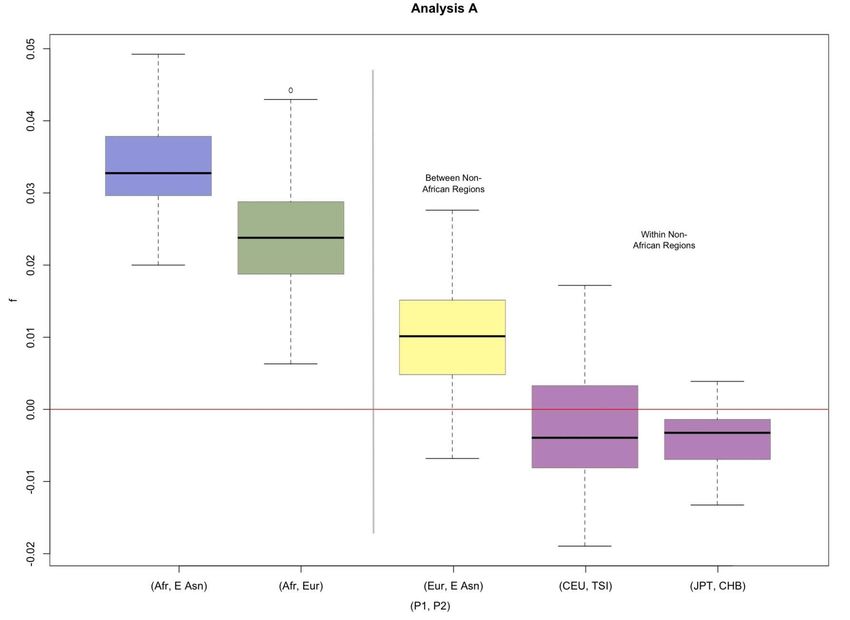
P         ð1Þ ð2Þ P ð1Þ     ð2Þ
                            i ð1 2 pi Þpi 2  pi ð1 2 pi Þ
DðP1 ; P2 ; P3 ; P4 Þ ¼    P        ð1Þ ð2Þ P ð1Þ     ð2Þ
                                                          ;   (2)
                            i ð1 2 pi Þpi þ  pi ð1 2 pi Þ
          ð1Þ        ð2Þ
where pi and pi are the frequencies of the derived allele
(0, 0.5, 1) in the individual in P1 and P2, respectively at site
i. Equation 2 is equivalent to sampling one of the chromo-
somes at random from P1 and P2 and then using Equation 1.
    Green et al. (2010) and Durand et al. (2011) showed that
the expected value of D is 0 if P1 and P2 form a clade and P3
is the outgroup. These articles also showed that if there was
admixture from P3 into P2, then E(D) . 0. The magnitude of
D depends on the admixture proportion f and on the pop-
ulation divergence times and various effective population           Figure 2 Schematic of a model of recent and ancient population struc-
                                                                    ture without admixture used in simulations. See text for details.
sizes.
    Reich et al. (2010) showed that if there is a sister group
of P3, which we call P5, that has not admixed with P1, P2,
                                                                    The elements of M1 are D(G1,i, G3,j, N, C), where G1,i and G3,j
or P3, then it is possible to estimate f directly. In our case,
                                                                    are the ith and jth individuals in G1 and G3 (i = 1, . . . , k1;
P 5 is the Denisovan genome. To estimate f, we define
                                                                    j = 1, . . . , k3). The elements of M2 are D(G2,i, G3,j, N, C). M1
SðP1 ; P2 ; P3 ; P4 Þ to be the numerator of either Equation 1
                                                                    has k3 rows and k1 columns, and M2 has k3 rows and k2
or Equation 2. Then
                                                                    columns. From M1 and M2 the average D’s are computed, D1
                                                                    and D2. The problem is to test whether D1 = D2. A t-test
                           ^f ¼ SðP1 ; P2 ; P5 ; P4 Þ:        (3)
                                SðP1 ; P3 ; P5 ; P4 Þ               cannot be used because the elements within each matrix are
                                                                    not independent of each other and because the same refer-
The intuition behind this estimator is that the denomina-           ence population (G3) is used to compute both matrices. In-
tor quantifies the excess coalescent events that occur               stead, we combine M1 and M2 into a single matrix with k3
between lineages in P3 and P5 because they are sister               rows and k1 + k2 columns. Then we randomize the columns
groups. Lineages in P2 that are introduced by admixture             and compute D1 for the matrix containing the first k1 col-
have the same coalescent history as all lineages from P3.           umns and D2 for the matrix containing the last k2 columns.
Hence, the ratio is the fraction of lineages in P2 that trace       Then we compare the observed D1 – D2 with the distribution
their ancestry to P3 because of admixture (Reich et al.             of differences from the randomized matrices. We used
2010). In our application of this method, we are assuming           a two-tailed test and 1 million replicates for each test.
that there is no admixture from Denisovans (P5) into the               Test 2 is similar to test 1, but because we compare only
other populations (P1, . . . , P4). Although Skoglund and           G1 and G2, a subset of one population is used in place of the
Jacobsson (2011) have argued that there was admixture               reference population, G3. For the population with the larger
from Denisovans into East Asians, our results described             sample size (say G1), we create a random partition ðGa1 ; Gb1 Þ
below did not find evidence of this admixture for the                subject to the constraint that they differ in number by no
Han Chinese and Japanese samples we analyzed. For anal-             more than one. For M1, we compute D for all pairs of indi-
ysis A, we explored the variation in estimated D-statistics         viduals in Ga1 and G2. The elements of M2 are
and admixture rates (f) for all pairs of individuals of dif-        DðGa1;i ; Gb1;j ; N; CÞ, where Ga1;i and Gb1;j are the ith and jth
ferent human populations. For analysis B, since we did              individuals in the two subpopulations created by the parti-
not include the Denisova genome, we estimated only D-               tion. Test 1 is then applied to M1 and M2.
statistics.                                                            We also calculated the f-statistics for each pair of indi-
                                                                    viduals. Using the same randomization tests as described
                                                                    above, we determined whether there were significant differ-
Randomization tests
                                                                    ences between populations in estimates of the admixture
We computed D for each pair of individuals, both within             rate. Significant differences observed using the admixture
populations and between populations. We developed two               rate suggest that the effect is truly due to the Neanderthal
randomization tests of statistical significance. Both are sim-       and not admixture with Denisovans.
ilar to the Mantel test. Test 1 tests whether the average D
                                                                    Identifying putative archaic human regions
computed for one pair of populations is significantly larger
than for another pair, and test 2 tests whether the average D       Previous work has shown that archaic admixture often leads
for a pair of populations differs significantly from 0.              to long, divergent haplotypes at low frequency (Wall 2000;
    For test 1, we start with sequences from three human            Plagnol and Wall 2006). We define two SNPs to be “congru-
populations, G1, G2, and G3, each containing k1, k2, and k3         ent” if their diploid allele counts (i.e., zero, one, or two
diploid sequences. We compute two matrices of D values.             counts of a particular allele) across individuals are

                                                                                                Neanderthal Ancestry in Eurasians    203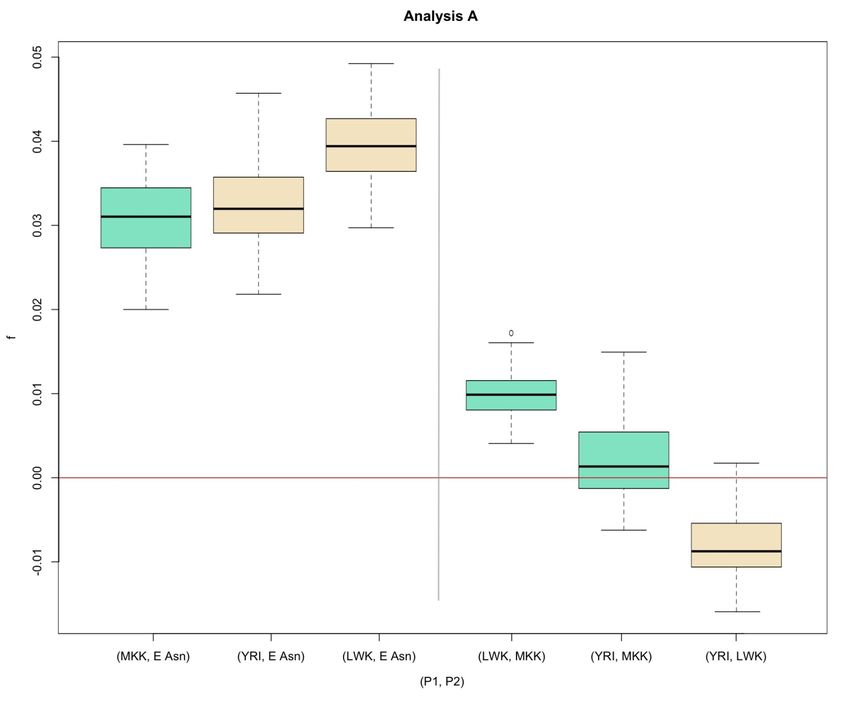
completely correlated (i.e., r2 = 1). We define the maximum         Identifying putative Neanderthal regions
number of pairwise congruent SNPs to be ld and denote the
                                                                   To identify which of the 2254 regions described above were
collection of rarer (minor allele frequency # 0.5) alleles at
                                                                   likely to reflect recent Neanderthal admixture, we imposed
each of these pairwise congruent sites to be the putative
                                                                   the following additional criteria on the putative archaic
archaic haplotype. From the filtered Complete Genomics
                                                                   human haplotypes:
data, we then identified all regions from 8 to 100 kb in
length where ld $ 30 and ld/S $ 0.1, where S is the total          1. The Neanderthal allele must be called at $12 SNPs and
number of polymorphic sites in the region. When identified             match the putative archaic haplotype at $70% of these
regions overlapped, we took the region with the largest               SNPs.
value of ld/S. We also required that neighboring regions           2. The Neanderthal allele and the chimp allele must be
with putative archaic haplotypes congruent with each other            called at $8 SNPs and the Neanderthal allele must be
be separated by at least 200 kb, to avoid double counting             derived (relative to chimp) at $60% of these sites.
long archaic haplotypes. A total of 2254 regions were iden-        3. The putative archaic haplotype must be at low frequency
tified. Of these, 411 were private to the non-African                  (,5%) in the sub-Saharan African samples.
samples.
                                                                   The motivation for criterion 1 is obvious, and we note that
    To estimate what proportion of these regions might be
                                                                   a more stringent cutoff was not used due to the poor quality
false positives, we simulated whole-chromosome sequence
                                                                   of the Neanderthal genome sequence. Criterion 2 was
data (Chen et al. 2009) under a model that incorporated
                                                                   implemented to cut down on regions that reflect shared
both recent (intracontinental) and ancient (intercontinen-
                                                                   ancestral polymorphism between modern humans and
tal) population structure (Figure 2). Specifically, we assume
                                                                   Neanderthals; it is based on an observation of Noonan
a panmictic ancestral population split into two daughter
                                                                   et al. (2006) that recent Neanderthal admixture will lead to
populations at time T0 = 0.6 (using the standard coalescent
                                                                   an increase in SNPs where Neanderthals have the derived
scaling of 4N generations), with (symmetric) scaled migra-
                                                                   allele. Finally, criterion 3 reflects our prior belief that admix-
tion rate of M0 = 5. At time T1 = 0.05 – 0.053, one of the
                                                                   ture with Neanderthals did not occur in Africa and that the
ancestral populations (i.e., the “non-African” one) experien-
                                                                   presence of Neanderthal alleles in Africa could reflect only
ces a population bottleneck resulting in a 100-fold reduction
                                                                   more recent migration patterns. A total of 226 regions were
in population size. Then, at time T2 = 0.045, each popula-
                                                                   identified that meet these additional criteria. We note in
tion splits into two descendant populations, connected by
                                                                   passing that the specific cutoffs used in criteria 1–3 are
migration rate M1 = 8. While arbitrary, this model attempts
                                                                   somewhat arbitrary, but our qualitative conclusions are
to incorporate the major features of human demographic
                                                                   unchanged under a range of similar criteria (results not
history, including intra- and intercontinental population
                                                                   shown).
structure and a bottleneck in the history of non-African pop-
                                                                       We implemented a simple permutation test to assess the
ulations, and is similar to the model used by Yang et al.
                                                                   statistical significance of the observed difference in frequen-
(2012). The results described below are qualitatively similar
                                                                   cies of Neanderthal regions in East and South Asians and
if other plausible values for the times and migration rates
                                                                   Europeans. Specifically, we kept the presence/absence of
are used (results not shown). Using N = 10,000 and an
                                                                   Neanderthal regions for each individual constant and
average generation time of 25 years, each unit of scaled time
                                                                   randomly permuted the geographic label (i.e., “European”
corresponds to 1 million years.
                                                                   vs. “East Asian”) of the sample 100,000 times. Similar anal-
    We simulated 30 different 100-Mb chromosomes, using
                                                                   yses were used to compare the frequency of Neanderthal
the model described above with mutation parameter u =
                                                                   regions in Maasai vs. other sub-Saharan African samples.
3.5 · 1024/bp, recombination parameter r = 4 · 1024/bp,
and 10 individuals sampled from each of the four extant            Identifying putative Denisovan regions
populations. The simulated number of segregating sites was
substantially higher than the actual number in our filtered         Excluding the 226 Neanderthal regions identified above, we
data. Since average ld values are positively correlated with       screened the remaining 2028 putative archaic regions for
levels of diversity, the simulated ld values are higher on aver-   Denisovan admixture, using the same criteria as for Nean-
age than expected in real data, and our choice of u is conser-     derthals. Thirty total regions fit these criteria.
vative. Also, standard estimates of r are generally higher than
                                                                   Estimating local ancestry in the Maasai
the value we took (Myers et al. 2005), which is also conser-
vative for our purposes. We then tabulated the total number        We took the filtered Complete Genomics data described at
of regions with ld $ 30, ld/S $ 0.1, and with divergent hap-       the start of this section and estimated SNP allele frequencies
lotype SNPs private to the simulated non-African samples. We       separately in the 13 European samples and the 13 non-
identified a total of 3 regions that satisfied these criteria,       Maasai African samples. These were used as proxies for the
compared with 411 regions that were identified from the             (unknown) non-African and African ancestral populations.
actual data. This leads to an estimate of a false discovery rate   We then included only those SNPs with allele frequencies
of q , 0.01.                                                       that differ by at least 0.3 in our analyses. We calculated the

204    J. D. Wall et al.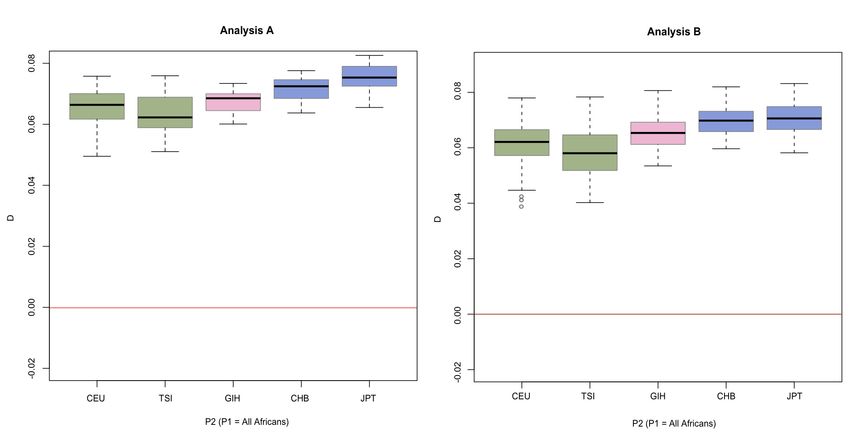
Figure 3 Summary of significance tests for av-
                                                                                       erage values of D. Positive values indicate that
                                                                                       the second sequence is more similar to the Ne-
                                                                                       anderthal genome than the first sequence. In all
                                                                                       parts, the box plots indicate the range of D
                                                                                       values obtained for pairs of individuals from
                                                                                       the populations indicated. A and B are box
                                                                                       plots of individual D-statistics computed for
                                                                                       each individual from the specified population
                                                                                       compared with each Yoruban. P-values are
                                                                                       from the randomization test, test 1, of signifi-
                                                                                       cant differences in the average D values for
                                                                                       different pairs of populations. C and D show
                                                                                       box plots of individual D-statistics computed
                                                                                       for every pair of individuals in the specified pop-
                                                                                       ulations. P-values are from the randomization
                                                                                       test, test 2, of significant differences of the av-
                                                                                       erage D from 0. See also Table S2.

likelihood of each ancestral configuration (i.e., zero, one, or   remains to be established. Also, we find evidence for a small
two alleles inherited from the non-African population) sep-      but significant amount of Neanderthal admixture into the
arately for each SNP. Then, over sliding windows of 1 Mb,        Maasai genomes (P  0.03, Table S4). When compared to
we formed a composite likelihood by multiplying together all     the Yoruba, the Maasai have a higher average D than the
of the single-SNP likelihoods contained in the window and        Luhya (Figure 3B, Table S4). When the Maasai are com-
tabulated which ancestral configuration had the highest           pared to all other African samples, the average D is positive
(composite) likelihood. For each SNP, we then used majority      (Figure 3D). In addition, when East Asians and Europeans
rule to make ancestry calls, using all windows containing the    are compared to the Maasai, the average D’s are somewhat
SNP in question. See Wall et al. (2011) for further details.     lower than when they are compared to either the Yoruba or
                                                                 the Luhya. The P-values shown in Figure 3, A and B are from
                                                                 test 1 and those in Figure 3, C and D are from test 2.
Results                                                              Table S1, Table S2, and Table S3 show estimated values
D-statistics and estimates of f                                  of f. The estimates of the admixture rate show that when we
                                                                 incorporate the Denisovan genome into our analysis, the
The D-statistics and estimates of f we computed are summa-       admixture rate between East Asians and Neanderthals
rized in Figure 3 and Supporting Information, File S1, Table     remains significantly higher than the admixture rate be-
S1, Table S2, Table S3, Table S4, Table S5, Table S6, Table      tween Europeans and Neanderthals (P  0.001, Table S7).
S7, Table S8, Table S9, Figure S1, Figure S2, Figure S3,         The Maasai remain significantly more genetically similar to
Figure S4, Figure S5, Figure S6, Figure S7, and Figure S8.       the Neanderthals when compared to the Luhya (P  0.03,
Several features of the results are notable. First, we find       Table S7), but the observed significant difference for the D-
evidence for more Neanderthal admixture into the East            statistic when comparing the Maasai and the Yoruba is not
Asian samples than into the European samples (P =                observed for the f-statistic (P  0.34, Table S7), which prob-
0.001)—consistently higher D values result when East             ably reflects the lower power of using f as a test statistic. The
Asians are compared to one of the African populations than       admixture rates for the South Asians give the same results as
when Europeans are compared (Figure 3A, Table S4), and           those for the D-statistic (Table S9).
the average D is positive when East Asians are compared to
Europeans (Figure 3C, Table S5). In analysis B, comparisons
                                                                 Identifying “Neanderthal haplotypes”
with the South Asian samples are intermediate with respect
to the European and East Asian samples but not in analysis       Our new method for identifying introgressed Neanderthal
A, indicating that the South Asian sample differs from the       fragments in human populations detected 226 different
East Asian ones but the degree of similarity to Europeans        putative Neanderthal regions. The relative frequencies of

                                                                                           Neanderthal Ancestry in Eurasians        205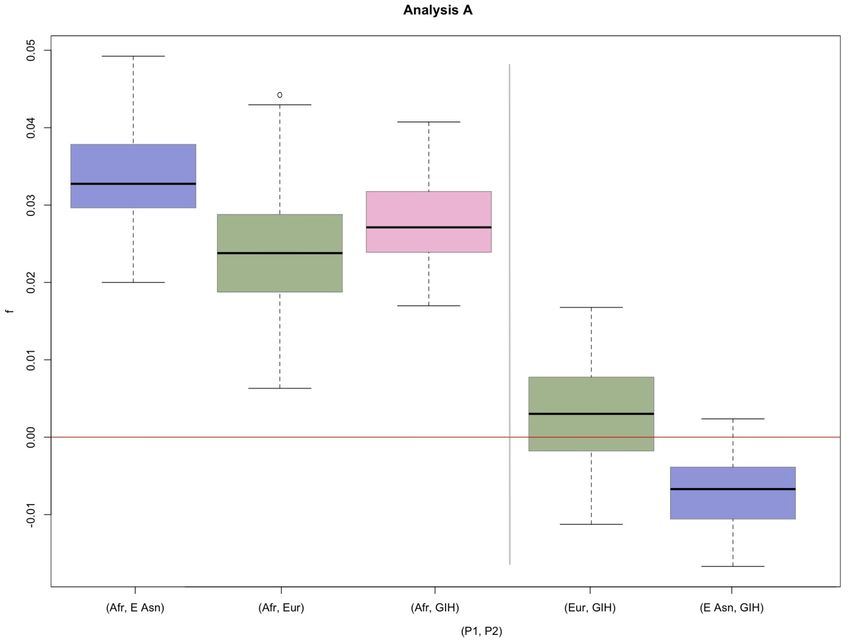
Figure 4 Distribution of the number of putative Neander-
                                                                              thal regions for each Eurasian individual. European
                                                                              genomes are colored in green, East Asian genomes are
                                                                              colored in red, and South Asian genomes are colored in
                                                                              black.

these putative Neanderthal haplotypes in the 42 sampled           from Denisovans. We identified a total of 30 regions, all at
modern human individuals then provide estimates of the            low frequency, with no significant difference in frequency
relative contributions of Neanderthal DNA to the gene pools       between populations.
of contemporary human populations. We found that on               Maasai admixture
average the “Neanderthal haplotypes” were at higher fre-
quency in the East Asians than in the Europeans (9.6% vs.         Previous genetic studies have suggested that the Maasai may
6.4%; P = 3.0 · 1024, permutation test), consistent with the      be an admixed population with a substantial proportion of
D-statistic results presented in Figure 3 (Figure 4). We also     non-African ancestry (Henn et al. 2011). If the non-African
found evidence for a small, but statistically significant, Ne-     ancestry were due to recent (i.e., post-Neanderthal) admix-
anderthal contribution to the genomes of the Maasai (P =          ture, then the observation of Neanderthal ancestry in the
4.9 · 1024), but did not find a significant difference in           Maasai would not be unexpected. Alternatively, spatially ex-
Neanderthal haplotype frequency between the East Asian            plicit models of ancient population structure might explain
and South Asian samples (P . 0.05).                               the greater similarity between Maasai and Neanderthals
                                                                  relative to other sub-Saharan African groups (A. Manica,
Additional test of ancient population structure
                                                                  personal communication). One difference between these al-
As reviewed in the Introduction, there is already evidence        ternative explanations is what they predict about the pat-
against the hypothesis that the extra similarity of non-African   terns of similarity across the genomes of Maasai individuals.
populations to Neanderthals is accounted for by ancient           Under a model of recent admixture, we expect Maasai
population subdivision. To explore this point further, we took    genomes to show large, distinct blocks of sequence with
the 411 regions from our whole-genome analyses that were          different genetic patterns, corresponding to blocks with
identified purely on the basis of their LD patterns (i.e., with-   non-African vs. African ancestry. The average size of the
out using any information from the Neanderthal genome se-         non-African blocks (in morgans) is roughly the inverse of
quence). Then, for each non-African individual, we calculated     the time (in generations) since admixture. In contrast, under
the D-statistic for those regions where the individual con-       a model of ancient admixture the similarity of Maasai
tained a rare, diverged haplotype. If this haplotype were re-     genomes to the Neanderthal genome will be spread through-
cently inherited from Neanderthals, we would expect the D         out the genome because the admixture happened much lon-
values to be strongly positive. If instead there were no recent   ger ago.
admixture between modern humans and Neanderthals, then               To distinguish between these two possibilities, we
there is no a priori reason why these regions would show D        employed a composite-likelihood–based approach to identi-
values significantly different from 0. Recombination acting        fying African and non-African regions of ancestry across the
over the past 300 Kyr would break up local patterns due to        genomes of the four Maasai samples (Wall et al. 2011).
shared ancestral polymorphisms to scales ,0.01 cM (i.e.,          Briefly, we used the European (CEU and TSI) and other
,10 kb on average). The D values that we observe are              African (YRI and LWK) samples (Table 1) to estimate allele
strongly positive (average D = 0.594, compared with an av-        frequencies in non-African and African ancestral populations
erage D = 0.068 for the whole genome), providing additional       and then estimated the number of alleles inherited from
evidence that most of the unusual haplotypes from these 411       each ancestral population at each SNP in the genome. These
regions are indeed the result of recent introgression from the    extant samples may not be perfect proxies for the true an-
Neanderthal gene pool (P ,, 1028, Figure 5).                      cestral populations, but the qualitative results presented be-
                                                                  low are likely to be valid.
Identifying “Denisovan haplotypes”
                                                                     In summary, we estimate an average of 30% non-
Excluding the 226 Neanderthal regions described above, we         African ancestry in each Maasai genome, and the sizes
used the same criteria to identify regions likely inherited       of the ancestral blocks are consistent with admixture that

206    J. D. Wall et al.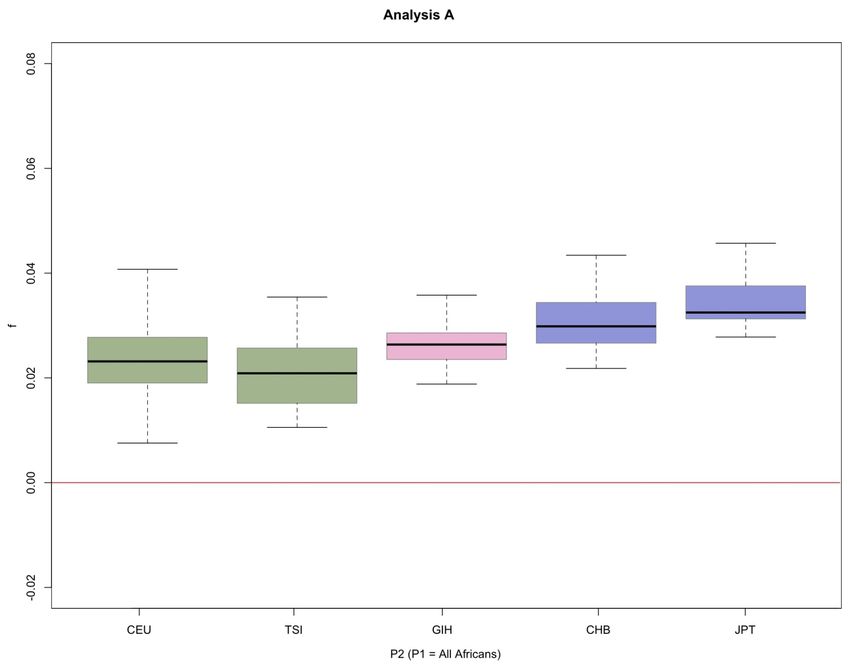
Figure 5 Box plot showing the average D across the whole genomes of
the non-African individuals compared with the average D (for the same
individuals) across regions identified as having unusual patterns of LD
(i.e., putative archaic regions).

happened 100 generations ago (Figure 6A). We then par-
titioned each Maasai genome into regions with zero, one, or              Figure 6 Recent and ancient admixture in the Maasai. (A) Representative
                                                                         plot of the number of estimated “African” alleles across the first 30 Mb of
two inferred African alleles and calculated D separately for
                                                                         chromosome 1 in one of the Maasai genomes. (B) Estimated values of D
each partition. We found that the D values are significantly              for portions of the genome estimated to contain zero, one, or two “non-
more negative with increasing numbers of inferred non-                   African” alleles.
African alleles (P = 2.0 · 1024; Figure 6B). This observation
provides strong support for recent non-African gene flow                     We were not able to confirm the conclusion of Skoglund
into the Maasai, with the non-African alleles bringing with              and Jakobsson (2011) that there was Denisovan admixture
them low levels of Neanderthal ancestry.                                 into East Asians. We did not detect any difference in the
                                                                         number of apparent Denisovan segments in Europeans and
                                                                         East Asians. The East Asian genomes analyzed, however,
Discussion
                                                                         were from northern East Asia (Beijing and Tokyo), not from
Our results confirm and reinforce several conclusions about               southern East Asia where Skoglund and Jakobsson found
admixture between Neanderthals and the ancestors of                      the strongest signal of admixture with Denisovans.
modern humans. Using a much larger number of high-                          Our results and those of Meyer et al. (2012) imply that
coverage genome sequences than were previously analyzed                  the relatively simple admixture scenario proposed by
for this purpose and using two complementary methods of                  Green et al. (2010) needs to be altered. At least two sep-
analysis (D-statistics and detection of introgressed Neander-            arate episodes of admixture between Neanderthals and
thal segments), we confirm the conclusion of Meyer et al.                 modern humans must have occurred, and at least one of
(2012) that East Asians (Han Chinese and Japanese) are                   those episodes must have occurred after the separation of
more similar to the published Neanderthal sequence than                  the ancestors of modern Europeans and East Asians.
are Europeans. Because we have analyzed more modern                      Rather than have two distinct episodes of admixture, it
human sequences than Meyer et al. (2012) did, we are able                seems more plausible that admixture took place over
to show the extent of variation within both Asian and African            a protracted period 50–80 KYA. During that period the
populations. We also confirm the conclusions of Yang et al.               ancestors of Europeans diverged and subsequently expe-
(2012) and Sankararaman et al. (2012) that the similarity of             rienced less admixture than the ancestors of East Asians.
both Europeans and East Asians to Neanderthals is the result             This scenario is consistent with the simulation models of
of recent admixture and not ancient population subdivision.              Currat and Excoffier (2011) and Skoglund and Jakobsson
Finally, we used the high-coverage Denisova sequence of                  (2011).
Meyer et al. (2012) to determine that the admixture rate                    If this scenario is correct, the time of separation of the
(f) into East Asians is 40% higher than into Europeans.                 ancestors of modern European and East Asian populations is

                                                                                                       Neanderthal Ancestry in Eurasians       207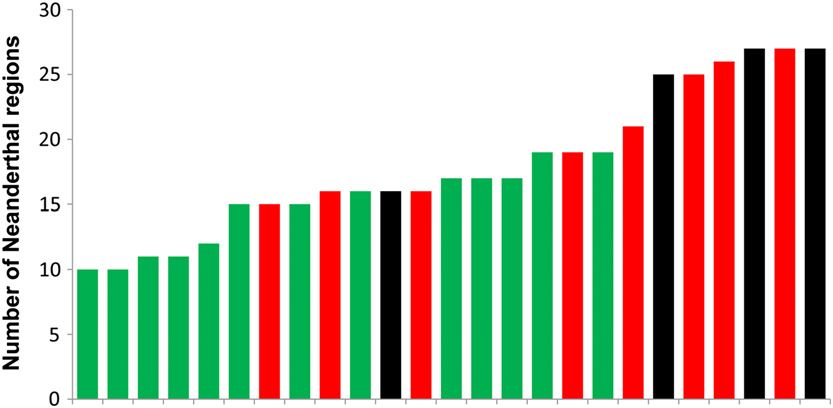
constrained. Since there is no archaeological record of          Literature Cited
Neanderthals in the past 30 Kyr, it follows that the sepa-
                                                                 Chen, G. K., P. Marjoram, and J. D. Wall, 2009 Fast and flexible
ration of Europeans from East Asians had to have occurred            simulation of DNA sequence data. Genome Res. 19: 136–142.
before Neanderthals went extinct. Consequently, estimates        Currat, M., and L. Excoffier, 2011 Strong reproductive isolation be-
of East Asian–European population divergence of ,30 KYA              tween humans and Neanderthals inferred from observed patterns
(Gutenkunst et al. 2009; Gravel et al. 2011) are unlikely to         of introgression. Proc. Natl. Acad. Sci. USA 108: 15129–15134.
be correct. This timeframe is also supported by a 40- to 50-     Drmanac, R., A. B. Sparks, M. J. Callow, A. L. Halpern, N. L. Burns
                                                                     et al., 2010 Human genome sequencing using unchained base
KYA modern human fossil recently found in China (Fu et al.           reads on self-assembling DNA nanoarrays. Science 327: 78–81.
2013).                                                           Duarte, C., J. Mauricio, P. B. Pettitt, P. Souto, E. Trinkaus et al.,
   Our two analyses yielded slightly different results for the       1999 The early Upper Paleolithic human skeleton from the
Gujarati (South Asian) samples. However, it would not be             Abrigo do Lagar Velho (Portugal) and modern human emer-
surprising if the true level of Neanderthal ancestry in South        gence in Iberia. Proc. Natl. Acad. Sci. USA 96: 7604–7609.
                                                                 Durand, E. Y., N. Patterson, D. Reich, and M. Slatkin,
Asians was intermediate between Europeans and East Asians            2011 Testing for ancient admixture between closely related
because previous studies have shown gradients in genetic             populations. Mol. Biol. Evol. 28: 2239–2252.
ancestry across Eurasia (Rosenberg et al. 2002).                 Eriksson, A., and A. Manica, 2012 Effect of ancient population
   Our finding of Neanderthal admixture into the Maasai               structure on the degree of polymorphism shared between mod-
was initially surprising, given the lack of evidence that            ern human populations and ancient hominins. Proc. Natl. Acad.
                                                                     Sci. USA 109: 13956–13960.
Neanderthals ever crossed into Africa or that the ancestors
                                                                 Finlayson, C., 2004 Neanderthals and Modern Humans: An Ecolog-
of the Maasai were ever in the Middle East. Although direct          ical and Evolutionary Perspective. Cambridge University Press,
contact between the two groups in the past is theoretically          Cambridge, UK.
possible, our results are more consistent with a scenario        Fu, Q., M. Meyer, X. Gao, U. Stenzel, H. A. Burbano et al.,
involving recent admixture between the ancestors of the              2013 DNA analysis of an early modern human from Tianyuan
                                                                     Cave, China. Proc. Natl. Acad. Sci. USA 110: 2223–2227.
Maasai and one or more (historically) non-African groups
                                                                 Garrigan, D., Z. Mobasher, S. B. Kingan, J. A. Wilder, and M. F. Ham-
with Neanderthal ancestry several thousand years ago.                mer, 2005a Deep haplotype divergence and long-range linkage
This interpretation is broadly consistent with recent find-           disequilibrium at xp21.1 provide evidence that humans descend
ings of African admixture into Middle Eastern and South-             from a structured ancestral population. Genetics 170: 1849–1856.
ern European populations during the same timescale               Garrigan, D., Z. Mobasher, T. Severson, J. A. Wilder, and M. F.
                                                                     Hammer, 2005b Evidence for archaic Asian ancestry on the
(Moorjani et al. 2011) and a greater genetic similarity be-
                                                                     human X chromosome. Mol. Biol. Evol. 22: 189–192.
tween East African and non-African samples than between          Gravel, S., B. M. Henn, R. N. Gutenkunst, A. R. Indap, G. T. Marth
West African and non-African samples (Tishkoff et al.                et al., 2011 Demographic history and rare allele sharing
2009). Together these studies provide additional support             among human populations. Proc. Natl. Acad. Sci. USA 108:
for the hypothesis that admixture between genetically di-            11983–11988.
                                                                 Green, R. E., J. Krause, A. W. Briggs, T. Maricic, U. Stenzel et al.,
verged groups is a common feature of human demographic
                                                                     2010 A draft sequence of the Neandertal genome. Science
history.                                                             328: 710–722.
   The new picture of human and Neanderthal ancestry that        Gutenkunst, R. N., R. D. Hernandez, S. H. Williamson, and C. D.
emerges from our results is almost certainly not complete,           Bustamante, 2009 Inferring the joint demographic history of
and our results suggest that intracontinental variation in           multiple populations from multidimensional SNP frequency
                                                                     data. PLoS Genet. 5: e1000695.
levels of Neanderthal ancestry may be common. With the
                                                                 Hammer, M. F., A. E. Woerner, F. L. Mendez, J. C. Watkins, and J.
current rate of progress in whole-genome sequencing and              D. Wall, 2011 Genetic evidence for archaic admixture in
the possibility of additional draft genomes from specimens           Africa. Proc. Natl. Acad. Sci. USA 108: 15123–15128.
of archaic individuals, we will soon learn more about the        Henn, B. M., C. R. Gignoux, M. Jobin, J. M. Granka, J. M. Macpher-
admixture process. In particular, the construction of “archaic       son et al., 2011 Hunter-gatherer genomic diversity suggests
                                                                     a southern African origin for modern humans. Proc. Natl. Acad.
admixture maps” detailing the distribution of archaic DNA
                                                                     Sci. USA 108: 5154–5162.
segments in different modern human populations will help         Hublin, J. J., 2009 Out of Africa: modern human origins special
us to infer the timing, locations, and exact numbers of in-          feature: the origin of Neandertals. Proc. Natl. Acad. Sci. USA
trogression events and the role that archaic admixture may           106: 16022–16027.
have played in the evolution of the AMH genome.                  Krings, M., A. Stone, R. W. Schmitz, H. Krainitzki, M. Stoneking
                                                                     et al., 1997 Neandertal DNA sequences and the origin of mod-
                                                                     ern humans. Cell 90: 19–30.
Acknowledgments                                                  Lachance, J., B. Vernot, C. C. Elbers, B. Ferwerda, A. Froment et al.,
                                                                     2012 Evolutionary history and adaptation from high-coverage
This work was supported in part by National Institutes of            whole-genome sequences of diverse African hunter-gatherers.
Health grants R01-GM40282 (to M.S.), R01-HG005226 (to                Cell 150: 457–469.
J.D.W. and M.F.H.), and T32 HG 00047 (training grant to          Lahr, M. M., 1994 The multiregional model of modern human origins
                                                                     - a reassessment of its morphological basis. J. Hum. Evol. 26: 23–56.
M.A.Y.), as well as by National Science Foundation Gradu-        Li, H., B. Handsaker, A. Wysoker, T. Fennell, J. Ruan et al.,
ate Research Fellowship Program Division of Graduate                 2009 The Sequence Alignment/Map format and SAMtools. Bi-
Education grant 1106400 (to M.A.Y.).                                 oinformatics 25: 2078–2079.

208    J. D. Wall et al.
Meyer, M., M. Kircher, M. T. Gansauge, H. Li, F. Racimo et al., Serre, D., A. Langaney, M. Chech, M. Teschler-Nicola, M. Paunovic
2012 A high-coverage genome sequence from an archaic De- et al., 2004 No evidence of Neandertal mtDNA contribution to
nisovan individual. Science 338: 222–226. early modern humans. PLoS Biol. 2: E57.
Moorjani, P., N. Patterson, J. N. Hirschhorn, A. Keinan, L. Hao et al., Skoglund, P., and M. Jakobsson, 2011 Archaic human ancestry in
2011 The history of African gene flow into Southern Euro- East Asia. Proc. Natl. Acad. Sci. USA 108: 18301–18306.
peans, Levantines, and Jews. PLoS Genet. 7: e1001373. Stringer, C. B., and P. Andrews, 1988 Genetic and fossil evidence
Myers, S., L. Bottolo, C. Freeman, G. McVean, and P. Donnelly, for the origin of modern humans. Science 239: 1263–1268.
2005 A fine-scale map of recombination rates and hotspots Stringer, C. B., and J. Hublin, 1999 New age estimates for the
across the human genome. Science 310: 321–324. Swanscombe hominid, and their significance for human evolu-
Noonan, J. P., G. Coop, S. Kudaravalli, D. Smith, J. Krause et al., tion. J. Hum. Evol. 37: 873–877.
2006 Sequencing and analysis of Neanderthal genomic DNA. Tishkoff, S. A., F. A. Reed, F. R. Friedlaender, C. Ehret, A. Ranciaro
Science 314: 1113–1118. et al., 2009 The genetic structure and history of Africans and
Paten, B., J. Herrero, K. Beal, S. Fitzgerald, and E. Birney, African Americans. Science 324: 1035–1044.
2008a Enredo and Pecan: genome-wide mammalian consis- Trinkaus, E., 2007 European early modern humans and the fate
tency-based multiple alignment with paralogs. Genome Res. of the Neandertals. Proc. Natl. Acad. Sci. USA 104: 7367–7372.
18: 1814–1828. Wall, J. D., 2000 Detecting ancient admixture in humans using
Paten, B., J. Herrero, S. Fitzgerald, K. Beal, P. Flicek et al., sequence polymorphism data. Genetics 154: 1271–1279.
2008b Genome-wide nucleotide-level mammalian ancestor re- Wall, J. D., K. E. Lohmueller, and V. Plagnol, 2009 Detecting
construction. Genome Res. 18: 1829–1843. ancient admixture and estimating demographic parameters in
Plagnol, V., and J. D. Wall, 2006 Possible ancestral structure in multiple human populations. Mol. Biol. Evol. 26: 1823–1827.
human populations. PLoS Genet. 2: e105. Wall, J. D., R. Jiang, C. Gignoux, G. K. Chen, C. Eng et al.,
Reich, D., R. E. Green, M. Kircher, J. Krause, N. Patterson et al., 2011 Genetic variation in Native Americans, inferred from La-
2010 Genetic history of an archaic hominin group from Deni- tino SNP and resequencing data. Mol. Biol. Evol. 28: 2231–
sova Cave in Siberia. Nature 468: 1053–1060. 2237.
Rosenberg, N. A., J. K. Pritchard, J. L. Weber, H. M. Cann, K. K. Kidd Yang, M. A., A. S. Malaspinas, E. Y. Durand, and M. Slatkin,
et al., 2002 Genetic structure of human populations. Science 2012 Ancient structure in Africa unlikely to explain Neander-
298: 2381–2385. thal and non-African genetic similarity. Mol. Biol. Evol. 29:
Sankararaman, S., N. Patterson, H. Li, S. Paabo, and D. Reich, 2987–2995.
2012 The date of interbreeding between Neandertals and
modern humans. PLoS Genet. 8: e1002947. Communicating editor: A. Di Rienzo
Neanderthal Ancestry in Eurasians 209GENETICS
Supporting Information
http://www.genetics.org/lookup/suppl/doi:10.1534/genetics.112.148213/-/DC1
Higher Levels of Neanderthal Ancestry in East
Asians than in Europeans
Jeffrey D. Wall, Melinda A. Yang, Flora Jay, Sung K. Kim, Eric Y. Durand, Laurie S. Stevison,
Christopher Gignoux, August Woerner, Michael F. Hammer, and Montgomery Slatkin
Copyright © 2013 by the Genetics Society of America
DOI: 10.1534/genetics.112.148213File S1
Additional D-statistic results
We computed D(P1, P2, Neanderthal, Outgroup) for all pair of individuals (P1,P2) from the Complete
Genomics data, as described in the Materials and Methods. The D-statistics were averaged over all combinations of
individuals for each given pair of populations. The means and the standard deviations for all twenty-eight pairwise
population comparisons are given in Tables S1 and S2. We also show regional comparisons, where some populations
are grouped into East Asian, European, or African (Tables S2 and S3). We also computed the admixture rate (f) for
each of these combinations (Tables S1-S3) for the data from Analysis A. Where we have results from both Analysis A
and Analysis B, we show the results in the text in curly braces, such that the results from the two analyses are given as
{Analysis A, Analysis B}.
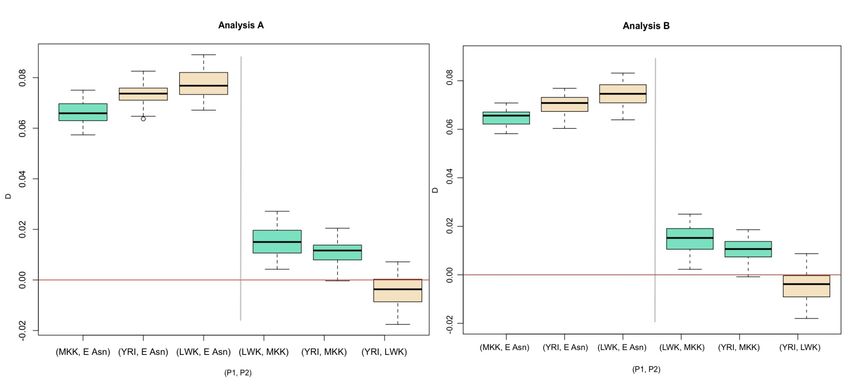
Comparison between non-Africans and Africans
The averaged D-statistics are consistently positive when comparing African populations and non-African
populations (Average D-statistic range = {[0.0429, 0.0891], [0.0530, 0.0750]}, Table S1, Figure S1). These results
confirm the previous findings that the non-African populations are more closely related to Neanderthal than African
populations (Green et al. 2010). The admixture rate estimated also gives positive values ranging from 0.0191 to
0.0417 (Table S1, Figure S2).
Comparison between Europeans and East Asians (Figure S3-S4)
When we compared the set of D-statistics for the pair (Afr, East Asia) and the pair (Afr, Europe) using Test 1,
we find that the D-statistics for the East Asian individuals tend to be higher than the D-statistics for the European
individuals (mean difference = {0.0083, 0.0096}, two-tailed p-value = {0.0010, 0.0006}, Table S4). This suggests that
East Asians may have a greater signal for genetic admixture with Neanderthals than Europeans. These results are
consistent when we consider each African population separately and across both Analysis A and Analysis B. The
difference between Europeans and East Asians is always significant using Test 1 (Table S4).
This trend is further supported by the set of positive D-statistics estimated for the pair (Europe, East Asia).
The values averaged over each population are given in Table S2. The average D-statistic for the merged East Asian
group compared to the merged European group is {0.0110, 0.0131}, which is significantly different from zero (two-
tailed p-value = {0.0037, 0.0009}, Table S5).
The f-statistics also show the same trend, with a higher signal between Neanderthals and East Asians,
compared to Neanderthals and Europeans. Test 1 shows that the difference in f-statistic of 0.0098 is significant (two-
2 SI J. D. Wall et al.tailed p-value = 0.0011, Table S7). Test 2 compares Europeans and East Asians directly, and shows that the f-statistic
computed is 0.0100, which is significantly different from zero (two-tailed p-value = 0.0072, Table S8).
Gujarati population (Figure S5-S6)
We also studied whether the South Asian population GIH was more similar to the Europeans or the East
Asians in term of admixture from Neanderthal. When compared to the African individuals, the GIH individuals have an
average D-statistic of {0.0712, 0.0656} (Table S3), which is higher than the average D-statistic for Europeans (average
D-statistic for (Afr, Europe) = {0.0644, 0.0604}, Table S3) and lower than the average D-statistic for East Asians
(average D-statistic for (Afr, East Asia) = {0.0727, 0.0699}. The same results are observed when considering each
African population separately (Table S3). We applied both Test 1 and Test 2 to investigate the significance of these
observations. When we use Test 1, we find that the difference in the estimates of D for the pair (Afr ,GIH) and the pair
(Afr, East Asia) are significant when comparing against all Africans (two-tailed p-value = {0.0101, 0.0259}, Table S6).
However, the difference in the estimates of D for (Afr, GIH) and (Afr, Europe) is not significant (two-tailed p-value =
{0.4232,0.1343}, Table S6). Thus, the average D-statistics found for GIH are closer to the estimates of D for the
European samples than for the East Asian samples. When we use Test 2, we find that D-statistics for (Europe, GIH) are
not significantly different from 0 (D={0.0035, 0.0067}, p-values = {0.4386, 0.2345}, Table S5). D for (GIH, East Asia) are
significantly different from zero in Analysis A (two-tailed p-value=0.0346), but must be taken with caution as the
estimate is not significantly different in Analysis B (two-tailed p-value=0.0867). The results from Test 2 cannot
distinguish if the GIH samples group more closely with East Asians or Europeans, while Test 1 does. Test 1 and Test 2
for the f-statistic show similar results (Table S8-S9).
Maasai population (Figure S7-S8)
The Maasai individuals (MKK) seem to share more genetic similarity with Neanderthals than other African
populations. The average D-statistic for (Afr, MKK), with Afr =YRI or LWK, were positive (average D-statistic = {(0.0110,
0.0075), (0.0102, 0.0145)}, Table S2). Using Test 2, the average D-statistic for (YRI+LWK, MKK) is significantly different
from zero (D={0.0123,0.0116}, two-tailed p-value={0.0101, 0.0135}). However, the significant difference from zero is
lost when the Maasai are compared separately to the Yoruba or Luhya, except for the (YRI,MKK) comparison in
Analysis A (two-tailed p-value=0.0418, Table S5). Notably, the (LWK, YRI) pair is not significantly different from zero
(two-tailed p-value = {0.3457, 0.3611}, Table S5).
When we compare the estimates of D for the pair (YRI, East Asia) to (MKK, East Asia) using Test 1, the
estimates of D for (MKK, East Asia) were significantly different from the estimates of D for (YRI, East Asia) by a small
J. D. Wall et al. 3 SIYou can also read


