Learning Trajectory Dependencies for Human Motion Prediction
←
→
Page content transcription
If your browser does not render page correctly, please read the page content below
Learning Trajectory Dependencies for Human Motion Prediction
                                                             Wei Mao1 , Miaomiao Liu1,3 , Mathieu Salzmann2 , Hongdong Li1,3
                                                   1
                                                       Australian National University, 2 CVLab, EPFL,3 Australia Centre for Robotic Vision
                                                       {wei.mao, miaomiao.liu, hongdong.li}@anu.edu.au, mathieu.salzmann@epfl.ch

                                                                Abstract
arXiv:1908.05436v3 [cs.CV] 7 Jul 2020

                                            Human motion prediction, i.e., forecasting future body
                                        poses given observed pose sequence, has typically been
                                        tackled with recurrent neural networks (RNNs). However,
                                        as evidenced by prior work, the resulted RNN models suffer
                                        from prediction errors accumulation, leading to undesired
                                        discontinuities in motion prediction. In this paper, we pro-
                                        pose a simple feed-forward deep network for motion pre-
                                        diction, which takes into account both temporal smoothness      Figure 1. Human motion prediction. The left frames correspond
                                        and spatial dependencies among human body joints. In this       to the observations. From top to bottom, we show the ground truth,
                                                                                                        and predictions obtained by the methods of [17] and [16], and by
                                        context, we then propose to encode temporal information
                                                                                                        our approach on joint angles and 3d coordinates. Our predictions
                                        by working in trajectory space, instead of the traditionally-   better match the ground truth.
                                        used pose space. This alleviates us from manually defining
                                        the range of temporal dependencies (or temporal convo-
                                                                                                        walking and golf swing, more complicated ones are typi-
                                        lutional filter size, as done in previous work). Moreover,
                                                                                                        cally tackled using deep networks [7, 11, 5, 17, 9, 16].
                                        spatial dependency of human pose is encoded by treat-
                                        ing a human pose as a generic graph (rather than a hu-              Because of the temporal nature of the signal of interest,
                                        man skeletal kinematic tree) formed by links between every      the most common trend consists of using Recurrent Neu-
                                        pair of body joints. Instead of using a pre-defined graph       ral Networks (RNNs) [7, 11, 17, 9]. However, as argued
                                        structure, we design a new graph convolutional network to       in [9, 16] , besides their well-known training difficulty [19],
                                        learn graph connectivity automatically. This allows the net-    RNNs for motion prediction suffer from several drawbacks:
                                        work to capture long range dependencies beyond that of          First, existing works [7, 17] that use the estimation at the
                                        human kinematic tree. We evaluate our approach on sev-          current RNN step as input to the next prediction tend to ac-
                                        eral standard benchmark datasets for motion prediction,         cumulate errors throughout the generated sequence, lead-
                                        including Human3.6M, the CMU motion capture dataset             ing to unrealistic predictions at inference time. Second, as
                                        and 3DPW. Our experiments clearly demonstrate that the          observed in [16, 17], earlier RNN-based methods [7, 11]
                                        proposed approach achieves state of the art performance,        often produce strong discontinuities between the last ob-
                                        and is applicable to both angle-based and position-based        served frame and the first predicted one. These disconti-
                                        pose representations. The code is available at https:           nuities are partially due to the frame-by-frame regression
                                        //github.com/wei-mao-2019/LearnTrajDep                          procedure that does not encourage global smoothness of the
                                                                                                        sequence [9]. As a consequence, several works have pro-
                                                                                                        posed to rely on feed-forward networks for motion predic-
                                                                                                        tion [5, 16]. In this paper, we introduce a new feed-forward
                                        1. Introduction                                                 approach to motion prediction, leading to more accurate
                                           Human motion prediction is key to the success of ap-         predictions than RNN ones, as illustrated in Fig. 1.
                                        plications where one needs to forecast the future, such             When using feed-forward networks for a time-related
                                        as human robot interaction [15], autonomous driving [18]        problem such as motion prediction, the question of how to
                                        and human tracking [8]. While traditional data-driven ap-       encode the temporal information naturally arises. In [5, 16],
                                        proaches, such as Hidden Markov Model [3] and Gaussian          this was achieved by using convolutions across time on the
                                        Process latent variable models [24], have proved effective      observed poses. The temporal dependencies that such an
                                        for simple periodic motions and acyclic motions, such as        approach can encode, however, strongly depend on the size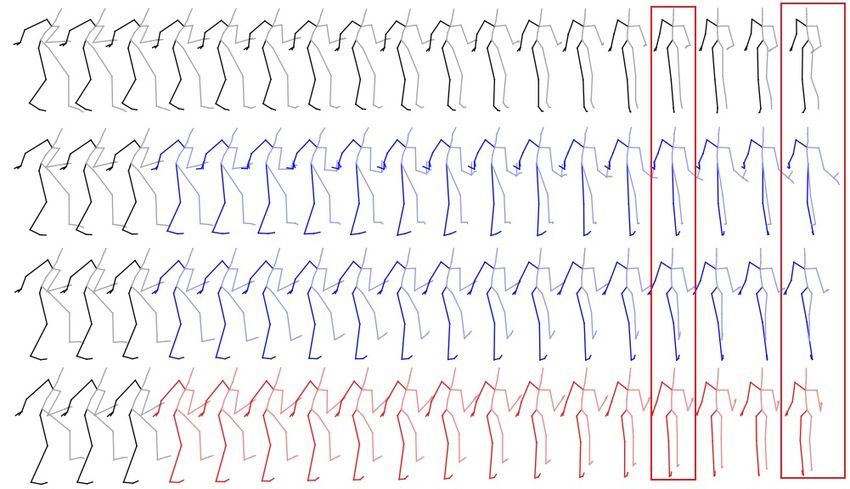
of the convolutional filters.                                    diction problem via a Structural-RNN model relying on
    To remove such a dependency, here, we introduce a dras-      high-level spatio-temporal graphs. These graphs, however,
tically different approach to modeling temporal information      were manually designed, which limits the flexibility of the
for motion prediction. Inspired by ideas from the nonrigid       framework, not letting it discover long-range interactions
structure-from-motion literature [1], we propose to repre-       between different limbs. While the two previous meth-
sent human motion in trajectory space instead of pose space,     ods directly estimated absolute human poses, Martinez et
and thus adopt the Discrete Cosine Transform (DCT) to en-        al. [17] introduced a residual architecture to predict veloc-
code temporal information. Specifically, we represent the        ities. Interestingly, it was shown in this work that a sim-
temporal variation of each human joint as a linear combi-        ple zero-velocity baseline, i.e., constantly predicting the
nation of DCT bases, and, given the DCT coefficients of          last observed pose, led to better performance than [7, 11].
the observed poses, learn to predict those of the future ones.   While [17] outperformed this baseline, the predictions pro-
This strategy applies to both angle-based pose representa-       duced by the RNN still suffer from discontinuities between
tions and 3D joint positions. As discussed in our exper-         the observed poses and the predicted future ones. To over-
iments, the latter has the advantage of not suffering from       come this, Gui et al. proposed to rely on adversarial train-
ambiguities, in contrast to angle-based ones, where two dif-     ing, so as to generate smooth sequences that are indistin-
ferent sets of angles can represent the exact same pose. As      guishable from real ones [9]. While this approach consti-
a consequence, reasoning in terms of 3D joint positions          tutes the state of the art, its use of an adversarial classifier,
allows one not to penalize configurations that differ from       which notoriously complicates training [2], makes it diffi-
ground truth while depicting equivalent poses.                   cult to deploy on new datasets.
    The other question that arises when working with human       Feed-forward approaches to human motion prediction.
pose is how to encode the spatial dependencies among the         Feed-forward networks, such as fully-connected and con-
joints. In [5], this was achieved by exploiting the human        volutional ones, were studied as an alternative solution to
skeleton, and in [16] by defining a relatively large spatial     avoiding the discontinuities produced by RNNs [5, 16]. In
filter size. While the former does not allow one to model        particular, in [5], Butepage et al. proposed to treat a recent
dependencies across different limbs, such as left-right sym-     pose history as input to a fully-connected network, and in-
metries, the latter again depends on the size of the filters.    troduced different strategies to encode additional temporal
    In this paper, we propose to overcome these two issues       information via convolutions and spatial structure by ex-
by exploiting graph convolutions [13]. However, instead of       ploiting the kinematic tree. The use of a kinematic tree,
using a pre-defined, sparse graph as in [13], we introduce       however, does not reflect the fact that, as discussed in [16],
an approach to learning the graph connectivity. This strat-      stable motion requires synchronizing different body parts,
egy allows the network to capture joint dependencies that        even distant ones not directly connected by the kinematic
are neither restricted to the kinematic tree, nor arbitrarily    tree. To capture such dependencies, Li et al. [16] built a
defined by a convolutional kernel size.                          convolutional sequence-to-sequence model processing a 2
    In summary, our contributions are (i) a natural way to       dimensional matrix whose columns represent the pose at
encode temporal information in feed-forward networks for         every time step. The range of the spatial and temporal
motion prediction via the DCT; (ii) learnable graph convo-       dependencies captured by this model is then determined
lutional networks to capture the spatial structure of the mo-    by the size of the convolutional filters. In this paper, as
tion data. Our experiments on standard human motion pre-         in [5, 16], we also rely on a feed-forward network for mo-
diction benchmarks evidence the benefits of our approach;        tion prediction. However, we introduce a drastically differ-
our model yields state-of-the-art results in all cases.          ent way to modeling temporal information, which, in con-
                                                                 trast to [5, 16], does not require manually defining convo-
2. Related Work                                                  lutional kernel sizes. Specifically, we propose to perform
                                                                 motion prediction in trajectory space instead of pose space.
RNN-based human motion prediction. Because of their              Furthermore, to model the spatial dependencies between the
success at sequence-to-sequence prediction [21, 14], RNNs        joints, we propose to exploit graph convolutional networks.
have become the de facto model for human motion pre-             Graph Convolutional Networks (GCNs). GCNs gener-
diction [7, 11, 17]. This trend was initiated by Fragki-         alize the convolution operation to data whose structure is
adaki et al. [7], who proposed an Encoder-Recurrent-             defined by a graph, such as user data from social networks,
Decoder (ERD) model that incorporates a nonlinear en-            data defined on 3D meshes and gene data on biological reg-
coder and decoder before and after recurrent layers. Er-         ulatory networks [4, 6]. The main advances in this context
ror accumulation was already observed in this work, and          can be categorized as spectral [13] and non-spectral [22]
a curriculum learning strategy was adopted during train-         methods. In particular, Kipf and Welling [13] use filters
ing to prevent it. In [11], Jain et al. proposed to further      that depend on the graph structure, which limits the gener-
encode the spatial and temporal structure of the pose pre-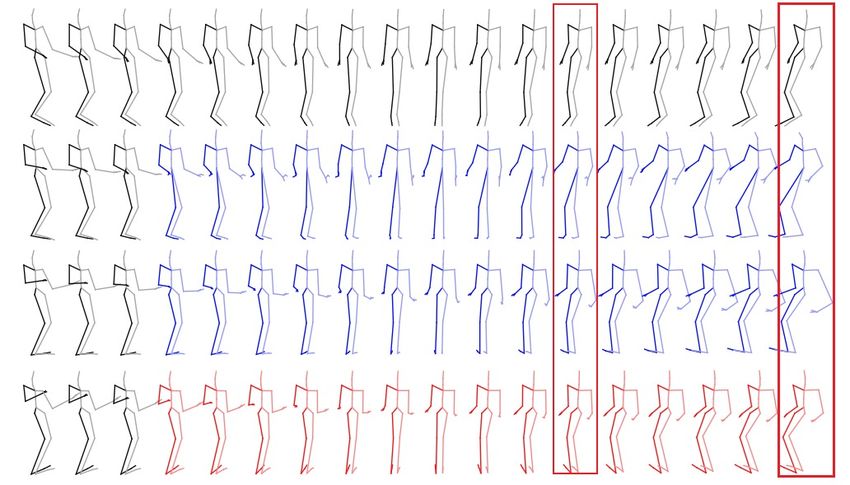
Figure 2. Network architecture. We first apply the DCT to encode temporal pose information in trajectory space. The DCT coefficients
are treated as features input to graph convolutional layers. We use 12 blocks of graph convolutional layers with residual connections and
two additional graph convolutional layers, one at the beginning and one at the end, to encode the temporal information and decode the
features to the residual DCT coefficients, respectively. In each block, we depict how our framework aggregates information from multiple
nodes via learned adjacency matrices.
ality of their approach. By contrast, Velic̆ković et al. [22]            Our temporal encoding aims to capture the motion pat-
rely on self-attention to determine the neighborhood struc-            tern of each joint. Recall that each column of X1:N rep-
ture to be considered, thus providing more flexibility to the          resents the human pose at a specific time step. Con-
network. A straightforward approach to exploiting graph                versely, each row of X1:N describes the motion of each
convolutions for motion prediction would consist of rely-              joint (angle or coordinate). Let us denote by x̃k =
ing on the kinematic tree to define the graph. This strategy           (xk,1 , xk,2 , xk,3 , · · · , xk,N ) the trajectory for the k th joint
has been employed for action recognition [25], by using a              across N frames. While one could directly use such trajec-
GCN to capture the temporal and spatial dependencies of                tories as input and output for motion prediction, inspired
human joints via a graph defined on temporally connected               by ideas from the nonrigid-structure-from-motion litera-
kinematic trees. For motion prediction, however, this would            ture [1], we propose to adopt a trajectory representation
suffer from the same limitations as the strategy of [5] dis-           based on the Discrete Cosine Transform (DCT). The main
cussed above. Therefore, here, inspired by [22], we design             motivation behind this is that, by discarding the high fre-
a GCN able to adaptively learn the necessary connectivity              quencies, the DCT can provide a more compact representa-
for the motion prediction task at hand.                                tion, which nicely captures the smoothness of human mo-
                                                                       tion, particularly in terms of 3D coordinates. Detailed anal-
3. Our Approach                                                        ysis about the number of DCT coefficients used is in the
                                                                       supplementary material.
    Let us now introduce our approach to human motion pre-                Specifically, given a trajectory x̃k , the corresponding lth
diction. As existing methods, we assume to be given a his-             DCT coefficient
tory motion sequence X1:N = [x1 , x2 , x3 , · · · , xN ] con-                    q P can be computed as
                                                                                          N
                                                                         Ck,l = N2 n=1 xk,n √1+δ         1          π

                                                                                                              cos 2N  (2n − 1)(l − 1) , (1)
sisting of N consecutive human poses, where xi ∈ RK ,                                                      l1

with K the number of parameters describing each pose. Our              where δij denotes the Kronecker   (
                                                                                                                 delta function with
goal then is to predict the poses XN +1:N +T for the future                                            1   if i = j
                                                                                               δij =                                     (2)
T time steps. To this end, we propose to make use of a feed-                                           0   if i 6= j.
forward deep network that models the temporal and spatial              In practice, l ∈ {1, 2, · · · , N }, but one can often ignore the
structure of the data. Below, we introduce our approach to             higher values, which, in our context, translates to remov-
encoding these two types of information and then provide               ing the high motion frequencies. In short, Eq. 1 allows us
the details of our network architecture.                               to model the temporal information of each joint using DCT
                                                                       coefficients. Given such coefficients, the original pose rep-
3.1. DCT -based Temporal Encoding                                      resentation (angles or coordinates) can be obtained via the
   In the motion prediction literature, the two standard ways          Inverse Discrete
                                                                                q P Cosine Transform (IDCT) as
                                                                                        N
                                                                         xk,n = N2 l=1 Ck,l √1+δ      1         π

to represent human pose are joint angles and 3D joint co-                                                  cos 2N (2n − 1)(l − 1) , (3)
                                                                                                        l1

ordinates. These two representations, however, are purely              where n ∈ {1, 2, · · · , N }. Note that, if all DCT coefficients
static. Here, instead, we propose to directly encode the               are used, the resulting representation is lossless. However,
temporal nature of human motion in our representation and              as mentioned before, truncating some of the high frequen-
work in trajectory space. Note that, ultimately, we nonethe-           cies can prevent generating jittery motion.
less need to produce human poses in a standard representa-                To make use of the DCT representation, instead of treat-
tion, and, as evidenced by our experiments, our formalism              ing motion prediction as the problem of learning a map-
applies to both of the above-mentioned ones.                           ping from X1:N to XN +1:N +T , we reformulate it as one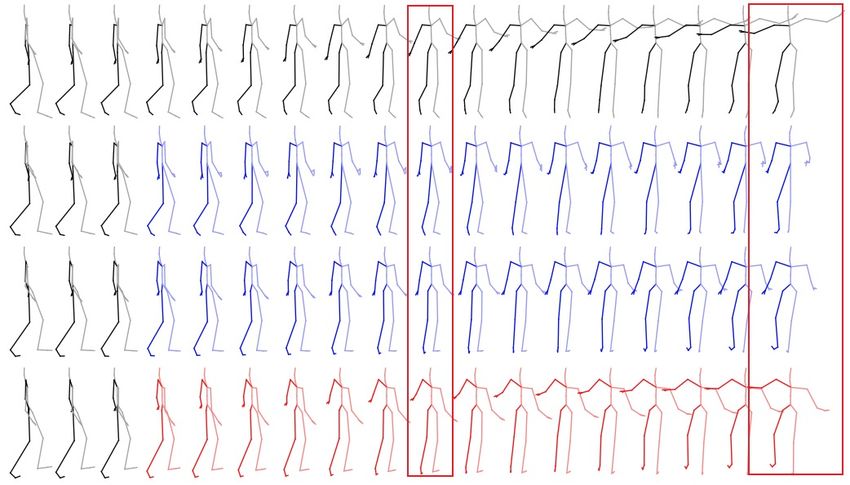
of learning a mapping between observed and future DCT            pose, and that of the sequence X1:N +T . We therefore de-
coefficients. Specifically, given a temporal sequence X1:N ,     sign a residual graph convolutional network. The network
we first replicate the last pose, xN , T times to generate a     structure is shown in Fig. 2. It consists of 12 residual blocks,
temporal sequence of length N + T . We then compute the          each of which comprises 2 graph convolutional layers and
DCT coefficients of this sequence, and aim to predict those      two additional graph convolutional layers, one at the begin-
of the true future sequence X1:N +T . This naturally trans-      ning and one at the end, to encode the temporal information
lates to estimating a residual vector in frequency space and     and decode the features to the residual DCT coefficients,
was motivated by the zero-velocity baseline in [17]. As will     respectively. Each layer p relies on a learnable weight ma-
be shown in our experiments, this residual approach, with        trix W(p) of size 256 × 256 and a learnable weighted adja-
padding by replicating the last pose, has proven much more       cency matrix A(p) . Using a different learnable A for every
effective than other strategies.                                 graph convolutional layer allows the network to adapt the
   Our DCT representations could be directly employed in         connectivity for different operations. This gives our frame-
a standard fully-connected network, either by stacking the       work a greater capacity than a GCN with a fixed adjacency
DCT representations of all joints in a single vector, which      matrix. Nevertheless, because, in each layer p, the weight
would yield to a network with many parameters, or by treat-      matrix W(p) is shared by the different joints to further ex-
ing the different DCT coefficients as different channels, thus   tract motion patterns from feature matrix, the overall net-
using a K × L matrix as input to the network, with L the         work remains compact; the size of the models used in our
number of retained DCT coefficients. While this latter strat-    experiments is around 2.6M for both angle and 3D repre-
egy results in a more compact network, it does not model the     sentations.
spatial dependencies between the joints. In the next section,
we introduce an approach to doing so using GCNs.                 3.4. Training
                                                                     As mentioned before, joint angles and 3D coordinates
3.2. Graph Convolutional Layer
                                                                 are the two standard representations for human pose, and we
    To encode the spatial structure of human pose, we make       will evaluate our approach on both. Below, we discuss the
use of GCNs [13, 22]. Here, instead of relying on a pre-         loss function we use to train our network in each case. For
defined, sparse graph, as in [13], we propose to learn the       joint angles, following the literature, we use an exponen-
graph connectivity during training, thus essentially learning    tial map representation. Given the training angles, we apply
the dependencies between the different joint trajectories.       the DCT to obtain the corresponding coefficients, train our
    To this end, let us assume that the human body is mod-       model and employ the IDCT to the predicted DCT coeffi-
eled as a fully-connected graph with K nodes. The strength       cients so as to retrieve the corresponding angles X1:N +T .
of the edges in this graph can then be represented by a          To train our network, we use the average `1 distance be-
weighted adjacency matrix A ∈ RK×K . A graph convo-              tween the ground-truth joint angles and the predicted ones.
lutional layer p then takes as input a matrix H(p) ∈ RK×F ,      Formally, for one training sample, this gives the loss
with F the number of features output by the previous layer.               `a =       1
                                                                                            PN +T PK
                                                                                                           |x̂k,n − xk,n | ,   (5)
                                                                                 (N +T )K     n=1   k=1
For example, for the first layer, the network takes as input
the K × L matrix of DCT coefficients. Given this informa-        where x̂k,n is the predicted k th angle in frame n and xk,n
tion and a set of trainable weights W(p) ∈ RF ×F̂ , a graph      the corresponding ground-truth one. Note that we sum `1
convolutional layer outputs a matrix of the form                 errors over both the future and observed time steps. This
                H(p+1) = σ(A(p) H(p) W(p) ) ,             (4)    provides us with additional signal to learn to predict the
          (p)                                                    DCT coefficients, which represent the entire sequence.
where A is the trainable weighted adjacency matrix for
                                                                     For the coordinate-based representation, we adopt the
layer p and σ(·) is an activation function, such as tanh(·).
                                                                 standard body model of [10] to convert the joint angles
    Following the standard deep learning formalism, multi-
                                                                 to 3D coordinates. The 3D joint positions are then pre-
ple such layers can be stacked to form a GCN. Since all
                                                                 processed so as to be centred at the origin, and the global
operations are differentiable, w.r.t. both A(p) and W(p) ,
                                                                 rotations are removed. Going from 3D coordinates to DCT
the resulting network can be trained using standard back-
                                                                 coefficients and back follows exactly the same procedure
propagation. In the next section, we provide additional de-
                                                                 as in the angle case. To train our model, we then make
tail about the network structure used in our experiments.
                                                                 use of the Mean Per Joint Position Error (MPJPE) proposed
3.3. Network Structure                                           in [10], which, for one training sample, translates to the loss
                                                                                    1
                                                                                            PN +T PJ
   As discussed in Section 3.1, we aim to learn the residuals             `m =   J(N +T )    n=1    j=1   kp̂j,n − pj,n k2 ,
                                                                                                                        (6)
                                                                                   3
between the input and output DCT representations. More           where p̂j,n ∈ R denotes the predicted jth joint position
precisely, we learn the residuals between the DCT coeffi-        in frame n, pj,n the corresponding ground-truth one, and J
cients obtained from the input sequence with replicated last     the number of joints in the human skeleton.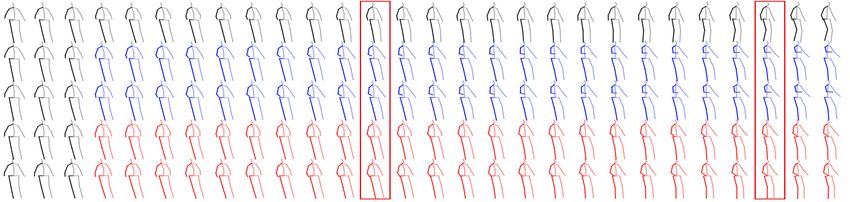
Walking Eating Smoking Discussion
milliseconds 80 160 320 400 80 160 320 400 80 160 320 400 80 160 320 400
zero-velocity [17] 0.39 0.68 0.99 1.15 0.27 0.48 0.73 0.86 0.26 0.48 0.97 0.95 0.31 0.67 0.94 1.04
Residual sup. [17] 0.28 0.49 0.72 0.81 0.23 0.39 0.62 0.76 0.33 0.61 1.05 1.15 0.31 0.68 1.01 1.09
convSeq2Seq [16] 0.33 0.54 0.68 0.73 0.22 0.36 0.58 0.71 0.26 0.49 0.96 0.92 0.32 0.67 0.94 1.01
AGED w/o adv [9] 0.28 0.42 0.66 0.73 0.22 0.35 0.61 0.74 0.3 0.55 0.98 0.99 0.30 0.63 0.97 1.06
AGED w/adv [9] 0.22 0.36 0.55 0.67 0.17 0.28 0.51 0.64 0.27 0.43 0.82 0.84 0.27 0.56 0.76 0.83
ours 0.18 0.31 0.49 0.56 0.16 0.29 0.50 0.62 0.22 0.41 0.86 0.80 0.20 0.51 0.77 0.85
Directions Greeting Phoning Posing Purchases Sitting
milliseconds 80 160 320 400 80 160 320 400 80 160 320 400 80 160 320 400 80 160 320 400 80 160 320 400
zero-velocity [17] 0.39 0.59 0.79 0.89 0.54 0.89 1.30 1.49 0.64 1.21 1.65 1.83 0.28 0.57 1.13 1.37 0.62 0.88 1.19 1.27 0.40 1.63 1.02 1.18
Residual sup. [17] 0.26 0.47 0.72 0.84 0.75 1.17 1.74 1.83 0.23 0.43 0.69 0.82 0.36 0.71 1.22 1.48 0.51 0.97 1.07 1.16 0.41 1.05 1.49 1.63
convSeq2Seq [16] 0.39 0.60 0.80 0.91 0.51 0.82 1.21 1.38 0.59 1.13 1.51 1.65 0.29 0.60 1.12 1.37 0.63 0.91 1.19 1.29 0.39 0.61 1.02 1.18
AGED w/o adv [9] 0.26 0.46 0.71 0.81 0.61 0.95 1.44 1.61 0.23 0.42 0.61 0.79 0.34 0.70 1.19 1.40 0.46 0.89 1.06 1.11 0.46 0.87 1.23 1.51
AGED w/adv [9] 0.23 0.39 0.63 0.69 0.56 0.81 1.30 1.46 0.19 0.34 0.50 0.68 0.31 0.58 1.12 1.34 0.46 0.78 1.01 1.07 0.41 0.76 1.05 1.19
Ours 0.26 0.45 0.71 0.79 0.36 0.60 0.95 1.13 0.53 1.02 1.35 1.48 0.19 0.44 1.01 1.24 0.43 0.65 1.05 1.13 0.29 0.45 0.80 0.97
Sitting Down Taking Photo Waiting Walking Dog Walking Together Average
milliseconds 80 160 320 400 80 160 320 400 80 160 320 400 80 160 320 400 80 160 320 400 80 160 320 400
zero-velocity [17] 0.39 0.74 1.07 1.19 0.25 0.51 0.79 0.92 0.34 0.67 1.22 1.47 0.60 0.98 1.36 1.50 0.33 0.66 0.94 0.99 0.40 0.78 1.07 1.21
Residual sup. [17] 0.39 0.81 1.40 1.62 0.24 0.51 0.90 1.05 0.28 0.53 1.02 1.14 0.56 0.91 1.26 1.40 0.31 0.58 0.87 0.91 0.36 0.67 1.02 1.15
convSeq2Seq [16] 0.41 0.78 1.16 1.31 0.23 0.49 0.88 1.06 0.30 0.62 1.09 1.30 0.59 1.00 1.32 1.44 0.27 0.52 0.71 0.74 0.38 0.68 1.01 1.13
AGED w/o adv [9] 0.38 0.77 1.18 1.41 0.24 0.52 0.92 1.01 0.31 0.64 1.08 1.12 0.51 0.87 1.21 1.33 0.29 0.51 0.72 0.75 0.32 0.62 0.96 1.07
AGED w/adv [9] 0.33 0.62 0.98 1.1 0.23 0.48 0.81 0.95 0.24 0.50 1.02 1.13 0.50 0.81 1.15 1.27 0.23 0.41 0.56 0.62 0.31 0.54 0.85 0.97
Ours 0.30 0.61 0.90 1.00 0.14 0.34 0.58 0.70 0.23 0.50 0.91 1.14 0.46 0.79 1.12 1.29 0.15 0.34 0.52 0.57 0.27 0.51 0.83 0.95
Table 1. Short-term prediction of joint angles on H3.6M for all actions. Our method outperforms the state of the art for most time horizons.
Walking Eating Smoking Discussion
milliseconds 80 160 320 400 80 160 320 400 80 160 320 400 80 160 320 400
Residual sup. [17] 21.7 38.1 58.9 68.8 15.1 28.6 54.8 67.4 20.8 39.0 66.1 76.1 26.2 51.2 85.8 94.6
Residual sup. 3D[17] 23.8 40.4 62.9 70.9 17.6 34.7 71.9 87.7 19.7 36.6 61.8 73.9 31.7 61.3 96.0 103.5
convSeq2Seq [16] 21.8 37.5 55.9 63.0 13.3 24.5 48.6 60.0 15.4 25.5 39.3 44.5 23.6 43.6 68.4 74.9
convSeq2Seq 3D [16] 17.1 31.2 53.8 61.5 13.7 25.9 52.5 63.3 11.1 21.0 33.4 38.3 18.9 39.3 67.7 75.7
Ours 11.1 19.0 32.0 39.1 9.2 19.5 40.3 48.9 9.2 16.6 26.1 29.0 11.3 23.7 41.9 46.6
Ours 3D 8.9 15.7 29.2 33.4 8.8 18.9 39.4 47.2 7.8 14.9 25.3 28.7 9.8 22.1 39.6 44.1
Directions Greeting Phoning Posing Purchases Sitting
milliseconds 80 160 320 400 80 160 320 400 80 160 320 400 80 160 320 400 80 160 320 400 80 160 320 400
Residual sup.[17] 27.9 44.8 63.5 78.2 29.3 56.0 110.2 125.6 28.7 50.9 88.0 99.7 30.5 59.4 118.7 144.7 33.3 58.2 85.4 93.7 32.6 65.2 113.7 126.2
Residual sup. 3D [17] 36.5 56.4 81.5 97.3 37.9 74.1 139.0 158.8 25.6 44.4 74.0 84.2 27.9 54.7 131.3 160.8 40.8 71.8 104.2 109.8 34.5 69.9 126.3 141.6
convSeq2Seq[16] 26.7 43.3 59.0 72.4 30.4 58.6 110.0 122.8 22.4 38.4 65.0 75.4 22.4 42.1 87.3 106.1 28.4 53.8 82.1 93.1 24.7 50.0 88.6 100.4
convSeq2Seq 3D [16] 22.0 37.2 59.6 73.4 24.5 46.2 90.0 103.1 17.2 29.7 53.4 61.3 16.1 35.6 86.2 105.6 29.4 54.9 82.2 93.0 19.8 42.4 77.0 88.4
Ours 11.2 23.2 52.7 64.1 14.2 27.7 67.1 82.9 13.5 22.5 45.2 52.4 11.1 27.1 69.4 86.2 20.4 42.8 69.1 78.3 11.7 27.0 55.9 66.9
Ours 3D 12.6 24.4 48.2 58.4 14.5 30.5 74.2 89.0 11.5 20.2 37.9 43.2 9.4 23.9 66.2 82.9 19.6 38.5 64.4 72.2 10.7 24.6 50.6 62.0
Sitting Down Taking Photo Waiting Walking Dog Walking Together Average
milliseconds 80 160 320 400 80 160 320 400 80 160 320 400 80 160 320 400 80 160 320 400 80 160 320 400
Residual sup. [17] 33.0 64.1 121.7 146 21.2 40.3 72.2 86.2 24.9 50.0 96.5 114.0 53.8 90.9 134.6 156.9 19.7 38.2 62.9 72.3 27.9 51.6 88.9 103.4
Residual sup. 3D [17] 28.6 55.3 101.6 118.9 23.6 47.4 94.0 112.7 29.5 60.5 119.9 140.6 60.5 101.9 160.8 188.3 23.5 45.0 71.3 82.8 30.8 57.0 99.8 115.5
convSeq2Seq [16] 23.9 39.9 74.6 89.8 18.4 32.1 60.3 72.5 24.9 50.2 101.6 120.0 56.4 94.9 136.1 156.3 21.1 38.5 61.0 70.4 24.9 44.9 75.9 88.1
convSeq2Seq 3D [16] 17.1 34.9 66.3 77.7 14.0 27.2 53.8 66.2 17.9 36.5 74.9 90.7 40.6 74.7 116.6 138.7 15.0 29.9 54.3 65.8 19.6 37.8 68.1 80.2
Ours 11.5 25.4 53.9 65.6 8.3 15.8 38.5 49.1 12.1 27.5 67.3 85.6 35.8 63.6 106.7 126.8 11.7 23.5 46.0 53.5 13.5 27.0 54.2 65.0
Ours 3D 11.4 27.6 56.4 67.6 6.8 15.2 38.2 49.6 9.5 22.0 57.5 73.9 32.2 58.0 102.2 122.7 8.9 18.4 35.3 44.3 12.1 25.0 51.0 61.3
Table 2. Short-term prediction of 3D joint positions on H3.6M. A 3D in the method’s name indicates that it was directly trained on 3D joint
positions. Otherwise, the results were obtained by converting the angle predictions to 3D positions. Note that we outperform the baselines
by a large margin, particularly when training directly on 3D.
4. Experiments ing the data processing of [9, 17], we remove the global
rotations and translations as well as constant angles. The
We evaluate our model on several benchmark mo- sequences are down-sampled to 25 frames per second and
tion capture (mocap) datasets, including Human3.6M we test on the same sequences of subject 5 (S5) as previous
(H3.6M) [10], the CMU mocap dataset1 , and the 3DPW work [9, 16, 17].
dataset [23]. Below, we first introduce these datasets, the
CMU-Mocap. Following [16], we also report results on
evaluation metrics we use and the baselines we compare our
the CMU mocap dataset (CMU-Mocap). For a fair com-
method with. We then present our results using both joint
parison, we adopt the same data representation and train-
angles and 3D coordinates.
ing/test splits as in [16], provided in their released code and
4.1. Datasets data. Based on [16], eight actions are selected for evalu-
ation after pre-processing the entire dataset by removing
Human3.6M. To the best of our knowledge, Human3.6M sequences depicting multiple people, sequences with less
(H3.6M)[10] is the largest dataset for human motion anal- training data and actions with repetitions. We apply the
ysis. It depicts seven actors performing 15 actions, such same pre-processing as on H3.6M.
as walking, eating, discussion, sitting, and phoning. The
3DPW. The 3D Pose in the Wild dataset (3DPW) [23] is a
actors are represented by a skeleton of 32 joints. Follow-
recently published dataset which has more than 51k frames
1 Available at http://mocap.cs.cmu.edu/ with 3D annotations for challenging indoor and outdoor ac-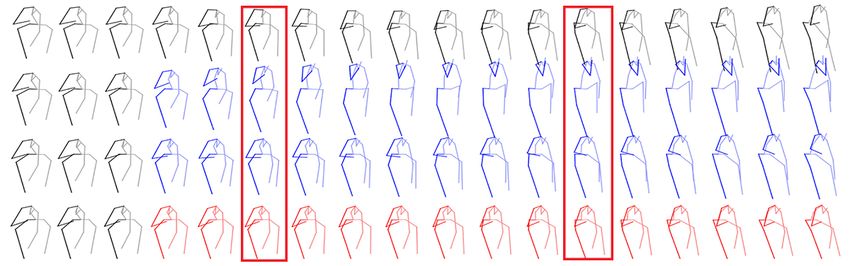
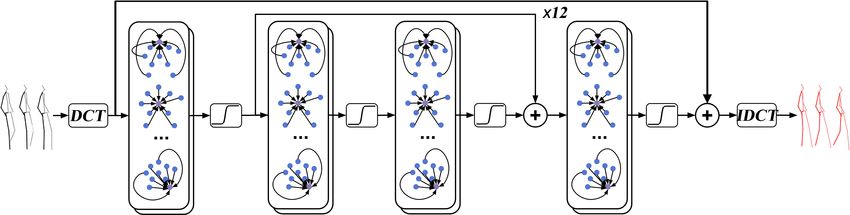
(a)Smoking                                                                         (b)Walking

                                                                                     (c)Walking Dog
Figure 3. Qualitative comparison of short-term (“Smoking” and “Walking”) and long-term (“Walking Dog”) predictions on H3.6M. From
top to bottom, we show the ground truth, and the results of Residual sup. [17], convSeq2Seq [16], our approach based on angles, and our
approach based on 3D positions. The results evidence that our approach generates high-quality predictions in both cases.
                          Walking       Eating        Smoking      Discussion      Average
    milliseconds        560 1000     560     1000   560 1000      560     1000   560 1000     rectly make use of the results provided in the respective pa-
 zero-velocity [17]     1.35 1.32    1.04    1.38   1.02 1.69     1.41    1.96   1.21 1.59
 Residual sup. [17]     0.93 1.03    0.95    1.08   1.25 1.50     1.43    1.69   1.14 1.33    pers of these baselines. Because these works do not report
 convSeq2Seq [16]
 AGED w/o adv [9]
                        N/A 0.92
                        0.89 1.02
                                     N/A
                                     0.92
                                             1.24
                                             1.01
                                                    N/A 1.62
                                                    1.15 1.43
                                                                  N/A
                                                                  1.33
                                                                          1.86
                                                                           1.5
                                                                                 N/A 1.41
                                                                                 1.07 1.24
                                                                                              3D error, in this case, we rely on the code provided by the
  AGED w/adv [9]        0.78 0.91    0.86    0.93   1.06 1.21     1.25    1.30   0.99 1.09    authors of [17, 16], which we adapted so as to take 3D coor-
        Ours            0.65 0.67    0.76    1.12   0.87 1.57     1.33    1.70   0.90 1.27
 Residual sup. [17]     79.4 91.6    82.6 110.8     89.5 122.6   121.9 154.3     93.3 119.8   dinates as input and output. Note that the code of [9] is not
Residual sup. 3D [17]   73.8 86.7   101.3 119.7     85.0 118.5   120.7 147.6     95.2 118.1
 convSeq2Seq [16]       69.2 81.5    71.8    91.4   50.3 85.2    101.0 143.0     73.1 100.3   available, and we were unable to reproduce their method
convSeq2Seq 3D[16]
        Ours
                        59.2 71.3
                        55.0 60.8
                                     66.5
                                     68.1
                                             85.4
                                             79.5
                                                    42.0 67.9
                                                    42.2 70.6
                                                                  84.1 116.9
                                                                  93.8 119.7
                                                                                 62.9 85.4
                                                                                 64.8 82.6
                                                                                              so as to obtain reliable results with their adversarial train-
      Ours 3D           42.3 51.3    56.5    68.6   32.3 60.5     70.5 103.5     50.4 71.0    ing strategy2 . Therefore, we only report the results of this
Table 3. Long-term prediction of joint angles (top) and 3D joint                              method in angle space.
positions (bottom) on H3.6M.
                                                                                              Implementation details. We implemented our network us-
tivities. We use the official training, test and validation sets.                             ing Pytorch [20], and we used ADAM [12] to train our
The frame rate of the 3D annotation is 30Hz.                                                  model. The learning rate was set to 0.0005 with a 0.96 de-
                                                                                              cay every two epochs. The batch size was set to 16 and
4.2. Evaluation Metrics and Baselines
                                                                                              the gradients were clipped to a maximum `2-norm of 1. It
Metrics. We follow the standard evaluation protocol used                                      takes 30ms for one forward pass and back-propagation on
in [17, 16, 9], and report the Euclidean distance between                                     an NVIDIA Titan V GPU. Our models are trained for 50
the predicted and ground-truth joint angles in Euler angle                                    epochs. More details about the experiments are included in
representation. We further report results in terms of 3D er-                                  the supplementary material.
ror. To this end, we make use of the Mean Per Joint Posi-
tion Error (MPJPE) [10] in millimeter, commonly used for                                      4.3. Results
image-based 3D human pose estimation.                                                             To be consistent with the literature, we report our results
   As will be shown later, 3D errors can be measured ei-                                      for short-term (< 500ms) and long-term (> 500ms) pre-
ther by directly train a model on the 3D coordinates (via the                                 dictions. For all datasets, we are given 10 frames (400 mil-
DCT in our case), or by converting the predicted angles to                                    liseconds) to predict the future 10 frames (400 milliseconds)
3D.                                                                                           for short-term prediction and to predict the future 25 frames
Baselines. We compare our approach with two recent                                            (1 second) for long-term prediction.
RNN-based methods, namely, Residual sup. [17] and                                             Human 3.6M. In Table 1, we compare our results to those
AGED (w or w/o adv) [9], and with one feedforward model,
convSeq2Seq [16]. When reporting angular errors, we di-                                         2 Note   that the geodesic loss of [9] does not apply to 3D space.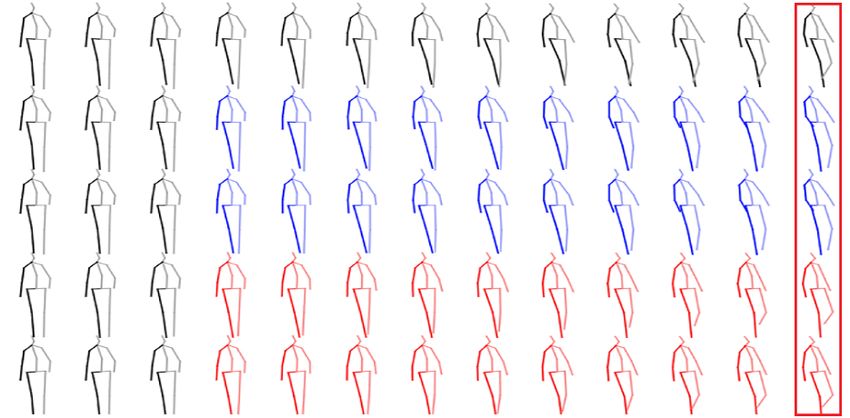
Basketball                        Basketball Signal                   Directing Traffic                         Jumping                              Running
   milliseconds          80    160   320 400         1000    80     160 320 400          1000    80    160 320 400           1000     80    160     320    400    1000     80    160     320 400     1000
 Residual sup. [17]     0.50   0.80  1.27 1.45       1.78   0.41    0.76 1.32 1.54       2.15   0.33   0.59 0.93 1.10        2.05    0.56   0.88    1.77   2.02    2.4    0.33   0.50    0.66 0.75   1.00
 convSeq2Seq [16]       0.37   0.62  1.07 1.18       1.95   0.32    0.59 1.04 1.24       1.96   0.25   0.56 0.89 1.00        2.04    0.39    0.6    1.36   1.56   2.01    0.28   0.41    0.52 0.57   0.67
       Ours             0.33   0.52  0.89 1.06       1.71   0.11    0.20 0.41 0.53       1.00   0.15   0.32 0.52 0.60        2.00    0.31   0.49    1.23   1.39   1.80    0.33   0.55    0.73 0.74   0.95
                                    Soccer                               Walking                          Washwindow                               Average
   milliseconds          80    160 320 400           1000    80     160 320 400          1000    80    160 320 400           1000     80    160     320    400    1000
 Residual sup. [17]     0.29   0.51 0.88 0.99        1.72   0.35    0.47 0.60 0.65       0.88   0.30   0.46 0.72 0.91        1.36    0.38   0.62    1.02   1.18   1.67
 convSeq2Seq [16]       0.26   0.44 0.75 0.87        1.56   0.35    0.44 0.45 0.50       0.78   0.30   0.47 0.80 1.01        1.39    0.32   0.52    0.86   0.99   1.55
       Ours             0.18   0.29 0.61 0.71        1.40   0.33    0.45 0.49 0.53       0.61   0.22   0.33 0.57 0.75        1.20    0.25   0.39    0.68   0.79   1.33
                                   Basketball                        Basketball Signal                   Directing Traffic                         Jumping                              Running
    milliseconds         80    160 320 400          1000     80     160 320 400          1000    80    160 320 400           1000     80    160     320    400    1000     80    160     320 400     1000
Residual sup. 3D[17]    18.4   33.8 59.5 70.5       106.7   12.7    23.8 40.3 46.7       77.5   15.2   29.6 55.1 66.1        127.1   36.0   68.7   125.0 145.5    195.5   15.6   19.4    31.2 36.2   43.3
convSeq2Seq 3D[16]      16.7   30.5 53.8 64.3        91.5    8.4    16.2 30.8 37.8       76.5   10.6   20.3 38.7 48.4        115.5   22.4   44.0    87.5 106.3    162.6   14.3   16.3    18.0 20.2   27.5
      Ours 3D           14.0   25.4 49.6 61.4       106.1    3.5     6.1 11.7 15.2       53.9    7.4   15.1 31.7 42.2        152.4   16.9   34.4    76.3   96.8   164.6   25.5   36.7    39.3 39.9   58.2
                                    Soccer                               Walking                          Washwindow                               Average
    milliseconds         80    160 320 400          1000    80      160 320 400          1000   80     160 320 400           1000     80    160     320    400    1000
Residual sup. 3D[17]    20.3   39.5 71.3      84    129.6   8.2     13.7 21.9 24.5       32.2   8.4    15.8 29.3 35.4        61.1    16.8   30.5    54.2   63.6   96.6
convSeq2Seq 3D[16]      12.1   21.8 41.9 52.9       94.6    7.6     12.5 23.0 27.5       49.8   8.2    15.9 32.1 39.9        58.9    12.5   22.2    40.7   49.7   84.6
      Ours 3D           11.3   21.5 44.2 55.8       117.5   7.7     11.8 19.4 23.1       40.2   5.9    11.9 30.3 40.0        79.3    11.5   20.4    37.8   46.8   96.5
                      Table 4. Short and long-term prediction of joint angles (top) and 3D joint positions (bottom) on CMU-Mocap.
            milliseconds               200          400      600       800       1000
          Residual sup. [17]           1.85         2.37     2.46      2.51       2.53
          convSeq2Seq [16]             1.24         1.85     2.13      2.23       2.26
                Ours                   0.64         0.95     1.12      1.22       1.27
        Residual sup. 3D [17]         113.9        173.1    191.9     201.1      210.7
        convSeq2Seq 3D [16]            71.6        124.9    155.4     174.7      187.5
              Ours 3D                  35.6         67.8     90.6     106.9      117.8
Table 5. Short-term and long-term prediction of joint angle (top)
and 3D joint positions (bottom) on 3DPW.

of the baselines for short-term prediction in angle space on
H3.6M. Table 1 reports the errors for the activities “Walk-
ing”, “Eating”, “Smoking” and “Discussion”, which have
been the focus of the comparisons in the literature. It also
provides the results for the other 11 activities and the aver-
age over the 15 activities. Note that we outperform all the                                                                                           (a)
baselines on average. We provide qualitative comparisons
in Fig. 3. They further evidence that our predictions are
closer to the ground truth than that of the baselines for all 3
actions. More visualizations are included in the supplemen-
tary material.
   To analyze the failure cases of our approach, such as for
“Phoning”, we converted the predicted angles to 3D coor-                                                                                              (b)
dinates so as to visualize the poses. We were then surprised                                               Figure 4. Drawbacks of the angle-based representation. (a) Joint
to realize that a high error in angle space did not necessar-                                              angle error (top) and 3D position error (bottom) for each predicted
                                                                                                           frame on the Phoning H3.6M action. While all methods have
ily translate to a high error in 3D space. This is due to the
                                                                                                           a similar error in angle space, Residual sup. [17] yields a much
fact that the angle representation is ambiguous, and thus two
                                                                                                           higher one in 3D. This is also reflected by the qualitative compar-
very different sets of angles can yield the same pose. To ev-                                              ison in (b). In the predictions of [17] (2nd row), the 3D location
idence this, in Fig. 4, we plot the angle error for three meth-                                            of the right hand and left leg are too high and far away from the
ods, including ours, on the same sequence, as well as the                                                  ground truth, leading to unrealistic poses. By contrast, the predic-
corresponding 3D errors obtained by simply converting the                                                  tions of [16] (3rd row) and our method (last row) are closer to the
angles to 3D coordinates. Note that, while all three meth-                                                 ground truth.
ods have comparable errors in angle space, two of them,
including ours, have a much lower error than the third one                                                 the angle predictions of [9], we are unable to provide the
in 3D space. This makes us argue that angles are not a good                                                3D results for this method. When considering the remain-
representation to evaluate motion prediction.                                                              ing baselines, our approach consistently outperforms them,
   Motivated by this observation, in Table 2, we report the                                                yielding the best results when directly using the 3D infor-
3D errors for short-term prediction on H3.6M. As men-                                                      mation (via the DCT) during training.         In Table 3, we
tioned before, there are two ways to achieve this: Con-                                                    report the long-term prediction errors on H3.6M in angle
verting the predicted angles to 3D or directly training the                                                space and 3D space. In angle space, our approach yields
models on 3D coordinates. We report the results of both                                                    the best results for 500ms, but a higher error than that of [9]
strategies. Note that, having access to neither the code nor                                               for 1000ms. Note that, based on our previous analysis, it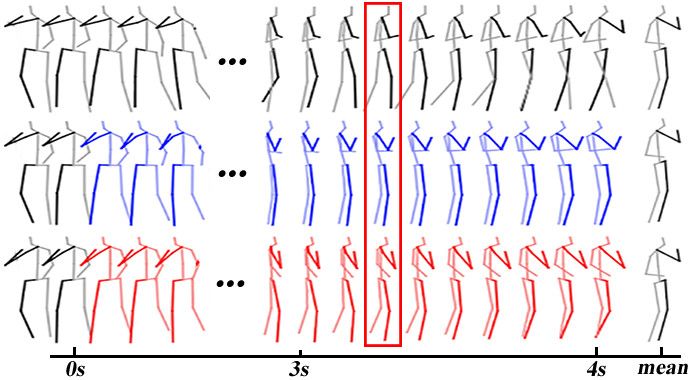
Walking                       Eating                      Smoking                        Discussion                       Average
 dct   padding    resi    80     160 320      400      80     160 320      400       80     160 320     400         80      160 320        400      80     160 320     400
          X        X     0.20    0.33 0.52    0.59    0.17    0.30 0.50    0.62     0.22    0.41 0.83   0.78       0.24     0.60 0.91      0.97    0.21    0.41 0.69   0.74
 X                 X     0.34    0.46 0.65    0.71    0.33    0.44 0.63    0.76     0.47    0.60 0.94   0.95       0.40     0.70 0.95      1.00    0.39    0.55 0.79   0.86
 X        X              0.25    0.41 0.62    0.69    0.26    0.39 0.60    0.73     0.31    0.49 0.89   0.89       0.34     0.72 0.97      1.02    0.29    0.50 0.77   0.83
 X        X        X     0.18    0.31 0.49    0.56    0.16    0.29 0.50    0.62     0.22    0.41 0.86   0.80       0.20     0.51 0.77      0.85    0.19    0.38 0.66   0.71
          X        X     11.4    19.5 32.9    38.3    10.6    21.4 41.1    48.0     9.4     16.7 27.2   32.2       14.1     29.6 49.9      54.1    11.4    21.8 37.8   43.1
 X                 X     19.1    24.7 37.3    41.5    24.7    30.4 48.6    55.8     40.5    41.0 48.9   53.0       22.6     29.9 46.7      51.3    26.7    31.5 45.4   50.4
 X        X              18.3    25.9 39.7    43.7    20.1    29.4 48.8    56.7     29.0    34.2 43.8   49.3       23.3     31.2 46.8      51.0    22.7    30.2 44.8   50.2
 X        X        X      8.9    15.7 29.2    33.4     8.8    18.9 39.4    47.2     7.8     14.9 25.3   28.7       9.8      22.1 39.6      44.1     8.8    17.9 33.4   38.4
Table 6. Influence of the DCT representation, the padding strategy, and the residual connections on 4 actions of H3.6M. Top: angle error;
Bottom: 3D error (Models are trained on 3D). Note that, on average, all components of our model contribute to its accuracy.
                                          Walking                      Eating                    Smoking                      Discussion                     Average
                                  80    160 320      400      80    160 320       400     80    160 320     400       80      160 320       400      80    160 320     400
   Fully-connected network       0.20   0.34 0.54    0.61    0.18   0.31 0.53     0.66   0.22   0.43 0.85   0.83     0.28     0.64 0.87     0.93    0.22   0.43 0.70   0.76
 with pre-defined connectivity   0.25   0.46 0.70    0.8     0.23   0.41 0.68     0.83   0.24   0.46 0.93   0.91     0.27     0.62 0.89     0.97    0.25   0.49 0.80   0.88
  with learnable connectivity    0.18   0.31 0.49    0.56    0.16   0.29 0.50     0.62   0.22   0.41 0.86   0.80     0.20     0.51 0.77     0.85    0.19   0.38 0.66   0.71
   Fully-connected network       11.2   18.6 33.5    38.8     9.0   18.8 39.0     48.0   8.5    15.4 26.3   31.4     12.2     26.0 46.3     53.0    10.2   19.7 36.3   42.8
 with pre-defined connectivity   25.6   44.6 80.3    96.8    16.3   31.9 62.4     78.8   11.6   21.4 34.6   38.6     20.7     38.7 62.5     69.9    18.5   34.1 59.9   71.0
  with learnable connectivity     8.9   15.7 29.2    33.4     8.8   18.9 39.4     47.2   7.8    14.9 25.3   28.7     9.8      22.1 39.6     44.1    8.8    17.9 33.4   38.4
Table 7. Influence of GCNs and of learning the graph connectivity. Top: angle error; Bottom: 3D error. Note that GCNs with a pre-defined
connectivity yield much higher errors than learning this connectivity as we do.

is unclear if this is due to actual worse predictions or to                                based on the kinematic tree. The results of these experi-
the ambiguities of the angle representation. In terms of 3D                                ments, provided in Table 7, demonstrate the benefits of both
errors, as shown in Table 3, our approach yields the best re-                              using GCNs and learning the corresponding graph struc-
sults by a large margin, particularly when trained using 3D                                ture. Altogether, this ablation study evidences the impor-
coordinates.                                                                               tance of both aspects of our contribution: Using the DCT to
CMU-Mocap & 3DPW. We report the results on the CMU                                         model temporal information and learning the connectivity
dataset in terms of angle errors and 3D errors in Table 4, and                             in GCNs to model spatial structure.
those on the 3DPW in Table 5. In essence, the conclusions
remain unchanged: Our method consistently outperforms                                      5. Conclusion
the baselines for both short-term and long-term prediction,
                                                                                              In this paper, we have introduced an approach to hu-
with the best results obtained when working directly with
                                                                                           man motion prediction that jointly encodes temporal infor-
the 3D representation.
                                                                                           mation, via the use of the DCT, and spatial structure, via
                                                                                           GCNs with learnable connectivity. This leads to a compact,
4.4. Ablation Study
                                                                                           feed-forward network with proven highly effectiveness for
    To provide a deeper understanding of our approach, we                                  the prediction task. Our approach achieves state-of-the-art
now evaluate the influence of its several components. In                                   results on standard human motion prediction benchmarks.
particular, we investigate the importance of relying on the                                Experiments have also revealed an interesting phenomenon:
DCT to represent the temporal information. To this end, we                                 evaluating motion prediction in angle space is unreliable, as
compare our approach with a graph convolutional network                                    the angle representation has ambiguities such that two very
trained using the joint angles or 3D coordinates directly                                  different sets of angles can share the same 3D pose. We thus
as input. Furthermore, we study the influence of padding                                   argue that, in contrast to the main trend in the literature, mo-
the input sequence with replicates of the last observed time                               tion prediction should be performed in 3D space. This was
step, instead of simply taking a shorter sequence as input,                                confirmed by our experiments, in which the models trained
and the impact of using residual connections in our network.                               on 3D coordinates consistently outperform those trained on
    The results of these different experiments are provided in                             angles. Our future work will focus on a systematic analysis
Table 6. These results show that using our padding strategy                                of this phenomenon.
provides a significant boost in accuracy, and so do the resid-
ual connections. In angle space, the influence of the DCT
                                                                                           Acknowledgements
representation is sometimes small, but it remains important                                    This research was supported in part by the Aus-
for some activities, such as ”Discussion”. By contrast, in                                 tralia Centre for Robotic Vision (CE140100016),
3D space, using the DCT representation yields significantly                                the Australia Research Council DECRA Fellowship
better results in all cases.                                                               (DE180100628), ARC Discovery Grant (DP190102261)
    Finally, we evaluate the importance of using GCNs vs                                   and LIEF(LE190100080). The authors would like to thank
fully-connected networks and of learning the connectivity                                  NVIDIA for the donated GPU (Titan V) and the GPU
in the GCN instead of using a pre-defined adjacency matrix                                 cluster in NCI Australia.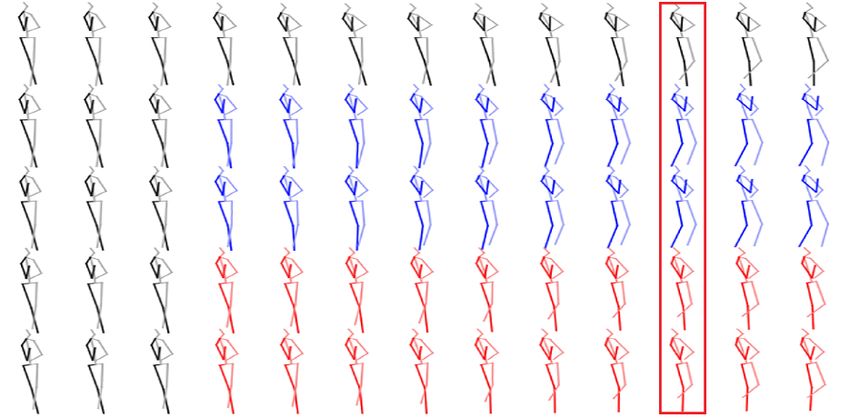
Learning Trajectory Dependencies for Human Motion Prediction
                      —–Supplementary Material—–
                   Wei Mao1 , Miaomiao Liu1,3 , Mathieu Salzmann2 , Hongdong Li1,3
           1
             Australian National University, 2 CVLab, EPFL,3 Australia Centre for Robotic Vision
             {wei.mao, miaomiao.liu, hongdong.li}@anu.edu.au, mathieu.salzmann@epfl.ch

1. Datasets
   Below, we provide more detail on the datasets used in
our experiments.
Human3.6M. In H3.6M, each pose has 32 joints. Re-
moving the global rotation, translation and constant angles,
leaves us with a 48 dimensional vector for each human mo-
tion, denoting the exponential map representation of the
joint angles. Furthermore, a 3D human pose can also be
represented by a 66 dimensional vector of 3D coordinates
after removing the global rotation, translation and station-
ary joints across time. We use the same training and test
                                                                 Figure 1. Motion prediction in 3D space on the “basketball action
split as previous work [17, 16, 9]. That is, we test our
                                                                 of CMU-Mocap. From top to bottom: Ground truth, results of
model on the same image sequence of subject 5 as previous        [17], results of [16] and our results. The highlighted results in the
work [17, 16, 9]. For training, we keep subject 11 as val-       box show that we can make better predictions on the legs and arms
idation set to choose the best model (the one that achieves      of the subject.
the least average error across all future frames) and use the
remaining 5 subjects as training set.
CMU-Mocap. In this dataset, we use a 64 dimensional vec-         rors are observed according to the angle representation but
tor to represent every human pose by removing the global         small errors in 3D space. This confirms that ambiguities
rotation, translation and joint angles with constant values.     exist in angle space for human motion prediction.
Each component of the vector denotes the exponential map
representation of the joint angle. We further use 75 dimen-      3. Visualizing the Results on CMU-Mocap
sional vectors for the 3D joint coordinate representation.          We provide a qualitative visualisation of the 3D hu-
We do not use a validation set due to limited training data.     man pose prediction on the “basketball”, “basketball signal”
3DPW. The human skeleton in this dataset uses 24 joints,         and “direction traffic” actions of the CMU-Mocap dataset
yielding a 72 dimensional vector for the angle representa-       in Fig. 1, Fig. 2 and Fig. 3, respectively. Again, our
tion. For the 3D joint coordinate one, we obtain a 69 di-        approach outperforms the state-of-the-art ones (see high-
mensional vector after removing the global translation.          lighted poses).

2. Visualizing the Results on H3.6M in Video                     4. Number of DCT Coefficients
    We provide more visualization of the results on H3.6M           In this section, we first present the intuition behind us-
in a video (See the supplementary video). In particular, the     ing fewer DCT coefficients to represent the whole sequence.
video compares our approach with the state of the art on         We then compare the performance of using different num-
periodic actions, such as walking, and aperiodic ones, such      ber of DCT coefficients.
as eating and direction. Our approach shows better perfor-
                                                                 4.1. Using Fewer Coefficients
mance than the state-of-the-art ones.
    Furthermore, in the video, we provide additional (quanti-       Given a smooth trajectory, it is possible to discard some
tative and qualitative) visualization of cases where large er-   high frequency DCT coefficients without losing prediction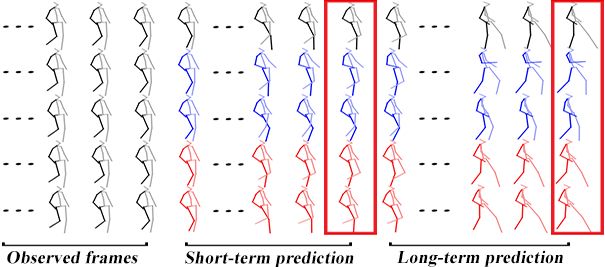
4.2. Results on H3.6M
                                                                         Experiment setup. Based on the previous discussion,
                                                                     we perform more experiments to evaluate the influence of
                                                                     the number of input DCT coefficients on human motion pre-
                                                                     diction. In the following experiments, we assume that we
                                                                     observe 10 frames to predict the future 25 frames. Follow-
                                                                     ing the same formulation as in our submission, the observed
                                                                     sequence is padded with the last observed frame replicated
                                                                     25 times and then transformed to DCT coefficients. The
                                                                     target is the DCT coefficients of the whole sequence (35
                                                                     frames). We perform several experiments by preserving dif-
Figure 2. Motion prediction in 3D space on the “basketball signal”   ferent number of DCT coefficients. For instance, ‘dct n=5’
action of CMU-Mocap. From top to bottom: Ground truth, results       means that we only use the first 5 DCT coefficients for tem-
of [17], results of [16] and our results.                            poral reconstruction. The experiments are performed on
                                                                     both 3D and angle representation.
                                                                         Fig. 6 shows the error for short-term prediction at 160ms
                                                                     and long-term prediction at 560ms in angle representation
                                                                     as a function of the number of DCT coefficients. In gen-
                                                                     eral, the angle error decreases with the increase of number
                                                                     of DCT coefficients. Similarly, in Fig. 7, we plot the mo-
                                                                     tion prediction error in 3D coordinates at 160ms and 560ms
                                                                     as a function of the number of DCT coefficients. Here, 10
                                                                     DCT coefficients already give a very small prediction er-
                                                                     ror. Interestingly, when we use more DCT coefficients, the
                                                                     average error sometimes increases (see the plot for predic-
                                                                     tion at 560ms). This pattern confirms our argument in the
Figure 3. Motion prediction in 3D space on the “directing traffic”   submission that the use of truncated DCT coefficients can
action of CMU-Mocap. From top to bottom: Ground truth, results       prevent a model from generating jittery motion, because the
of [17], results of [16] and our results.                            3D coordinate representation of human motion trajectory is
                                                                     smooth.
                                                                         To analyse the different patterns of the prediction error
                                                                     w.r.t. the number of DCT coefficients shown in angle repre-
                                                                     sentation (Fig. 6) and 3D representation (Fig. 7), we looked
                                                                     into the dataset and found that there are large discontinuities
                                                                     in the trajectories of angles. As shown in Fig. 8, these large
                                                                     jumps make the reconstruction of trajectories with fewer
                                                                     DCT coefficients lossy.
                                                                         In summary, we can discard some of the high frequency
                                                                     coefficients to achieve better performance in 3D space. In
                                                                     our experiments, we use the first 15 DCT coefficients as in-
                                                                     put to our network for short-term prediction and 30 coeffi-
Figure 4. Temporal trajectory of the x coordinate of one joint re-   cients for long-term prediction in 3D space. As the joint tra-
constructed using different number of DCT coefficients.              jectory in angle representation is not smooth and has large
                                                                     discontinuities, we therefore take the full frequency as in-
                                                                     put to our network for motion prediction in angle represen-
accuracy. To evidence this, in Fig. 4, we show the effect            tation. In our experiments, we therefore use 20 DCT coeffi-
of the number of DCT components in reconstructing a se-              cients as input to our network for short-term prediction and
quence of 35 frames for the one human joint predicted using          35 for long-term prediction in angle representation.
our approach. Note that, since we use 35 frames, 35 DCT
coefficients yield a lossless reconstruction. Nevertheless,          5. Ablation Study Details
even 10 DCT coefficients are enough to reconstruct the tra-
jectory with a very low error. This is due to the smoothness            Fully-connected Network. In our ablation study, we
of the joint trajectory in 3D space.                                 also compare the motion prediction using a graph network
Figure 5. Fully-connected Network Structure
Figure 8. The temporal trajectory of one joint angle reconstructed
using different number of DCT coefficients. Note that the trajec-
Figure 6. Average angle prediction error over 4 actions (”walk- tory is not smooth and has large jumps. The full frequency (35
ing”,”eating”,”smoking”,”discussion”) using different number of DCT coefficients) leads to lossless temporal reconstruction of the
DCT coefficients at 160ms (blue) and 560ms (red). trajectory.
ing the DCT coefficients and at the end for decoding the
feature to the residual of the DCT coefficient.
The implementation details for this network are the same
as our Graph Convolutional Network. We implemented this
network using Pytorch [20], and we used ADAM [12] to
train this model. The learning rate was set to 0.0005 with a
0.96 decay every two epochs. The batch size was set to 16
and the gradients were clipped to a maximum `2-norm of
1. The model was trained for 50 epochs. As reported in the
submission, the fully-connected network structure cannot
learn a better representation than the Graph Convolutional
Figure 7. Average 3D prediction error over 4 actions (“walk- Network.
ing”,“eating”,“smoking”,“discussion”) using different number of
DCT coefficients at 160ms (blue) and 560ms (red).
6. Mean Pose Problem
with that of a fully-connected network structure. We apply
the same process of encoding temporal information via the As explained in [16], the mean pose problem typically
DCT. Before being fed to the network, the DCT coefficients occurs when using recurrent neural networks (RNNs) to en-
of the past sequence padded with last frame are flattened code temporal dynamics, where the past information may
to a vector and the network learns the residual between the vanish during long propagation paths. By not relying on
past temporal encoding and the future one. To this end, we RNNs, but directly encoding the trajectory of the whole
adopt the network structure shown in Fig. 5. Instead of us- sequence, our method inherently prevents us from losing
ing graph convolutional layers, we rely on 2 fully connected the past information. This is evidenced by Fig. 9, where
layers with residual connections. We additionally use two our method yields poses significantly further from the mean
fully connected layers at the start of the network for encod- pose than the RNN-based method [17].[11] Ashesh Jain, Amir Roshan Zamir, Silvio Savarese, and
Ashutosh Saxena. Structural-rnn: Deep learning on spatio-
temporal graphs. In CVPR, pages 5308–5317, 2016. 1, 2
[12] Diederik P Kingma and Jimmy Ba. Adam: A method for
stochastic optimization. arXiv preprint arXiv:1412.6980,
2014. 6, 11
[13] Thomas N Kipf and Max Welling. Semi-supervised classifi-
cation with graph convolutional networks. In ICLR, 2017. 2,
4
[14] Ryan Kiros, Yukun Zhu, Ruslan R Salakhutdinov, Richard
Zemel, Raquel Urtasun, Antonio Torralba, and Sanja Fidler.
Skip-thought vectors. In Advances in neural information
Figure 9. Prediction up to 4 seconds for the Phoning action of Hu-
processing systems, pages 3294–3302, 2015. 2
man3.6m. From top to bottom, we show the ground truth, the
poses predicted by [17] , and by our method. Note that, after the [15] Hema Swetha Koppula and Ashutosh Saxena. Anticipating
highlighted frame, the poses predicted by the RNN of [17] have human activities for reactive robotic response. In IROS, page
indeed converged to the mean pose (shown in the last column), 2071. Tokyo, 2013. 1
whereas in our predictions the legs continue to move. [16] Chen Li, Zhen Zhang, Wee Sun Lee, and Gim Hee Lee. Con-
volutional sequence to sequence model for human dynamics.
In CVPR, pages 5226–5234, 2018. 1, 2, 5, 6, 7, 9, 10, 11
References [17] Julieta Martinez, Michael J. Black, and Javier Romero. On
human motion prediction using recurrent neural networks. In
[1] Ijaz Akhter, Yaser Sheikh, Sohaib Khan, and Takeo Kanade.
CVPR, July 2017. 1, 2, 4, 5, 6, 7, 9, 10, 11, 12
Nonrigid structure from motion in trajectory space. In Ad-
vances in neural information processing systems, pages 41– [18] Brian Paden, Michal Čáp, Sze Zheng Yong, Dmitry Yershov,
48, 2009. 2, 3 and Emilio Frazzoli. A survey of motion planning and con-
trol techniques for self-driving urban vehicles. IEEE Trans-
[2] Martı́n Arjovsky and Léon Bottou. Towards principled meth-
actions on intelligent vehicles, 1(1):33–55, 2016. 1
ods for training generative adversarial networks. In ICLR,
2017. 2 [19] Razvan Pascanu, Tomas Mikolov, and Yoshua Bengio. On
[3] Matthew Brand and Aaron Hertzmann. Style machines. In the difficulty of training recurrent neural networks. In ICML,
Proceedings of the 27th annual conference on Computer pages 1310–1318, 2013. 1
graphics and interactive techniques, pages 183–192. ACM [20] Adam Paszke, Sam Gross, Soumith Chintala, Gregory
Press/Addison-Wesley Publishing Co., 2000. 1 Chanan, Edward Yang, Zachary DeVito, Zeming Lin, Al-
[4] Joan Bruna, Wojciech Zaremba, Arthur Szlam, and Yann Le- ban Desmaison, Luca Antiga, and Adam Lerer. Automatic
Cun. Spectral networks and locally connected networks on differentiation in pytorch. In NIPS-W, 2017. 6, 11
graphs. In ICLR, 2014. 2 [21] Ilya Sutskever, James Martens, and Geoffrey E Hinton. Gen-
[5] Judith Butepage, Michael J. Black, Danica Kragic, and Hed- erating text with recurrent neural networks. In ICML, pages
vig Kjellstrom. Deep representation learning for human mo- 1017–1024, 2011. 2
tion prediction and classification. In CVPR, July 2017. 1, 2, [22] Petar Veličković, Guillem Cucurull, Arantxa Casanova,
3 Adriana Romero, Pietro Lio, and Yoshua Bengio. Graph at-
[6] Michaël Defferrard, Xavier Bresson, and Pierre Van- tention networks. In ICLR, 2018. 2, 3, 4
dergheynst. Convolutional neural networks on graphs with [23] Timo von Marcard, Roberto Henschel, Michael Black, Bodo
fast localized spectral filtering. In Advances in neural infor- Rosenhahn, and Gerard Pons-Moll. Recovering accurate 3d
mation processing systems, pages 3844–3852, 2016. 2 human pose in the wild using imus and a moving camera. In
[7] Katerina Fragkiadaki, Sergey Levine, Panna Felsen, and Ji- ECCV, 2018. 5
tendra Malik. Recurrent network models for human dynam- [24] Jack M Wang, David J Fleet, and Aaron Hertzmann. Gaus-
ics. In ICCV, pages 4346–4354, 2015. 1, 2 sian process dynamical models for human motion. IEEE
[8] Haifeng Gong, Jack Sim, Maxim Likhachev, and Jianbo Shi. transactions on pattern analysis and machine intelligence,
Multi-hypothesis motion planning for visual object tracking. 30(2):283–298, 2008. 1
In ICCV, pages 619–626. IEEE, 2011. 1 [25] Sijie Yan, Yuanjun Xiong, and Dahua Lin. Spatial tempo-
[9] Liang-Yan Gui, Yu-Xiong Wang, Xiaodan Liang, and ral graph convolutional networks for skeleton-based action
José MF Moura. Adversarial geometry-aware human mo- recognition. In Thirty-Second AAAI Conference on Artificial
tion prediction. In ECCV, pages 786–803, 2018. 1, 2, 5, 6, Intelligence, 2018. 3
7, 9
[10] Catalin Ionescu, Dragos Papava, Vlad Olaru, and Cristian
Sminchisescu. Human3.6m: Large scale datasets and predic-
tive methods for 3d human sensing in natural environments.
IEEE Transactions on Pattern Analysis and Machine Intelli-
gence, 36(7):1325–1339, jul 2014. 4, 5, 6You can also read