Exploiting Investors Social Network for Stock Prediction in China's Market
←
→
Page content transcription
If your browser does not render page correctly, please read the page content below
Exploiting Investors Social Network for Stock
                                                        Prediction in China’s Market

                                                      Xi Zhanga,∗, Jiawei Shia , Di Wanga , Binxing Fanga,b
                                        a Key Laboratory of Trustworthy Distributed Computing and Service, Ministry of Education,
                                                 Beijing University of Posts and Telecommunications, Beijing 100876, China
                                        b Institute of Electronic and Information Engineering of UESTC in Guangdong, Dongguan
arXiv:1801.00597v1 [cs.CE] 2 Jan 2018

                                                                          Guangdong 523808, China

                                        Abstract

                                        Recent works have shown that social media platforms are able to influence the
                                        trends of stock price movements. However, existing works have majorly focused
                                        on the U.S. stock market and lacked attention to certain emerging countries
                                        such as China, where retail investors dominate the market. In this regard,
                                        as retail investors are prone to be influenced by news or other social media,
                                        psychological and behavioral features extracted from social media platforms are
                                        thought to well predict stock price movements in the China’s market. Recent
                                        advances in the investor social network in China enables the extraction of such
                                        features from web-scale data. In this paper, on the basis of tweets from Xueqiu, a
                                        popular Chinese Twitter-like social platform specialized for investors, we analyze
                                        features with regard to collective sentiment and perception on stock relatedness
                                        and predict stock price movements by employing nonlinear models. The features
                                        of interest prove to be effective in our experiments.
                                        Keywords: Social Network Analysis, Stock Market Prediction, Sentiment
                                        Analysis, User Perception

                                          ∗ Corresponding author
                                            Email addresses: zhangx@bupt.edu.cn (Xi Zhang), 2011212788@bupt.edu.cn (Jiawei
                                        Shi), jxgzwd@bupt.edu.cn (Di Wang), fangbx@bupt.edu.cn (Binxing Fang)

                                        Preprint submitted to Journal of LATEX Templates                         January 3, 2018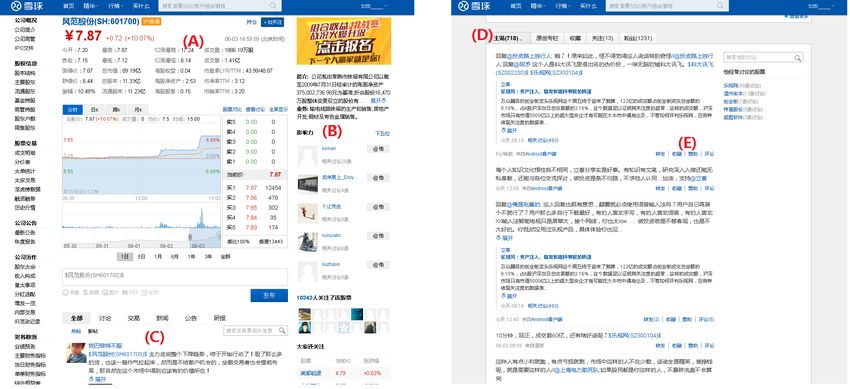
1. Introduction

   Social networks such as Twitter, Weibo, Facebook, and LinkedIn have at-
tracted millions of users to post and acquire information, which have been well
studied by various works [1, 2, 3, 4]. In addition to these general social net-
works, there is another breed of smaller, more focused sites that cater to niche
audiences. Here we look at a social site designed for traders and investors, that
is, Xueqiu. Xueqiu is a specialized social network for Chinese investors of the
stock market, and due to the increasing number of retail investors, Xueqiu has
attracted millions of users. Xueqiu enables investors to share their opinions on a
twitter-like platform, or post their portfolios, demonstrating their trading oper-
ations and returns. Different from those general social networks, almost all the
information on Xueqiu is related to stocks, making it a natural data source to
collect investors’ perceptions, which may be useful for stock market prediction
in China.
   The literature on stock market prediction was early based on the Efficient
Market Hypothesis (EMH) and random walk theory [5]. However, investors’ re-
actions may not support a random walk model in reality. Behavioral economics
has provided plenty of proofs that financial decisions are significantly driven
by sentiment. The collective level of optimism or pessimism in society can af-
fect investor decisions [6, 7]. Besides, investor perceptions on the relatedness
of stocks can also be a potential predictor. Firms may be economically related
with one another [8, 9]. Therefore, there is a probability that one stock’s price
movement can influence its peer’s due to the investment reactions driven by
investors’ perceptions on such relatedness.
   Sentiment and perception are psychological constructs and thus difficult to
measure in archive analyses. News articles have been used as a major source for
textual content analysis. For example, news articles are employed to analyze
public mood [10], by which stock price movements can be predicted. However,
this type of content has an obvious drawback that news articles directly reflect
their authors’ sentiment rather than the investors’. Online social platforms have

                                        2
provided us with more direct data and enable opportunities for exploring users’
sentiment and perception. In recent studies, it is found in [11] that collective
mood derived from Twitter feeds improved the prediction accuracy of Dow
Jones Industrial Average (DJIA). Facebook’s Gross National Happiness (GNH)
index is shown to have the ability to predict changes in both daily returns and
trading volume in the U.S. stock market [12]. The predictability of StockTwits
(Twitter-like platform specialized on exchanging trading-related opinions) data
with respect to stock price behavior is reported in [13].
   Most of the existing studies have focused on the U.S. stock market and lacked
attention to certain emerging countries such as China, where the stock market is
inefficient exhibiting a considerable non-random walk pattern [14]. The China’s
stock market (also denoted as the A-share market) differs remarkably from other
major markets in the structure of investors. Specifically, unlike other major
stock markets, which are dominated by institutional investors, retail investors
account for a greater percentage in China’s market. Importantly, retail investors
are more likely to buy rather than sell stocks that catch their attention and
thus tend to be influenced by news or other social medias [15]. Therefore,
in this paper, we study the China’s stock market based on a unique dataset
from a popular Chinese Twitter-like social platform specialized for investors,
namely Xueqiu (which means ’snowball’ in Chinese), aiming to fill this gap in
the literature.
   To demonstrate how closely Xueqiu is related to the China’s stock market,
Figure 1 (a) shows the daily published tweets volume of all stocks on Xueqiu
and the daily trading volume of the A-share market from November 2014 to
May 2015. It can be observed that the fluctuation trends of these two curves
show great synchronicity, especially when high trading volume volatility occurs.
When we look at the individual stocks, the synchronicity between the movement
of daily tweets volume and the movement of daily turnover rate still holds, as
displayed in Figure 1 (b), where one of the most popular stocks in Xueqiu, that
is, the CITIC Securities, is taken as an example. On the basis of the tweets from
Xueqiu, we analyze features with regard to collective sentiment and perception.

                                        3
Figure 1: Tweets number of Xueqiu vs. trading volume and turnover
The sentiment and perceived stock relatedness are proposed to be formed on the
basis of two types of networks extracted from Xueqiu. One is the user network,
and the other is the stock network perceived by users. Combined with the
network characteristics, the features can exhibit better predictive performance.
In contrast to previous works that only study a small subset of the stocks, we
evaluate our proposal on all the active stocks (more than 2000) in the A-share
market, indicating it’s a feasible approach.
In the remainder of the article, we first briefly introduce related research
in Section 2. The online social platform Xueqiu and the crawled dataset are
described in Section 3. Then, we describe the methodology in Section 4 and
present the experiment of predicting stock price movements in Section 5. Finally,
the article is concluded in Section 6.
2. Sentiment, Perception, and Stock Market
2.1. Stock Prediction with Historical Price Data
Most of previous studies utilize historical stock prices to make predictions
with various models [16, 17, 18, 19]. A Support Vector Machine-based model
4is proposed by using the selected subset of financial indexes as the weight in-
puts [20]. A multi-layer perceptron method is proposed for short-term stock
prediction in [21]. Multiple techniques of Artificial Neural Network (ANN) in
stock market prediction are evaluated in [22]. However, these works only uses
the historical price data and ignores the impacts of social media.
2.2. Sentiment and Stock Price Movement
A variety of studies have found that financial news can have significant ef-
fects on stock price movements [23, 24, 25, 26, 27]. Recent studies try to extract
events from the news with natural language techniques for event-driven predic-
tion [28] [29]. News sentiments are measured and the combined effect of Web
news and social media on stock markets are studied in [30].The investors’ senti-
ments can also be extracted from social networks, media platforms, and blogs.
It is reported that social networks such as twitter [11] [31] and Facebook [12]
are important sources of sentiment data. Specialized social networks, such as
StockTwits, has also shown its predictive power [13]. A method to measure
the collective hope and fear on each day and analyze the correlation between
these indices and the stock market indicators is proposed in [32]. A topic-based
sentiment time series approach is proposed to predict the market [33]. This
work is extended to further exploit the social relations between stocks from the
social media context. A stock network is built with Twitter by co-occurring
relationships, and a labeled topic model is employed to jointly model the tweets
and the network structure to assign each node and each edge a topic respec-
tively. Then, a lexicon-based sentiment analysis method is used to compute the
sentiment score for each node and edge topic. Last, the sentiment time series
and price time series are used for prediction [34]. Financial trend prediction can
be boosted with Twitter moods based on deep network models [35]. Sentiments
and events are integrated with a tensor for stock prediction in [36].
Overall, most of the prior studies focus on the English social media and U.S.
stock market, with little attention paid to China’s stock market and China’s
social media. To predict China’s stock market, we are going to conduct analysis
5on Chinese social media to extract the sentiments. In this work, we choose
Xueqiu, a specialized Chinese microblog platform used by millions of investors.
Our research will investigate whether sentiments extracted from Xueqiu can be
useful for China’s stock market prediction.
2.3. Investor Perceived Stock Relatedness and Stock Price Movement
Stock correlations are important to understand the behavior of the stock
market, and can be measured in various ways. A model of coupled random
walks is proposed to model stock correlations, and the walks are coupled via the
price change triggered by the price gradients over some underlying network [37].
The correlations between stocks are reflected by a stochastic correlation model
in [38]. Time-series stock correlations are modeled as a mean reverting process,
together with a term related to index return [39]. In [40], the average correla-
tions among stocks are found to scale linearly with market stress reflected by
normalized DJIA index returns on various time scales.
Due to the advances of social media, the human perceived stock relatedness
can be captured. Some of the relatednesses is latent or instant, making them im-
portant complementaries to tradition classification schemes such as Standard In-
dustry Classification (SIC) scheme. The textual similarity in firms’ self-reported
business descriptions in their filings is analyzed to infer product market-based
peers [41] [42]. Relatedness is defined as a large share of common users on the
internet message boards of two companies [43], suggesting that stocks associ-
ated with each other on message boards may exhibit stronger comovement. The
news-based measure of relatedness on investor perceptions of stocks on Twitter
is proposed in [44], which can help delineate meaningful industry groups. A co-
search algorithm is applied to Internet traffic at the SEC’s EDGAR website [45],
for identifying economically-related peer firms and for measuring their relative
importance. The notion of the semantic stock network from twitter is proposed
in [31], using the topic sentiments from close neighbors of a stock to improve
the prediction of the stock market. Stock network models study the correlations
of stocks in a graph-based view. Different from the common approaches that
6measure the pairwise correlations of stocks’ historical price series, our approach
leverages Xueqiu and identifies the pairwise stocks that are mentioned in one
contagion. Our research investigates whether the relatedness extracted from
Xueqiu can help to predict the stock price movement.
3. Data Description
This section gives details on the mechanism of Xueqiu and the dataset used
in this paper. We also conduct data analysis to show the characteristics of
Xueqiu.
3.1. The Mechanism of Xueqiu
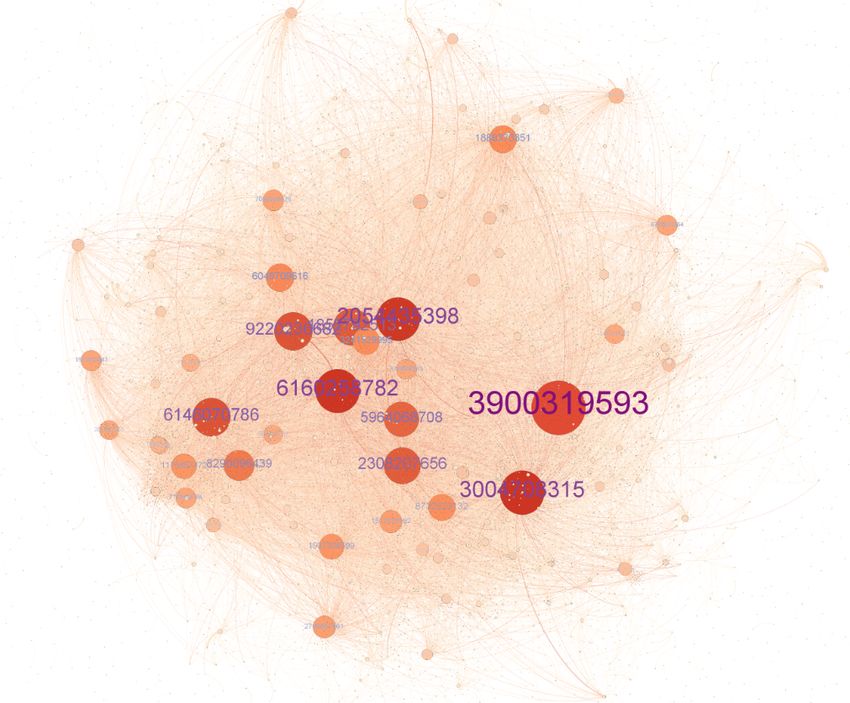
Figure 2: Xueqiu web pages
Xueqiu is a specialized social network for Chinese investors of the stock
market. It was established in 2010, and mainly focused on U.S. stock market
at first. Since 2014, more and more attention has been paid to A-share mar-
ket. By the end of 2015, there had been millions of registered users. Xueqiu
enables investors to share their opinions on a twitter-like platform, that is, a
user can post, reply or repost others’ contagions. In addition, each user can
follow or be followed by other users, and the number of followers demonstrates
his/her authority in some degree. The administrators and official agency of
7quoted company usually publish authoritative announcements on Xueqiu. In
addition to the announcements and opinions, a number of investors post their
portfolios, demonstrating their trading operations and returns. Different from
general social networks such as twitter or Weibo, almost all the information on
Xueqiu is related to stocks, making it a natural data source to collect investors’
perceptions.
A typical web page of Xueqiu is shown in Figure 2, which shows the profile
of a stock with critical information marked with red letters. The part marked
with (A) demonstrates the market indicators on a specific stock, involving the
current price, K-line and so on. Part (B) shows the authority users who focus
on this stock. Part (C) shows recent tweets talking about this stock. In addition
to the stock profile, there are also pages showing user profile. By clicking one
user in part (B), we can see the user’s information and the published tweets in
part (D). Field (E) shows the number of comments and retweets of a tweet.
3.2. Dataset
We obtain a complete dataset of all users and tweets from December 2010 to
May 2015, which consists of 18.39 million tweets from 2,780 stocks (total 2,780
stocks till July 2015) and 2.77 million users. Then we restrict our analysis to
the interval from November 2014 to May 2015 for two reasons. First, as some
features of the data (e.g., follower graph) keep evolving, we have to choose a
relatively short interval with the assumption that such features are stable within
this period. Second, the A-share market was very active in this period, resulting
in large fluctuations in the market indicators and a lot of discussion tweets on
Xueqiu. The dataset we analyze in tis paper involves 6.48 million tweets from
284 thousand active users, and is categorized as users and tweets.
• Users. For users’ information, we crawled user ID, the number of follow-
ers, the list of the followers, and the number of the published tweets.
• Tweets. For tweets, we record not only the content but also the associated
attributes, such as the tweet’s ID, publishing time, replying and retweeting
8time. We also record the retweeting behaviors, including the ID of the new
tweet and the ID of the user who retweets it.
3.3. Characteristics of the Data
We begin with the structural analysis of the dataset, and the characteristics
observed can help us better understand Xueqiu, and facilitate our prediction
task.
Distribution of Followers Counts.
We first look at the distribution of the follower counts. As shown in Figure 3,
the x-axis represents the number of followers of each user, and the y-axis shows
the Complementary Cumulative Distribution Function (CCDF). The blue line
shows the results of our dataset, while the red line shows a power law distribution
with the exponent of -0.624 and R2 = 0.982. It can be observed that the
distribution curve fits well with the power law distribution when x ≤ 104 . The
turning point appears at x = 104 , and then the blue curve drops quickly. The
reason is that only 0.44% of the total 284 thousand users have more than 104
followers, making it difficult to keep consistent with the other users all through
the curve.
Figure 3: Distribution of followers counts
9Followers vs. Retweeted Counts.
When a tweet is retweeted, its influence gets spreading. The retweet count
indicates its influence. Generally, a tweet posted by a celebrity can get retweeted
easily. We attempt to demonstrate the relations between the number of the
followers and the number of the retweets.
Figure 4: Followers counts vs. retweeted counts
The scatter diagram is shown in Figure 4, where the x-axis represents the
number of followers and the y-axis stands for its retweet number. It can be
observed that when the number of followers x exceeds 1.2 × 10⁴ , the number of
retweets is larger than 1 × 10³ , indicating that tweets published by a celebrity
whose follower number is large enough (larger than 104 ) can get retweeted much
more easily. Moreover, as the increasing of the followers, the number of retweets
grows linearly, especially when x > 104 .
3.4. Sentiments vs. A-Share Indicators
In order to investigate the correlations between sentiments of the tweets and
the stock prices, we first extract the sentiments from tweets, and use Naive Bayes
10Algorithm to infer the sentiments. Tweets are classified into three categories:
negative, positive and neutral. Negative and positive tweets are applied to
construct the sentiment index at some day i, which is defined as
p
PN i
pi
Si = 0.5 − p
i=1
PN i + PNni
i=1 pi i=1 ni
where N is the number of dates, and pi and ni are positive and negative
tweets numbers at day i, respectively.
Figure 5: Change rate of A-Share index vs. sentiment index
In Fig. 5, the solid (green) curve represents the sentiment index from Dec.
2014 to May. 2015, and the dashed (blue) curve stands for the change rate of
A-share Index, i.e., the Shanghai Stock Exchange Composite Index, in the same
time interval. If these two curves coevolve, it indicates the sentiments presented
by tweets on Xueqiu are correlated with A-share Index. It is reasonable that
the positive emotion usually goes with the rise of the stock price, and vice versa.
It can be observed that in a lot of time intervals, these two curves show similar
fluctuation trends, especially at the peak or bottoms of the A-share index curve.
For example, on Jan. 19th, 2015, the A-share index dropped by 7.7%, and the
sentiment index also dropped a lot, indicating the strong negative emotions of
the investors.
11Table 1: Top 5 co-occurrence statistics
China Merchants Bank LeTV ChinaNetCenter Kweichow Moutai
1 Industrial Bank EastMoney LeTV China Merchants Bank
2 SPD Bank Hithink RoyalFlush Ourpalm Luzhou Laojiao
3 Minsheng Bank CITIC Securitie Kweichow Moutai Ping An
4 Ping An Siasun Robot Sinnet Gree
5 CITIC Securities Huayi Brothers Siasun Robot SPD Bank
3.5. User Perceived Stock Relatedness
The common method to obtain the stock correlations is to use the standard
industry classification scheme or historical price series. However, in this paper,
we extract the user perceived relatedness through Xueqiu. The advantage is
that, in addition to the explicit and static relatedness, we can also obtain the
latent or instant correlations, e.g., the correlated stocks which are driven by the
same event but not affiliated with the same industry.
To obtain such correlations, we collect all the pairwise stocks mentioned
by the same tweet. For preprocessing, we removed tweets mentioning more
than five continuous stock tickers as such tweets usually do not convey much
meaning for our task. Table 1 shows the top five most frequent stocks jointly
mentioned with China Merchants Bank, LeTV, ChinaNetCenter and Kweichow
Moutai respectively. It can be observed that the top 5 stocks related to China
Merchants Bank are all financial companies, the top three are banks that have
similar sizes as China Merchants Bank, and the forth is Ping An, a compre-
hensive financial company involving the Ping An Bank. Citic Securities, the
largest securities company in China, takes the fifth place. For the stock LeTV,
the correlated stocks are diverse. LeTV is a company whose major products are
smart TVs and video services, while EastMoney is a website providing financial
news and data. Though they are not in the same industry, they are treated
as representative companies in China Growth Enterprise Board by investors,
and thus co-occurrence frequently. For ChinaNetCenter and Kweichow Moutai,
their most correlated stocks are also not restricted to the same industry. Thus,
12it can be summarized that the user perceived relatedness from Xueqiu can cap-
ture implicit correlations which are difficult to observe by previous methods.
Correlations may result in coevolving in stock prices, and our work is to in-
vestigate whether such correlations extracted from Xueqiu is effective for our
prediction task.
4. Prediction of Stock Price Movement
In this section, we model the prediction of stock price movement as a binary
classification problem. Then we discuss how to extract features from three
different types of information sources. After that, we evaluate the classification
model to verify the effectiveness of the information from Xueqiu.
4.1. Problem Formulation
The movement of stock price only happens during trading days, so we define
one single trading day as the time granularity of our prediction model. A trading
day is defined from the close time (i.e. 3:00pm) of the last day to the close time
of today. We would predict whether the close price of today is increased or
decreased compared to the close price of the last day. Given a target stock si , a
series of its continuous valid trading days constitute the trading day vector T~i =
(ti1 , ti2 , ti3 , ..., tin ), where n is the number of the trading days in T~i , determined by
the range of the dataset. Note that different stocks would have different trading
day vectors.
For some trading day tij , we define feature vector x~ij , consisting of features
extracted for stock si at trading day tij . The feature vector is also the input of
the prediction model. Formally, given the stock s and its feature vector x~i , the
i j
stock price movement prediction problem is modeled as:
1, if price of si increases on tij+1
yji = f (x~ij ) = (1)
0, otherwise
Where yji is the result of the prediction function f (x~ij ), denoting the price
movement direction of stock si at the next trading day tij+1 .
134.2. Feature Extraction
Motivated by the data analysis in Section 3, we explore rich knowledge
from Xueqiu and stock market to constitute the input feature vector x~i , and j
categorize the features into three types, the stock specific features, the sentiment
feature and the stock relatedness feature.
Stock Specific Features.
The common information used for stock prediction is the firm-specific fac-
tors, as well as the historical and time-series prices used for technical anal-
ysis [46] [47]. We select some key characteristics of a stock which show the
predictive ability to some degree in previous literature [10] [48]: stock price,
trading volume, turnover and price-to-earnings (P/E) ratio. Note that the abso-
lute value of stock price and trading volume would have huge difference between
different stocks, so we use the change rate instead. Besides, not only the daily
change but also the change of 5-days-moving-average is involved.
Sentiment Features.
In this study, we derive the sentiment index for each stock at each trading
day. Firstly, for all the tweets in the dataset, we classify them into three cate-
gories: positive, neutral and negative, and only the positive and negative tweets
are used to derive the sentiment feature. Counting the number of tweets in the
positive and negative categories is an intuitive way to measure how strong each
sentiment is. However, this counting method implies that each tweet is treated
equally and thus has the same weight. In fact, it’s clear that different tweets
might have different influences due to different authorities of the users. Thus,
it is reasonable to take the user’s authority as the weight for each tweet.
Given a user network extracted from Xueqiu, PageRank is a natural method
to weight each user. To derive the PageRank score, we first construct the user
network from the dataset. Note that different from the static friendship links in
the social network, the user network constructed here is a dynamic forwarding
network. Specifically, as the users publish tweets or forward others’ tweets on
14Figure 6: A sample of user network
Xueqiu, a user forwarding network can be constructed. Figure 6 shows a sample
of the user network on May 29th, 2015. In this network, each node stands for a
user marked with its user ID, and the edge stands for the forwarding behavior
between the two users. There are totally 141 trading days of the A-share market
in our dataset, so 141 user networks are constructed. For each network, we
calculate PageRank value of each vertex. As shown in Figure 6, the bigger a
node is, the larger the user’s PageRank is.
For a user vt in the directed user network, given a user set U with K users
(denoted as nodes u1 , u2 , ..., uK ) have forwarded ut ’s tweet, the PageRank value
of ut can be calculated as
K
X P R(ui )
P R(ut ) = (2)
i=1
L(ui )
where L(ui ) is the number of outbound links from ui . After that, the weight of
each tweet x is the weight of the user u(x) who has published it, and then the
weighted count is
15X
P ositiveCount = P R(u(x))
x
X (3)
N egativeCount = P R(u(y))
y
where x and y denote the positive tweet and negative tweet respectively.
For a given stock si and some trading day tij , we first calculate its positive
count and negative count, and then combine them into one sentiment score,
denoted as SIji , that is
P ositiveCountij
SCji = (4)
P ositiveCountij + N egativeCountij
Obviously, SCji ∈ [0, 1], and the larger SCji is, the more positive the overall
emotion is. SCji is used as the sentiment feature for our prediction model.
Stock Relatedness Features.
User-perceived relatedness among stocks is another knowledge that could be
obtained from Xueqiu [49]. The intuition is that stocks with strong correlations
may demonstrate comovements on prices. In our work, stocks are regarded
as correlated stocks if they are jointly mentioned by a tweet. Formally, we
define the stock network as an undirected graph G = {V, E}. The node set V
comprises of stocks, and eu,v ∈ E stands for the edge between stock nodes u
and v and the edge weight is the number of co-occurrences in the last 3 days.
As this correlation is time-sensitive [50], we construct 141 stock networks for
141 trading days.
Specifically, for a given stock si and the trading day j, let rji,k denote the
weight of the edge between stock si and sk at day j. To make the correlation
more specific and meaningful, we filter the non-informative edge with rji,k < 2
(except rji,i ). Note that rji,i = 1. For any two stocks (namely sm and sn ) which
are not connected in the stock network, rjm,n = 0.
Then given rji,k as the weight, we can combine it with a stock specific feature
fk of the stock sk to obtain the relatedness feature at day j, that is
16PN i,k
k=1 rj fk
corr(f )ij = PN i,k
(5)
k=1 rj
where N is the number of stocks in the dataset and fk is a stock specific feature
of the stock sk . Take turnover rate and stock price change rate as examples, we
can obtain
PN i,k
k=1 rj turnoverk
corr(turnover)ij = PN i,k
k=1 rj
PN i,k
(6)
k=1 rj price changek
corr(price change)ij = PN i,k
k=1 rj
4.3. Prediction Methods
Given the feature vector, we then apply statistical learning methods to obtain
the prediction results. Specifically, given a training set of n points with the form
(x~1 , y1 ), ..., (x~n , yn ), where yi is either +1 or -1. The Class +1 denotes that the
stock price will increase, while the Class -1 means the stock price will decrease.
x~i is a vector for a specific stock on a certain day containing the features applied
to train the model.
To obtain the prediction results, we consider both the Support Vector Ma-
chine (SVM) [51] and the Multilayer Perceptron (MLP) [52, 53] algorithms.
Most previous works use linear models to predict the stock market [54, 55, 56].
However, the relationship between the features and the stock price movements
may be more complex than linear. Thus, we use RBF-kernel instead of the
linear kernel in SVM, and the results also show that using RBF kernel is better
than using linear kernel. In addition, we also exploit the MLP model to learn
the hidden and complex relationships. MLP is a feedforward artificial neural
network model that maps sets of input data onto a set of appropriate outputs.
An MLP consists of multiple layers of nodes in a directed graph, with each layer
fully connected to the next one. The structure of the model in our work is
using one hidden layer and using sigmoid as the activation function. The stan-
17dard back-propagation algorithm is used for supervised training of the neural
network.
The process of feature extraction and prediction is shown in Algorithm 1.
5. Experiments
In this section, we conduct experiments to evaluate the effectiveness of using
knowledge from Xueqiu to predict stock price movements.
5.1. Experimental Setup
We select the Xueqiu data from Nov. 2014 to May 2015. The target stocks
are selected from all the stocks in the A-share market satisfying two require-
ments: (1) there are more than 10 trading days for that stock during this time;
(2) the number of tweets about that stock is more than 10 per day. The spam
contagions in Xueqiu may lead to large noises in our analysis and prediction task.
To detect the spams, we have determined ten features (including the percentage
of digits in the contagion, the number of followers of the user, etc.), and use
logistic regression to identify them. Then we extract Xueqiu related features
(sentiment features and the stock relatedness features) for each stock. The
stock-specific features are extracted from the historical information obtained
through TuShare 1 . The sentiment of each tweet from Xueqiu is classified by
SnowNLP 2 , an open-source Chinese text processing toolkit. Finally, we get
about 35.7K valid test samples from our dataset.
We use the SVM (with RBF-kernel) and MLP as the prediction models. The
samples in the last month would be used as the training set to predict the stock
price movements for each trading day in the following month. For example,
when the samples in Nov. 2014 are used as the training set, the trading days
in Dec. 2014 are the corresponding testing set. The prediction is evaluated
through two commonly used metrics: classification accuracy (ACC) and Area
1 http://tushare.org/
2 https://github.com/isnowfy/snownlp
18Algorithm 1 Process of Feature Extraction and Prediction
Input: Users U and tweets X from Xueqiu, firm-specific factors F of stock si
at trading day tij
Output: Stock movement yji at next trading day tij+1
function SpecificFeature(F ,sij )
Extracting firm-specific features: fji ← F for stock sij at tij ;
return fji
end function
function SentimentScore(X,U ,si )
Counting the number of tweets in the positive category (i.e., x) and neg-
ative category (i.e., y) respectively;
Constructing the user forwarding network;
P P R(ui )
PageRank value for user ut : P R(vt ) ← L(ui ) ;
P
Positive weighted count: P ositiveCount ← x P R(u(x))
P
Negative weighted count: negativeCount ← y P R(u(y))
P ositiveCountij
Sentiment Score: SCji ← P ositiveCountij +N egativeCountij
;
return SCji
end function
function RelatednessFeature(fji ,X,si )
Constructing the stock network: G = {V, E};
rji,k fk
PN
Correlation between stock si and sk : rji,k ← k=1
PN
rji,k
;
k=1
Relatedness feature: corr(fk )ij , fk is a specific feature of stock k;
return corr(f )ij
end function
function Prediction(fji , SCji , corr(f )ij )
Combining features into a vector: x~i ← {f i , SC i , corr(f )i };
j j j j
Predicting stock movement: yji ← SV M (x~ij ) (or yji ← M LP (x~ij ));
return yji
end function
19Under ROC Curve (AUC). ACC is very sensitive to the data skew. When a
class has an overwhelmingly high frequency, the accuracy can be high using a
classifier that makes the prediction on the majority class. Thus, we also use
AUC to avoid the bias due to data skew. Though our data is not severely
skewed, we also use AUC for comparison. After conducting predictions on all
these testing sets, we aggregate all results of AUC and ACC into an overall
output.
5.2. Prediction Results
0.61 0.59
SSF+SVM
SSF+Xueqiu+SVM 0.58
0.60 SSF+MLP
SSF+Xueqiu+MLP 0.57
0.56
0.59
0.55
AUC
ACC
0.54
0.58
0.53
0.57 0.52
0.51
0.56 0.50
ACC AUC
Figure 7: Prediction results using SVM and MLP with only stock specific features (SSF) v.s.
with both SSF and Xueqiu features
According to previous studies [10] [48], the stock specific features are vital
for stock prediction, so using prediction methods (i.e. SVM and MLP) with
only stock specific features is adopted as our baselines. To verify whether the
knowledge extracted from Xueqiu is effective for stock prediction, the predic-
tion methods with stock specific features as well as the Xueqiu features (i.e.,
sentiment features and stock relatedness features) are evaluated against the
baselines. The results are shown in Figure 7. It can be observed that given the
same prediction model (SVM or MLP), the method involving Xueqiu features
200.595 0.560
SSF
0.590 SSF+Relatedness
SSF+Sentiment 0.555
SSF+Relatedness+Sentiment
0.585
0.550
0.580
AUC
ACC
0.545
0.575
0.540
0.570
0.565 0.535
0.560 0.530
ACC AUC
Figure 8: Prediction results trained on different combinations of features with SVM
achieves consistently better performance than only involving the stock specific
features over both ACC and AUC metrics. This confirms that the investors’
perceptions extracted from Xueqiu can assist in stock prediction. This also
demonstrates that the Chinese social media can have reflected the investors’
opinions and behaviors in China’s stock market. In addition, the MLP model
achieves better performance than the SVM model, partly by effective learning
hidden relationships between the features and the price movements. Based on
the above analysis, we can observe that both features and algorithms can have
impacts on performance. The prediction errors may come from not capturing
sufficient and effective features or from not using suitable algorithms. In ad-
dition, how we choose the training samples and testing samples may also be a
source of errors.
5.3. Feature Importance Analysis
Feature important analysis studies how important the various features are
in the prediction task. From a macroscopic view, we first study the importance
of the features derived from different types of knowledge. Figure 8 shows the
prediction results with different groups of features. Not surprisingly, the stock
21Table 2: Top-10 features
Features
Stock Price Change Rate
Stock MA5 Value
Stock Turnover Change Rate
Stock Trading Volume Change Rate
Sentiment Score
Stock 5-Day Moving Average of Trading Volume
Sentiment Tweets Count (Positive)
Correlation Stocks Weighted Average (MA5)
Sentiment Tweets Count (Negative)
Sentiment Tweets Count (Neutral)
specific features are very useful for stock prediction. Using stock specific features
alone can achieve 0.57 in ACC and 0.54 in AUC. Both the sentiment features
and the stock relatedness features are helpful, and the sentiment features play
more important roles than the stock relatedness features. When we put all
features together, the prediction result in terms of ACC remain the same as
that with both sentiment and stock specific feature, but the results in terms of
AUC can be further improved. The reason is that the imbalance in the dataset
is not considered in ACC. The improvement in AUC indicates that the addition
of stock relatedness feature can improve the discriminative power of our model.
We then study the importance of features from a microcosmic point of view.
To evaluate how the features contribute to the prediction results, we use the
random forests model to obtain the rank of the importance of the features [57],
which is shown in Table 2. It is clear that stock specific features are the most
influential feature type in the model, as the top 4 features all belong to it.
While additional features are taken into consideration, sentiment features are
more important than the stock relatedness features, which is coherent with the
feature analysis presented above in Fig. 8. Among sentiment features, Sentiment
22Score is the most critical one containing not only the contents of the tweets but
also the structure of the user network. Correlation Stocks Weighted Average
(MA5) is in the top 10 features, indicating it is also useful for our task.
5.4. Summary
We summarize the experimental results by the following observations:
(1) Knowledge extracted from Xueqiu is useful for stock prediction in China’s
stock market. The results show that by exploiting the knowledge from Xueqiu,
the prediction results can be consistently improved in terms of both ACC and
AUC. Previous studies show the effectiveness of sentiments for stock prediction
in the U.S. stock market. Our research confirms that the sentiments extracted
from Xueqiu are also effective for China’s stock market. In addition, we also
observe the effectiveness of user perceived stock relatedness in stock prediction.
(2) The most important features are stock specific features. Both the predic-
tion results with only stock specific features and the feature importance analysis
show that the stock specific features are the most important ones for our task.
(3)The sentiment feature is more important than the stock relatedness fea-
tures. One possible reason is that the user perceived stock relatedness is more
sparse than the sentiments. Only a few stocks are mentioned jointly with other
stocks in the tweets, especially considering our stock network is time-sensitive,
i.e., only the co-occurrences in the last 3 days are taken into consideration. De-
spite the sparseness, the prediction results are pretty good for almost the full
set of stocks in the A-share market .
6. Conclusions and Future Work
In this study, we have studied a unique social network, namely Xueqiu, where
retail investors’ tweets can be employed to extract features such as sentiment
and perceived stock relatedness. Further, we adopt SVM model and MLP model
to predict the stock price movements in the China’s market. The results show
that the predictive performance can be improved by including the features of
23sentiment and perceived stock relatedness. The study contributes to both social
network analysis and the behavioral economics literature, by providing a deeper
understanding of the investors’ perceptions through the social network.
Potential avenues of future work include a deeper study on the different
measures of the construct of our interest. It would also be interesting to conduct
a more comprehensive analysis on the time-series features together with the
temporal models such as Long Short-Term Memory (LSTM) network [58] .
7. Acknowledgement
This work was supported in part by State Key Development Program of
Basic Research of China (No. 2013CB329604), the National Key Research and
Development Program of China (No. 2016QY03D0605), the Natural Science
Foundation of China (No. 61300014, 61372191, 61472263), the Project on
the Integration of Industry, Education and Research of Guangdong Province
(No. 2016B090921001), and DongGuan Innovative Research Team Program
(No. 201636000100038).
References
References
[1] H. Kwak, C. Lee, H. Park, S. Moon, What is twitter, a social network or a
news media?, in: Proceedings of the 19th international conference on World
wide web, ACM, 2010, pp. 591–600.
[2] Y. Su, X. Zhang, S. Y. Philip, W. Hua, X. Zhou, B. Fang, Understanding
information diffusion under interactions., in: IJCAI, 2016, pp. 3875–3881.
[3] A. Anderson, D. Huttenlocher, J. Kleinberg, J. Leskovec, M. Tiwari, Global
diffusion via cascading invitations: Structure, growth, and homophily, in:
Proceedings of the 24th International Conference on World Wide Web, Inter-
national World Wide Web Conferences Steering Committee, 2015, pp. 66–76.
24[4] B. Viswanath, A. Mislove, M. Cha, K. P. Gummadi, On the evolution of
user interaction in facebook, in: Proceedings of the 2nd ACM workshop on
Online social networks, ACM, 2009, pp. 37–42.
[5] E. F. Fama, The behavior of stock-market prices, The Journal of Business
38 (1) (1965) 34–105.
[6] R. R. Prechter, The wave principle of human social behavior and the new
science of socionomics, Vol. 1, New Classics Library, 1999.
[7] J. R. Nofsinger, Social mood and financial economics, The Journal of Be-
havioral Finance 6 (3) (2005) 144–160.
[8] B. F. King, Market and industry factors in stock price behavior, The Journal
of Business 39 (1) (1966) 139–190.
[9] R. S. Pindyck, J. J. Rotemberg, The comovement of stock prices, The Quar-
terly Journal of Economics (1993) 1073–1104.
[10] Q. Li, T. Wang, P. Li, L. Liu, Q. Gong, Y. Chen, The effect of news and
public mood on stock movements, Information Sciences 278 (2014) 826–840.
[11] J. Bollen, H. Mao, X. Zeng, Twitter mood predicts the stock market, Jour-
nal of Computational Science 2 (1) (2011) 1–8.
[12] Y. Karabulut, Can facebook predict stock market activity?, in: AFA 2013
San Diego Meetings Paper, 2013.
[13] A. Al Nasseri, A. Tucker, S. de Cesare, Big data analysis of stocktwits to
predict sentiments in the stock market, in: Discovery Science, Springer, 2015,
pp. 13–24.
[14] A. F. Darrat, M. Zhong, On testing the random walk hypothesis: A model
comparison approach, Financial Review 35 (3) (2000) 105–124.
[15] B. M. Barber, T. Odean, All that glitters: The effect of attention and news
on the buying behavior of individual and institutional investors, Review of
Financial Studies 21 (2) (2008) 785–818.
25[16] J. C. Patra, N. C. Thanh, P. K. Meher, Computationally efficient flann-
based intelligent stock price prediction system, in: Neural Networks, 2009.
IJCNN 2009. International Joint Conference on, IEEE, 2009, pp. 2431–2438.
[17] H. Jia, Investigation into the effectiveness of long short term memory net-
works for stock price prediction, arXiv preprint arXiv:1603.07893.
[18] W.-c. Chiang, D. Enke, T. Wu, R. Wang, An adaptive stock index trading
decision support system, Expert Systems With Applications 59 (2016) 195–
207.
[19] E. Chong, C. Han, F. C. Park, Deep learning networks for stock market
analysis and prediction : Methodology , data representations , and case stud-
ies, Expert Systems With Applications 83 (2017) 187–205.
[20] Y. Lin, H. Guo, J. Hu, An svm-based approach for stock market trend
prediction, in: The 2013 International Joint Conference on Neural Networks
(IJCNN), 2013, pp. 1–7.
[21] V. Turchenko, P. Beraldi, F. D. Simone, L. Grandinetti, Short-term stock
price prediction using mlp in moving simulation mode, in: Proceedings of
the 6th IEEE International Conference on Intelligent Data Acquisition and
Advanced Computing Systems, Vol. 2, 2011, pp. 666–671.
[22] R. Mahanta, T. N. Pandey, A. K. Jagadev, S. Dehuri, Optimized radial
basis functional neural network for stock index prediction, in: 2016 Inter-
national Conference on Electrical, Electronics, and Optimization Techniques
(ICEEOT), 2016, pp. 1252–1257.
[23] D. M. Cutler, J. M. Poterba, L. H. Summers, What moves stock prices?,
The Journal of Portfolio Management 15 (3) (1989) 4–12.
[24] W. Y. Wang, Z. Hua, A semiparametric gaussian copula regression model
for predicting financial risks from earnings calls, in: ACL (1), 2014, pp. 1155–
1165.
26[25] B. Xie, R. J. Passonneau, L. Wu, G. G. Creamer, Semantic frames to
predict stock price movement, in: Proceedings of the 51st annual meeting of
the association for computational linguistics, 2013, pp. 873–883.
[26] C. Dougal, J. Engelberg, D. Garcia, C. A. Parsons, Journalists and the
stock market, Review of Financial Studies 25 (3) (2012) 639–679.
[27] K. R. Ahern, D. Sosyura, Rumor has it: Sensationalism in financial media,
Review of Financial Studies 28 (7) (2014) 2050–2093.
[28] X. Ding, Y. Zhang, T. Liu, J. Duan, Using structured events to predict
stock price movement: An empirical investigation, in: EMNLP, 2014, pp.
1415–1425.
[29] X. Ding, Y. Zhang, T. Liu, J. Duan, Deep learning for event-driven stock
prediction, in: Proceedings of the Twenty-Fourth International Joint Confer-
ence on Artificial Intelligence (ICJAI), 2015, pp. 2327–2333.
[30] Q. Li, T. Wang, Q. Gong, Y. Chen, Z. Lin, S.-k. Song, Media-aware quan-
titative trading based on public web information, Decision support systems
61 (2014) 93–105.
[31] J. Si, A. Mukherjee, B. Liu, S. J. Pan, Q. Li, H. Li, Exploiting social
relations and sentiment for stock prediction, in: EMNLP, Vol. 14, 2014, pp.
1139–1145.
[32] X. Zhang, H. Fuehres, P. A. Gloor, Predicting stock market indicators
through twitter ?I hope it is not as bad as I fear, Proc.-Soc. Behav. Sci. 26
(2011) 55–62.
[33] J. Si, A. Mukherjee, B. Liu, Q. Li, H. Li, X. Deng, Exploiting topic based
twitter sentiment for stock prediction, in: The 51st Annual Meeting of the
Association for Computational Linguistics (ACL-13), 2013, pp. 24–29.
[34] J. Si, A. Mukherjee, B. Liu, S. J. Pan, Q. Li, H. Li, Exploiting social
relations and sentiment for stock prediction, in: The Conference on Empirical
27Methods on Natural Language Processing (EMNLP-14), Vol. 14, 2014, pp.
1139–1145.
[35] Y. Huang, K. Huang, Y. Wang, H. Zhang, J. Guan, S. Zhou, Exploiting
twitter moods to boost financial trend prediction based on deep network mod-
els, in: International Conference on Intelligent Computing, Springer, 2016,
pp. 449–460.
[36] Q. Li, L. Jiang, P. Li, H. Chen, Tensor-based learning for predicting stock
movements., in: AAAI, 2015, pp. 1784–1790.
[37] W.-J. Ma, C.-K. Hu, R. E. Amritkar, Stochastic dynamical model for stock-
stock correlations, Phys. Rev. E 70 (2004) 026101.
[38] P. Chen, Modelling the stochastic correlation, Master’s thesis, KTH, Math-
ematical Statistics (2016).
[39] S. Sepp, Modeling of stock return correlation, Ph.D. thesis, Master thesis,
Universiteit van Amsterdam (2011).
[40] T. Preis, D. Y. Kenett, H. E. Stanley, D. Helbing, E. Ben-Jacob, Quantify-
ing the behavior of stock correlations under market stress, Scientific reports
2 (2012) 752.
[41] G. Hoberg, G. Phillips, Product market synergies and competition in merg-
ers and acquisitions: A text-based analysis, Review of Financial Studies
23 (10) (2010) 3773–3811.
[42] G. Hoberg, G. M. Phillips, Text-based network industries and endogenous
product differentiation, Tech. rep., National Bureau of Economic Research
(2010).
[43] S. R. Das, J. Sisk, Financial communities, Journal of Portfolio Management
31 (4) (2005) 112–123.
28[44] T. O. Sprenger, I. M. Welpe, Tweets and peers: defining industry groups
and strategic peers based on investor perceptions of stocks on twitter, Algo-
rithmic Finance 1 (1) (2011) 57–76.
[45] C. M. Lee, P. Ma, C. C. Wang, Search-based peer firms: Aggregating
investor perceptions through internet co-searches, Journal of Financial Eco-
nomics 116 (2) (2015) 410–431.
[46] S. J. Taylor, X. Xu, The incremental volatility information in one million
foreign exchange quotations, Journal of Empirical Finance 4 (4) (1997) 317–
340.
[47] S. J. Taylor, Modelling financial time series, Stephen J. Taylor, Modelling
Financial Time Series (Second Edition), World Scientific Publishing, 2007.
[48] E. F. Fama, K. R. French, The cross-section of expected stock returns, the
Journal of Finance 47 (2) (1992) 427–465.
[49] Y. Arai, T. Yoshikawa, H. Iyetomi, Dynamic stock correlation network,
Procedia Computer Science 60 (2015) 1826–1835.
[50] J. D. Wichard, C. Merkwirth, M. Ogorzalek, Detecting correlation in stock
market, Physica A: Statistical Mechanics and its Applications 344 (1) (2004)
308–311.
[51] B. E. Boser, I. M. Guyon, V. N. Vapnik, A training algorithm for optimal
margin classifiers, in: Proceedings of the fifth annual workshop on Computa-
tional learning theory, ACM, 1992, pp. 144–152.
[52] G. E. Hinton, Learning translation invariant recognition in a massively
parallel networks, in: International Conference on Parallel Architectures and
Languages Europe, Springer, 1987, pp. 1–13.
[53] D. E. Rumelhart, J. L. McClelland, P. R. Group, et al., Parallel distributed
processing, Vol. 1, IEEE, 1988.
29[54] B. Xie, R. J. Passonneau, L. Wu, G. G. Creamer, Semantic frames to
predict stock price movement, in: Proceedings of the 51st annual meeting of
the association for computational linguistics, 2013, pp. 873–883.
[55] R. Luss, A. D?Aspremont, Predicting abnormal returns from news using
text classification, Quantitative Finance 15 (6) (2015) 999–1012.
[56] S. Kogan, D. Levin, B. R. Routledge, J. S. Sagi, N. A. Smith, Predict-
ing risk from financial reports with regression, in: Proceedings of Human
Language Technologies: The 2009 Annual Conference of the North American
Chapter of the Association for Computational Linguistics, Association for
Computational Linguistics, 2009, pp. 272–280.
[57] R. Genuer, J.-M. Poggi, C. Tuleau-Malot, Variable selection using random
forests, Pattern Recognition Letters 31 (14) (2010) 2225–2236.
[58] S. Hochreiter, J. Schmidhuber, Long short-term memory, Neural computa-
tion 9 (8) (1997) 1735–1780.
30You can also read