Application of Data Mining in an Intelligent Early Warning System for Rock Bursts - MDPI
←
→
Page content transcription
If your browser does not render page correctly, please read the page content below
processes
Article
Application of Data Mining in an Intelligent Early
Warning System for Rock Bursts
Xuejun Zhu 1,2 , Xiaona Jin 1 , Dongdong Jia 1 , Naiwei Sun 1 and Pu Wang 1,2,3, *
 1    State Key Laboratory of Mine Disaster Prevention and Control, Shandong University of Science and
      Technology, Qingdao 266590, China; zhuxj207@163.com (X.Z.); m17854252966@163.com (X.J.);
      jdd_winter@163.com (D.J.); snw2369098092@163.com (N.S.)
 2    National Engineering Laboratory for Coalmine Backfilling Mining, Shandong University of Science and
      Technology, Tai’an 271019, China
 3    Department of Resources and Civil Engineering, Shandong University of Science and Technology,
      Tai’an 271019, China
 *    Correspondence: 15854848872@163.com; Tel.: +86-158-5484-8872

 Received: 8 December 2018; Accepted: 17 January 2019; Published: 22 January 2019

 Abstract: In view of rock burst accidents frequently occurring, a basic framework for an intelligent
 early warning system for rock bursts (IEWSRB) is constructed based on several big data technologies
 in the computer industry, including data mining, databases and data warehouses. Then, a data
 warehouse is modeled with regard to monitoring the data of rock bursts, and the effective application
 of data mining technology in this system is discussed in detail. Furthermore, we focus on the K-means
 clustering algorithm, and a data visualization interface based on the Browser/Server (B/S) mode is
 developed, which is mainly based on the Java language, supplemented by Cascading Style Sheets
 (CSS), JavaScript and HyperText Markup Language (HTML), with Tomcat, as the server and Mysql
 as the JavaWeb project of the rock burst monitoring data warehouse. The application of data mining
 technology in IEWSRB can improve the existing rock burst monitoring system and enhance the
 prediction. It can also realize real-time queries and the analysis of monitoring data through browsers,
 which is very convenient. Hence, it can make important contributions to the safe and efficient
 production of coal mines and the sustainable development of the coal economy.

 Keywords: rock burst; data mining; clustering analysis; intelligent early warning; data warehouse

1. Introduction
     During the process of coal mining in underground coalmines, many severe dynamic disasters can
easily occur. Among them, the rock burst is the most common and typical disaster, which refers to
the instantaneous release of elastic strain energy with the mass ejection of coal rocks and gas waves,
thereby resulting in sudden and violent damage to the roadway or working face. Hence, a rock burst
has great destructiveness and seriously threatens the safe production of coalmines. For example, a rock
burst accident occurred in the Luling coalmine of Huaibei city on 13 May 2003 and caused 86 casualties;
in 2005, a gas burst accident caused by a rock burst occurred in Haizhou coalmine of Liaoning province,
causing 214 deaths [1–4]. Additionally, there are 23 other countries and regions othere than China
where rock bursts have occurred over the last 280 years, such as Britain, Poland, France, Germany,
Russia, Ukraine, South Africa, United States, Japan, Australia and so on.
     A rock burst is a transient and complex dynamic process, and its early warning analysis and
calculation are four-dimensional mechanical problems with the characteristics of multi-scale time and
space effects. Hence, the experience-identification and previous early warning index systems applied
to rock burst-prone coalmines have been unable to meet the requirements to date. With respect to

Processes 2019, 7, 55; doi:10.3390/pr7020055                                 www.mdpi.com/journal/processes
Processes 2019, 7, x FOR PEER REVIEW 2 of 19
Processes 2019, 7, 55 2 of 19
applied to rock burst-prone coalmines have been unable to meet the requirements to date. With
respect to the large numbers of productive practices, the study of rock burst accidents has many
difficult
the issues toofresolve,
large numbers and practices,
productive the imperfect and of
the study inadequate
rock burstearly warning
accidents systemdifficult
has many is the issues
most
prominent problem. Hence, according to the different mining conditions, the
to resolve, and the imperfect and inadequate early warning system is the most prominent problem. study of the main
effect factors
Hence, and to
according risk
thesources of rock
different burst
mining precursorythe
conditions, patterns,
study of thethedevelopment
main effectof an intelligent
factors and risk
sources of rock burst precursory patterns, the development of an intelligent early warningrock
early warning method of rock bursts, and an intelligent recognition algorithm of burstof
method
precursors with multi-parameter characteristics based on big data and data mining
rock bursts, and an intelligent recognition algorithm of rock burst precursors with multi-parameter technologies are
very important
characteristics for the
based on study object
big data andof thismining
data paper. technologies are very important for the study object
As we all know, in Poland, the study with regard to rock bursts is very advanced, and its
of this paper.
monitoring system has been installed in all rock burst-prone coalmines, mainly using the methods of
As we all know, in Poland, the study with regard to rock bursts is very advanced, and its
microseismic events, drilling chip and comprehensive prediction. Currently, the ARAMIS M/E
monitoring system has been installed in all rock burst-prone coalmines, mainly using the methods
microseismic monitoring system and the ARES-5/E earth-sound monitoring system developed in
of microseismic events, drilling chip and comprehensive prediction. Currently, the ARAMIS M/E
Poland are widely used around the world. In China, according to the characteristics of the strong
microseismic monitoring system and the ARES-5/E earth-sound monitoring system developed in
destructivity, complexity and suddenness of rock bursts in Chinese coalmines, the monitoring
Poland are widely used around the world. In China, according to the characteristics of the strong
methods of microseismic events, electromagnetic radiation, drilling chips and ground sound are
destructivity, complexity and suddenness of rock bursts in Chinese coalmines, the monitoring methods
carried out [5–9].
of microseismic events, electromagnetic radiation, drilling chips and ground sound are carried out [5–9].
From the point of view of the theoretical study of rock bursts, different geological conditions of
From the point of view of the theoretical study of rock bursts, different geological conditions of
coalmines have different induced factors on rock bursts. Hence, according to collected monitoring
coalmines have different induced factors on rock bursts. Hence, according to collected monitoring data
data of rock bursts (i.e., precursor information) only, the prediction of a rock burst and its grade can
of rock bursts (i.e., precursor information) only, the prediction of a rock burst and its grade can make
make full use of the method of pattern recognition. Among them, artificial neural networks and
full use of the method of pattern recognition. Among them, artificial neural networks and support
support vector machines which mainly focus on improving the prediction accuracy are the two most
vector machines
commonly usedwhich
studymainly
methodsfocus
in on
thisimproving the prediction
field. However, these two accuracy
methodsare the
stilltwo
havemost commonly
errors which
used study methods in this field. However, these two methods still have errors
may cause serious disasters or accidents, because the prediction result of a large burst-liability which may cause
of
serious disasters or accidents, because the prediction result of
rock bursts may be adjusted as a small burst-liability of rock bursts. a large burst-liability of rock bursts may
be adjusted as a small burst-liability of rock bursts.
2. Architectural Design of the System
2. Architectural Design of the System
In this paper, a framework for an intelligent early warning system for rock bursts (IEWSRB) is
In this paper, a framework for an intelligent early warning system for rock bursts (IEWSRB) is
constructed, firstly according to the principles of intellectualization, multifunction, modularization
constructed, firstly according to the principles of intellectualization, multifunction, modularization
and standardization; subsequently an IEWSRB that aims to achieve real-time monitoring, data
and standardization;
sharing and integration subsequently anThis
is designed. IEWSRB
systemthat aims
can to achieve
collect, real-time
transmit, monitoring,
pretreat, data
analyze and sharing
store the
and
rockintegration is designed.
burst monitoring dataThis system can collect,
of underground transmit,
coalmines pretreat,
in real time,analyze and store
continuously andthe rock burst
accurately.
monitoring
Moreover, datait canofhandle
underground coalmines
the database in realmonitoring
to provide time, continuously
data andand accurately.
early Moreover, it for
warning information can
handle the database to provide monitoring data and
the supervisor in the office in a timely and accurate manner. early warning information for the supervisor in
the office in a timely
According and
to the accurate manner.
aforementioned analysis, the overall structure of IEWSRB is constructed and
According to the aforementioned
shown in Figure 1. Based on the design analysis, the overall
target and structure
the principle of IEWSRB
of the is constructed
distribution and
design of each
shown
model,initFigure 1. Based
is divided intoon thesubsystems:
four design targetmonitoring,
and the principle of the distribution
data management, modeldesign of each
analysis andmodel,
data
itproduct.
is divided into four subsystems: monitoring, data management, model analysis and data product.
Information sevice User
Drilling cuttings Data Data Data
Basic Electromagnetic collection Data processing Making of information sharing Government department
monitoring radiation warehouse
methods Ground sound for rock burst Information Build of prediction model Information Decision-making department
development service Public service
Microseismic Scientific research institution
Build of data warehouse
Instruments and equipment
Sensor
Limited communication
network
Wireless communication
network
Figure1.1.Overview
Figure Overview structure
structure of
of the
the intelligent
intelligent early warning system
system for
for rock
rock bursts
bursts (IEWSRB).
(IEWSRB).
Processes 2019, 7, 55                                                                                3 of 19

       The intelligent early warning system, which is based on the principle of “equivalent drilling chip”
and “rock burst risk determined by multi-factors”, not only shows backwards system compatibility
(i.e., rock burst monitoring can fully rely on existing devices), but can also enhance its performance.
Hence, IEWSRB has several distinctive features as follows:
       (1) Automatic comprehensive monitoring: this system can realize multilevel and omni-directional
monitoring, and facilitate the collection, management and analysis of data. However, the data for
the monitoring of rock bursts in the past has had to be collected by artificial means or by using a
single-parameter monitoring method;
       (2) The functional modules are independent: the system adopts a distributed, open and modular
design. It can assemble the monitoring module of different modules flexibly to make up the final
monitoring system and does not need the two-fold development of software;
       (3) Intelligent early warning: the system can realize the early warning and prediction of rock
burst by using the real-time monitoring data monitored by the industrial Ethernet based on the early
warning model for rock bursts, which is deduced by a data mining algorithm;
       (4) Separation of operation between monitoring and field: the operations of centralized monitoring,
analysis, decision-making and management can be carried out in the surface office, thereby realizing
separation between monitoring and field. The management will be more scientific;
       (5) Data sharing: monitoring data can be shared in various mining areas, greatly improving the
utilization of data;
       (6) The human–computer interaction interface is friendlier: data can be transmitted to users
by a visual interface and provides various personalized needs, thereby effectively improving the
user’s efficiency.

3. Design of System Data Warehouse
     The IEWSRB is an integrated system based on monitoring data of rock bursts in coalmines. Among
them, the monitoring data have many characteristics, such as multiple data types, diverse sources and
a large amount of data. Previous database technologies, such as Oracle and Redis, have had difficulty
meeting the needs of data storage and management in coalmines. Data warehouse technology in big
data technology provides a new way to solve the problems that exist in the online monitoring of rock
bursts in coalmines.
     As a new method of database application, the data warehouse is actually a derivative of
database technology, and has been widely used in supermarkets, banks and other fields. However,
the application of data warehouse technology in the field of rock bursts is still in the exploratory stage.

3.1. Calculation of Critical Energy Density
      The kinetic energy of the broken coal-rock mass thrown into the free space depends largely on its
average initial velocity. According to the literature written by Qi and Dou [10], when the initial velocity
is less than 1 m/s, a rock burst is impossible, while when the initial velocity is larger than 10 m/s, a
rock burst is easily induced. When the rock burst occurs, the required energy must exceed the break
energy of the coal-rock mass and the minimum kinetic energy accumulated in the coal-rock mass.
Once the elastic strain energy accumulated in the coal rock exceeds the sum of the aforementioned
energy, a rock burst is likely to occur [11–13].

                                                         1 2
                                              E pmin =     ρV                                           (1)
                                                         2
where Epmin is the minimum kinetic energy required to induce the rock burst; V is the average
initial velocity of the broken coal-rock mass, V = 10 m/s; and ρ is the average density of the broken
coal-rock mass.
                                                       σ2 c
                                             E f min =                                             (2)
                                                       2E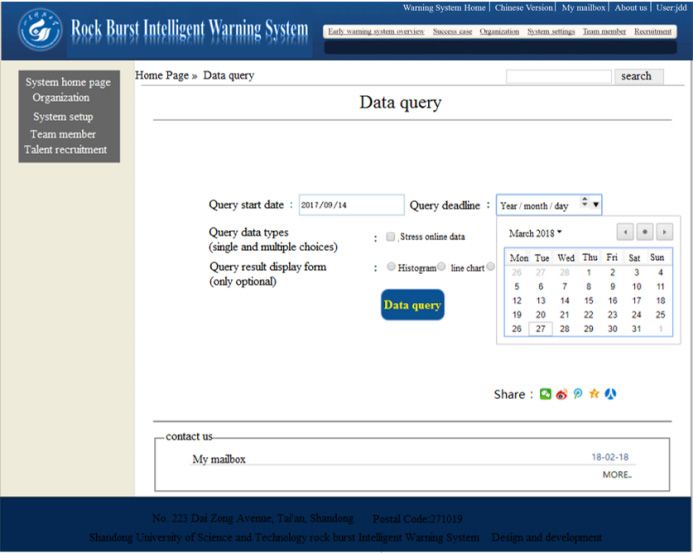
Processes 2019, 7, 55                                                                                                                               4 of 19

where Efmin is the minimum energy required to destroy the coal-rock mass, σc is the tensile strength of
the unit coal and rock mass, and E is the constant of the broken coal and rock mass.

                                                       Emin = E pmin + E f min                                                                            (3)

where Emin is the critical energy value of the rock burst.
     In this paper, in order to better explain the aforementioned phenomenon, we take a special
coalmine condition as an example. The average density of the no. 5 coal in this coalmine, the mechanical
properties of which are displayed in Table 1, is 1340 kg/m3 and the minimum kinetic energy required
to generate an impact rock burst per unit of rock mass is 67 kJ/m3 . The elastic modulus of the no.
5 coal is 6.58 GPa, with a unidirectional compressive strength of 17.90 MPa. The minimum energy
required to destroy the unit coal and rock mass is 24.347 kJ/m3 , and the critical energy density of the
rock burst at the stope is 91.347 kJ/m3 . When the stope energy density is greater than 91.347 kJ/m3 ,
there is a possibility of a rock burst.

                                       Table 1. Mechanical properties of coal and rocks.

                           Tensile         Pressure      Modulus of                            Poisson                                Internal Friction
     Lithology                                                                                                         Cohesion/MPa
                        Strength/MPa     Resistance/MPa Elasticity/GPa                          Ratio                                     Angle/◦
    No. 5 Coal             1.411              11.543                     6.58                      0.22                    2.42              19
      Roof                 2.243              22.786                    16.55                      0.18                    5.24              25
      Floor                2.632              27.342                    23.22                      0.27                    6.44              23

3.2. Architecture and Logical Model of Data Warehouse
      The technical architecture of the rock burst data warehouse is divided into two parts: the foreground
and the background, as shown in Figure 2. The foreground is commonly known as the front-end display,
which is displayed to the user community in an intuitive and understandable way. The final display
form includes graphs, line graphs, pie charts and other graphic forms. The background is necessary
for carrying out the cleaning and pre-processing of the monitoring data, and then saving it to the
corresponding table of the data warehouse according to the monitoring mode, so that the data can be
expediently
Processes       retrieved
          2019, 7,         and
                   x FOR PEER  displayed in the foreground.
                              REVIEW                                                                  5 of 19

                                                                               Visual analysis results

                                                                                                               OLAP

                                                              The front-end                               Data mining
                                   the foreground                 tool                                   Report builder
                                                                                                               Other

                                                                               The rock burst data
                                                                              warehouse subject data

                                                       The rock burst             The rock burst                The rock burst
                                                         data mart                  data mart                     data mart

                                   the background

                                                                        Data extraction, conversion, loading

                                                                                The rock burst data
                                                                                      source

                                    Figure 2. Architecture
                                              Architecture of rock burst data warehouse.

     The data warehouse is an extension of the relational database technology, and most of the
current data warehouse is based on relational databases. The design of the data warehouse is based
on the relationship between various data tables, and each data warehouse contains one or more
tables, each of which has a primary key ID and monitors data about rock bursts. Using
Processes 2019, 7, 55                                                                                   5 of 19

      The data warehouse is an extension of the relational database technology, and most of the current
data warehouse is based on relational databases. The design of the data warehouse is based on the
relationship between various data tables, and each data warehouse contains one or more tables, each of
which has a primary key ID and monitors data about rock bursts. Using multi-dimensional modeling,
the fact that tables can be cut by dimension prevents problems caused by a table having too much data.
Moreover, a table corresponds to multiple dimension tables, and a summary of multiple dimension
tables can be viewed as a collection of information in the same space.
      From the point view of rock bursts, the data warehouse can be divided into drill cuttings,
microseismic, stress online, and so on. In this section, based on the requirement of rock burst
monitoring and the intelligent early warning system, two databases—HAB_TP and HAB_AP—in the
data warehouse are established.
      In the case of HAB_TP, a fact table (MonitorItem) and a dimension table (Station) are designed.
      (a) The MonitorItem fact table is used to store the automatically monitored data (including drill
cutting, microseismic, and stress online), as shown in Table 2. In the monitoring mode, Z represents
drill cuttings data, W represents microseismic data, and Y represents stress online data;
      (b) The Station dimension table is used to store the geographical location of the monitoring mining
area, such as the mine name, latitude and longitude, city and mining company to which the mining
area belongs as shown in Table 3. The star model of the HAB_TP data warehouse is shown in Figure 3.

                                     Table 2. MonitorItem fact table properties.

                Column Name          Data Type       Size (Accuracy)               Annotation
                MonitorItemID            Int                 4              Time keyword, primary key
                  StationID              Int                 4                  The name of mine
                CollectionTIme        datetime               4                   Acquisition time
                CollectionType          char                 1               Monitoring way (Z, W, Y)
                CollectionValue       decimal             5 (7,2)            Monitoring measurement

Processes 2019, 7, x FOR PEER REVIEWTable 3. Station dimension table properties.                        6 of 19

                      Column Name
                     StationID            Data
                                           IntType        Size (Accuracy)
                                                                 4                 Annotation
                                                                                    Major key
                         StationID
                   StationName                Int
                                          varchar                4
                                                                 20               Major
                                                                                The name keyof mine
                       StationName
                     Latitude              varchar
                                          Decimal                20
                                                               5(5,2)          The name  of mine
                                                                                     Latitude
                         Latitude          Decimal             5(5,2)              Latitude
                    Longitude
                        Longitude
                                          Decimal
                                           Decimal
                                                               5(5,2)
                                                               5(5,2)
                                                                                   Longitude’
                                                                                  Longitude’
                        CityCity          varchar
                                           varchar               20
                                                                 20                Mining
                                                                                 Mining     area
                                                                                         area
                      Group
                          Group           varchar
                                           varchar               20
                                                                 20               Mining
                                                                                 Mining    group
                                                                                        group

                                        Figure 3. HAB_TP star data model.
                                        Figure 3. HAB_TP star data model.
     In HAB_AP, a fact table (MonitorFact) and five-dimension tables (CollectionTime, ColTunnel,
     In  HAB_AP,
Drillings,         a factStressOnline)
           SlightShock,   table (MonitorFact)  and five-dimension tables (CollectionTime, ColTunnel,
                                       are designed.
Drillings, SlightShock, StressOnline) are designed.
     (a) The metadata description of the monitoring fact table is shown in Table 4;
     (b) The structure of the time dimension table is shown in Table 5;
     (c) The structure of the monitoring lane dimension table is shown in Table 6;
     (d) The structure of the drill cutting monitoring dimension table is shown in Table 7;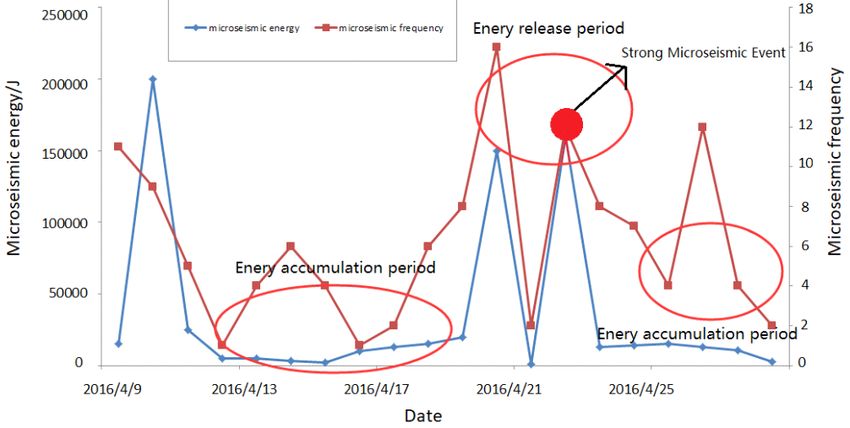
Processes 2019, 7, 55                                                                                            6 of 19

      (a) The metadata description of the monitoring fact table is shown in Table 4;
      (b) The structure of the time dimension table is shown in Table 5;
      (c) The structure of the monitoring lane dimension table is shown in Table 6;
      (d) The structure of the drill cutting monitoring dimension table is shown in Table 7;
      (e) The structure of the microseismic monitoring dimension table is shown in Table 8;
      (f) The structure of the stress online monitoring is shown in Table 9.

                                          Table 4. MonitorFact fact table metadata.

                   Name                                             MonitorFact
                 Summary             All monitoring conditions related to impact ground pressure
                 Objective                      Used for the analysis of impact factors
                                  Time, monitoring roadway, drilling cutting monitoring, microseismic
                Dimension
                                                 monitoring, stress online monitoring
                    Fact                                Monitoring fact sheet

                                 Table 5. Collection of time dimension table properties.

                        Column Name           Data Type        Size (Accuracy)          Annotation
                          ColTimeID              Int                     4             Major key
                           ColYear             varchar                   4           Monitoring year
                          ColMonth             varchar                   2          Monitoring month
                           ColDay              varchar                   2           Monitoring Day
                           ColHour             varchar                   2           Monitoring hours
                          ColMinute            varchar                   2          Monitoring minutes

                                        Table 6. ColTunnel dimension table properties.

                   Column Name             Data Type        Size (Accuracy)             Annotation
                    ColTunnelD                Int                   4                    Major key
                  ColTunneName              varchar                 20            Monitoring roadway name
                  ColTunneCode                Int                   4               Coding of roadway
                  ColTunneMine              varchar                 20                 Roadway mine
                   ColTunneCity             varchar                 20              City of the roadway

                                        Table 7. Drillings dimension table properties.

              Column Name             Data Type          Size (Accuracy)                Annotation
                DrillingslD                Int                 4                         Major key
             DrillingsNumber               Int                  4                Monitoring hole number
             DrillingsLocation             Int                  4             Monitoring position (distance/m)
                HoleDepth                varchar               4                         Deep hole
               AmountCoal                varchar               20              Amount of pulverized coal/kg

                                      Table 8. Slight shock dimension table properties.

                        Column Name          Data Type        Size (Accuracy)           Annotation
                        SlightShocklD              Int                4                  Major key
                         CumEnergy                 Int               15            Accumulated energy/J
                        VibrationTime              Int                4             Vibration frequency
                         MaxEnergy                 Int               15             Maximum energy/J
                          AveEnergy                Int               15              Average energy/J
Column Name Data Type Size (Accuracy) Annotation
SlightShocklD Int 4 Major key
CumEnergy Int 15 Accumulated energy/J
VibrationTime Int 4 Vibration frequency
MaxEnergy Int 15 Maximum energy/J
Processes 2019, 7, 55 7 of 19
AveEnergy Int 15 Average energy/J
Table 9.
Table 9. Stress
Stress online
online dimension
dimension table
tableproperties.
properties.
Column Name
Column Name Data
Data Type
Type Size(Accuracy)
Size (Accuracy) Annotation
Annotation
StressOnlinelD
StressOnlinelD
Int
Int 4
4 Major key
Major key
StressOnlineNumber
StressOnlineNumber Int
Int 44 Monitoring hole number
Monitoring hole number
SensorDepth
SensorDepth Int 44 Sensor
Sensor depth depth
StressOnlineValue
StressOnlineValue Int
Int 1515 StressStress
value /MPa
value /MPa
The star
The star data
data model
model of
of the
the HAB_AP
HAB_AP data
data warehouse
warehouseisisshown
shownin
inFigure
Figure4.4.
Figure 4. HAB_AP
Figure 4. HAB_AP star
star data
data model.
model.
4. Application of Cluster Analysis Technology in Rock Bursts
4. Application of Cluster Analysis Technology in Rock Bursts
4.1. Clustering Algorithm and Formula Selection
4.1. Clustering Algorithm and Formula Selection
Clustering analysis does not require artificial division and supervision. A set of data can be
grouped by a fixed number, in which the data in each group have the highest similarity. The data are
usually divided based on their distance, and the similarity and dissimilarity are the criteria for this
division. It is an unsupervised learning process [14].
We use X to represent a set of sample data and use a set of ordered classes (X, s) or (X, d) to
represent the input of the cluster analysis, while s and d are the criteria for measuring the similarity or
dissimilarity between samples. The output of the clustering system is a partition, and C = {C1 , C2 , . . . ,
Ck } occurs, where Ci (i = 1, 2, . . . , k) is a subset of X. Equations (4) and (5) are as follows.
[ [ [
C1 C2 ... Ck = X (4)
\
Ci Cj = ø, 1 ≤ i 6= j ≤ k (5)
where C1 , C2 , . . . , Ck are called the classes.
The rock burst occurring in coalmines is a dynamic disaster caused by multiple factors. It has the
same characteristics as natural earthquakes, such as suddenness, complexity, randomness, difference
and predictability. In addition, the complexity of the monitoring system makes the monitoring
data extremely ambiguous. K-means clustering does not require the artificial definition of the
partitioning conditions, but directly uses computer-automated iteration for accurate data partitioning.
The application of the K-means clustering algorithm in the prediction of rock bursts can provideProcesses 2019, 7, 55 8 of 19
accurate warning information for disaster prevention, effectively protecting the personal safety,
reducing economic losses, and helping to further study the mechanism of rock bursts.
The K-means clustering algorithm is one of the ten classical algorithms, and it is a mature and
widely used method. The calculation steps of the K-means clustering algorithm take the k points to
make a preliminary classification, dividing the closest data objects, and changing the values of each
cluster center through iterative iteration until the final clustering results cannot be iterated.
Assuming the sample data set is divided into c categories, the general steps are as follows:
(1) Select the initial center of c categories properly;
(2) In the k times iteration, the distance from the c center to any sample is classified into the center
of the shortest distance.
(3) Update the center value of the category using mean methods;
(4) For all c cluster centers, if the value is kept unchanged after the iterative method of (2) and (3),
the iteration ends; otherwise, it iteratively continues [15–17].
The greatest advantage of this algorithm is its simplicity and convenience. Additionally, the key
to the K-means algorithm lies in the choice of distance formula and the selection of the initial center.
Because the amount of coal powder, stress online, and microseismic energy are all practical data
with unit metrics, the Mahalanobis distance is used as the distance formula for calculation. Then,
the function of the digital square sum of the errors is viewed as the clustering criterion function,
thereby forming one class or cluster.
There are M sample vectors marked as X1 – Xm , the mean is recorded as vector µ, and the
covariance matrix is denoted as S. Then, the Mahalanobis distance of the sample vector X to µ is
expressed as q
D(X ) = ( X − µ ) T S −1 ( X − µ ) (6)
The Mahalanobis distance between the vector Xi and Xj is defined as
q T
Xi − X j S − 1 Xi − X j
D Xi , X j = (7)
From the above analysis, if two identical samples are set up in two different populations, the
Mahalanobis distance between the two samples is usually different. When the Mahalanobis distance is
used for the calculation, the amount of the total sample data must be larger than the dimension of the
sample data set. Otherwise, the inverse matrix of the covariance matrix of the total sample data cannot
be calculated. If this case occurs, it can only be calculated with the Euclidean distance [18–21].
The usage of the Mahalanobis distance has advantages and disadvantages. The advantages of the
Mahalanobis distance are that since the Mahalanobis distance between two points is independent of
the measurement unit of the data source, it is not affected by the dimension, and it can also exclude
the interference of the correlation between the variables; the disadvantage is that the Mahalanobis
distance amplifies tiny changes in data.
4.2. K-Means Clustering Algorithm Simulation Experiment
Figures 5 and 6 are the results of the clustering simulation obtained by using the classic K-means
clustering algorithm built in Matlab 9.1 which is developed by the MathWorks company of Natick
city, MA, US in 2016, and its improved K-means clustering algorithm for the Incorporated Research
Institutions for Seismology (IRIS) data set. Table 10 is a comparison of the accuracy of the two
clustering results.
From Figures 5 and 6 and Table 10, we can see that the improved K-means clustering algorithm is
more accurate than the K-means clustering algorithm with Matlab, and the clustering effect is better.
The code of the improved K-means clustering algorithm can be seen in “Appendix A”, which is after
the section “Future work”.Research
Research Institutions
Institutions forfor Seismology
Seismology (IRIS)
(IRIS) data
data set.set. Table
Table 10 10
is ais comparison
a comparisonof of
thethe accuracy
accuracy of of
thethe
two clustering
two clustering results. results.
FromFrom Figures
Figures 5 and
5 and 6 and
6 and Table
Table 10,10,
wewecancan
seesee that
that thethe improved
improved K-means
K-means clustering
clustering algorithm
algorithm
is is more
more accurate
accurate than
than thethe K-means
K-means clustering
clustering algorithm
algorithm with
with Matlab,
Matlab, and
and thethe clustering
clustering effect
effect is is
better.
better.
Processes TheThe
2019, code
7, code
55 of of
thethe improved
improved K-means
K-means clustering
clustering algorithm
algorithm can
can bebe seen
seen in in “Appendix
“Appendix A”,
9 of A”,
19
which
which is after
is after thethe section
section “Future
“Future work”.
work”.
Figure
Figure 5. Matlab
5. Matlab clustering
clustering results
results with
with K-means
K-means results.
results.
Figure
Figure 6. Improved
6. Improved K-means
K-means clustering.
clustering.
Table 10. Comparison results of Matlab’s own K-means and the improved K-means clustering.
Table
Table 10.10. Comparison
Comparison results
results of Matlab’s
of Matlab’s ownown K-means
K-means and
and thethe improved
improved K-means
K-means clustering.
clustering.
Clustering Algorithm
Clustering Algorithm Correct
Correct
Clustering Algorithm Correct
Matlab
Matlab
Matlab with
with
with K-means
K-means
K-means 90.4% 90.4%
90.4%
Improved K-means 93.8%
Improved K-means
Improved K-means 93.8%
93.8%
4.3. Result Analysis of the Improved K-Means Clustering Algorithm in Rock Bursts
The mechanism of rock bursts is very complicated, and the induced process of rock bursts is a
dynamic process. The sample data collected from the rock burst monitoring data with great changes
during a period of time are cleaned and pre-processed and stored in the data warehouse. Then,
the K-means clustering algorithm is used to cluster the analysis on the data set according to the actual
situation of the rock burst. The data in the sample set are divided into three categories: samples
without a rock burst, samples that are going to induce a rock burst, and samples with a rock burst.
After the clustering results are obtained, the new monitoring data only needs to be put into the data
warehouse and use the K-means algorithm to cluster again, and then we can continuously classify the
new monitoring data and scientifically carry out the work of disaster prevention and reduction [22–24].
Data are sampled from the monitoring results, including drilling cuttings, largest single seismic
energy and stress online, from the Panel 27307 of a coalmine during 10 April 2017 to 13 August 2017.
Then, the improved K-means clustering algorithm is used for the clustering analysis in Matlab 2016a,
and the cluster number is set up to 3. Figure 7 represents the clustering results.In Figure 7, the red dots indicate the situation where the danger needs to be alerted, the blue
indicates that the danger is likely to be subject to early warning, and the green point indicates a
relatively safe situation. The top four red data points correspond to the most dangerous situation in
23 April, 1 May, 3 May and 7 July, respectively. It is consistent with the actual situation, so this early
warning clustering
Processes 2019, 7, 55 algorithm is effective. However, it should be noted that when there is only a
10 of 19
small number of data sets, the sample may be misclassified due to the small number of samples and
the complex mechanism of the rock burst, and the K-means algorithm may not be able to predict the
rock In Figure
burst 7, the red dots indicate the situation where the danger needs to be alerted, the blue
correctly.
indicates
The followingdanger
that the is likelyanalysis
is an example to be subject
of rocktoburst
earlyprediction
warning, on and thedata
test green point
in the indicates
field. We alsoa
relatively safe
summarize thesituation.
followingThe top four
warning red data
values: thepoints
criticalcorrespond to the
value of drill most dangerous
cuttings (1–12 m: 4.8 situation
kg), thein
23 April, 1 May, 3 May and 7 July, respectively. It is consistent with the actual
warning value of microseismic (single event: 10 J), and the online warning value of stress, as shown
5 situation, so this early
warning
in Table 11.clustering algorithm is effective. However, it should be noted that when there is only a small
numberFigureof data sets, the
8 shows the sample may be
distribution of misclassified due to data.
field microseismic the small
We cannumber of samples
see that it is the and the
most
complex mechanism of the rock burst, and the K-means algorithm may not be
dangerous for rock bursts on 23 April, and it is in the energy release stage. Moreover, it can be seen able to predict the rock
burstthe
that correctly.
microseismic energy on 7 April is also very large, but no strong microseismic event occurs.
Hence, it following
The is an example
can be concluded that one analysis
kind ofofmonitoring
rock burst method
prediction on test
alone dataaccurately
cannot in the field. We also
predict the
summarize the following warning values: the critical value of drill cuttings (1–12
rock burst, and a variety of monitoring methods need to be combined to carry out coupling analysis m: 4.8 kg), the warning
valueprediction
and of microseismic
in order(single event:an
to achieve 105accurate
J), and the online warning
prediction result. value of stress, as shown in Table 11.
Stress/MPa
Amount of drilling
cuttings/kg
Maximum energy/104J
Figure 7. Clustering
Clustering results of rock burst data.
Processes 2019, 7, x FOR PEER REVIEW 11 of 19
Table 11. Stress online early warning value.
Table 11. Stress online early warning value.
8m 14 m
8m 14 m
Yellow alert 9 MPa 11 MPa
Yellow alert 9 MPa
Red alert 12 MPa 1411 MPa
MPa
Red alert 12 MPa 14 MPa
250,000 18
16
200,000 14
12
150,000
10
8
100,000
6
4
50,000
2
0
2016/4/9 2016/4/13 2016/4/17 2016/4/21 2016/4/25
Figure 8. 8.Distribution
Figure Distribution of
of field microseismicevents.
field microseismic events.
5. Realization of Visualization of Rock Burst Data
5.1. Architecture Design and Development Environment
The data mining system of rock bursts is composed of four modules: the software startupProcesses 2019, 7, 55 11 of 19
5. Realization of Visualization of Rock Burst Data
5.1. Architecture Design and Development Environment
The data mining system of rock bursts is composed of four modules: the software startup module,
data acquisition module of rock bursts, data mining module of rock bursts and data visualization
module. Users need to register an account in the software startup module to save and analyze their
data mining results, and also to observe the data curve in real time. The data acquisition module for
rock bursts can obtain the rock burst data from different data sources, in preparation for later data
mining. The data mining module includes a variety of different data mining algorithms, processing
and analyzing the rock burst data. The data visualization module is used to display the results of the
data curve intuitively.
(1) Tomcat was originally developed by James Duncan Davidson of Sun Microsystems and became
a free web application server recently. It belongs to the lightweight application servers, and is widely
used in application scenarios where the concurrency number is not large. It has strong support for the
Java language, and is the first choice for developing Java Server Pages (JSP) programs [25–27];
(2) MySQL is the traditional relational database management system. It was developed by the
Swedish MySQL AB and is currently owned by Oracle Corporation. Moreover, MySQL is currently the
most popular relational database and is often integrated into web development projects. MySQL has
the characteristics of high speed and low cost, and is open source, and it occupies a large proportion of
the market;
(3) IntelliJ IDEA is one of the best-integrated tools for the Java language development environment,
especially in the aspects of intelligent code assistants, code prompts, J2EE support, various versioning
tools (git, svn, github, etc.), JUnit, CVS integration, etc. These aspects of functionality are far superior
to other development tools and its flagship version also supports HTML, CSS, PHP (Hypertext
Preprocessor), MySQL, Python, etc. Hence, it can develop multi-language capabilities [28], such as
JavaWeb programs, PHP development, etc.
The visual interface of the IEWSBR was developed in Intellij IDEA2017. When the Web project
was created, the project was based on the Maven carrying out the package, and the whole architecture
was developed on the basis of the SpringMVC framework. The SpringMVC framework, which is based
on a framework of MVC, is a module of Spring. The operation process is such that the first request will
be sent to C, and then the controller goes to the M model (pojo, action, service, dao) layer processing,
the result is finalized and sent back to the controller, the controller will be rendered through the viewer,
and finally it will be returned to the terminal (response).
5.2. Implementation of Software Startup Module
To meet the needs of different users in different environments, the IEWSBR adds the functions
of registered users and user logins in the software startup module to assign different permissions.
This system can mine rock burst data for different individual needs, save data mining results to local
folders, facilitate the communication and transmission between the staff, and also watch data reports
in real time in the data visualization interface. The software startup interface is shown in Figure 9.5.2. Implementation of Software Startup Module
To meet the needs of different users in different environments, the IEWSBR adds the functions
of registered users and user logins in the software startup module to assign different permissions.
This system can mine rock burst data for different individual needs, save data mining results to local
folders,2019,
Processes facilitate
7, 55 the communication and transmission between the staff, and also watch data reports
12 of 19
in real time in the data visualization interface. The software startup interface is shown in Figure 9.
Figure
Figure 9.
9. Software
Software startup
startup interface.
interface.
5.3. Rock
5.3. Rock Burst
Burst Data
Data Acquisition
Acquisition Module
Module
The IEWSRB
The IEWSRBhas hasthree
threemodes
modes of importing
of importingdata: data:
manually importing
manually it into the
importing Mysqlthe
it into database,
Mysql
importingimporting
database, it into theitMysql database
into the Mysql with Excel,
database andExcel,
with writingandthe program
writing the into the Mysql
program database
into the Mysql
automatically.
database The first two
automatically. Themethods
first tworequire
methods data pre-processing,
require which standardizes
data pre-processing, the disordered
which standardizes the
monitoring monitoring
disordered data. This workdata.isThis
actually
workquite cumbersome,
is actually and it is necessary
quite cumbersome, and it to review thetointegrity
is necessary review
and integrity
the accuracy and of the massiveofmonitoring
accuracy the massivedata. When the
monitoring data
data. is complete
When the dataand the indicators
is complete are
and the
complete, the abnormal and duplicated data will be filtered out. The data that
indicators are complete, the abnormal and duplicated data will be filtered out. The data that do notdo not conform to the
rules are to
conform deleted, leaving
the rules the dataleaving
are deleted, stored the
in the database
data stored in or the
Excel [29]. or Excel [29].
database
Creating a database connection requires roughly three
Creating a database connection requires roughly three steps: activating steps: activating thethe driver,
driver, setting
setting up
up
connection information,
connection information,and andopening
opening thethe
connection, where
connection, the properties
where of the of
the properties data
thesource
data is as follows:
source is as
follows:
db.url = jdbc:mysql://localhost:3306/hab_tp
db.url = jdbc:mysql://localhost:3306/hab_tp
db.username = root
db.username
db.password = = root
db.password
db.dirverClass = = root
com.mysql.jdbc.Driver
db.dirverClass = com.mysql.jdbc.Driver
Once the connection is established, we can use the instance of SimpleJdbcCall to invoke any stored
Once
procedure andthe connection is established,
the SQL statement we can use
of the database. Thethe instance
detailed codeofofSimpleJdbcCall
part for the storedto invoke any
procedure
stored procedure
called by the loginand the SQL
operation statement in
is displayed ofthe
thesection
database. The detailed
“Appendix B”. code of part for the stored
procedure called by the login operation is displayed in the section “Appendix B”.
5.4. Data Visualization Module
The visualization module of IEWSRB is designed to display the results directly and visually to users
through the Browser/Server (B/S) structure. It is composed of data tables, columns, broken lines and
pie charts. The interface for data query is shown in Figure 11. According to the requirements, we can fill
in the query interval, query data type and query results. If the data query button in Figure 10 is clicked,
the query result page in the form of a fold line will be displayed, as shown in Figures 11 and 12.The visualization module of IEWSRB is designed to display the results directly and visually to
users through the Browser/Server (B/S) structure. It is composed of data tables, columns, broken
lines and pie charts. The interface for data query is shown in Figure 11. According to the
requirements, we can fill in the query interval, query data type and query results. If the data query
button 2019,
Processes in Figure
7, 55 10 is clicked, the query result page in the form of a fold line will be displayed, as
13 of 19
shown in Figures 11 and 12.
Processes 2019, 7, x FOR PEER REVIEW Figure 10. Data
Figure 10. Data query
query interface.
interface. 14 of 19
Figure
Figure 11.
11. Data
Data query
query result
result display
display page
page (fold
(fold line).
line).Processes 2019, 7, 55 14 of 19
Figure 11. Data query result display page (fold line).
Figure 12. Data query result display page (histogram).
6. Conclusions
6. Conclusions
This
This paper
paper combines
combines thethe research
research status
status of
of data
data mining
mining technology
technology and
and rock
rock burst
burst monitoring
monitoring
technology, adhering to the “Internet+” concept, applying data mining technology to IEWSRB.
technology, adhering to the “Internet+” concept, applying data mining technology to IEWSRB. With the
With
current advanced computer technology and communication technology as the background,
the current advanced computer technology and communication technology as the background, we we describe
the problems
describe which exist
the problems in the
which domestic
exist in the rock burstrock
domestic monitoring and early warning,
burst monitoring and earlyand clarifyand
warning, the
functions and requirements of the IEWSRB. After describing the overall system architecture, the data
processing, data warehouse establishment and data mining technology are deeply studied, and the
clustering algorithm in data mining technology is applied in the IEWSRB. A data mining system for
rock bursts is designed and implemented, and the following study results are obtained:
(1) According to the characteristics of the monitoring data of the rock burst, the rock burst
data warehouse is reasonably designed by using the data warehouse technology. It is fit for a
flexible configuration pattern, and is suitable for the measurement area and measured points in
underground coalmines;
(2) The K-means algorithm is improved based on the clustering algorithm, and the speed and
accuracy of the clustering algorithm are improved. This has a significant effect, which is explored for
use in the IEWSRB;
(3) A visual interface based on the rock burst data warehouse is designed and developed, and a
visual interface based on the B/S mode based on the Java language is supplemented by CSS, JS, HTML
and other languages. Tomcat is used as the server, MySQL is established as the impact pressure
monitoring data warehouse, and the monitoring data and historical data are displayed and analyzed
in a curve. Not only can real-time monitoring data be viewed, but other monitoring data can also be
imported into the view and data mining. Moreover, a variety of data mining algorithms can be added
for comparison, which is most suitable for rock burst monitoring.Processes 2019, 7, 55 15 of 19
7. Future Work
The IEWSRB fuses many technical achievements in the field. In the course of interdisciplinary
learning, there are some difficult problems to be solved, which are limited by personal ability and time,
and some of these problems need to be further studied and solved.
(1) The environment of coalmines is complex, and their influence on rock bursts varies greatly.
The structural design of the IEWSRB and the clustering algorithm in this paper need further
implementation and improvement. It is expected that the intelligent prediction system in different
mining areas may be inconsistent with the actual situation. There is a certain error in prediction
accuracy in different mining areas and under different geological conditions.
(2) The application of a data mining algorithm in the IEWSRB needs further improvement.
When the monitoring data fluctuates slightly, it will have a great influence on the results of the
clustering early warning, and so the question of how to optimize the clustering algorithm is one study
direction. Then, a data mining algorithm in addition to the clustering algorithm applied to the IEWSRB,
such as a neural network, association rules and so on, should be found.
(3) The visualization interface in IEWSRB needs to be more diversified, so as to improve the
visibility and enhance the User Interfac (UI) design of the human–machine interaction interface,
thereby making it friendlier.
(4) The hot topic of monitoring data for rock burst is addressed, as well as the system construction
and visualization realization for IEWSRB. However, during the monitoring processes, various signals
coming from environmental noise or generally false signals, which are not useful for monitoring
and prediction, may occur. To solve this problem, several studies have been conducted; for instance,
a sort of alarm system based on the warning network was set up to detect the electromagnetic signals;
the Mamdani fuzzy classifier based on the improved chaos immune algorithm and Iris database was
developed for the classification and recognition of acoustic emission and interference signals [8,30].
Despite the tremendous efforts that have already been made, in view of the diversity and magnitude
of monitoring data and signals, the issue of how to separate the various signals into useful signals and
false signals based on the data mining and data warehouse technologies, which are in line with the
current technological situation and industrial needs, needs further study.
Author Contributions: X.Z. and P.W. designed and wrote this paper. X.J. provided the methodology of this paper;
D.J. and N.S. handled the data of this paper.
Funding: This work was financially supported by National Natural Science Foundation of China (NSFC) (Nos.
51574159, 51804182); Science and Technology Development Plan of Tai’an (No. 2018GX0045); Shandong University
of Science and Technology Research Fund.
Conflicts of Interest: The authors declare no conflicts of interest.
Appendix A
%N is the number of classes of data
%data is the input data with no classification label
%u is the center of each category
%re is the data returned with the classification label
function [u re] = KMeans(data, N)
[m n] = size(data); % m is the number of data, n is the data dimension
Ma = zeros(n); % The maximum number per dimension
mi = zeros(n); % The smallest number per dimension
u = zeros(N, n); % First of all, random initialization
for i = 1:n
ma(i) = max(data(:, i)); % The maximum number per dimension
mi(i) = min(data(:, i)); % The smallest number per dimension
for j = 1:NProcesses 2019, 7, 55 16 of 19
u(j, i) = ma(i) + (mi(i) − ma(i))*rand(); % Random initialization
end
end
while 1
pre_u = u; % The central position of the last time
for i = 1:N
tmp{i} = [[];
for j = 1:m
tmp{i} = [tmp{i};data(j, :) − u(i, :)];
end
end
quan = zeros(m, N);
for i = 1:m
c = [[];
for j = 1:N
c = [c norm(tmp{j}(i, :))];
end
[junk index] = min(c);
quan(i, index) = norm(tmp{index}(i, :));
end
for i = 1:N
for j = 1:n
u(i, j) = sum(quan(:, i).*data(:, j))/sum(quan(:, i));
end
end
if norm(pre_u-u) < 0.1 % Iterate until it does not change
break;
end
end
re = [[];
for i = 1:m
tmp = [[];
for j = 1:N
tmp = [tmp norm(data(i, :)-u(j, :))];
end
[junk index] = min(tmp);
re = [re;data(i, :) index];
end
end
Appendix B
BEGIN
set n_result = −200;
label_proc:BEGIN
declare n_error integer default −200;
declare continue handler for sqlexception set n_error = −100;
if(uname is null or passw is null) then
set n_result = −1001;
leave label_proc;
end if;Processes 2019, 7, 55 17 of 19
SELECT
u.c_uid as userId,
u.c_name as userName,
u.c_password as password
FROM
t_user u
WHERE
u.c_name = uname
AND u.c_password = passw;
if(found_rows() 1)then
set n_result = −1002;
leave label_proc;
end if;
if(n_error = −100) then
set n_result = −1003;
leave label_proc;
else
set n_result = 1;
leave label_proc;
end if;
end label_proc;
END
BEGIN
set n_result = −200;
label_proc:BEGIN
declare n_error integer default −200;
declare continue handler for sqlexception set n_error = −100;
if(uname is null or passw is null) then
set n_result = −1001;
leave label_proc;
end if;
SELECT
u.c_uid as userId,
u.c_name as userName,
u.c_password as password
FROM
t_user u
WHERE
u.c_name = uname
AND u.c_password = passw;
if(found_rows() 1)then
set n_result = −1002;
leave label_proc;
end if;
if(n_error = −100) then
set n_result = −1003;
leave label_proc;
else
set n_result = 1;Processes 2019, 7, 55 18 of 19
leave label_proc;
end if;
end label_proc;
END
References
1. Wang, P.; Jiang, L.S.; Jiang, J.Q.; Zheng, P.Q.; Li, W. Strata behaviors and rock-burst-inducing mechanism
under the coupling effect of a hard thick stratum and a normal fault. Int. J. Geomech. 2018, 18, 04017135.
[CrossRef]
2. Pan, J.F.; Mao, D.B.; Lan, H.; Wang, S.W.; Qi, Q.X. Research status and prospect of coal mine impact pressure
control technology in China. Coal Sci. Technol. 2013, 41, 21–25, 41.
3. Jiang, L.S.; Kong, P.; Shu, J.M.; Fan, K.G. Numerical analysis of support designs based on a case study of a
longwall entry. Rock Mech. Rock Eng. 2019. [CrossRef]
4. Palei, S.K.; Das, S.K. Sensitivity analysis of support safety factor for predicting the effects of contributing
parameters on roof falls in underground coal mines. Int. J. Coal Geol. 2008, 75, 241–247. [CrossRef]
5. Wang, P.; Jiang, L.; Li, X.; Qin, G.; Wang, E. Physical Simulation of Mining Effect Caused by A Fault Tectonic.
Arabian J. Geosci. 2018, 11, 741. [CrossRef]
6. Wang, P.; Jiang, L.; Li, X.; Zheng, P.; Qin, G. Effects of strength weakening and interface slipping on rock
mass with different dip angle structure planes. Acta Geodynam. Geomater. 2018, 15, 329–338. [CrossRef]
7. Jiang, J.Q.; Wang, P.; Jiang, L.S.; Zheng, P.Q.; Xu, B. Numerical simulation on mining effect influenced by a
normal fault and its induced effect on rock burst. Geomech. Eng. 2018, 14, 337–344.
8. Zuo, H.; Luo, Z.; Wu, C. Classification identification of acoustic emission signals from underground metal
mine rock by icimf classifier. Math. Probl. Eng. 2014, 2014, 524304. [CrossRef]
9. Cai, M.; Kaiser, P.K.; Martin, C.D. Quantification of rock mass damage in underground excavations from
microseismic event monitoring. Int. J. Rock Mech. Min. Sci. 2001, 38, 1135–1145. [CrossRef]
10. Qi, Q.X.; Dou, L.M. Theory and Technology of Rockburst; China University of Mining and Technology Press:
Xuzhou, China, 2008.
11. Mitchell, T. Machine Learing; McGraw-Hill Companies Inc.: New York, NY, USA, 1997; pp. 230–247.
12. Jiang, L.S.; Wang, P.; Zheng, P.Q.; Luan, H.J.; Zhang, C. Influence of Different Advancing Directions on
Mining Effect Caused by a Fault. Adv. Civ. Eng. 2019. [CrossRef]
13. Dou, L.M.; Cai, W.; Cao, A.Y.; Guo, W.H. Comprehensive early warning of rock burst utilizing microseismic
multi-parameter indices. Int. J. Min. Sci. Technol. 2018, 28, 767–774. [CrossRef]
14. Jiang, D. Research and Application of Data Fusion and Data Mining in the Information Processing System; Xi’an
University of Electronic Science and Technology: Xi’an, China, 2010.
15. Li, F.; Zhang, L. Comparison of point pattern analysis methods for classifying the spatial distributions of
spruce-fir stands in the north-east USA. Forestry 2007, 80, 337–349. [CrossRef]
16. Liu, J. Improved Clustering Analysis Algorithm and Its Application in Performance Analysis; Dalian Jiaotong
University: Dalian, China, 2008.
17. Germanovicha, L.N.; Dyskin, A.V. Fracture mechanisms and instability of openings in compression. Int. J.
Rock Mech. Min. Sci. 2000, 37, 256–270. [CrossRef]
18. Holub, K.; Petrs, V. Some parameters of rockbursts derived from underground seismological measurements.
Tectonophysics 2008, 456, 67–73. [CrossRef]
19. Milev, A.M.; Spottiswoode, S.M.; Rorke, A.J.; Finnie, G.J. Seismic monitoring of a simulated rock burst on a
wall of an underground tunnel. J. S. Aff. Inst. Min. Metall. 2001, 101, 253–260.
20. Ruisheng, J.; Hongmei, S.; Jiancong, F. A model and method for the identification of multi-parameter
precursors of impact ground pressure. J. Rock Mech. Eng. 2014, 33, 1513–1519.
21. Pan, L. The Research and Application of the Identification of Impact Pressure Precursor Information; Shandong
University of Science and Technology: Taian, China, 2003.
22. Lee, J.; Jeong, Y.; Oh, Y.S.; Lee, J.C.; Ahn, N.; Lee, J.; Yoon, S.H. An integrated approach to intelligent urban
facilities management for real-time emergency response. Autom. Construct. 2013, 30, 256–264. [CrossRef]
23. Jiang, L.S.; Wang, P.; Zhang, P.P.; Zheng, P.Q.; Xu, B. Numerical analysis of the effects induced by normal
faults and dip angles on rock bursts. C. R. Mec. 2017, 345, 690–705. [CrossRef]Processes 2019, 7, 55 19 of 19
24. Ning, Y. Application of Data Mining in the Online Monitoring of Marine Environment and Intelligent Warning
System for Red Tide Disaster; Shandong University: Jinan, China, 2008.
25. Li, G. Research and Design of Digital Mines; Tianjin University: Tianjin, China, 2013.
26. Christopher, N.; Zach, A.; Nathaniel, S. Development of a web-platform for mining applications. Int. J. Min.
Sci. Technol. 2018, 28, 95–99.
27. Blake, W.; Leighton, F.; Duvall, W.I. Microseismic Techniques for Monitoring the Behavior of Rock Structures;
Bureau of Mines: Washington, DC, USA, 1974.
28. Stewart, R.A.; Reimold, W.U.; Charlesworth, E.G.; Ortlepp, W.D. The nature of a deformation zone and
fault rock related to a recent rockburst at Western Deep Levels Gold Mine. Tectonophysics 2001, 337, 173–190.
[CrossRef]
29. Gao, X. Fuzzy Cluster Analysis and Its Application; Xi’an Electronic Science and Technology University Press:
Xi’an, China, 2004.
30. Borla, O.; Lacidogna, G.; di Battista, E.; Niccolini, G.; Carpinteri, A. Electromagnetic Emission as Failure Precursor
Phenomenon for Seismic Activity Monitoring, Fracture, Fatigue, Failure, and Damage Evolution; Springer: Cham,
Switzerland; Heidelberg, Germany; New York, NY, USA; Dordrecht, The Netherlands; London, UK, 2015.
© 2019 by the authors. Licensee MDPI, Basel, Switzerland. This article is an open access
article distributed under the terms and conditions of the Creative Commons Attribution
(CC BY) license (http://creativecommons.org/licenses/by/4.0/).You can also read