How Flickr Helps us Make Sense of the World: Context and Content in Community-Contributed Media Collections
←
→
Page content transcription
If your browser does not render page correctly, please read the page content below
How Flickr Helps us Make Sense of the World: Context and
  Content in Community-Contributed Media Collections

                                              ∗                                                                                      †
                Lyndon Kennedy , Mor Naaman, Shane Ahern, Rahul Nair, Tye Rattenbury
                                                                 Yahoo! Research Berkeley
                                                                    Berkeley, CA, USA
                                           {lyndonk,mor,sahern,rnair,tye}@yahoo-inc.com

ABSTRACT                                                                             1.      INTRODUCTION
The advent of media-sharing sites like Flickr and YouTube                              The proliferation of digital photo-capture devices, and the
has drastically increased the volume of community-contributed                        growing practice of online public photo sharing, have re-
multimedia resources available on the web. These collec-                             sulted in large public pools of consumer photographs avail-
tions have a previously unimagined depth and breadth, and                            able online. Billions of images shared on websites such as
have generated new opportunities – and new challenges – to                           Flickr1 serve as a growing record of our culture and envi-
multimedia research. How do we analyze, understand and                               ronment. Searching, viewing, archiving and interacting with
extract patterns from these new collections? How can we                              such collections has broad social and practical importance.
use these unstructured, unrestricted community contribu-                             However, due to their magnitude, these collections are in-
tions of media (and annotation) to generate “knowledge”?                             creasingly difficult to understand, search and navigate. In
   As a test case, we study Flickr – a popular photo sharing                         particular, automated systems are largely incapable of un-
website. Flickr supports photo, time and location metadata,                          derstanding the semantic content of the photographs. Thus,
as well as a light-weight annotation model. We extract in-                           the prospects of ‘making sense’ of these photo collections
formation from this dataset using two different approaches.                          are largely dependent on metadata and information that is
First, we employ a location-driven approach to generate ag-                          manually assigned to the photos by the users.
gregate knowledge in the form of “representative tags” for                             Clues as to the content of the images can be found in text
arbitrary areas in the world. Second, we use a tag-driven ap-                        (such as labels or “tags”) that is associated with the im-
proach to automatically extract place and event semantics                            ages by users. Researchers have previously analyzed user-
for Flickr tags, based on each tag’s metadata patterns.                              supplied tags in multimedia collections to extract trends and
   With the patterns we extract from tags and metadata, vi-                          visualization data [6], as well as suggest annotations for un-
sion algorithms can be employed with greater precision. In                           annotated images [14, 20]. However, the associated tags
particular, we demonstrate a location-tag-vision-based ap-                           presents an additional set of challenges for multimedia sys-
proach to retrieving images of geography-related landmarks                           tems. As used on Flickr and other photo-sharing website,
and features from the Flickr dataset. The results suggest                            tags and other forms of text are freely entered and are not
that community-contributed media and annotation can en-                              associated with an ontology or any type of categorization.
hance and improve our access to multimedia resources – and                           Tags are therefore often innacurate, wrong or ambiguous.
our understanding of the world.                                                      In particular, due to the complex motivations involved that
                                                                                     drive usage of tags and text descriptions [2], tags do not
Categories and Subject Descriptors                                                   necessesarily describe the content of the image [11].
                                                                                       Location information associated with the photos can prove
H.4 [Information Systems Applications]: Miscellaneous                                valuable in understanding photos’ content. Exceedingly, im-
                                                                                     ages are geo-referenced (or, “geotagged”): associated with
Keywords                                                                             metadata describing the geographic location in which the
geo-referenced photographs, photo collections, social media                          images were taken [24]. For instance, more than twenty
                                                                                     million photos with location metadata are now available on
∗Also affiliated with Columbia University Dept. of Electrical
                                                                                     Flickr – the first major collection of its kind. Location meta-
Engineering                                                                          data will be exceedingly available, primarily from location-
†Also affiliated with UC Berkeley Computer Science Dept.                             aware camera-phones and digital cameras, and initially from
                                                                                     user input [24]. The location metadata alone was shown to
                                                                                     be beneficial in browsing and organizing these collections
                                                                                     [15, 18, 24]. In addition, location can sometimes suggest the
Permission to make digital or hard copies of all or part of this work for            semantic content of the images [14, 20].
personal or classroom use is granted without fee provided that copies are
not made or distributed for profit or commercial advantage and that copies
                                                                                       Ultimately, systems would benefit from applying com-
bear this notice and the full citation on the first page. To copy otherwise, to      puter vision techniques to improve our understanding of im-
republish, to post on servers or to redistribute to lists, requires prior specific   ages in community-contributed media collections. Applying
permission and/or a fee.
MM’07, September 23–28, 2007, Augsburg, Bavaria, Germany.                            1
Copyright 2007 ACM 978-1-59593-701-8/07/0009 ...$5.00.                                   http://flickr.com
computer vision in unconstrained domains is a difficult prob-     the photo’s context (location) in addition to the content,
lem that is sure to be a research topic for years to come [21].   and filtered the results accordingly. This method is of course
However, visual pattern recognition approaches can be used        different than our work to automatically identify landmarks
for some well-defined tasks in such unstructured collections.     and their locations. Davis et al. [5] had a similar method
   The key contribution of this paper is combining tag-based,     that exposed the similarity between places based on content
location-based and content-based analysis to improve the          and context data, but did not detect or identify landmarks.
automated understanding of such large user-contributed me-           Other work has addressed building models of location
dia collections. First, an analysis of the tags associated with   from the context and annotation of photographs. In [14],
images using a location-driven approach helps us generate         Naaman et al. extract location-based patterns of terms that
“representative tags” for arbitrary areas in the world. The       appear in labels of geotagged photographs of the Stanford
selected tags often correspond to landmarks or geographic         campus. The authors suggest to build location models for
features inside the areas in question. Second, we employ          each term, but the system did not automatically detect land-
a tag-driven approach to automatically extract place and          marks, nor did it include computer vision techniques.
event semantics for Flickr tags, based on each tag’s meta-           In the computer vision field, in [11], the authors investi-
data (location and time) patterns.                                gated the use of “search-based models” for detecting land-
   Using the patterns we extract from tags and location, vi-      marks in photographs. In that application, the focus was the
sion algorithms can be employed with greater precision. In        use of text-based keyword searches over web image collec-
particular, we demonstrate a location-tag-vision-based ap-        tions to gather training data to learn models to be applied to
proach to retrieve images of geography-related landmarks          consumer collections. That work, albeit related to our work
and features from the Flickr dataset.                             here, relies upon pre-defined lists of landmarks; we inves-
   In particular, this context-annotation-content analysis has    tigate the use of metadata to automatically discover land-
the potential to assist in various critical tasks involving me-   marks. Furthermore, the focus of that work is on predict-
dia collections, including:                                       ing problems that would emerge from cross-domain learning,
  • Improving precision and breadth of retrieval for land-        where models are trained on images from web search results
    mark and place-based queries.                                 and then applied to consumer photos.
                                                                     In [3], Berg and Forsyth present an approach to ranking
  • Soft annotation of photos, or suggesting tags to un-annotated
                                                                  “iconic” images from a set of images with the same tag on
    geo-referenced photos uploaded by users.
                                                                  Flickr. Our work also examines ranking the most represen-
  • Generating summaries of large collections by selecting        tative (or iconic) images from a set of noisily labeled images
    representative photos for places and identified landmarks.    which are likely of the same location. A key difference is
   Our work is motivated and designed by the characteristics      that in [3], the locations are manually selected, and it is as-
of an actual, existing dataset of more than 20,000,000 geo-       sumed that there is one iconic view of the scene, rather than
referenced photos currently available on Flickr. We do not        a diverse set of representative views as we show in this work.
rely on gazetteers, or existing lists of landmarks, ontologies       Snavely et al. [22] have presented a system which can
of tag semantics, or any other manual classification. This        register point-wise correspondences between various images
realistic dataset offers a huge opportunity, accompanied, of      of the same location and iteratively approximate the cam-
course, by new challenges and requirements for multimedia         era angles from which the various images were collected.
research.                                                         This system, however, is intended for exploration and has
   The metadata model used throughout this paper is de-           no mechanism for selecting a few “representative” images to
fined in Section 3. We describe the location-driven analysis      summarize the location. The system is also computation-
in Section 4. In Section 5, we describe how we extract se-        ally expensive and currently impractical for running over
mantics from Flickr tags by their metadata distributions.         the wide range of landmarks. Our system can serve as input
Section 6 provides the details on incorporating vision algo-      and automatic filter for the Snavely et al. algorithm.
rithms in our analysis; a short evaluation is presented in
Section 7. We begin, of course, with related work.
                                                                   3.   MODEL AND REQUIREMENTS
2.   RELATED WORK                                                     This section formalizes the properties of the dataset used
   We report below on related work in metadata and mul-            throughout this paper. We expand the research problem
timedia fusion, metadata-based models of multimedia, and           definitions and proposed solutions in the respective sections.
computer-vision approaches to landmark recognition.                   Our dataset consists of three basic elements: photos, tags
                                                                                                                    4
   The topic of “landmark recognition” has been studied            and users. We define the set of photos as P = {p}, where p is
in the last few years, but applied to limited or synthetic         a tuple (θp , `p , tp , up ) containing a unique photo ID, θp ; the
datasets only. In particular, analysis of context and content      photo’s capture location, represented by latitude and lon-
in photo collection has been studied in [5, 17, 25, 27] and        gitude, `p ; the photo’s capture time, tp ; and the ID of the
more. The work of Tsai et al. [25], for example, attempted         user that contributed the photo, up . The location `p gener-
to match landmark photos based on visual features, after           ally refers to the location where the photo p was taken, but
filtering a set of images based on their location context.         sometimes marks the location of the photographed object.
This effort serves as an important precursor for our work          The time, tp generally marks the photo capture time, but
here. However, the landmarks in the dataset for Tsai et al.        occasionally refers to the time the photo was uploaded to
were pre-defined by the researchers that assumed an existing       Flickr.
database of landmark. This assumption is at best exremely             The second element in our dataset is the set of tags as-
limiting, and perhaps unrealistic. O’hare at al. [17] used a       sociated with each photo. We use the variable x to denote
query-by-example system where the sample query included            a tag. Each photo p can have multiple tags associated with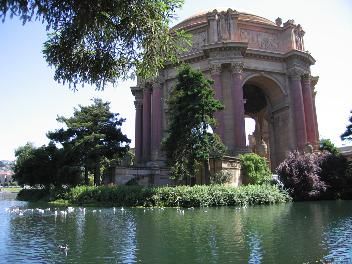
it; we use Xp to denote this set of tags. The set of all tags
4
over all photos is defined as: X = ∪p∈P Xp . We can use the
equivalent notation to denote the set of tags that appear in
any subset PS ⊆ P of the photo set as XS . For convenience,
we define the subset of photos associated with a specific tag
4
as: Px = {p ∈ P | x ∈ Xp }. Accordingly, photos with the
4
tag x in a subset PS of P are denoted PS,x = {PS ∩ Px }.
The third element in the dataset is users, the set of which
4
we denote by the letter U = {up }. Equivalently, we use
4 4
US = {up | p ∈ PS } and Ux = {up | p ∈ Px } to denote users
that exist in the set of photos PS and users that have used
the tag x, respectively.
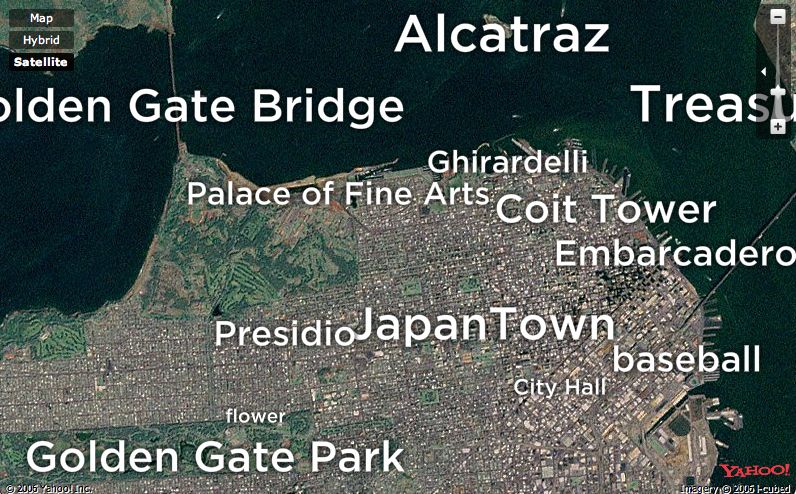
4. EXTRACTING KNOWLEDGE ABOUT LO- Figure 1: Representative tags for San Francisco
CATIONS
How do we extract knowledge about geographic regions
from community contributions of images and metadata? Us- cluster’s centroid movement drops below 50 meters. The
ing the data described in Section 3 we wish to automati- number of seed points used for the k-Means algorithm is
cally identify tags that are “representative” for each given based on |PG |, the number of photographs in the area under
geographical area. It is important to note that these repre- question. Based on empirical observation of the results, we
sentative tags are often not the most commonly used tags set the seed value to range from three for sparse areas (un-
within the area under consideration. Instead, we wish to der 100 photographs) to 15 for denser areas (greater than
surface tags that uniquely define sub-areas within the area 4000 photographs).
in question. For example, if the user is examining a por- Once the clusters have been determined, the system scores
tion of the city of San Francisco, then there is very little to each cluster’s tags to extract representative tags. In other
be gained by showing the user the San Francisco2 or Bay words, we consider each cluster C, and the set of tags XC
Area tags, even if these tags are the most frequent, since the that appear with photos from the cluster. We score each tag
tags apply to the entire area under consideration. Instead, x ∈ XC according to the factors defined below.
we would ideally show tags such as Golden Gate Bridge, One of the factors we use is TF-IDF (term frequency, in-
Alcatraz and Fisherman’s Wharf which uniquely represent verse document frequency). This metric assigns a higher
specific locations, landmarks and attractions within the city. score to tags that have a larger frequency within a cluster
Before we can determine the “representativeness” of a tag, compared to the rest of the area under consideration. Again,
we need to have an intuition of what the term implies. We the assumption is that the more unique a tag is for a specific
follow some simple heuristics that guide us in devising the cluster, the more representative the tag is for that cluster.
algorithms. The heuristics attempt to capture the human Of course, we do not wish to use tags that only appear a
attention and behavior as represented in the photos and tag few times in the cluster; the term frequency element prefers
dataset. Our heuristics are aimed toward both finding im- popular tags.
portant locations and identifying represntative tags. For The TF-IDF is computed with slight deviation from its
example, the number of photographs taken in a location is regular use in Information Retrieval. The term frequency for
an indication of the relative importance of that location; a a given tag x within a cluster C is the count of the number
4
similar indication is found in the number of individual pho- of times x was used within the cluster: tf(C, x) = |PC,x |.
tographers that have taken photos in a location. Looking at The inverse document frequency for a tag x, in our case,
tags, users are likely to use a common set of tags to identify computes the overall ratio of the tag x amongst all photos
the objects/events/locations that occur in photographs of a 4
in the region G under consideration: idf(x) = |PG |/|PG , x|.
location; and tags that occur in a concentrated area (and do
Note that we only consider a limited set of photos (PG ) for
not occur often outside that area) are more representative
the IDF computation, instead of using the statistics of the
than tags that occur diffusely over a large region.
entire dataset. This restriction to the current area, G, allows
We start by assuming that the system considers a single
us to identify local trends for individual tags, regardless of
given geographic area G, and the photos that were taken in
their global patterns.
this area, PG . The system attempts to extract the represen-
While the tag weight is a valuable measure of the popu-
tative tags for area G. This computation is done in two main
larity of the tag, it can often be affected by a single photog-
steps: in the first step, we cluster the set of photos PG us-
rapher who takes a large number of photographs using the
ing the photos’ geographic locations. In the second step, we
same tag. To guard against this scenario, we include a user
score the tags in each cluster for their “representativeness”.
element in our scoring, that also reflects the heuristic that a
In the first step, the system geographically clusters the
tag is more valuable if a number of different photographers
set of photographs PG . We use the k-Means clustering al-
use it. In particular, we factor in the percentage of photog-
gorithm, based on the photos’ latitude and longitude. Ge- 4
ographical distance is used as the distance metric, and the raphers in the cluster C that use the tag x: uf = UC,x /UC .
stopping condition for the k-Means algorithm is when each The final score for tag x in cluster C is computed by
Score(C, x) = tf · idf · uf. The higher the tf-idf score, and the
2
We use this format to represent tags in the text. user score, the more distinctive the tag is within a cluster.
For each cluster, we retain only the tags that score above
a certain threshold. The threshold is needed to ensure that
the selected tags are meaningful and valuable for the aggre-
gate representation. We use an absolute threshold for all
computed clusters to ensure that tags that are picked are
representative of the cluster.
   A sample set of representative tags for San Francisco is
shown in Figure 1. In [1, 9] we supply more details on the
algorithm, and on how we extend the computation to sup-
port multiple regions and zoom levels; we also evaluate the
algorithmic results. Using this algorithm, we had created a
live visualization3 of the world. The details and evaluation
of this system can also be found in [1].
   We return to this algorithm in Section 6. We note that
the representative tags often correspond to landmarks and
geographic features. In Section 6, we use these computed
landmark tags to seed a vision-based system that attempts
to idenfity representative images for each tag.

5.     IDENTIFYING TAG SEMANTICS                                    Figure 2:     Location (top) and time (bottom)
   How do we extract knowledge about specific tags or tex-          metadata distributions for the tag Hardly Strictly
tual terms, using community contributions of images and             Bluegrass in the San Francisco Bay Area.
metadata? Using the same data, as described in Section 3,
we wish to identify tags that have event or place seman-
tics. Based on the temporal and spatial distributions of            ing the location distribution Lx for the tag Hardly Strictly
each tag’s usage on Flickr, we attempt to automatically             Bluegrass, it appears as a single strong cluster at the city
determine whether a tag corresponds to a “place” and/or             scale; but appears as multiple clusters at a neighborhood
“event”. As mentioned above, extraction of event and place          scale (see Figure 2). SSI identifies place tags by: (1) clus-
semantics can potentially assist many different applications        tering the usage distribution Lx at multiple scales; (2) mea-
in the photo retrieval domain and beyond. These applica-            suring how similar the clustering at each scale is to a sin-
tions include improved image search through inferred query          gle cluster by calculating the information entropy; and (3)
semantics; automated creation of place and event gazetteer          summing the entropy calculations at each scale to produce
data; generation of photo collection visualizations by loca-        a single score that indicates how similar the usage data is to
tion and/or event/time; support for tag suggestions for pho-        a single cluster over multiple scales. The process for iden-
tos (or other resources) based on location and time of cap-         tifying event tags is equivalent, using the time distribution
ture; and automated association of missing location/time            Tx . In the case of Hardly Strictly Bluegrass, we expect
metadata to photos, or other resources, based on tags or            SSI to identify the tag both as an event, and as a place.
caption text.                                                          In [19] we provide additional details and evaluation on
   We loosely define “place tags” as tags that are are ex-          SSI and other methods for extracting these semantics from
pected to exhibit significant spatial patterns. Similarly, “event   Flickr tags. While not quite perfect, we consider all geo-
tags” are ones that are expected to exhibit significant tempo-      tagged photos in San Francisco and show that tags that
ral patterns. Example place tags are Delhi, Logan Airport           represent events and places can be identified with reason-
and Notre Dame. Sample event tags are Thanksgiving, World           able precision and recall.
Cup, AIDS Walk 2006, and Hardly Strictly Bluegrass. In-                In other words, the metadata patterns of tags in community-
terestingly, Hardly Strictly Bluegrass is a festival that           contributed media collections can be used to extract seman-
takes places in San Francsico, and thus represents both an          tics of these tags. These semantics can be used when com-
event and a place. Spatial and temporal distributions for           bining content-based analysis with context-based tools. For
Hardly Strictly Bluegrass are shown in Figure 2. Exam-              example, attempting to detect landmarks in our dataset, we
ples of tags not expected to represent events or locations are      can rule out tags that have do not have place semantics, or
dog, party, food and blue.                                          have place and event semantics: the tag dog is not likely to
   Formally, we can define the location and time usage dis-         be a geographic-based landmark (because it does not have
                                4                                   place semantics). Similarly, Hardly Strictly Bluegrass is
tributions for each tag x: Lx = {`p | p ∈ Px } (locations of        not likely to represent a landmark (because of its identi-
                                 4
all photos with tag x) and Tx = {tp | p ∈ Px } (time of all         fied event semantics). This semantic extraction can assist
photos with tag x). We now show how place semantics for             us to select tags for which we can generate computer vision
a tag x can be derived from the tag’s location distribution,        models, as discussed next.
Lx . Similarly, time semantics can be derived from Tx .
   The method we use to identify place and event tags is            6.   COMBINING VISION WITH TAG-LOCATION
Scale-structure Identification (or SSI). This method mea-
sures how similar the underlying distribution of metadata is             ANALYSIS
to a single cluster at multiple scales. For example, examin-          If we can identify tags that represent places and land-
                                                                    marks, can we apply computer vision techniques to get rel-
3
    http://tagmaps.research.yahoo.com                               evant and diverse set of images for these tags? In previous
sections we described how we use tag and location meta-            to be much higher than is generally true across the collec-
data to extract and identify tags that represent landmarks         tion. Our focus here is on unsupervised methods, where the
and places. In this section, we assume a given tag x repre-        statistics of representative images can be learned directly
sents a landmark or place, and show how to find a relevant,        from the noisy labels provided by users, without the need
representative and diverse set of images for that tag. The         for explicitly defining a location or manually relabeling the
opportunity here is to improve both image search and visu-         images as representative or not. The resulting models could
alization in such community media collections. For example,        also be applied to enhance indexing by suggesting additional
when a user searches for photos of the Golden Gate Bridge,         tags for images or to refine queries for search.
our system will be able to detect that the search refers to a         Formally, our problem involves identifying a tag x as rep-
landmark; the precision of the result set can be improved,         resentative of some landmark or geographic feature, and
and the set of returned images more diverse and complete.          computing a set of photos Rx ⊆ Px that are representa-
   Current image search in community-annotated datasets is         tive of that landmark. Theoretically speaking, the set Rx
far from satisfactory: issues of precision, recall and diversity   could include photos that were not annotated with the tag
in the result set are acute. These issues exist in the Flickr      x (i.e., Rx 6⊆ Px ). In other words, there could be pho-
photo dataset, and may persist even when the images have           tos in the dataset that are representative of a certain land-
been tagged as being of a place or landmark, and geotagged         mark/feature defined by x but were not necessarily tagged
at their location. In all these cases, the quality and repre-      with that tag by the user (thus improving recall). However,
sentativeness of images can be highly variant.                     we do not handle this case in our current work.
   The precision problem in community-contributed datasets            The architecture of the system for finding representative
is a reflection of the fact that tags associated with any indi-    images is shown Figure 3. Given a set of photographs, we
vidual image are not guaranteed to be “correct” [2, 3, 11].        first determine a set of tags that are likely to represent land-
For example, previous work [11] reports that, over a set of        marks and geographic features, and the geographic areas
tagged Flickr photographs for a few hand-selected New York         where these tags are prominent. Then, we extract visual
City landmarks, the precision of images with a given land-         features from the images that correspond to each tag in its
mark tag is alarmingly low (around 50%) – only half of the         respective areas. For each tag, we cluster its associated im-
images tagged with a landmark name are actually images of          ages based on their visual content to discover varying views
that landmark. This phenomenon is likely due to the vari-          of the landmark. The clusters are then ranked according to
ety of contexts in which tags could be used: it is important       how well they represent the landmark; images within each
to recognize that tags are not always used to annotate the         cluster are also ranked according to how well they repre-
content of the image in the traditional sense [2].                 sent the cluster. Finally, the most representative images are
   A more subtle precision issue can arise with these personal     sampled from the highest-ranked visual clusters to return a
photographs that are shared online. For example, people of-        summary of representative views to the user.
ten take photographs of themselves or their family members
standing in front of a visited landmark. Other users brows-        6.2    Identifying Tags and Locations
ing the collection may be more interested in the landmark             The key idea behind our system is that location metadata
than in photos of strangers in front of it. Similarly, many        comes into play in both finding tags that represent land-
users on Flickr, for example, are photo enthusiasts who take       marks, and in identifying representative photos. To identify
a decidedly artistic approach to personal photography. In          tags that represent landmarks and places we use a variant of
these cases, photos tagged with a given location or landmark       the algorithm described in Section 4, looking for tags that
may actually be of the landmark, but are framed in such a          mostly occur in a concentrated area and used by a number
manner (such as extreme close-ups) that they are more ab-          of users in the same area. These “representative tags” often
stract in appearance and hardly recognizable as the object         correspond to place names and landmarks.
in question.                                                          As detailed in Section 4, the process involves location-
   The diversity of the retrieved images also poses a problem.     based clustering of the photo set, followed by scoring of the
Often, the set of retrieved images for a specific landmark or      tags that appear in the dataset. We first cluster all photos
location, even if precise, can be homogenous (e.g., showing        P in a certain region, using the photos’ location coordinates
many photos from the same view point). Ideally, a search or        `p . For each resulting photo cluster C, we score each tag x in
a selection of photos for a landmark would return multiple         that cluster (see Section 4) to find a set of representative tags
views and angles to better cater to the user’s specific need.      for each cluster. This process results in a list of (x, C) pairs
   Recall, of course, is also an issue in community-annotated      – (tag, cluster) pairs indicating tag x to be a geographic fea-
datasets: there is no guarantee that all images will be re-        ture in the cluster C. An important point is that the same
trieved for any search query. Individual images may not be         cluster could have multiple associated tags. Similarly, the
annotated with the “correct” or appropriate tags. In this          same tag x can appear in multiple clusters. For example, the
paper we do not tackle the recall issue directly. We note          tag Golden Gate Bridge may appear multiple times in our
that our methods can be used for the purpose of “soft an-          list, in a different clusters, potentially representing differ-
notation”, which could ultimately improve recall.                  ent viewpoints of the bridge.4 To summarize using another
                                                                   example, if we examine all photos from San Francisco, our
6.1    Problem Definition                                          system would ideally find tags such as Golden Gate Bridge,
  We pose the task of finding representative images from a         Alcatraz and Coit Tower that represent landmarks and ge-
noisy tag-based collections of images as a problem of select-      ographic features within the city. Furthermore, the system
ing a set of actual positive (representative) images from a        4
                                                                    For further refinement of the resulting list of tags, we can
set of pseudo-positive (same-tag or same-location) images,         use the algorithms described in Section 5 to retain only tags
where the likelihood of positives within the set is considered     that have been identifyed as places and not as events.
Tagged Photos              Discover Views         Rank Clusters by "Representativeness"           Location Summary
                                                                                                       (Representative Photos)

                                    Clustering

                                                                                                          Discarded Views
                                                                                                     (Non-representative Photos)

Figure 3: System architecture for choosing representative images from tag/location clusters using visual
content.

would identify the different areas where people take photos             Gabor textures [13]. These features are calculated as the
of each of these landmarks.                                             mean and standard deviation of Gabor transformations
   More formally, let us assume we identified the tag x as              in 4 scales and 6 orientations over the grayscale image,
a prominent geographic feature in a set of photo clusters               yielding a 48-dimensional feature vector.
    4
Cx = Cx,1 , Cx,2 , ... The corresponding set of photos we are        • Interest Points. We further represent the images via
                       4                                                local interest point descriptors given by the scale-invariant
interested in is Px,Cx = Px ∩ PCx .
  Next, we show how we perform visual analysis on the pho-              feature transform (SIFT) [12]. Interest points and local
tos in Px,Cx .                                                          descriptors associated with the points are determined
                                                                        through a difference of Gaussian process. This yields
                                                                        a 128-dimensional SIFT feature vector for each interest
6.3   Visual Features                                                   point in an image. Typical images in our data set have a
   This step involves the task of extracting visual features            few hundred interest points, while some have thousands.
for a tag x. This task is now easier because we hopefully re-           SIFT features have received much interest due to their
stricted the corresponding set of images for the tag: not only          invariance to scale and rotation transforms and their ro-
is the tag now likely to represent the same object (e.g., same          bustness against changes in viewpoint and illumination.
windmill), but the viewpoints from which the photos were                The SIFT features have been found to be extremely pow-
taken are limited – all the photos were taken in a restricted           erful in a number of vision applications, from generic ob-
set of geographic clusters. Given the set Px,Cx , we attempt            ject recognition [7] to alignment and registration between
to select a set of images Rx,Cx that is most represtative of            various photographs of a single scene [22].
the visual features for the landmark represented by tag x.            We now discuss how we use these visual features to find
We will then select the images from Rx,Cx to generate our           visual clusters Vx that represent different views for the land-
final set of representative images, Rx .                            mark x.
   We first describe the visual features extracted from the
images in the set Px,Cx .                                           6.4     Visual Clustering
   We use a range of complementary features to capture
the color, texture, and local point characteristics of images.         Many landmarks and locations can be frequently captured
                                                                    from a number of distinct viewpoints. Famous bridges, like
These features are chosen because of their proven effective-
ness in a range of recognition tasks for both generic objects       the Golden Gate Bridge or the Brooklyn Bridge, are fre-
and specific scenes. The aspects of the visual content that         quently photographed from a few distinct points, such as
they capture have also been shown to be complementary.              the banks on either side of the bridge or while walking
                                                                    across the bridge, looking up at the towers. Similarly, fa-
  • Color. We use grid color moment features [23] to repre-         mous architectural sites, like the San Francisco MOMA or
    sent the spatial color distributions in the images. These       the Guggenheim, are frequently photographed from the out-
    features are calculated by first segmenting the image into      side, showing the facade, and from the inside, showing an
    a 5-by-5 grid of non-overlapping blocks. The first three        inner atrium or skylight. In such cases, the selection of a
    moments of the distributions of the three color channels        single viewpoint to encapsulate the location may be insuf-
    (in LUV color space) within each block are then cal-            ficient. If we are given the chance to present the user with
    culated and retained as a feature vector for the image.         multiple images of the location, repeating images from a
    Using three moments for each of three channels in 25            single most-representative view may be less productive than
    blocks result in a 225-dimensional feature vector.              showing images from a variety of angles.
  • Texture. The texture of the image is represented with              Discovering various classes of images from within a set is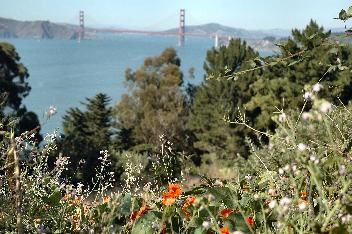
a prime application for clustering. We perform clustering             We count the average number of links per photo in each
using k-means, a standard and straight-forward approach,              cluster and use the result to score the clusters.
using the concatenated color and texture feature vectors,           • Variability in dates. We take the standard deviation
described above, to represent the images. SIFT features are           of the dates that the photos in the cluster were taken.
not used for clustering due to their high dimensionality, but         Preference is given to clusters with higher variability in
are later incorporated for ranking clusters and images.               dates, since this indicates that the view is of persistent
                                                                      interest. Low variability in dates indicates that the pho-
6.4.1    Number of clusters                                           tos in the cluster were taken around the same time and
   In any clustering application, the selection of the right          that the cluster is probably related to an event, rather
number of clusters is important to ensure reasonable clus-            than a geographic feature or landmark. We can also
tering results. While some principled methods do exist for            use the techniques described in Section 5 to filter those
selecting the number of clusters, such as Bayesian Informa-           images from Px that include tags (other than x) that
tion Criterion (BIC), we proceed with using only a simple             correspond to events.
baseline method. Since the number of photos to be clustered           To combine these various cluster scores, we first normalize
for each location varies from a few dozen to a few hundred,        each of the four scores, such that the L1-norm of each of the
it stands to reason that an adaptive approach to the selec-        scores over the clusters is equal to one. Then, we average
tion of the number of clusters is appropriate, so we apply         the four scores to reach a final, combined score.
an approach where the number of clusters is selected such             To select images from clustered results and present them
that the average number of photos in each resulting cluster        to the user for browsing, we rank the representative images
will be around 20. Future work may investigate the effects         within each cluster, PV using the methods described in the
of other strategies for selecting the number of clusters and       following section, so we have a ranking of the most rep-
incorporating geographic cues to seed and guide clustering         resentative images for each cluster. Then, we sample the
towards finding viewpoints.                                        highest-ranking images from the clusters. The clusters are
                                                                   not sampled equally, however. The lowest-ranking clusters
6.4.2    Ranking clusters                                          have no images sampled from them, and the higher-ranking
   Given the results of a clustering algorithm, Vx , we would      clusters have images sampled proportionally to the score of
like to rank the visual clusters according to how well the clus-   the cluster.
ters represent the various views associated with a given tag
or location. This will allow us to sample the top-ranked im-       6.5     Ranking Representative Images
ages from the most representative clusters and return those          Given the visual clusters, Vx and their associated rank-
views to the user when we are generating the set of represen-      ings, in order to generate a set of representative images, Rx ,
tative views, Rx . Lower-ranked clusters can be completely         we further need to rank the images within each cluster, ac-
ignored and hidden from the user, since they are presumed          cording to how well they represent the cluster. To achieve
to contain less-representative photographs. We determine           this, we apply several different types of visual processing
the ranking of the clusters through a combination of four          over the set of images PV to mine the recurrent patterns
different scoring mechanisms, designed to ensure the selec-        associated with each visual cluster V .
tion of strong, useful clusters.
   We use a fusion of the following four cluster scoring meth-     6.5.1    Low-Level Self-Similarity
ods to generate a final ranking of the clusters:                      Perhaps the most straight-forward approach to discover-
 • Number of users. If a large number of photographs               ing and ranking the representative images out of a set is to
   from many different users are found to be visually sim-         find the centroid for the set and rank the images according
   ilar, then it is likely that the cluster V is an important      to their distance from the centroid. We start by joining the
   view angle for the location. We use the number of users,        color and texture features for each image into one long fea-
   |UV | instead of the number of photos |PV | since many          ture vector. We statistically normalize along each dimension
   photos from a single user may bias the results.                 of the vector such that each feature has a mean of zero, and
                                                                   unit standard deviation over all images within the set. The
 • Visual coherence. We measure the intra-cluster dis-             centroid is the point determined by the mean of each feature
   tance, or the average distance between photos within            dimension. The images in the set are then ranked according
   the cluster V and all other photos within the cluster,          to their Euclidean distance from the centroid.
   and the inter-cluster distance, or the average distance
   between photos within the cluster and photos outside of         6.5.2    Low-Level Discriminative Modeling
   the cluster. We take the ratio of inter-cluster distance          One shortcoming of the low-level self-similarity method
   to intra-cluster distance. A high ratio indicates that the      mentioned above is that each example image and each fea-
   cluster is tightly formed and shows a visually coherent         ture dimension is considered to be equally important for cen-
   view, while a low ratio indicates that the cluster is fairly    troid discovery and ranking. While this approach can still be
   noisy and may not be visually coherent.                         quite powerful, recent efforts have suggested that sampling
 • Cluster connectivity. We can use SIFT features to re-           pseudo-negative examples from outside of the initial candi-
   liably establish links between different images which con-      date set and learning light-weight discriminative models can
   tain views of a single location (this process is discussed      actually greatly improve the performance of image ranking
   in greater detail in Section 6.5.3.) If a cluster’s photos      for a number of applications [16, 8, 10]. Intuitively, cen-
   are linked to many other photos in the same cluster, then       troids can be adversely affected by the existence of outliers
   the cluster is likely to be representative. Clusters with       or bi-modal distributions. Similarly, the distances between
   fewer linked images are less likely to be representative.       examples in one dimension may be less meaningful than
Tag-Only Tag-Location Tag-Location-Visual
the distances in another dimension. Learning a discrimi-
1.00
native model against pseudo-negatives can help to alleviate
Precision @ 10
these effects and better localize the prevailing distribution 0.75
of positive examples in feature space and eliminating non- 0.50
discriminative dimensions. In our implementation, we take
0.25
the photos PV from within the candidate set and treat them
as pseudo-positives for learning. We then sample images 0
z
ge
er
g
g
ge
et
rts
a
av a
e
randomly from the global pool, P, and treat these images as
tra
un
in
om
ic
ag
re
w
rid
rid
ea
er
ild
o
ca
yo
er
st
m
itt
am
yb
b
fin
bu
pseudo-negatives. We take the same concatenated and nor-
rd
al
de
te
sf
co
of
ba
ba
rry
ns
ga
ce
m
fe
tra
en
malized feature vector from the previous distance-ranking
la
lo
ld
pa
go
model as the input feature space. We randomly partition
this data into two folds, training a support vector machine
(SVM) classifier [26, 4] with the contents of one fold and Figure 4: Precision at 10 for representative images
then applying the model to the contents of the other fold. selected for locations using various methods.
We repeat the process, switching the training and testing
folds. The images can then be ranked according to their
distance from the SVM decision boundary. ous complementary aspects of the repeated views of the real-
world scenes. To leverage the power of each of the methods,
6.5.3 Point-wise Linking we apply each of them independently and then fuse the re-
sults. Each method effectively returns a score for each of the
The above-mentioned low-level self-similarity and discrim-
images in the set. We normalize the results returned from
inative modeling methods do not make use of the SIFT in-
each method via a logistic normalization and then take the
terest point descriptors that we have extracted. The most
average of the scores resulting from each method to give a
powerful approach for our application, where we are model-
fused score for each image.
ing specific locations to find representative images, is most
The end result of this process is a ranked list of clusters,
likely a matching of images of the same real-world structure
representing different views for each location, from which
or scene through the identification of correspondences be-
the most representative images can be sampled to arrive at
tween interest points in any two given images. Given two
a set of images summarizing the location. This resulting set
images, each with a set of interest points and associated de-
of images is our representative set, Rx .
scriptors, we can use a straight-forward approach to discover
correspondences between interest points. For each interest
point in an image, we can take the Euclidean distance be- 7. EVALUATION
tween it and every interest point in the second image. The The goal of the system is to generate a set of represen-
closest point in the second image is a candidate match for tative images for automatically discovered tagged locations.
the point if the distance between it and the original inter- To evaluate the performance, we use a set of over 110,000
est point is significantly less than the distance between the geo-referenced photos from the San Francisco area. We dis-
second-closest point and the original interest point, by some cover landmark locations via location-based clustering of the
threshold. This matching from points in one image to an- photos, generating 700 clusters (the number was chosen as
other is asymmetric, however, so the process can then be a tradeoff between span of geographic coverage and the ex-
repeated, finding candidate matches for each point in the pected number of photos per cluster). For each location
second image through comparison with each point in the cluster, representative tags are determined by scoring fre-
first image. When a pair of points is found to be a can- quent tags within the cluster. Tags with scores exceeding
didate both through matching the first image against the a threshold, α, are retained as a tag/location pair, (x, C).
second and through matching the second image against the For the purposes of this paper, we evaluate the system using
first, then we can take the candidate match as a set of cor- only a subset of 10 manually selected landmarks (listed in
responding points between the two images. Figure 4), though, in principle the system could be applied
Once these correspondences are determined between points to all of the discovered tag/location pairs. Representative
in various images in the set, we can establish links between images for each location are extracted using three different
images as coming from the same real-world scene when three techniques:
or more point correspondences exist between the two im- • Tag-Only. In the baseline version of representative im-
ages. The result is a graph of connections between images age selection, we choose representative images randomly
in the candidate set based on the existence of corresponding from the set of all images with the corresponding tag.
points between the images. We can then rank the images
according to their rank, or the total number of images to • Tag-Location. In this second baseline, we choose rep-
which they are connected. The intuition behind such an resentative images for a tag randomly from all images
approach is that representative views of a particular loca- that are labeled with the tag and fall within a location
tion or landmark will contain many important points of the cluster where the tag is found to be representative.
structure which can be linked across various images. Non- • Tag-Location-Visual. This is the approach detailed in
representative views (such as extreme close-ups or shots pri- the previous section.
marily of people), on the other hand, will have fewer links We use each of the three above-described methods to ex-
across images. tract ten representative images for each of the ten land-
marks and evaluate the results in terms of precision at 10
6.5.4 Fusion of Ranking Methods (P@10). This metric measures the percentage of the top-ten
The ranking methods described above each capture vari- selected images that are indeed representative of the land-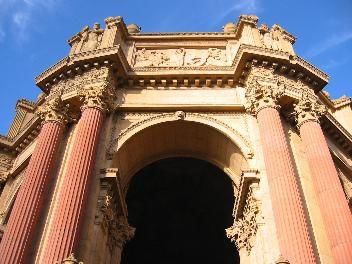
Tag-Location (Baseline)                                       Tag-Location (Baseline)

                       Tag-Location-Vision                                            Tag-Location-Vision

                      (a) Palace of Fine Arts                                       (b) Golden Gate Bridge

Figure 5: Comparison of recommended representative images resulting from the tag-location filtering and
Fixed-size clustering approaches for the Palace of Fine Arts and the Golden Gate Bridge.

mark. The ground-truth judgments of image representative-        tually photographs of the city skyline taken from the ob-
ness are defined manually by human evaluators. If images         servation deck at the top of the tower. Similarly, for mu-
contain views of the location that are recognizable to viewers   seums, such as De Young and SF MOMA, the representative
familiar with the location, then they are marked as repre-       views are defined to be outside views of the building and
sentative, otherwise, they are marked as non-representative.     recognizable internal architectural aspects; however, users
The results of the evaluation are shown in Figure 4.             also like to photograph particular artworks and other non-
   The results show a clear added benefit of location-based      representative views while at museums. The trend across
constraints for the selection of representative images. In the   these failure cases is that some of the frequently-taken pho-
baseline case, the tag-only approach, the P@10 is slightly       tograph views associated with the landmark are not neces-
less than 0.5, on average. This finding confirms many recent     sarily representative of the landmark. It is arguable, and
observations about the accuracy of tags. Constraining the        could be left for human evaluation, whether these images
selection of representative images to come only from images      are desireable for representation of the location. Do users
associated with a tag-location pair (as in the tag-location      wish to see images taken from Coit Tower when they search
approach) yields a 30% increase in the precision of the se-      for that phrase? Do they want to see images from inside the
lected images, which indicates that location information can     De Young?
help refine the representativeness of a set of related images.      A related issue is the fact that precision does not capture
   More striking, though, is the improvement we get with         all of the aspects that could impact the perceived quality
the technique that utilizes the visual analysis (tag-location-   of a set of representative images. For example, the notion
visual). On average, across all of the landmarks, there          of representativeness is not binary. If we compare the top-
is a clear relative increase in precision of more than 45%       left images for each set of results in Figure 5a, it is fair
gained over the tag-location baseline by adding visual fea-      to argue that the visual-based result, which shows the en-
tures. Across most of the locations, the visual-based selec-     tire structure, is more representative than the tag-location
tion of representative images gives perfect P@10 score (all      result, which shows only a close-up. The precision metric
top-ten ranked images are representative). A comparison          does not capture this aspect, since both images are techni-
of the summaries from the best non-visual technique (tag-        cally considered to be representative. Also, repetition in a
location) and the visual technique (tag-location-visual) for     set of images can impact the perceived quality of the sum-
two sample tags is shown in Figure 5.                            mary. Repeated, nearly-identical images will not convey ad-
   For some geographic features, the visual-based methods        ditional information to the viewer, so it may be preferable to
still do not provide perfect precision in the summaries. For     display images from diverse views. These issues of relative
instance, some geographic landmarks can act as a point from      quality of representative images and the diversity of results
which to photograph, rather than the target of the photo;        can be evaluated with human subjects. We leave such an
such photographs are often tagged with the geographic land-      evaluation for future work.
mark which is the source of the photo. For example, Coit
Tower is a frequently-photographed landmark, but many of
the photographs associated with the tag Coit Tower are ac-
                                                                 8.   CONCLUSIONS
                                                                   We have shown how community-contributed collections of
photographs can be mined to successfully extract practical                 context-based concept fusion in video indexing and
knowledge about the world. We have seen how geograph-                      retrieval. In Conference on Image and Video Retrieval,
ical labels and tagging patterns can lead us to summaries                  Amsterdam, 2007.
of important locations and events. We further introduce             [11]   L. Kennedy, S.-F. Chang, and I. Kozintsev. To search or to
                                                                           label?: predicting the performance of search-based
the use of visual analysis in a controlled manner, using the               automatic image classifiers. Proceedings of the 8th ACM
knowledge extracted from tags and locations to constrain                   international workshop on Multimedia information
the visual recognition problem into a more feasible task. We               retrieval, pages 249–258, 2006.
have shown that the use of visual analysis can increase the         [12]   D. Lowe. Distinctive Image Features from Scale-Invariant
precision of automatically-generated summaries of represen-                Keypoints. International Journal of Computer Vision,
tative views of locations by more than 45% over approaches                 60(2):91–110, 2004.
in the absence of visual content. All of these benefits are         [13]   B. Manjunath and W. Ma. Texture features for browsing
                                                                           and retrieval of image data. Pattern Analysis and Machine
observed despite the fact that the user-provided labels in                 Intelligence, IEEE Transactions on, 18(8):837–842, 1996.
such collections are highly noisy.                                  [14]   M. Naaman, A. Paepcke, and H. Garcia-Molina. From
   In future work, we plan to further explore the impact                   where to what: Metadata sharing for digital photographs
of visual content on retrieval and summarization of geo-                   with geographic coordinates. In 10th International
referenced photographs. In particular, we will investigate                 Conference on Cooperative Information Systems (CoopIS),
the perceived quality of a wider variety of approaches to                  2003.
discovering and presenting related views for a single land-         [15]   M. Naaman, Y. J. Song, A. Paepcke, and
                                                                           H. Garcia-Molina. Automatic organization for digital
mark. Beyond that, we will examine whether visual analysis
                                                                           photographs with geographic coordinates. In Proceedings of
can help in the discovery of meaningful locations and tags,                the Fourth ACM/IEEE-CS Joint Conference on Digital
perhaps by eliminating geographical clusters that are too vi-              Libraries, 2004.
sually diverse to be a single landmark, or by using visual di-      [16]   A. Natsev, M. Naphade, and J. Tešić. Learning the
versity as part of the criteria used in distinguishing between             semantics of multimedia queries and concepts from a small
landmark- and event-oriented tags. We will also explore au-                number of examples. Proceedings of the 13th annual ACM
tomatically tagging photographs or suggesting tags to the                  international conference on Multimedia, pages 598–607,
                                                                           2005.
user based on the visual content of the image, a difficult
                                                                    [17]   N. O’Hare, C. Gurrin, G. J. Jones, and A. F. Smeaton.
task to perform based on visual content alone, but one that                Combination of content analysis and context features for
can be simplified with contextual and geographical cues.                   digital photograph retrieval. In 2nd IEE European
                                                                           Workshop on the Integration of Knowledge, Semantic and
9.   REFERENCES                                                            Digital Media Technologies, 2005.
                                                                    [18]   A. Pigeau and M. Gelgon. Organizing a personal image
 [1] S. Ahern, M. Naaman, R. Nair, and J. Yang. World                      collection with statistical model-based ICL clustering on
     explorer: Visualizing aggregate data from unstructured text           spatio-temporal camera phone meta-data. Journal of
     in geo-referenced collections. In Proceedings of the Seventh          Visual Communication and Image Representation,
     ACM/IEEE-CS Joint Conference on Digital Libraries.                    15(3):425–445, September 2004.
     ACM Press, June 2007.                                          [19]   T. Rattenbury, N. Good, and M. Naaman. Towards
 [2] M. Ames and M. Naaman. Why we tag: Motivations for                    automatic extraction of event and place semantics from
     annotation in mobile and online media. In CHI ’07:                    flickr tags. In Proceedings of the Thirtieth International
     Proceedings of the SIGCHI conference on Human Factors                 ACM SIGIR Conference. ACM Press, July 2007.
     in computing systems, New York, NY, USA, 2007. ACM             [20]   R. Sarvas, E. Herrarte, A. Wilhelm, and M. Davis.
     Press.                                                                Metadata creation system for mobile images. In Proceedings
 [3] T. L. Berg and D. A. Forsyth. Automatic ranking of iconic             of the 2nd international conference on Mobile systems,
     images. Technical report, U.C. Berkeley, January 2007.                applications, and services, pages 36–48. ACM Press, 2004.
 [4] C.-C. Chang and C.-J. Lin. LIBSVM: a library for support       [21]   A. W. M. Smeulders, M. Worring, S. Santini, A. Gupta,
     vector machines, 2001. Software available at                          and R. Jain. Content-based image retrieval at the end of
     http://www.csie.ntu.edu.tw/˜cjlin/libsvm.                             the early years. IEEE Trans. Pattern Anal. Mach. Intell.,
 [5] M. Davis, M. Smith, F. Stentiford, A. Bambidele, J. Canny,            22(12):1349–1380, 2000.
     N. Good, S. King, and R. Janakiraman. Using context and        [22]   N. Snavely, S. Seitz, and R. Szeliski. Photo tourism:
     similarity for face and location identification. In                   exploring photo collections in 3D. ACM Transactions on
     Proceedings of the IS&T/SPIE 18th Annual Symposium on                 Graphics (TOG), 25(3):835–846, 2006.
     Electronic Imaging Science and Technology, 2006.               [23]   M. Stricker and M. Orengo. Similarity of color images.
 [6] M. Dubinko, R. Kumar, J. Magnani, J. Novak,                           Proc. SPIE Storage and Retrieval for Image and Video
     P. Raghavan, and A. Tomkins. Visualizing tags over time.              Databases, 2420:381–392, 1995.
     In WWW ’06: Proceedings of the 15th international              [24]   K. Toyama, R. Logan, and A. Roseway. Geographic
     conference on World Wide Web, pages 193–202, New York,                location tags on digital images. In Proceedings of the 11th
     NY, USA, 2006. ACM Press.                                             International Conference on Multimedia (MM2003), pages
 [7] R. Fergus, P. Perona, and A. Zisserman. A visual category             156–166. ACM Press, 2003.
     filter for Google images. Proc. ECCV, pages 242–256, 2004.     [25]   C.-M. Tsai, A. Qamra, and E. Chang. Extent: Inferring
 [8] W. Hsu, L. Kennedy, and S.-F. Chang. Video search                     image metadata from context and content. In IEEE
     reranking via information bottleneck principle. In ACM                International Conference on Multimedia and Expo. IEEE,
     Multimedia, Santa Babara, CA, USA, 2006.                              2005.
 [9] A. Jaffe, M. Naaman, T. Tassa, and M. Davis. Generating        [26]   V. Vapnik. The Nature of Statistical Learning Theory.
     summaries and visualization for large collections of                  Springer, 2000.
     geo-referenced photographs. In MIR ’06: Proceedings of the     [27]   Y. Wu, E. Y. Chang, and B. L. Tseng. Multimodal
     8th ACM international workshop on Multimedia                          metadata fusion using causal strength. In Proceedings of the
     information retrieval, pages 89–98, New York, NY, USA,                13th International Conference on Multimedia (MM2005),
     2006. ACM Press.                                                      pages 872–881, New York, NY, USA, 2005. ACM Press.
[10] L. Kennedy and S.-F. Chang. A reranking approach for
You can also read