Hele mai maui Factbook - Long-Range Transportation Plan 2040 - Maui Metropolitan Planning Organization
←
→
Page content transcription
If your browser does not render page correctly, please read the page content below

hele mai maui
      hele mai maui
       Long-Range Transportation Plan 2040

Long-Range Transportation Plan 2040

         Factbook
             DECEMBER 2018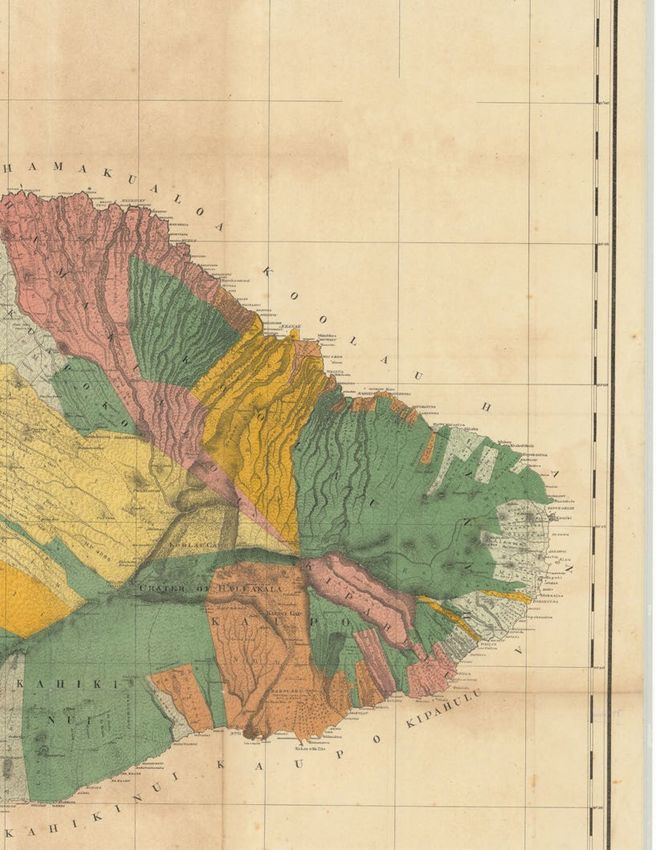
Maui MPO Long-Range Transportation Plan
         Long Range Transportation Plan

    PART ONE

    What is

    hele
     mai
     maui ?
    Hele Mai Maui is a 20-year plan that will identify safe and comfortable
    transportation options, services, and infrastructure for people of all ages
    and abilities.

    Why Hele Mai Maui?
    Maui is growing, creating challenges for our current transportation system.
    Our population is also changing—the number of older adults is growing, and
    young people are driving less than their parents. Hele Mai Maui is the long-
    range transportation plan for the island of Maui, a key federal requirement
    carried out by the Maui Metropolitan Planning Organization (MPO). Hele Mai
    Maui will prioritize transportation projects to receive limited funds.

2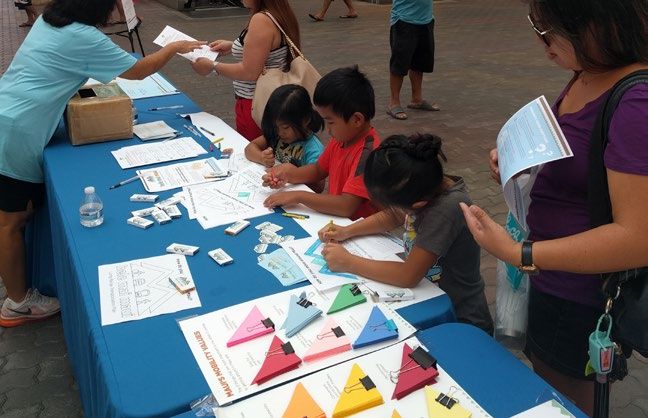
Hele Mai Maui Factbook 2018

     The Planning                           Who is the
     Process on Maui                        Maui MPO?
                                            Hele Mai Maui is led by
                                            the Maui Metropolitan
                   STATEWIDE                Planning Organization
              TRANSPORTATION PLAN           (MPO). The MPO was
 PLANNING

                                            formed in 2016 by Federal
                 Policy                     requirements to develop
                 Goals & Objectives         plans and programs for a
                 All Transportation Modes   multimodal transportation
                                            system. The formation of
                                            the MPO was triggered
                                            when the urbanized area
              MAUI GENERAL PLAN &           of Kahului, Wailuku, and
               COMMUNITY PLANS              Pā‘ia exceeded 50,000
                                            residents. The role of the
                                            MPO is:

               HELE MAI MAUI 2040           COLLABORATION
DEVELOPMENT

                 Project Definition         To facilitate regional and
  PROGRAM

                 Project Prioritization     local surface transportation
                 Implementation Plan        planning by serving as a
                                            forum for collaboration
                                            among local communities
                                            and government agencies.
                MID-RANGE PLAN
                 8-10 Year Program Plan
                 Expenditure Plan

                                                   FUNDING
                                            To direct federal funds
                                            toward projects that
                                            increase access to
                      BUDGET                opportunity and prosperity,
MANAGEMENT

                                            while promoting the health
                 Capital Improvement Plan
                                            and wellness of Maui’s
  PROJECT

                 Operations & Maintenance   people and environment
                 STIP/TIP                   through improved
                                            multimodal pedestrian,
                                            bicycle, and transit options
              PROJECT DEVELOPMENT
                 Environmental              To learn more about the MPO,
                 Preliminary Engineering    go to www.mauimpo.org
                 Design & Construction

                                                                           3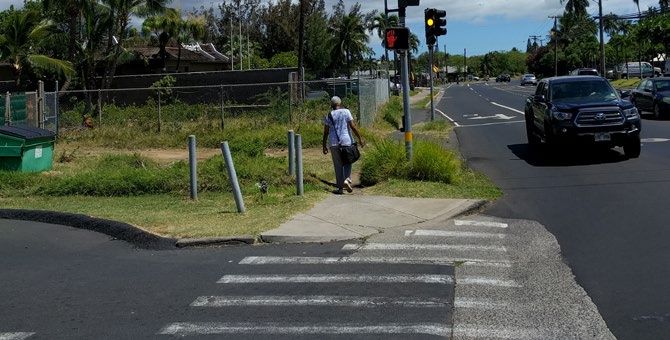
Maui MPO Long-Range Transportation Plan
         Long Range Transportation Plan

    Hele Mai Maui Process
    Hele Mai Maui will develop a vision for our transportation needs and opportunities
    over the next 20 years to ensure that our communities are connected by a safe,
    efficient, and sustainable transportation system. The project team—made up
    of County staff and consultants—will be engaging with the community at key
    milestones.

                                     KEY PUBLIC INPUT
                                     POINT

     MAY         JUN          JUL         AUG       SEP         OCT         NOV          DEC
     2018
    Project           Community Values                  Maui Fact             Evaluation
    Project
    Launch             Community
                       & Opportunities                   Book
                                                    Factbook               Evaluation
                                                                             Framework

    Launch              Values &                    This document
                                                                           Framework
    We kicked off       Opportunities               presents a look
                                                                           We will develop
                                                    at the emerging
    in May 2018                                                            an evaluation
                        We will gather public       trends in
    by developing                                                          framework to
                        input about what is most    transportation; a
    an overall                                                             prioritize projects
                        important when it comes     look at who lives,
    project brand                                                          and programs
                        to getting around Maui.     works, and visits
    and website,                                                           using input
                                                    Maui; how people
    forming our                                                            gathered from the
                                                    move around
    Community                                                              community and
                                                    Maui today; and
    Think Tank,                                                            past plans and
                                                    a summary of
    and holding                                                            processes.
                                                    key issues and
    meetings
                                                    opportunities to
    with key
                                                    focus the next
    stakeholders.
                                                    phase of work.

4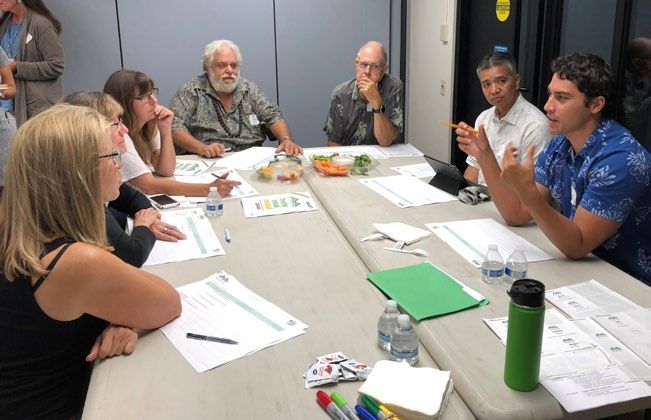
Hele Mai Maui Factbook 2018

         KEY PUBLIC INPUT                               KEY PUBLIC INPUT
         POINT                                          POINT

JAN          FEB       MAR         APR        MAY         JUN          JUL
      2019
                                              Funding Options      Final Long-Range
Call for Projects      Project & Program        & Draft Plan        Transportation
Call   for
  & Programs
                         Project    &
                         Prioritization       Funding
                                                 for Review        Final Plan
                                                                          Long-Range
Projects &              Program               Options &            Transportation
Programs                Prioritization        Draft Plan           Plan
In partnership with     Using public input    For the final        Hele Mai Maui will include
the community,          and data, we will     list of projects     a final list of projects
we will identify        prioritize projects   and programs,        and programs, along
bicycle, pedestrian,    and programs to       we’ll identify       with metrics to monitor
transit, auto, and      support people        funding options      performance.
programmatic            traveling around      and financial
improvements            the island.           recommendations
to help make it                               for getting it all
easier and safer to                           done.
connect to jobs,
schools, and family
and friends.

                                                                                            5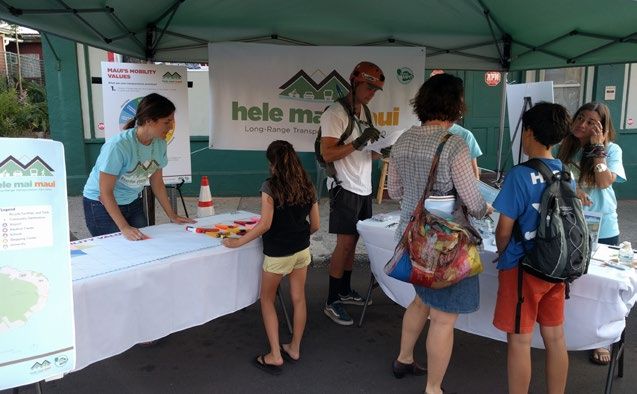
Maui MPO Long-Range Transportation Plan
         Long Range Transportation Plan

    Who Guides Our Work?
    Community Think Tank                                            WHAT
                                                                    WE’VE
    The Community Think Tank is an 18-member committee
    comprised of residents of all ages and geographies across

                                                                    HEARD
    the island. Think Tank members include students, teachers,
    advocates, and industry representatives. A full list of
    members can be found on the Hele Mai Maui website. The
    Think Tank will help identify key issues and opportunities,
    prioritize projects, and serve as an important sounding
                                                                    SO FAR:
    board for the project team throughout the development of
    Hele Mai Maui.

    Technical Advisory Committee
    The MPO’s Technical Advisory Committee (TAC) is a
    standing committee that provides input and technical
    advice to the Maui MPO Policy Board. It includes staff           Our roads are
    representatives from County of Maui Department of
    Planning, County of Maui Department of Public Works,             eroding and
    County of Maui Department of Transportation, and the             ocean water
    State of Hawai‘i Department of Transportation. The TAC will      sometimes
    provide technical guidance and oversight as Hele Mai Maui is     covers the
    developed, reviewing the plan before it is adopted.
                                                                     highway.

    Policy Board
    The Maui MPO Policy Board is another standing MPO
    committee that includes elected officials and department
    leaders. Members include the County of Maui Department
    of Planning Director, County of Maui Department of
    Transportation Director, County Department of Public Works
    Director, three Maui County Council members, and the State
    of Hawai‘i Department of Transportation Director. In 2019,
    two state legislators will join the Policy Board. The Policy
    Board will review progress as Hele Mai Maui is developed
    and will approve the final plan.                               Guiding
                                                                   Principles for
    You!
    Hele Mai Maui includes many opportunities to provide input
                                                                   Hele Mai Maui
    along the way. Sign up for updates on the project website
    and check back frequently to see where and how you can
    get involved: https://mauimpo.org/hele-mai-maui-2040

6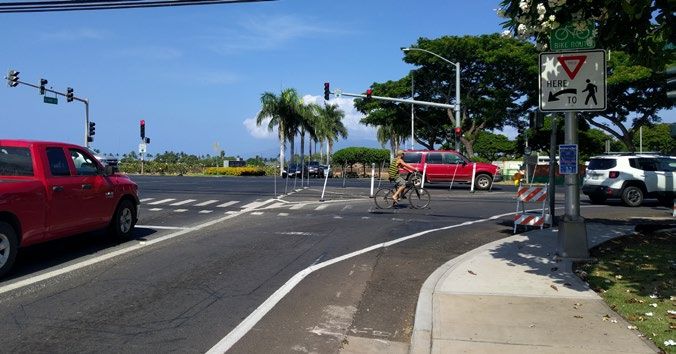
Hele Mai Maui Factbook 2018

                        We need
                        alternate routes
                        from Lahaina to                     We need safer walkways
                        Wailuku and                         in our community,
                        Kahului.                            especially near schools
                                                            and parks.
I love
taking the
bus, but
we need                                                                                Separate
more                                                                                   places
                      There need to be
stops and                                                   I wish people              for bikes
                      better options for
better                                                      would slow                 and cars
                      tourists so they don't
shelters.                                                   down and                   would
                      all rent cars at the                                             be best.
                                                            obey traffic
                      airport.
                                                            laws.

                                                                                    PERFORMANCE
PARTNERSHIPS           EQUITY            RESILIENCE             LAND USE              MEASURES
Include partner     Involve             Consider impacts     Link transportation   Apply performance
agencies and        underrepresented    of climate change    conversations to      measures to project
departments to      communities in      on transportation    how communities       funding decisions
ensure that plans   the process to      infrastructure.      are built.            to ensure effective
reflect diverse     ensure all voices                                              progress toward
needs.              are heard.                                                     community-wide
                                                                                   goals.

                                                                                                         7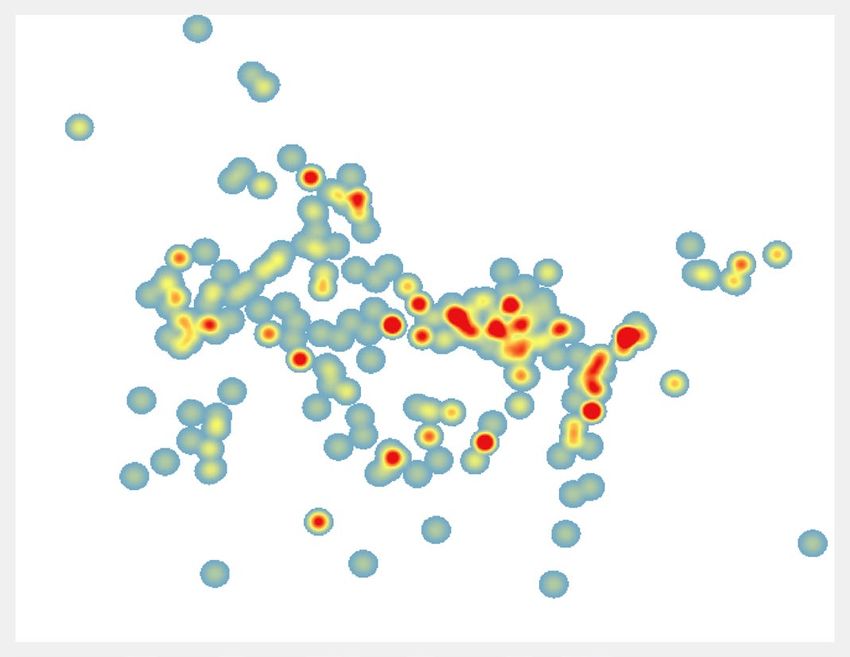
Maui MPO Long-Range
         Long Range Transportation
                    Transportation Plan
                                   Plan

    PART TWO

    Maui’s
     Past
      As we begin to think about ways to make it
      easier for people to move around the island,
      both today and in 20 years, it’s important to first
      take a step back to understand the history of
      transportation on Maui and the plans that have
      shaped Maui into the place it is today. At the
      same time, we must look ahead to the emerging
      trends in transportation that will help to shape
      future mobility on Maui, including changes to our
      population and new technologies.

8
Hele Mai Maui Factbook 2018

A Rich History                                      Did you know?
From the first Polynesian settlers to the growth
of the sugar plantations in the 1800s, Maui has      Many of the island’s
a rich history that shaped its transportation        primary roads
network. Pi‘ilani, ruling chief of Maui in the       have their roots in
1600s, created Ke Ala Loa—the first trail to         pathways used by
encircle an entire Hawaiian island.                  Native Hawaiians.
                                                     Others were
The island’s first “modern” transportation           developed as part of
system—the railroad—was built to accommodate         the sugar industry,
the growing sugar industry. But the railroad         although many are no
closed in the 1950s, leaving the island dependent    longer in use today.
on air, ocean, and local roads to transport a
growing number of people and goods. The
closure of HC&S sugar cane operations in 2016        Maui’s communities
affected 32,000 acres of agricultural land.          are as diverse as its
Coordinated land use planning is more important      landscapes, with
than ever.                                           communities that
                                                     are more central
                                                     and urban having
                                                     very different needs
                                                     than those in more
                                                     rural areas or along
                                                     the coasts. For
                                                     example, in Wailuku
                                                     and Kahului, traffic
                                                     congestion is a
                                                     challenge, while in
                                                     Kīhei, pedestrian
                                                     safety is a bigger
                                                     issue.

                                                     While some Maui
                                                     residents speak only
                                                     English, almost half
                                                     (46%) speak a second
                                                     language. More than
                                                     a third (36%) of those
                                                     living on Maui speak a
                                                     native Asian or Pacific
                                                     Islander language.

                                                                               9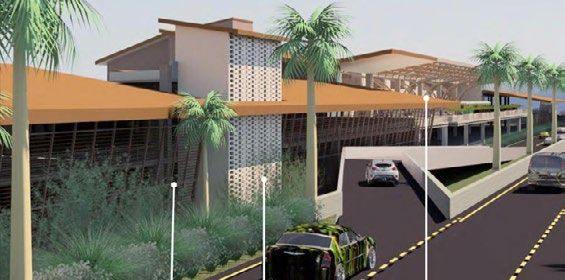
Maui MPO Long-Range
         Long Range Transportation
                    Transportation Plan
                                   Plan

     A Strong Planning
     Foundation
     Maui has a strong history of plans that highlight the community’s commitment to the
     environment, protection of natural resources, respect for diversity, and access for
     all. These planning processes (described in the first section of the Factbook) have
     tackled the complex and varied needs of different parts of the island: from rural to
     more urban and from Upcountry to coastal. Hele Mai Maui will build on these past
     plans as we develop a vision for moving people around Maui in the years to come.

     7 Plans
            6 Key Themes
            6 Legacy Projects

10
Hele Mai Maui Factbook 2018
The 6 Key Environment Economy
Themes Protection of the island’s
natural environment is at
Transportation plays
a large role in Maui’s
the forefront of nearly all economic growth. Tourism
of Maui’s past plans. is a significant contributor
to the local economy but
also presents challenges
Connections for transportation.
Past plans
emphasize
transportation
Multimodal
as a service Systems
for the
community Maui’s previous plans
that should support a diverse range
connect of transportation options,
all people and Maui strives to build
to jobs, an integrated multimodal
destinations, transportation system.
and other key Plans and policies call for
locations on the reducing the numbers
island. of people driving alone
by providing new modes
of transportation and
improving the existing
network.
Culture
Native Hawaiian culture
and history must
be respected when
planning and designing
transportation projects.
Safety
Preserving sites of Safety is one of the
importance, including top priorities for Maui
burial grounds, requires residents, regardless of
careful study and how people travel, and is
consultation. mentioned in the majority
of past plans.
11Maui MPO Long-Range
Long Range Transportation
Transportation Plan
Plan
The 6 Legacy Projects
Along with a strong history of planning on Maui, there are a number of
transportation projects that have been identified as priorities over the years.
While this long-range plan won’t necessarily solve every one of these major
transportation issues or identify funding to complete all the legacy projects,
the work we do as part of Hele Mai Maui can help to build on the initial ideas
that have emerged from many community discussions.
A West Maui
Greenway Kapalua
The West Maui
Greenway is a
proposed multi-
use trail that would Ka‘anapali
connect Olowalu and A
Lāhaina. The 25-
mile trail would use B
abandoned cane haul West Maui
Pā
roads and a railroad Lāhaina Forest Reserve C D
right-of-way to create
a recreational trail Kahului
connecting people to
destinations between
Ukumehame and
Lipoa Point. The
first phase will
Olowalu E
connect people
from Ka`anapali to
Lāhaina.
Kīhei
B Lāhaina Bypass
F
The most recent phase of the Lāhaina Bypass was completed
and opened to the public in April 2018. It includes the following
improvements:
A new 2.7-mile road between Hokiokio Place and Honoapi‘ilani
Highway
Intersection improvements at Hokiokio Place and Kai Hele Ku Street
A new bridge over the future Punakea Loop
Two detention basins and drainage structures
A connection to Honoapi‘ilani Highway (Hwy 30), including a new South
Connector Road
The next phase (shown on the map) will extend the bypass north to
Ka‘anapali.
12Hele Mai Maui Factbook 2018
C North Shore Greenway
The North Shore Greenway is a 1.7-mile path accessible from Kanahā Beach
Park or the Kaunoa Senior Center. The next phase of the project will fill in the
gap between Ulupua Place and Baldwin Park, allowing people to ride or walk
continuously from Kanahā Beach Park to Pā‘ia.
D Pā‘ia Relief Route
This project aims to alleviate congestion, accommodate future travel demand,
and improve access and safety through widening of the Hāna Highway and/or
constructing a new highway. One possible route for the project is currently in the
environmental review phase.
E Honoapi‘ilani Highway
The Hawai‘i Department of Transportation (HDOT) has several
active projects along the Honoapi‘ilani Highway:
ā‘ia
Jun 2018 - A second turn lane at the Kapunakea and Keawe
Street intersections
Aug 2018 - Resurfacing between Puamana Beach Park to
Aholo Road
Sept 2018 - Safety enhancements (rumble strips, pavement
markings, signs) from Kapoli Street to Papalaua
Beach Park and Ukumehame to Olowalu
Dec 2018 - Feasibility study of alternatives for realignment
of critically vulnerable section of highway from
mile marker 13.5-14.5 just south of Olowalu
Jan 2019 - Upgraded traffic signals along the corridor
The Pali to Puamana Parkway Plan outlines the vision to move
the highway inland to improve safety and resilience to sea
level rise, while protecting public open space and parks along
Kahikinui the shoreline.
Forest Reserve
F Kīhei North-South Collector
Kīhei ’s North-South Collector road will bring much
needed connectivity to the community. With a projected
right-of-way of 60 feet, the new road will provide
dedicated pedestrian and bicycle facilities to make it safer
for everyone to use the road.
13Maui MPO Long-Range Transportation Plan
A Look Ahead...
The transportation landscape is changing daily. New technologies are making it easier
for people to connect to transportation options, and people are demanding new travel
choices. Hele Mai Maui will consider the influence of these trends—and the ways that Maui
can help to shape them—throughout the planning process.
Technology Shared
Mobility
New technology is
changing the ways people Shared mobility options
connect, how information is provide new ways for people
shared, and what services to get around without
are offered. Real-time travel owning a vehicle. Car share
information available via and bike share systems make
smart phone helps people vehicles and bicycles readily
make travel decisions at available and accessible
a moment’s notice. Apps via smartphone; rideshare
connect people to new services support carpooling;
services and improve the shuttles connect people to
experience of using current transit or destinations; and
services, such as riding the ridehailing services, like
bus. Uber and Lyft, expand upon
traditional taxi services.
Autonomous
Vehicles
The potential benefits of
automation—such as improved
safety, increased mobility, and
maximized efficiency—may be
just around the corner. However,
Maui must be prepared to
address potential challenges,
including safety, integration with
existing systems, and increasing
congestion.
14Hele Mai Maui Factbook 2018
Tourism Demographics
The local economy relies Today, people 65 and older make up
heavily on tourism, which approximately 17% of the state’s population; the
accounts for 39% of the same group is expected to be nearly a quarter
gross county product, of the population by 2040. The growth in older
75% of all private sector adults may be even greater on Maui, where 22%
jobs, and $3 billion in of the population is already at least 60 years
annual visitor spending. old. This points to a need for a transportation
Despite shuttle bus system that safely serves people of all ages and
service to many of the abilities with a variety of travel options.
resort areas today, visitors
22% 22%
often rely on rental
cars to get around the
island, increasing traffic 15%
13% 13%
congestion. 18 to 20 11%
17 & Under
60 & Over
40 to 49
50 to 59
30 to 39
Tourism 3% 21 to 29
accounts for
39%
Source: 2016 ACS Census Data (5-Year)
of the gross
county Resilience
product
The threat of global sea levels rising as much
as 3.2 feet by 2060 could lead to $3.2 billion in
economic loss (due to structure and land loss),
1,600 displaced homes, 3,130 flooded acres, and
11.2 miles of flooded major roadways on Maui.
Damage to major utilities would have significant
impacts on our communities and the economy,
further limiting mobility on the island.
11.2 Miles
of flooded major roadways
by 2060
Source: Hawai‘i Climate Change Mitigation and Adaptation Commission. 2017.
Hawai‘i Sea Level Rise Vulnerability and Adaptation Report.
15Maui MPO Long-Range
Long Range Transportation
Transportation Plan
Plan
75,136
187,814
60,847
Who
200K
PART THREE
154,675
150K
By 2040, there will
We Are
100K
be 33,000 more
people living on Maui.
50K
2000
2040
2010
1990
1980
2016
1960
1970
2018
0 Maui is a diverse island that has seen significant growth in the last 50 years.
With that growth and diversity comes opportunities and challenges Residents
for Visitors
the people that live, work, and visit the island. Hele Mai Maui will identify
investments and improvements that help all people connect to home, school,
work, and Maui’s beautiful natural areas.
Maui by the Numbers
154K
Total Island
61K
Total Daily
2.97
Average
$769K
Median
Population Visitors * Household Size Selling Price**
66K 58%
Units Owner
42%
Units Renter
Total Housing
Units Occupied Occupied
Source (unless otherwise noted below): 2016 ACS Census Data (5-Year) and State of Hawaii Department of Business, Economic Development, and
Tourism. (2018). Population and Economic Projections for the State of Hawaii to 2045.
*Source: 2017 Hawaii Data Book
**Source: Mayor’s Office of Economic Development Maui County (Aug 30, 2018)
16Hele Mai Maui Factbook 2018
How many people live on Maui?
Maui’s population has grown quickly since 1960
from 35,000 residents to over 150,000 residents Maui will grow at an
in 2016. On an average day in 2018, about 61,000 average rate of
0.86%
visitors are on the island, resulting in an average daily
population of 215,000 people. The number of visitors
varies throughout the year, as does the number of
residents, many of whom are seasonal. per year
Moving forward, predictions indicate that both
population and visitor rates will continue to rise,
but at a significantly slower rate. Between 2018 and
2040, population will grow at an average rate of
0.86% per year in Maui County—a far cry from the
33.5% average annual growth rate between 1960 and
2010. The number of visitors is also projected to grow
at a rate of 1.7% to 2.7% until 2040.
Did You Know?
75,136
187,814
200K 60,847
154,675
150K
100K By 2040, there will
be 33,000 more
people living on Maui.
50K
*
2000
2040
2010
1990
1980
2016
1960
1970
2018
0
Residents Visitors
Source: 2016 ACS Census Data (5-Year) and State of Hawaii Department of Business, Economic Development, and Tourism.
(2018). Population and Economic Projections for the State of Hawaii to 2045.
*Visitor data not available for 1960 (visitor census data available from 1965).
17
154K 61K 2.97 $769KMaui MPO Long-Range
Long Range Transportation
Transportation Plan
Plan
Where Do People
Live & Work?
Kapalua
Nāpili-Honokowai
People and jobs on Maui
are concentrated in a
handful of areas. The
darker areas on the map Ka‘anapali
show parts of the island Waihe‘e-Wai‘ehu
with more housing or more
jobs. The darkest brown West Maui
Forest Reserve
areas are those with a mix
of many homes and many
jobs. Lāhaina Kahul
Wailuku
Communities such as Launiupoko
Ka‘anapali in West Maui, Kīhei Waikapū
and Wailea in South Maui, Olowalu
and Kahului in Central Maui
have higher employment Ma‘alaea
density due to jobs at the
resorts and the industrial
area around the airport.
Kīhe
Ha‘ikū-Pauwela and Waihe‘e-
Waiehu are areas with high Population / Employment
concentrations of residents.
Density Matrix
(by Census Block Group, 2016)
Makawao, Kīhei, and much of
Central Maui have a dense mix of
Wa
61
Population Density
persons per acre
people living and working though
13
many people may commute in
and out.
6
0
High concentrations of jobs and/or 0 2 12 228
residents are relatively spread out, Employment Density Mak
resulting in a need for infrastructure jobs per acre
and services to connect people
across the island.
18Hele Mai Maui Factbook 2018
Did You Know?
Jobs on
Nearly a third of Maui’s
26%
jobs are related to
accommodations and food
Maui by
Industry
33%
service, reflecting the
importance of tourism to the
island’s economy. Other job
sectors include real estate,
5%
manufacturing, educational
services, and agriculture. 6% 15%
7%
Ha‘ikū-Pa‘uwela 8%
Pā‘ia
Accommodation Health & Social Services
& Food Services
Administration & Support,
Retail Trade Waste Management
& Remediation
lui
Hāli‘imaile
Construction
Transportation
& Warehousing
Makawao Other
Source: 2016 ACS Census Data (5-Year)
Olinda
Pukalani
Ko‘olau
Forest Reserve
Kula Hāna
ei
Haleakalā Hāna
National Park Forest Reserve
Keokea
ailea Kahikinui
Forest Reserve
kena
19Maui MPO Long-Range Transportation Plan
Focusing on Equity
Equity is an important Kapalua
tool to analyze people’s
access to transportation Nāpili-Honokowai
and to plan future
investments. Planning
within an equity framework
empowers decision- Ka‘anapali
makers to invest in places Waihe‘e-Wai‘ehu
where transportation
projects and programs West Maui
Forest Reserve
can support historically
underrepresented
Lāhaina Kahul
communities that may Wailuku
have fewer transportation
options. Launiupoko
Waikapū
Communities identified
in darker shades of Olowalu
green may have a higher Ma‘alaea
reliance on non-auto
forms of transportation
and are likely to benefit
the most from multimodal 24% Kīhe
investments in the
transportation system. Race/Ethnicity 39%
of Maui Residents
The transportation
equity index is based on 9%
Nearly two-
combined densities of thirds of Maui’s
people below 200% of population is non- Wa
the federal poverty level, 24% white, 28%
including
adults aged 65 and over, many people of
39% Native Hawaiian or
youth between the ages
Asian descent.
of 10 to 17, households 9% Race/Ethnicity
without access to a vehicle,
White
people with a disability, Asian Mak
people with limited English 28% Native Hawaiian
or Pacific Islander
proficiency, and people Two or More
who self-identify as not
white/Caucasian. Race/Ethnicity
White
Asian
Native Hawaiian
or Pacific Islander
Two or More
20Hele Mai Maui Factbook 2018
Did You Know?
10% 11% 5% 6%
of Maui residents
of residents live of households of homes do not
below the rely on have access to are unemployed
poverty line food stamps a vehicle (about 1% higher
($13,370) than national rates)
Pā‘ia
Ha‘ikū-Pa‘uwela
22% 22%
of the population of the population
is over is under
60 years old 17 years old
lui
Hāli‘imaile
Source: 2016 ACS Census Data (5-Year)
Makawao
Olinda
Pukalani
Ko‘olau
Forest Reserve
Kula Hāna
ei
Haleakalā Hāna
National Park Forest Reserve
Keokea
ailea Kahikinui
Forest Reserve
Transportation Equity
Index
(by Census Block Group, 2016)
kena
Darker green areas are those where
focusing on equity is critical and
where people may have a greater
reliance on non-auto transportation.
21Maui MPO Long-Range Transportation Plan
Long Range Transportation Plan
PART FOUR
How We Get
Around
The past plans and future transportation trends described earlier in the Factbook
are an important piece of Maui’s mobility story. The way people get around
today—and the ways they want to move in the future—point to opportunities
for Hele Mai Maui to guide the next 20 years of transportation on the island.
This section looks at who drives, walks, bikes, and takes the bus on Maui today,
focusing on the places people need to go and the connections they are making.
Getting to Work on Maui
72%
drive alone
2%
increase in
to work. the number
of people
People who work on Maui
mostly drive alone to work.
14%
share rides
driving
alone to
work since
2013.
Source: 2016 ACS Census Data (5-Year)
to work.
22Hele Mai Maui Factbook 2018
Commute by Mode 14% 6%
72% Carpool Work from
& Vanpool Home
Drive
Alone
3% 3%
Source: 2016 ACS Census Data (5-Year) Walk Bus
1%Maui MPO Long-Range Transportation Plan
Long Range Transportation Plan
Transit on Maui
Maui Bus has provided transit service to move people around the island since
2009. Understanding how existing service operates is important for identifying
ways to make the bus easier for everyone to use. In July 2018, for example, Maui
Bus launched the new Kula Islander and Waihe‘e Villager services to bring transit
to new areas. New buses and real-time information available on the Maui Bus app
also make it easier than ever to ride the bus on Maui.
13 Maui Bus Routes
help move people across the island seven days a week, including the
new Kula Islander and Waihe‘e Villager routes.
4 Commuter Buses
help get people to work on Maui. There are often long lines of people waiting
for the commuter buses, suggesting a need for more of these services.
Several Private Shuttles
transport visitors between airports and hotels, on tours and sightseeing
trips, and to shopping centers.
1 Key Transit Hub
connects most routes at the Queen Ka‘ahumanu Shopping
Center in Kahului. Maui Bus staff are on hand to help
people transfer between routes. A new transit hub is 2M
planned for Vevau Street in 2020.
1.9M
2009 2010
24Hele Mai Maui Factbook 2018
Annual Ridership by Route
(May 2017- April 2018)
The West Maui Islander, West Maui Islander 371,000
Kīhei Islander, Lāhaina Kīhei Islander 283,000
Islander, Wailuku Loop, Lāhaina Islander 259,000
and Kahului Loop Wailuku Loop* 228,000
routes have the highest Kahului Loop* 217,000
ridership. These routes Upcountry Islander 98,000
also serve areas with Hai‘kū Islander 92,000
the highest population Lāhaina Villager 86,000
and job density. Kīhei Villager 63,000
* Accounts for both
Kula Villager 18,000 clockwise and
reverse routes
Ka‘anapali Islander 15,000
Source: Maui Bus Data (2017-2018)
*Accounts for both clockwise and reverse routes
Maui Bus ridership
peaked in 2012 with
2.4M
26%
Ridership dropped
annual riders
2.3M between 2012 and 2017
2.2M
2.18M
2.1M
1.9M
1.8M
The reduction in transit ridership
is consistent with national trends caused by
factors such as low gas prices, new mobility options,
and strong economic growth. However, Maui's 26% drop in
ridership is a much higher percentage than experienced in many communities.
2011 2012 2013 2014 2015 2016 2017
Source: Maui Bus Data (2017-2018)
25Maui MPO Long-Range Transportation Plan
Long Range Transportation Plan
Walking on Maui
Each day, people walk, roll, or use mobility devices like wheelchairs to move on Maui.
Whether getting to the bus stop, to their parked car, or within their community,
people should feel safe and comfortable getting around Maui.
Providing safe places to walk on Maui requires careful consideration of and respect
for the natural and rural context of the island. While sidewalks are not needed along
every major highway in Maui—especially longer-distance connections between
towns—providing safe places to walk to schools, community centers, and other local
destinations is critical. In more rural areas, creative design approaches can be used,
such as crushed gravel paths away from the side of the road, to avoid disrupting the
natural environment.
Existing pedestrian infrastructure in Kīhei, Wailuku, Pā‘ia, and Lāhaina (clockwise from top left).
Sidewalks or trails and well-marked crossings were noted as the two items most needed to make
walking better on Maui by survey respondents in August 2018.
26Hele Mai Maui Factbook 2018
Biking on Maui
Whether it’s riding along the coast or through Upcountry, bicycling on Maui is
popular among residents and visitors. However, creating a bikeable Maui that makes
it easier and safer to ride for all types of trips requires a more intentional approach to
bicycle infrastructure.
A new bike lane in Pā‘ia (top) and a multi-use path in Kīhei (bottom) provide dedicated space
for people biking.
27Maui MPO Long-Range Transportation Plan
Long Range Transportation Plan
Maui’s Bicycle Facilities
30
Kapalua
Nāpili-Honokowai
Ka‘anapali
Waihe‘e-Wai‘ehu
Greenway West Maui
Forest Reserve
Greenways provide a space
completely separated
from the roadway, usually Lāhaina Wailuku Kahu
buffered by landscaping,
for bicyclists. Examples Launiupoko 30
include a greenway running 311
parallel to Maui Veterans Waikapū
Highway and the North
Olowalu
Shore Greenway connecting Ma‘alaea
Kahului and Pā‘ia.
311
Kīhe
Bicycle Lane
Bicycle lanes create Wa
dedicated space on the
roadway for bicycles.
This helps improve
safety by providing
clear space for cars and
bikes, but bike lanes Mak
that lack protection may
not be comfortable for
all types of riders.
28Hele Mai Maui Factbook 2018
Bicycle Route
Bicycle routes are typically marked with signs but include no other roadway
treatments or improvements. On Maui, routes tend to be along major
corridors where bicyclists are encouraged to ride on the shoulder. Bicycle
routes along high-speed roads generally attract only the most fearless of
riders.
Trails
Trails are secluded
and provide access
to walkers, hikers,
Ha‘ikū-Pa‘uwela and bikers. Most trails
Pā‘ia on the island are
36 maintained by the
366 Hawai‘i Na Ala Hele
Program.
ului Hāli‘imaile
Makawao
Olinda
Pukalani
Ko‘olau
Forest Reserve
377 360
Kula Hāna
ei
Haleakalā Hāna
National Park Forest Reserve
Keokea
ailea Kahikinui
Forest Reserve
37
Bicycle Facilities
kena
Greenway
Lane
Route
Trails
29Maui MPO Long-Range Transportation Plan
Long Range Transportation Plan
Driving on Maui
30
About 85% of people
use a car to get to work Kapalua
on Maui, whether they
drive alone or carpool. Nāpili-Honokowai
Respondents to the Hele
Mai Maui survey (summer
2018) indicated that
they drive for most trips, Ka‘anapali
especially when traveling Waihe‘e-Wai‘ehu
between communities. This
West Maui
reliance on driving leads
Forest Reserve
to congestion, increases
the need for roadway
maintenance, and adds Lāhaina Wailuku Kahu
greenhouse gases and
other pollutants to our air. Launiupoko 30
Visitors to Maui are also 311
primarily driving—Maui
Waikapū
Olowalu
has the largest number of
rental vehicles in the state. Ma‘alaea
“
311
Kīhe
…The more roads we build, the more
traffic we will have. I prefer slowing
down drivers with less lanes and adding
greenways to make this island more of
“
a meandering experience… Wa
While 90% of summer 2018 survey respondents primarily rely on a
vehicle to get around Maui today, more than half would like to use Mak
other modes of transportation. Hele Mai Maui has the opportunity
to increase the number of safe, reliable, and comfortable options
to provide people with news ways to travel.
30Hele Mai Maui Factbook 2018
The busiest roadways on Maui are those that connect
people to jobs located in Kahului, Wailea, and
Ka‘anapali. These roads link the major employment
centers and residential centers of the island.
Because many parts of Maui are connected by only
one major road, the most travelled roadways are
those in areas with few options, such as Honoapi‘ilani
Highway or Haleakalā Highway. A transportation
system with limited options—or a lack of redundancy—
can create challenges during emergencies when
demands to get into or out of an area are high.
Ha‘ikū-Pa‘uwela
Pā‘ia
36
366
ului Hāli‘imaile
Makawao
Olinda
Pukalani
Ko‘olau
Forest Reserve
377 360
Kula Hāna
ei
Haleakalā Hāna
National Park Forest Reserve
Keokea
ailea Kahikinui
Forest Reserve
37
Annual Average Daily
Trips (AADT)
(Hawaii Department of Transportation, 2016)
kena 10 - 5,000
5,001 - 10,000
10,001 - 20,000
20,001 - 50,000
Annual Average Daily Trips (AADT)
estimates the number of vehicles that
travel along a road each day.
31Maui MPO Long-Range Transportation Plan
Long Range Transportation Plan
Safety on Maui
The County of Maui has
adopted Vision Zero, with a
goal of eliminating all traffic
fatalities by 2040. Maui Kapalua
police data shows there
are more than 100 traffic Nāpili-Honokowai
collisions on Maui involving
people walking and bicycling
each year.
Ka‘anapali
To understand how safe Waihe‘e-Wai‘ehu
Maui’s roadways are today,
West Maui
we analyzed crash data from
Forest Reserve
2010 to 2017. The maps in
this section show “crash Kahul
density,” which highlights Lāhaina Wailuku
areas of the island where
more pedestrians and cyclists Launiupoko
are hit by vehicles. This Waikapū
analysis helps point to areas
Olowalu
of Maui where transportation
improvements are needed. Ma‘alaea
Note: Crashes are between either
bikes and motor vehicles or
pedestrians and motor vehicles.
Kīhe
Kahului, Wailea/Kīhei, and Lāhaina have Bicycle & Pedestrian
the highest number of collisions that
involve a bicycle or pedestrian on the
Crash Density
island. Wa
HIGH
number of crashes
Bicycle collisions make up 35% of bicycle
or pedestrian involved crashes, and
LOW
pedestrian collisions account for the number of crashes
remaining 65%. The majority (59%) of
bicycle/pedestrian collisions result in non- Source: Maui County Police Department
(2010-2017)
Mak
serious injuries, but 15% result in serious
injury or death.
32Hele Mai Maui Factbook 2018
Vision Zero
Vision Zero sets a goal to eliminate traffic deaths on Maui by 2040
People walking and bicycling, who are often children or
elderly, represent a disproportionate rate of fatalities
County of Maui invests in Complete Streets and Safe Routes
to School to encourage safe and active transportation
Vision Zero Committee to advise Mayor’s Office and County
Council on implementing a Vision Zero Safety Action Plan
Pā‘ia
Ha‘ikū-Pa‘uwela “ In the summer 2018 Hele
Mai Maui survey of nearly
300 residents, community
members identified safety
as their top transportation
“
lui value.
Hāli‘imaile
Makawao
Olinda
Pukalani
Ko‘olau
Forest Reserve
Kula Hāna
ei
Haleakalā Hāna
National Park Forest Reserve
Keokea
ailea Kahikinui Nearly half of all reported collisions
Forest Reserve were caused by an unknown factor,
suggesting a need for better data
collection when a crash occurs.
Four percent of all collisions involved
kena people illegally in the roadway, which
suggests that some areas lack facilities
that provide safe spaces for people to
walk and bike.
33Maui MPO Long-Range Transportation Plan
Long Range Transportation Plan
Central Maui
What does this map tell us?
Large intersections with slip lanes—right-turn lanes
D
that don’t require a vehicle to stop—are major LAI H
IR
MA
locations for crashes because they speed up traffic
and create potential conflicts with pedestrians. Crash
hot spots that have slip lanes include:
E
OL
• Wai‘ehu Beach Road/Eha Street adjacent to the A
HY
M
shopping area
E KILI
KAH
• Wai‘ehu Beach Road/Kahului Beach Road
ST
A
O N AH
E ST
• Access points to University of Hawai‘i - Maui KA MAIL
MA
RD
• Maui Memorial Medical Center
IKA ST
A
N
A
IH
PI LP
PA
• Wakea Avenue/Ka‘ahumanu Avenue adjacent to IL
I
T
W
Queen Ka‘ahumanu Center RD
N
LS
MIL
MA
U
A
RK
H
PL
KU
ET
O
AI
There are also large concentrations of bicycle and M
W NANI S
T
ST
LO
HO
pedestrian collisions in parking lots, which point to WM
AI N
ST
conflicts caused by multiple driveways or the design
of parking lots themselves:
KA
RD
LLEY K
LU
IAO VA NA
S HI G H
• Walmart
A
RD
WA I
RD
ST
• Costco
U
AL
KAMO
W
• Maui Memorial Medical Center
RD
LE ST
E
DR
WAIAL
AW
O
P
LI
PA
• Queen Ka‘ahumanu Center
E
A R
L
ID
LA
N
AN
U AH
KA
CI
IK
IP
U
K
L
• Maui Mall
AN I H Y
Wai
• Maui Marketplace
HONOAPIIL
• Safeway
• Shopping strip along Pu‘unene Avenue from
Kaua‘i Street to Kamehameha Avenue
E
WA
IKO
R D
34Hele Mai Maui Factbook 2018
Bicycle & Pedestrian
Crash Density
HIGH
number of crashes
W
ST
AI
A
EN DR
EH
LA
U
AA LOW
RD
K
BE
A AE number of crashes
KA
A
H
C
RD
PL I ST
IO AL Source: Maui County Police Department
H UK (2010-2017)
KU
PL
ALU Fatality
A T KAIN
T L UA S
DR
PIO
ST
A
EH
ST
ST
HO
IN
LI
AV
A
O
M
H
OA
ER
LI
PL
AMALA
W
KANAL
LO
LUNALILO ST
PL
NI
O LA
KE
AKOA ST
LIA N
HA KAAHUMANU AV
AL
AM
KALA HY
SP
LO
AH
A EA
N
UU
ST
L
OA
HA
T
NE
IS
DR
ST
W WAKEA AV HA
V
N
LA
NE
NA
MA H A
A
KE
A
KO T HY
AV
36
S
ST
RD
ST
LO
AIAI
AV
SP
RD
AA
U
AU
Y
I IN
EE
IR
I M
AP
ST
IIH
IC
DA
EH
A
LE
Kahului
N
A
AV
AN
ON
HI
T
KAMA
IS
NA
LA
UL
HA
A AV
ST
KA
L
N
PO
T
LE
IS
IC
AN KE
O
I
HO
ST
V
A
A
W PA P
U
P
KA
V
RD
AA
O EN
OK
U ST SM H A NS
H
OM
ME
HO
A
EH
Y
IH
M
MA N
A
UI L K A
S EL
IH
iluku
AN
IP KU
M KW
EH Y PU
AN
E U CI LE
H
AM
U
R
LI D
Y
U
ST
LE H
ULE
MOK
D
35Maui MPO Long-Range Transportation Plan
Long Range Transportation Plan
N
K IH
EI R
D
South Maui
MOK
Y
IH
ULEL
N
LA
II
NK
E HY
AP
IHE
NO
IR
D
HO
Ma‘alaea
What does this IOLOHIA ST
map tell us?
UWAPO RD KA
OHUK
KE
AI RD
NO
Access points to Pi‘ilani
LIO
Highway have a large
RD
number of crashes. LU S
T
KA O N OU
At Uwapo Road and
Waipuilani Road, the slip KULANIHAKOI ST
lane creates a challenging
environment for people Kīhei ELEU PL
walking and biking.
ULU N
LILOA
Pi‘ikea Avenue has a high
IU
DR
concentration of crashes.
RD
The new roundabout HALEKUAI
ST
should help to reduce
HALAMA
E WELAKAHAO
collisions as people RD
become accustomed to it.
ST
KUPUN
A ST
PL
KEAL A
There are several safety
hot spots along South AUH
AN
A
Kīhei Road, particularly RD
adjacent to Kalama Beach
ALANUI KE
Park. South Kīhei Road
M O A N A AV
has heavy pedestrian
S KIH
activity, suggesting the
E
PIILA
I RD
need for safer crossing
NI HY
opportunities between
KAUHALE
the beach and commercial
destinations. MA
ST
PU
KA
Bicycle & Pedestrian
PL
PIL
KUPUL
AU DR
I
Crash Density
ST
OKOLA
AKA
DR
NI
HIGH DR
NI
LA D
number of crashes
Wailea
LA
We need more KUM U
R
flashing crossing
LOW
signs in Kīhei. number of crashes
Source: Maui County Police Department
(2010-2017)
Fatality
I ST
KAH
K AU
36Hele Mai Maui Factbook 2018
R D
ANI
I IL
West Maui
AP
NO
HO
ER
LOW
Nāpili-Honokowai
What does this
map tell us? Mahinahina
LA DR
AI N
A MAHI
A
IS
KAI A
KA T
KA
AL
Lāhaina Town has large PU
UK
A
N
EO
O KA
OL
numbers of people II
RD D
R
KOP
ST
walking, including many
Ka‘anapali
AA
E
visitors, in the historic
ST
PIH
P
KUALA A LP
center. This area has one
of the highest densities of
ANAPUNI PL
crashes in Maui.
H
A
LE
Retail developments with
LO
ST
large parking lots and
multiple driveways have
high concentrations of
KA
collisions, such as Lāhaina
Gateway, Lāhaina Cannery AA
H
I ST
Mall, and destinations
AA ST
MALO ST
along Papalaua Street like
the Old Lāhaina Center and
AINAKEA RD
Outlets of Maui.
Slip lanes create
Lāhaina LO
A
ST
ST LI D
KEAWE
challenging crossings ST L UN
AR
KI INA
where Keawe Street joins A
LA
HA
Honoapi‘ilani Highway
and where Honoapi‘ilani
W
A
IN
Highway meets Lower
EE
ST
Honoapi‘ilani Road.
Bicycle & Pedestrian
LA
HO
U
Crash Density
AW
NO
PL
A
IO
AP
K
PL
HOK I O
IIL
HIGH
AN
number of crashes
I find Keawe Street
IH
Y
NA K
to be extremely PU
HA
dangerous to walk LOW
Launiupoko
N
IU
or drive. number of crashes
ST
Source: Maui County Police Department
(2010-2017)
H EL
KAI
Fatality
Olo
37Maui MPO Long-Range Transportation Plan
Long Range Transportation Plan
Upcountry
W KUIAH A
H
What does this
O
Hai
LO
M
UA
A
H
N
RD
A H Y 36
RD
map tell us? HA
NA
HY
36
Pā‘ia
PE
H
A
IR
D
E KU I
WK
Ha‘iku
AH
UIAH
Upcountry has
BA
A
D
RD
L
W
A
IN
RD
significantly fewer crashes
AV
than other parts of the K
O
KO
island, which may be
D
AR
MO
K AU
RD
LU
due to the more rural
KA
HIKO
R
AW
A
P
D
U
AL
E
KA
character and a smaller
IK
AR
A
LIL
D
U
RD
IKO
number of people who
I
BA
RD
LD
W
walk or bike. IN
LEIE
AV
HA
Hāli‘imaile
ST
LEA
KA
LA
HY RD
The highest concentration
37 E
IL
A
IIM
H AL
of collisions is in Pā‘ia,
where Hāna Highway
meets Baldwin Avenue. NI R
D
This is a site with large KA
MA
numbers of pedestrians
due to a busy commercial
Makawao
Pukalani
RD
U
strip and many visitor
M
A
N
A
H
ST
destinations. The street
NI
PU
LA
LE
A
parking was recently U
AL
H
Olinda
RD
AUL
redesigned to improve ANU
II D
R
OL
HEA
PL
IND
PII
safety.
HO
A
LO
RD
RD
The other concentration
of crashes in Upcountry is
KULA HY
in Makawao Town, another
area with many shops and
more opportunities for
walking and biking.
Bicycle & Pedestrian
Crashes on Crater Road Crash Density
in Kula may be linked to HIGH PU
LE
H UI
number of crashes
downhill bicycle tours and
KI
RD
lack of safe space on road
shoulders. LOW
number of crashes
RD
ULA
CO
PP
RD
RK
Source: Maui County Police Department
E
(2010-2017) AV
LOW
KE
UL I
KA
KE
Fatality
38Hele Mai Maui Factbook 2018
East Maui
What does this
map tell us?
East Maui has the least NA
HIK
amount of crashes
UR
D
compared to other parts
of Maui. This is likely due
to the smaller population
centers, and lower number
of vehicles travelling east
of Upcountry. Additionally, HA
NA
UL
AI
N
walking and biking along HW
Y
O
RD
A RD
Hana Highway is likely
AI
limited outside of the small
M
populated areas. WAIKOL
OA
RD
UA
Hāna
KE
Of 10 crashes involving
A
RD
bicyclists and pedestrians
in East Maui, only two
occurred in the same H
AN
EO
O
location. This location was Hāna
RD
the Travaasa Hana Resort,
suggesting the possibility
Forest Reserve
to improve crossing
opportunities between Y
HW
the resort property and A
N
A
H
the parking lot located on
the opposite side of Hana
Highway.
Most collisions occurred
Bicycle & Pedestrian
along rural sections
Crash Density
of Hana Highway. This
provides an opportunity HIGH
number of crashes
to consider how highway
signage and striping
could be improved to limit LOW
number of crashes
incidents.
Source: Maui County Police Department
(2010-2017)
Fatality
39Maui MPO Long-Range Transportation Plan
Long Range Transportation Plan
Pedestrian Collisions by Severity
66
Average annual
120
pedestrian collisions
100
4
80
60
Average fatalities
per year since 2010 40
17%
20
0
2010
2014
Reported collisions
2016
2015
2012
2013
2017
2011
resulting in severe
or fatal injury since 2010
Source: Maui County Police Department (2010-2017)
Non-serious Serious
Unknown Injury No Injury Injury Fatal
40 36
Average annual
Bicycle Collisions by Severity
bicycle collisions 50Hele Mai Maui Factbook 2018
Pedestrian Collisions by Severity
66
Average annual
120
pedestrian collisions
100
4
80
60
Average fatalities
per year since 2010 40
17%
20
0
2010
2014
Reported collisions
2016
2015
2012
2013
2017
2011
resulting in severe
or fatal injury since 2010
36
Average annual
Bicycle Collisions by Severity
bicycle collisions 50
1
40
30
Average fatality
per year since 2010 20
10
11% 0
2010
2014
2016
2015
2012
2013
2017
2011
Reported collisions
resulting in severe
or fatal injury since 2010
Source: Maui County Police Department (2010-2017)
Non-serious Serious
Unknown Injury No Injury Injury Fatal
41Maui MPO Long-Range Transportation Plan
Long Range Transportation Plan
Fatal Car Crashes
Here’s what
we know
about where
Kapalua
fatal motor
vehicle crashes Nāpili-Honokowai
occurred:
Ka‘anapali
Maui police data show Waihe‘e-Wai‘ehu
that between 2012 and
2017 there were about West Maui
11 fatalities annually due Forest Reserve
to crashes involving
vehicles only. Lāhaina Kahul
Wailuku
The 75 fatalities are
distributed across the
Launiupoko
Waikapū
island, but Upcountry
and Central Maui each Olowalu
account for about a
third of fatalities. Ma‘alaea
Nearly all of these
crashes occurred
along the island’s Kīhe
highways or other
major thoroughfares,
reinforcing the need
to improve roadway
design to enhance
safety for all. Wa
17
Fatalities 12 12 13 11
Resulting from 10
Vehicle Only Mak
2014
2016
2015
2017
2012
2013
Crashes
Source: Maui County Police Department (2010-2017)
42Hele Mai Maui Factbook 2018
Here’s what • More than 75% of these fatalities were caused
by drivers under the influence of alcohol or
we know about drugs.
why fatal motor • Speeding accounted for 8% of crashes, while
vehicle crashes no other individual factor accounted for more
than three fatal crashes.
occurred:
• These data suggest the importance of
education and enforcement as well as better
roadway design.
Ha‘ikū-Pa‘uwela
Pā‘ia
lui
Hāli‘imaile
Makawao
Olinda
Pukalani
Ko‘olau
Forest Reserve
Kula Hāna
ei
Haleakalā Hāna
National Park Forest Reserve
Keokea
ailea Kahikinui
Forest Reserve
Fatal Vehicle
Crashes
kena Source: Maui County Police Department
(2010-2017)
Fatality
43Maui MPO Long-Range Transportation Plan
Long Range Transportation Plan
Other Ways of
Getting Around
Maui Today
In 2015, there were nearly 140,000 passenger vehicles, over 20,000 rental vehicles,
and just over 4,000 motorcycles/motor scooters registered in Maui County. While
driving a personal vehicle is the primary mode of transportation on the island, Maui
Bus and newer mobility options are changing the ways people get around.
Transportation
Network Companies
TAXI
(TNCs) & Taxis
Several local taxi services, as well
as TNCs such as Lyft and Uber, are
available on Maui. Uber has been on
Maui since 2014 and Lyft since 2017.
These services provide alternatives
to renting or owning a car for some
people. They also provide a new
travel option for some trips, especially
shorter connections.
Electric Carts
Turtle Tracks is a local business that uses
five-passenger neighborhod electric
vehicles to provide on-demand, local
trips at $3 per ride. The service operates
along South Kīhei Road and to Wailea.
Most people who use the service are
visitors.
44Hele Mai Maui Factbook 2018
Kahului Airport
Kahului Airport—the state’s largest rental car provider with an average of
2,200 rentals per day—is in the midst of a $340 million project to construct
a consolidated car rental facility. When complete in May 2019, this new
facility will move all car rental companies to a single location, reducing
congestion in the airport area by eliminating the shuttles associated with
the remote rental car lots.
Source: Pacific Business News
Rendering of Kahului Airport consolidated car rental facility.
RENTAL Rental Cars
Rental cars are
popular with visitors,
but shuttle ridership
trends suggest visitors
are now looking for
alternatives. The large
number of visitors
to Maui—and current
rates of car rentals—
puts a tremendous
strain on Maui’s
roadways.
45Maui MPO Long-Range Transportation Plan
Long Range Transportation Plan
Less traffic
59%
Clear spaces for cars
55%
What You Said
No potholes
Wider roads
39%
51%
Through Hele Mai32%
Lighting Maui outreach in summer 2018, the project team heard from people
at in-person events and through an online survey. We talked to hundreds of people
Other
27%
from all parts of Maui, asking about what works and what doesn’t when it comes to
transportation today. You told us what would make it better to walk, bike, take the
21%
Faster signals
bus, and drive, and you shared the values that are most important to you when it
comes to moving around Maui. Here are a few highlights about how you move today:
What’s most important?
Safety, sustainability
Want to get
and resiliency,
travel time, and
Maui needs safe
travel options and
involved?
better connections Visit the Hele Mai Maui
affordability were between those
options. website to sign up
the priorities people
for updates and learn
shared for getting
about upcoming events:
around Maui.
https://mauimpo.org/
hele-mai-maui-2040
Walking on Maui would be better if there were...
82%
More than 80% of
people identified Sidewalks or trails
49%
more sidewalks or
trails as the most Well-marked crossings
important walking
improvement needed
on Maui. Crossing
Well-lit streets
46%
45%
improvements and
better street lighting Pedestrian signals
I would like to see
were also identified as
38%
more walking
priorities. Comments Trees/landscaping paths with places
to stop and rest
cited the crossings along the way.
27%
along South Kīhei Also, more trees
Slow cars would make it
Road as examples of nicer to walk on
24%
what is desired, and hot days.
called for enforcement Curb ramps
of speed limits
and other traffic
regulations for the
Other
19%
safety of all.
46Hele Mai Maui Factbook 2018
Sidewalks or trails
82%
Well-marked crossings
49%
Well-lit streets
46%
Pedestrian signals
45%
Trees/landscaping 38%
Slow cars
27%
Curb ramps
24%
Other
19% I would like to see
more walking
paths with places
to stop and rest
along the way.
Also, more trees
would make it
nicer
Community members identify areas where they feel transportation solutions are needed on to walk on
Maui.
hot days.
Biking on Maui would be better if there were...
77%
Adding bike
lanes, trails, and Bike lanes
greenways were the
improvements most
people identified
Trails and greenways
63%
40%
to help improve
biking on Maui. Places to park my bike
Respondents also
noted a need for
parking facilities 34%
Traffic signals
We need safe, well
26%
marked or separated,
and lighting. and clean bike lanes
Bikes to rent all around the island.
Then I could go to
24%
common places like
work, home, and
Slower cars entertainment on my
bike.
Other
14%
47Maui MPO Long-Range Transportation Plan
Long Range Transportation Plan
Riding the bus on Maui would be better if...
51%
Nearly half of the
survey respondents The bus came more often
identified more
frequent bus service
and better shelters
Better bus shelters
49%
38%
as improvements
that would get them Early and late times
to ride the bus more
37%
I would like to see Bus routes on
more walking Maui need to be
often. Respondents Faster buses
paths with places more integrated
also note the need to stop and rest with each other. I
37%
along the way. shouldn’t always
for more stops and Also, more trees have to go to
routes that allow More
wouldtransit
make it maps Kahului to switch
nicer to walk on between routes.
tourists to move
28%
hot days.
without a rental car. Other
Weekend service
27%
Maui needs reliable
We need safe, well alternative routes
marked or separated, between some of
and clean bike lanes our major
59%
all around the island. destinations. We
Then I could go to need to have a new
commonLess traffic
places like option between
work, home, and places like Lahaina
55%
entertainment on my and Kahului.
bike.
Clear spaces for cars
No potholes
51%
Wider roads
39%
Lighting
32%
Other
27%
Faster and
Maui’s younger residents enjoyed coloring signals
21%
learning about transportation, while parents participated in
completing surveys, identifying transportation hotspots, and communicating their mobility values.
48I would like to see Bus routes on
more walking Maui need to be
paths with places more integrated
to stop and rest with each other. I
along the way.
Hele Mai Maui Factbook
shouldn’t 2018
always
Also, more trees have to go to
would make it Kahului to switch
nicer to walk on between routes.
hot days.
Driving on Maui would be better if there were...
People would
like less traffic,
Less traffic
59%
55%
separation between
cars and bikes, and Clear spaces for cars
fewer potholes
51%
to make driving
more pleasant No potholes
on Maui. Written Maui needs reliable
39%
We need safe, well alternative routes
comments also Widermarked
roadsor separated, between some of
and clean bike lanes our major
call out the need all around the island. destinations. We
32%
for synchronized Then I could go to need to have a new
signals, alternative Lighting
common places like option between
work, home, and places like Lahaina
routes between entertainment on my and Kahului.
27%
bike.
communities, and Other
enforcement to keep
21%
all users safe.
Faster signals
Maui needs safe
travel options and
better connections
between those
options.
The Hele Mai Maui Community Think Tank convened to discuss the challenges facing Maui’s transportation
system.
49Maui MPO Long-Range
Long Range Transportation
Transportation Plan
Plan
PART FIVE
Where We Go
From
Here
Through Hele Mai Maui outreach and engagement, we’ve heard that Maui residents
want safe, comfortable, and reliable ways to get around the island. For some that
means better biking connections or safer walking conditions; for others, that
means a reliable way to drive or an efficient trip to work on the bus. We also know
that visitors need more options to reduce the need for car rentals for the duration
of their stay.
This section summarizes what we’ve heard from the community. It also builds
on our analysis of existing transportation options, how people get around, and
who lives and visits the island today and in the future. This discussion sets the
groundwork to explore solutions for transportation on Maui for the next 20 years.
Each of the six topics below includes a description of what we learned and
introduces some of the opportunities that will be explored in the next phases of
Hele Mai Maui.
Multimodal Options
What we know:
We’ve heard that people are interested in biking, walking, taking transit, and sharing
rides on the island. And we’ve also heard that they want the trips they do need
to make by car to be more reliable. However, making a variety of travel options a
preferred choice to driving alone is challenging given the current transportation
system and offerings.
50You can also read


