Active Transportation and Parks and Recreation
←
→
Page content transcription
If your browser does not render page correctly, please read the page content below
Active Transportation and
  Parks and Recreation

               Active Transportation & Parks and Recreation   1
Table of Contents

Executive Summary...........................................................................…1

Introduction......................................................................................…1

Part I
Stimulating Economic Activity...........................................................…3

Part II
Building Healthy Communities..........................................................…5

Part III
Promoting Conservation and Environmental Stewardship ...................9

Part IV
Social Equity: Transportation Access for All..........................................11

Conclusion...........................................................................................12

Endnotes..............................................................................................13

                                              Active Transportation & Parks and Recreation                 3
EXECUTIVE SUMMARY
Our society continues to experience economic hardship, increasing chronic disease rates, climate change and social inequity.
More than ever before, active transportation is proving to be a valuable tool as communities across the United States tackle these
challenges. Active transportation has been conclusively shown to impact our communities in at least four ways: boosting our local
economies, improving our physical health, achieving a cleaner environment and providing affordable transportation access for
everyone. Although communities can certainly exist without active transportation networks, citizens who live in communities with
robust active transportation networks enjoy many desirable benefits. After decades of designing and building automobile-centered
communities, we have created places where it is difficult and dangerous to walk or bike safely. Creating a more balanced transpor-
tation system through cost-effective investments offers the promise of improving the quality of life of our people and the places in
which they live.
Parks and recreation agencies have historically been closely aligned with the goals of active transportation principles, as well as
playing an important role in the development and management of active transportation infrastructure. The relationship between
parks and recreation and active transportation interests is critical – and is sometimes overlooked by both the public and policy-
makers. It is difficult to imagine a truly comprehensive active transportation network that is not touched by a park and recreation
agency, and in many cases parks and recreation agencies are the primary providers of active transportation-related services.
Through active transportation, parks and recreation agencies provide valuable benefits to communities by providing an engine for
economic development, increasing health and wellbeing, supporting conservation and providing benefits to all citizens regardless
of socioeconomic status.
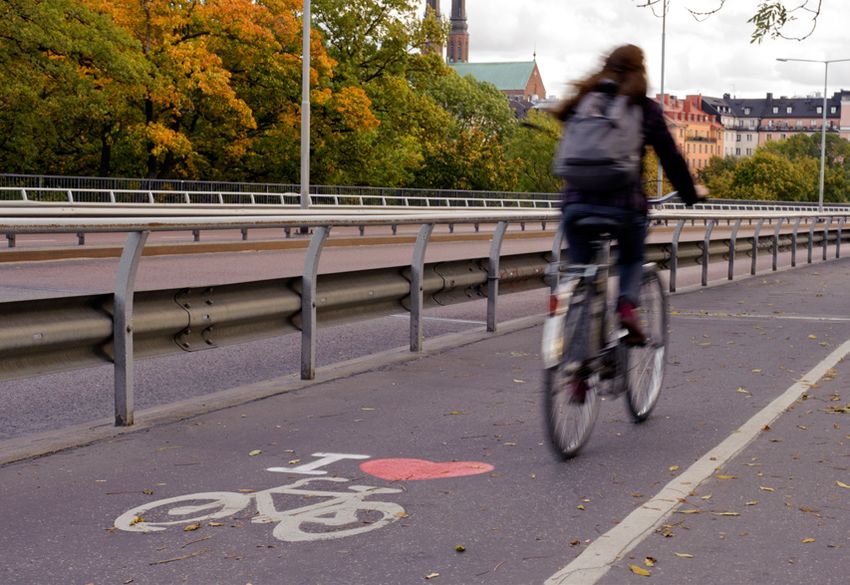
INTRODUCTION What is active transportation?
The United States is faced with economic, health, environmental Active transportation is defined as human-
and social challenges that can be effectively addressed by active powered modes of transportation. The most
transportation. High rates of chronic disease, a struggling econ- popular modes of active transportation are
omy, climate change and social inequity all decrease the quality walking and bicycling, however, skate boarding,
of life for people across the country. Research illustrates that canoeing, roller-skating, etc. can all be
active transportation offers several benefits to mitigate each of considered forms of active transportation.1
these challenges.
For purposes of this paper, the benefits of active transportation are categorized into economic, health, conservation and social
equity categories.
Transportation policies centered on automobiles provide limited transportation options leading to severe congestion, consid-
erable gas expenses and a transportation system that lacks efficiency.2 Although tremendous investment in motorized trans-
portation infrastructure over the years has made access to work, shopping and other destinations convenient, it has amplified
our dependence on automobiles while dismissing
alternative modes of transportation. Moreover,
the development of suburban communities has
further contributed to the reliance on automobiles
due to longer distances from city centers and pub-
lic transportation systems.3
1 Active Transportation and Parks and Recreation
»» Active transportation stimulates local
       economies through job creation,
       commercial business development and
       real estate values.
                                                          In 2012, the passage of the two-year transportation bill known as MAP-
    »» Active transportation infrastructure               21 (Moving Ahead for Progress in the 21st Century) made transportation
       builds healthy communities by                      policies even more highway-centric.4 This bill was signed into law July 6,
                                                          2012, and many view this legislation as a setback for active transportation.
       encouraging physical activity as part of
                                                          Under this law, the federal funding for road projects increased from 80 per-
       daily life.
                                                          cent to 95 percent while funding levels for alternative transportation was
    »» Active transportation promotes                     reduced by 30 percent.4 Prior to MAP-21, there were three transportation
                                                          programs dedicated to trails and active transportation: TE (Transportation
       conservation and environmental
                                                          Enhancements), SRTS (Safe Routes to School) and RTP (Recreational Trails
       sustainability by reducing air and water
                                                          Program). MAP-21 has merged these programs into one program known
       pollution and minimizing congestion.               as Transportation Alternatives. Several activities that were approved un-
                                                          der the guidelines of TE are no longer eligible for funding under Transpor-
    »» Active transport ation provides
                                                          tation Alternatives. Some of these ineligible programs include pedestrian
       transportation access to all
                                                          and bicycle safety, educational programs, tourist and welcome centers and
       citizens regardless of age, gender,                beautification projects.4 While limited funding for active transportation is
       socioeconomic status or disability.                concerning, an even more problematic outcome of this law is that is en-
                                                          ables states to opt-out of active transportation programs thus allowing
these funds to be transferred to other projects.4 The need for alternative modes of transportation is even greater today, however,
transportation polices for such projects continue to remain under attack.

Interestingly, approximately 50 percent of trips taken in the United States can be accomplished by riding a bicycle for 20 minutes and
25 percent of short trips can be completed by walking 20 minutes or less.2 However, the National Household Travel Survey indicates
that less than 1 percent of daily trips are made by bicycling and less than 11 percent by walking5 — meaning that people are getting in
their cars to make these very short journeys. In American cities, 28 percent of trips are less than 1 mile, yet 60 percent of these trips
are made using cars.6 Although vehicle miles travelled by Americans between 2011 and 2012 dropped by 0.4% percent (partly due
to more walkable communities7), lack of funding for active transportation infrastructure continues to limit the ability to use non-mo-
torized transportation. Along with lack of access to active transportation options, lack of maintenance of existing sidewalks and trails
also decreases the likelihood an individual will choose to walk or bike rather than drive. Research has shown that lack of sidewalks
and safe places to bike are primary reasons people give when asked why they do not walk or bicycle more.6

While automobiles and motorized transportation infrastructure have afforded Americans with convenience and comfort, it has compro-
mised four important facets of our lives: health, economy, environment and transportation accessibility. Over the years, federal trans-
portation policy and funding authorizations have often failed to incorporate the goals of broader national policy agendas such as health,
economic, environmental and social equity policies.8 In light of this, park and recreation advocates and those who realize the incredible
benefits of active transportation continue to push for increased active transportation funding as it provides communities across the
nation with the hope of improved overall quality of life.

In most communities, existing and future active transportation options heavily depend on the local parks and recreation agency.
These agencies continue to serve as critical components of any active transportation strategy through infrastructure development,
maintenance and encouraging its use as a form of recreation. Many park and recreation agencies consistently promote active
transportation via marketing, programs, partnerships and investments in active transportation infrastructure. They play a critical
role in influencing the cultural shift toward active transportation via their ability to foster landscape architecture, park planning,
recreational programming, etc. Furthermore, recreation areas, bicycle racks, helmet loan programs and pedestrian lighting are
also established through efforts of local park and recreation agencies.

Park and recreation agencies play an integral role in active transportation, and are a critical part of strategies targeted at increasing
active transportation modes. Active transportation and parks and recreation work together to improve our health, economy, environment
and transportation accessibility for the benefit of all.

                                                                            Active Transportation and Parks and Recreation              2
PART I
STIMULATING ECONOMIC ACTIVITY
Several principles that underlie the mission of public parks, recreation and active transportation overlap, thus positioning public
parks as important players in advocating for active transportation. Through their role in providing places for relaxation and
recreation for the public, park and recreation agencies are key stakeholders in the planning, construction and maintenance of
active transit projects.

       Job Outcomes from Active                      Investments in transportation infrastructure positively im-
     Transportation Investments in                   pact our economy
              New Jersey                             Although future federal funding toward active transportation infrastructure re-
                                                     mains uncertain, trails, pedestrian pathways and bicycle paths have repeat-
Findings from a 2012 study to estimate
                                                     edly been proven to contribute to local economies across the United States
the economic impacts of active                       through job creation, tourism, commercial businesses and increases in real
transportation in New Jersey reveal that             estate value.
investments in active transportation
contribute significantly to job creation.10
In 2011, governmental agencies in New                Vehicle for Job Creation
Jersey invested $63.17 million on active
                                                     Active transportation projects generate direct, indirect and induced jobs. Di-
transportation infrastructure, which
                                                     rect jobs are created from the engineering and construction process itself.
represents less than 1 percent of all                Indirect jobs are those initiated through product and service industries re-
transportation spending in the state during          quired in the construction phase such as cement manufacturing, trucking,
that same year. This investment translated           etc. Induced jobs are produced due to demand from local residents such as
into 648 jobs, approximately $44.57                  retail positions and food services specialists.9 Investments in active trans-
million in wages and salaries, $15.68                portation can partly mitigate high unemployment rates through the potential
million in tax revenue and $75.62 million            to create jobs.9
contribution to the GDP.10

         Active Transportation                                 Bicycle Infrastructure Only projects generate
    Infrastructure Creates More Jobs
        than Road Infrastructure                               11.41 jobs per $1 million
A recent study conducted by the
Political Economy Research Institute                           Pedestrian Infrastructure Only projects generate
at the University of Massachusetts to
investigate the employment impacts of
                                                               9.91 jobs per $1 million
pedestrian and bicycle infrastructure
                                                               Off-Streat Multiuse Trail projects generate
in 11 cities in the U.S. reveals that
Bicycle Infrastructure Only, Pedestrian                        9.57 jobs per $1 million
Infrastructure Only and Off-Street
Multiuse Trails create the most jobs                           Road Infrastructure Only projects generate
(i.e. direct, indirect and enhanced
jobs) while Road Infrastructure Only                           7.75 jobs per $1 million
creates the least number of jobs.9

3          Active Transportation and Parks and Recreation
Catalyst for Economic Development
Active transportation can facilitate business development and tourism in affluent communities as well as those that are experi-
encing economic hardship. Numerous studies on active transportation infrastructure illustrate a substantial return on investment.
Active transportation allows funds to circulate within the local economy when people spend at local businesses while walking or
bicycling.1 Near many walking or biking trails, businesses cater to walkers and bikers, driving local economies through spending
on food, beverage and equipment.

     Complete Streets Influences Economic                                     Economic Viability Linked to Active
   Revitalization in West Palm Beach, Florida                                 Transportation in Washington D.C.’s
                                                                                        Barracks Row
More than 10 years ago, streets in downtown West
Palm Beach were designed to allow automobiles to                      Washington D.C.’s Barracks Row experienced a slump
pass through as quickly as possible without stopping.11               in commercial activity as a result of unsafe sidewalks,
This led to undesirable economic consequences—                        lack of lighting and automobile traffic. After design
eighty percent of the properties were vacant in                       improvements were implemented (new sidewalks, street
the downtown area, street crime was increasing                        lighting and traffic signals), Barracks Row tripled its
and the city was $10 million in debt. In an effort to                 economic activity by attracting 44 new businesses and
revitalize this area, the mayor focused on improving                  creating 200 jobs.11
non-motorized transportation modes in the area
by developing pedestrian crossings, traffic calming
strategies and streetscaping. After completion of the
projects, West Palm Beach’s economy began to thrive,                         North Carolina Northern Outer Banks:
the crime rate declined, property values increased and                        Remarkable Return on Investment
the commercial occupancy rate jumped to 80 percent.11
                                                                      Bicycle facilities in the Northern Outer Banks of North
                                                                      Carolina play a critical role in facilitating tourism.
  High Trestle Trail: Business Boom for Iowa’s                        Research conducted by the North Carolina Department
  Local Communities (Rails to Trails Initiative)                      of Transportation (NCDOT) Department of Bicycle and
                                                                      Pedestrian Transportation highlights that 680,000
The High Trestle Trail is a 25-mile trail that was
                                                                      tourists travel to this area, with many visiting to cycle.9,12
officially opened in April 2011. Historically, the trail
                                                                      It has been reported that during the past decade,
was a railroad that was formerly the property of Union
                                                                      approximately $6.7 million in public funding has been
Pacific Railroad.13, 14 The trail runs through the towns
                                                                      invested for constructing bicycle paths/facilities in this
of Ankeny, Sheldahl, Slater, Madrid and Woodward and
                                                                      particular area. As a result of this investment, bicycling
counties of Polk, Story, Boone and Dallas and is visited
                                                                      activity continues to produce $60 million annually in
by more than 91,000 people annually. Consequently,
                                                                      economic benefits translating to approximately nine
local businesses around the trail reported an increase
                                                                      times more than the one-time expenditure of public
in sales of 30 percent in May 2011 and expected a 75-
                                                                      funds to establish these facilities.12
100 percent increase in sales in June 2011.13, 15

Boost for Real Estate Values
Trails serve as an amenity to nearby homes. Trails in neighborhoods increase real estate values for adjacent properties. On av-
erage, homes that are located near trails are more likely to sell in a shorter period of time than homes not in close proximity to a
trail.16 Just one example of this is found in Texas, where the Katy Trail is located in the most urbanized location in Dallas and serves
15,000 people each week.17 More recently, many people are opting to move near the trail for easy access. Homes along the trail
are in high demand and are compared to “oceanfront properties for Dallas.”17 Research findings illustrate that between 2001 and
2011, $750 million in development was completed within 0.4 miles of the trail and home values in the area rose by 20 percent.17

                                                                            Active Transportation and Parks and Recreation             4
PART II
BUILDING HEALTHY COMMUNITIES
Park and recreation agencies often incorporate active transit plans into their overall recreation strategy. In many cases, park
and recreation agencies are responsible for maintenance and management of active transportation amenities, and are often
responsible for making sure the public knows that these resources are available. Goals of recreational programming and
active transportation overlap to a great degree — namely, they focus on providing opportunities for citizens of a community
to live healthier, more active lifestyles. To that end, agencies continue to work in partnership with public health and public
transportation officials to design active transportation plans that will help reduce the prevalence of chronic diseases.

Current State of Health and Physical Activity
Obesity continues to plague the United States. More than one third (33.8 percent) of the population in the United States is
obese and the National Center for Chronic Disease Prevention and Health Promotion estimates one in six children are obese.18
Between 2009 and 2012, the number of states that had an obesity prevalence exceeding 30 percent rose from 9 to 13.19
Almost a decade ago, no state had an obesity prevalence of more than 30 percent. These statistics demonstrate that obesity
is indeed growing at a startling rate.

     Between 2009 and 2012, the number of states that had an obesity
           prevalence exceeding 30 percent rose from 9 to 13.
                                    Almost a decade ago, no state had an
                                 obesity prevalence of more than 30 percent.

The Centers for Disease Control and Prevention’s (CDC) physical activity guidelines recommend that children and adults should
engage in moderate intensity physical activity for 60 minutes per day and 150 minutes per week, respectively.20 The CDC’s
criteria for moderate-intensity physical activity simply mean walking briskly (minimum 3 miles per hour) or bicycling at a slow
pace (less than 10 miles per hour).21 However, almost 40 percent of adults do not meet these standards and about 33 percent
report no physical activity at all.22

Health Care Costs of Obesity
Obesity places an enormous burden on the health care system, with health costs related to obesity escalating steadily since
1998.23 Current estimates suggest that the annual medical cost of adult obesity today is between $147 billion and $210 billion.
By 2030, an extra $48 billion to $66 billion per year may be spent treating preventable diseases associated with obesity.24
Furthermore, in 2006, the prevalence of obesity was responsible for $7 billion in Medicare prescription drug costs.25

Active transportation provides communities with the opportunity to reduce some of the excessive medical costs related to
obesity. Active transportation, whether going to a nearby store or commuting to work, provides participants with physical activity
that is an important component of the fight against obesity. A comparative National Park Service study between people who
exercise on a regular basis versus those that are sedentary indicated that the people who walked or hiked a few times per week
filed 14 percent fewer healthcare claims to their insurance provider, spent approximately 30 percent fewer days at a hospital
facility and had 40 percent fewer claims over the amount of $5,000.25 Reducing the use of automobiles by just 1 percent and
replacing these shorter trips with walking could lower obesity prevalence by 0.4 percent, which translates to tens of millions of
dollars saved on medical expenditures.26

5         Active Transportation and Parks and Recreation
Safer Active Transportation Infrastructure
                                                                                     Reduces Pedestrian and Bicycle
                                                                                      Accidents in Chicago, Illinois

                                                                              Between 2006 and 2011, downtown Chicago’s
Active Transportation Infrastructure: Health and
Safety Concerns                                                               Dearborn Avenue witnessed 1,140 crashes with
                                                                              pedestrians and bicyclists. In 2012, a two-way bike
Heavy motorized vehicles moving at high speeds not only negatively            lane was developed, protected by a parking lane
impact our health by decreasing physical activity, they also produce          and bollards. After the project was completed,
expensive, life-threatening crashes. In 2008, the cost of motor vehicle       there were no reports of crashes through 2013,
crashes totaled to $180 billion, including healthcare costs, lost wages,      illustrating that safer active infrastructure can
property damage, legal/administrative costs, pain and suffering and           indeed prevent accidents.31
lost quality of life.3 In 2012, 4,743 pedestrians and 726 bicyclists were
killed in crashes with motor vehicles, along with 21,667 motor vehicle                   Improving Bicycle Safety in
drivers and passengers.27 All told, motor vehicle accidents claimed                          Portland, Oregon
more than 33,000 lives in 2012.
                                                                              In the early 1990s, the city of Portland, Oregon
A 2012 national survey on bicyclists and pedestrian behavior revealed         began expanding its active transportation infrastruc-
that 24 percent of injuries to pedestrians occurred as a result of            ture to accommodate bicyclists. Between 1991 and
uneven/cracked sidewalks and 29 percent of injuries to bicyclists             1996, the number of people that bicycled grew by a
occurred because of being hit by a car. These findings indicate that
                                                                              magnitude of four, the rate of accidents decreased
poor-quality infrastructure is a leading cause of pedestrian and
                                                                              by 69 percent and the maximum number of fatalities
bicycle injury.28 Similarly, while 12 percent of trips are pedestrian
and bicycle related and 14 percent of all traffic fatalities happen
                                                                              was five per year.2
to pedestrians and bicyclists, only 1.5 percent of the federal safety
funds are allocated to active transportation projects underscoring
the need for increased investment to ensure the safety of those choosing a healthier way to move about their community.29,30 The
study above highlights that infrastructure specifically dedicated for active transit has proven to increase the safety of pedestrians
and bicyclists.

                                                                            Active Transportation and Parks and Recreation       6
Active transportation is
                                                                                            one of the easiest and most
                                                                                              cost effective ways for
                                                                                             many people to meet the
The Priceless Prescription: Active Transit                                                    recommended levels of
                                                                                             physical activity per day.
Even the smallest increase in physical activity is proven to be more beneficial than
inactivity, so much so that it enhances longevity across both genders and different
age groups.25, 32 Trails, pedestrian pathways and bike paths grant opportunities for
people to walk, bike, jog and skate in safe places. Many trails located close to residential areas provide residents with free access
to participate in physical activity. Since a significant number of daily trips tend to be relatively short, active transportation becomes
an excellent option to complete these trips while simultaneously integrating physical activity into peoples’ daily lives.33

One of the most frequent ways that people, particularly those who live in cities, get exercise and engage in active transportation
is during their daily commute. The New York City Department of Health and Mental Hygiene found that New Yorkers get a signif-
icant amount of the recommended daily physical activity from participating in active transportation. On average, New Yorkers
that walk or bike to work are getting more than 40 minutes worth of physical activity per day versus those who use a car or cab
to commute to work.34

Active transportation provides the option for children and adolescents to safely walk or cycle to school or to their peers’ homes.
Studies demonstrate that walking or cycling to school is also associated with increased levels of physical activity.35 Research
conducted in California illustrates that improvements made to active transportation infrastructure connecting neighborhoods to
schools through The Safe Routes to School initiative triggered an increase in walking and biking to school by as much as 20 per-
cent to 200 percent.36 Moreover, children and adolescents that walk one mile each way to and from school accomplish roughly
40 out of the recommended 60 minutes of physical activity per day.37,38

7          Active Transportation and Parks and Recreation
Active Transportation’s Impact on Health Outcomes
Numerous studies provide evidence to show that participating in active transportation leads to improved health outcomes.
Active Transportation Leads to Improved Health
Healthy Transportation Systems Lead to Healthy Weight Loss
A study conducted in 2012 examined the behavior of residents in car-centric areas and those in urban mixed-use communities.
Those living in urban livable communities (livable communities possess the factors that increase a community’s quality of life
including the built and natural environments) were 160 percent more physically active than those in communities that rely on
automobiles.17 Furthermore, the study found that males of average height weighed 10lbs less in walkable communities while
females in similar communities weighed 6lbs less than their counterparts in car-centric communities.17
“Active Cities” Associated with Lower Obesity Rates
A recent study found that residents living in cities and states with more active transportation infrastructure have lower obesity
rates than those living in areas with no active transit.39 The findings highlight that older cities with well-developed public transpor-
tation systems such as Boston, New York, Washington D.C., Seattle and San Francisco have lower obesity and diabetes rates. In
these cities, 10 percent of work trips involved biking or walking.41 On the other hand, cities with the lowest level of pedestrian and
bike commuting were newer cities characterized by urban sprawl. These cities included Dallas, Fort Worth, Nashville, Arlington,
Jacksonville, Indianapolis, Oklahoma City and Charlotte where only 1 percent to 2 percent of work trips involved active transit.41
Smart Growth Strategies in Southern California Improve Respiratory Health
Research by the American Lung Association quantified the clean air and health benefits that Southern Californians will enjoy as
a result of smart growth strategies that will encourage walking and biking.40 Some of these strategies included more compact,
transit-oriented development; increased frequency and availability of transit; increased bicycle and pedestrian facilities; and
complete streets. The annual benefits will include reductions of: 60-140 premature deaths, 110-260 heart attacks, 1,025-2,370
asthma attacks, 95-125 chronic and acute bronchitis cases, 45-105 respiratory related emergency room visits and 7,145-
16,550 lost work days.42
Active Transportation and Parks and Recreation 8PART III
PROMOTING CONSERVATION AND
ENVIRONMENTAL STEWARDSHIP
Conservation has long been one of the central missions of the parks and recreation industry. Active transportation features
such as open space, parks, trails and greenways are key components of urban conservation efforts and environmental stew-
ardship. Active transportation plays an essential role in protecting natural landscapes, promoting environmental sustainabil-
ity and in placing individuals in touch with nature — all of which further the cause of conservation.
Transportation decisions that we make alter essential features of our environment through direct impact on air and water quality.
Active transportation infrastructure conserves our natural resources by removing vehicles from crowded commuter routes and dimin-
ishing the need for highway expansion.
Air Quality: Combating Vehicle Gas Emissions
Excessive levels of toxic gases have detrimental effects on our environment. These emissions are causing temperatures to rise
and changes to our climate. Consequently, the effects of climate change are posing serious threats to our ecosystems.
The largest contributor of carbon dioxide emissions (31 percent) in the United States is the transportation sector. 41 Future projec-
tions have revealed that even with the introduction of “clean” fuels and “green” vehicles, the level of carbon dioxide will escalate
41 percent higher than the current rate by 2030. This projection is estimated using the projected 59 percent increase in driving
by the year 2030.43 Approximately 60 percent of pollution generated by automobiles occurs within the first few minutes of opera-
tion — before automobile pollution-control devices begin to work effectively. Consequently, shorter car trips are more polluting on
a per-mile basis than longer trips.42 Active transportation is
the easiest way to complete short trips, so much so that a
modest 5 percent increase in neighborhood walkability re-
duces vehicle nitrogen emissions by 5.6 percent and vola-
tile organic compounds by 5.5 percent.43
New Active Transportation Infrastructure Improves
Environmental Measures in Four States
A 2012 non-motorized transportation pilot program conducted
by the Federal Highway Administration in four communities (Co-
lumbia, Montana; Marin County, California; Minneapolis Area,
Minnesota; Sheboygan County, Wisconsin) showed that new and
improved active transportation infrastructure reduced more than
7,700 tons of carbon dioxide.46 This is equivalent to saving one
gallon of gas per person in the four communities or 1.7 million
gallons of gas overall.44
9 Active Transportation and Parks and RecreationWater Quality: Battling Water Pollution
Motor vehicles, roadways and parking lots are major sources of water pollution. Pollutants that present a risk to water quality
include crankcase oil drips, road salt, roadside herbicides to clear vegetation and leaking underground fuel storage tanks.45 Tradi-
tional roads and parking surfaces also present challenges associated with water drainage and stormwater runoff. Rapid drainage
of stormwater has negative environmental effects since this water is often combined with polluted runoff. Integrating trails and
greenways into developed areas can improve water quality through retaining and treating the sources of water pollution.46 Many
envrionmental studies have shown that greenways and natural areas which contain trail systems offer valuable water quality ben-
efits as well as recreational opportunities. For example, South Carolina’s Conagree Bottomland Swamp has wetland that creates a
natural water filtration system that would otherwise cost a minimum $5 million if an alternative manmade water filtration system
were to be installed.47 Similarly, a study conducted in Louisiana found that wetlands surrounding 15 seafood processing plants
provided treatment to the waste water saving the processing plants $6,000-$10,000 per acre of wetland.48
Congestion
Road congestion is a significant problem in many parts of the United States. Congestion occurs when the number of miles driven
surpasses the infrastructure capacity; therefore, less driving will reduce congestion especially during “rush” hours. This congestion
leads to increased air pollution as cars idle in place for extended periods of time, and stop and start as traffic dictates. An effort to
reduce the number of miles driven is much less costly than developing additional road infrastructure. Riding a bicycle or walking for
short trips can avoid 23 billion miles driven every year2 — and has the additional benefit of reducing congestion and even further
decreasing congestion-related pollution.
Active Transportation and Parks and Recreation 10PART IV
SOCIAL EQUITY: TRANSPORTATION
ACCESS FOR ALL School Serving a Low-Income Community in
Although car ownership is common in the United States, Detroit, Michigan Successfully Implements
there are many people who do not own a vehicle or are Safe Routes to School Program
unable to drive. Eighty million Americans — approximately
1/4 of the population — are disabled, too young, too old Maybury Elementary School is a public school serv-
or too poor to drive.49 Families with an annual income of ing a low-income, largely Latino community in South-
less than $25,000 are nine times more likely not to own a west Detroit. Most students at this school partici-
car than families with an income of more than $25,000.50 pate in a free or reduced lunch program. Childhood
If automobiles are the only feasible mode of transporta- obesity and diabetes are also major concerns at the
tion, these groups are placed at a great economic and school.53 Prior to 2008, students were not able to
social disadvantage because of the reduced accessibility walk to school due to unsafe sidewalks, a high crime
to services and social networks. Active transportation al- rate, and poor lighting in a nearby park. In 2005, the
lows easy access to parks, bike lanes, libraries, schools, school was awarded $300,000 by the Safe Routes
clinics/hospitals, full service grocery markets, and one’s to School Program, most of which was designated
home and place of employment. Poorly maintained or
for infrastructure improvements.55 In 2008, Detroit’s
developed active transportation infrastructure can force
Department of Public Works completed all infrastruc-
people to walk and bike unsafely, or simply not make their
ture improvements. The school has since created a
trip at all.52
“walking school bus” whereby parents volunteer to
Since the current transportation law, MAP-21, expired be walking school bus “leaders” resulting in more
September 30, 2014, a new proposal known as the students walking to school. This demonstrates that
GROW AMERICA Act (Generating Renewal, Opportunity, active transportation can indeed provide low-income
and Work with Accelerated Mobility, Efficiency, and Re- parents with the option of safely walking their chil-
building of Infrastructure and Communities throughout dren to school.
America Act) includes policy recommendations from the
U.S. Department of Transportation for reauthorization
of the federal surface transportation program.51 This act is a four-year, $302 billion transportation reauthorization propos-
al for transportation investments in the United States.53 This legislation highlights the importance of transportation equity
through its focus on transportation projects that are more affordable, reliable and that connect communities to places of
employment, education and critical services. Currently, 45 percent of Americans do not have access to public transportation,
therefore limiting their employment and education options. The proposal includes funding for the Rapid Growth Area Tran-
sit Program, which will be used to build new bus rapid transit and other multimodal transit for growing communites.53 Since
low-income workers are dependent on active transit, the proposal requires states with the highest pedestrian and bicycle fa-
talities to spend their safety funds on addressing these issues and also consider the needs of pedestrians and bicyclists when
planning highways.52
Active transportation facilities provide people with the option to choose how they prefer to travel. Safe and convenient sidewalks, trails
and bike paths remove the socially unjust barriers to mobility by providing citizens with access to viable modes of transportation.
11 Active Transportation and Parks and RecreationCONCLUSION
For more than 30 years, park and recreation agencies have played an instrumental role in facilitating active transportation proj-
ects. Since active transportation and parks and recreation continue to share four overarching goals — stimulating economic
activity, building healthy communities, promoting conservation and achieving transportation access for all citizens — parks and
recreation agencies should be viewed as essential and critical components of any strategy to support active transportation. Any
plan with the goal of providing or expanding active transportation features for a community should have consistent participation
from the community park and recreation agency from inception. Communities across the country should be expanding efforts to
support active transportation as part of their planning process, and bring opportunities for citizens to safely walk, run and bike
near their homes. Expansion of active transportation offers the ability to advance the interests of community health, conservation
and social equity in a cost-effective manner while driving local economic activity. Parks and active transportation amenities such
as trail networks act as natural benefit multipliers and are essential partners that work together to create a network of places to
get outdoors, exercise, or get to work in an enjoyable way that make cities better places to live.
Active Transportation and Parks and Recreation 12ENDNOTES
1
Built Environment & Active Transportation. “The Benefits of Active Transportation” Physical Activity Strategy. Ed.
Andrea Keen. Retrieved on September 7, 2011: http://physicalactivitystrategy.ca/pdfs/BEAT/BEAT_Publication.pdf
2
Rails to Trails Conservancy. 2008. Active Transportation for America: The Case for Increased Federal Investment for Bicycling
and Walking. Supported by Bikes Belong Coalition.
3
American Public Health Association. 2010. The Hidden Health Costs of Transportation. Urban Design 4 Health Inc.
4
Rails to Trails Conservancy. 2012. Analysis of Transportation Bill MAP-21. Retrieved on May 12, 2014: https://secure2.
convio.net/rtt/site/SPageNavigator/20120701_Bill_Analysis.html;jsessionid=4658022FAAF2BE77E2D9435F0B91816A.
app252a
5
Cited in Kuzmyak, Richard & Dill, Jennifer. 2012. Walking and Bicycling in the United States. TR News. Retrieved on May 12,
2014: http://onlinepubs.trb.org/onlinepubs/trnews/trnews280.pdf
6
Smart Growth America. (n.d). Benefits of Complete Streets. Retrieved on May 12, 2014: http://www.smartgrowthamerica.
org/documents/cs/factsheets/cs-gasprices.pdf
7
U.S Federal Highway Transportation Administration. 2013. Traffic Volume Trends. Retrieved on May 12, 2014: https://www.
fhwa.dot.gov/policyinformation/travel_monitoring/tvt.cfm
8
Puentes, R. & Tomer, A. 2008. The Road…Less Traveled: An Analysis of Vehicle Miles Traveled Trends in the U.S. Washington,
DC: Brookings Institution.
9
Garrett-Peltier, H. 2011. Pedestrian and Bicycle Infrastructure: A National Study of Employment Impacts. Political Economy
Research Institute – University of Massachusetts Amherst.
10
Hawkins, Jonathon. 2013. The Economic Impacts of Active Transportation in New Jersey. New Jersey Pedestrian and Bicycle
Resource Center.
11
Cited in Smart Growth America. (n.d). Complete Streets Spark Economic Revitalization. The Benefits of Complete Streets 7.
Retrieved on May 13, 2014: http://www.smartgrowthamerica.org/documents/cs/factsheets/cs-revitalize.pdf
12
NCDOT. 2004. The Economic Impact of Investments in Bicycle Facilities: A Case Study of the North Carolina Northern Outer
Banks. Department of Bicycle and Pedestrian Transportation.
13
Iowa Natural Heritage Foundation. 2011. The High Trestle Trail. HTT Overview and Links.
14
Hein, L. 2011. Iowa Trails Lead to High Trestle Bridge. American Trails.
15
KCCI8. 2011. Bike Bridge Brings Business Boom. Retrieved on August 23, 2011: http://www.kcci.com/video/28263645/
detail.html
16
Trails and Greenways Clearinghouse. 2007. Economic Benefits of Trails and Greenways.
17
Urban Land. 2014. Open Spaces and Active Transportation. Retrieved on May 13, 2014: http://urbanland.uli.org/planning-
design/open-spaces-and-active-transportation/
18
The National Center for Chronic Disease Prevention & Health Promotion. 2011. The Obesity Epidemic. The Center for
Disease Control and Prevention TV.
19
Healthy People 2010. 2010. Reduce the Proportion of Adults who Are Obese. Retrieved on October 10, 2011: http://www.
healthypeople.gov/2010/document/html/objectives/19-02.htm
20
Center for Disease Control and Prevention. 2011. How much physical activity do you need? Physical Activity for Everyone.
21
Center for Disease Control and Prevention. 2011. Measuring Physical Activity Intensity. Physical Activity for Everyone.
22
Furie, G. & Desai, Mayur. 2012. Active Transportation and Cardiovascular Disease Factors in U.S Adults. American Journal of
Preventative Medicine. 43(6): 621-628
23
Centers for Disease Control and Prevention and the President’s Council on Physical Fitness and Sports, Healthy People
2010, Conference Edition (2000), Section 22—Physical Activity and Fitness
24
Wang, C., McPherson, K., Marsh, T., Gortmaker, S. & Brown, M. 2011. Health and Economic Burden of the Projected Obesity
Trends in the USA and UK. The Lancet. 378(9793): 815-825
25
Greenways Incorporated. 1992. Transportation Potential and Other Benefits of Off-Road Bicycle and Pedestrian Facilities (for
FHWA). Washington DC.
26
Samimi, A., Mohammadian, A. & Madanizadeh, S. 2009. Effects of Transportation and Built Environment on General Health
and Obesity. Transportation Research Part D. 14: 67-71.
27
Cited in Pedestrian and Bicycle Information Center. 2012. Pedestrian and Bicycle Crash Statistics. Retrieved on May 16,
2014: http://www.pedbikeinfo.org/data/factsheet_crash.cfm
28
National Highway Traffic Safety Administration. 2012. National Survey of Bicyclist and Pedestrian Attitudes and Behavior.
Retrieved on May 16, 2014: http://www.nhtsa.gov/nti/811841
13 Active Transportation and Parks and Recreation29
U.S Bureau of Transportation Statistics, Research and Innovative Technology Administration and Department of
Transportation. 2009. Pocket Guide to Transportation.
30
Cited in SLO County Bicycle Coalition. (n.d). Levels of Bicycling and Walking, Bike/Pedestrian Fatalities and Funding in the U.S.
Retrieved on May 16, 2014: http://slobikelane.org/category/safety/page/4/
31
Urban Land Institute. 2013. Intersections: Health and the Built Environment. Retrieved on May 16, 2014: http://uli.org/wp-
content/uploads/ULI-Documents/Intersections-Health-and-the-Built-Environment.pdf
32
Andersen, L., Schnohr, P., Schroll, M. and Hein, H. 2000. All-cause mortality associated with physical activity during leisure
time, work, sports and cycling to work. Archives of Internal Medicine. 160: 1621–1628
33
Rails to Trails Conservancy. 2007. Health and Wellness Benefits. Trails and Greenways Clearinghouse.
34
New York City Department of Health and Mental Hygiene. 2011. Health Benefits of Active Transportation in New York City.
10(3).
35
Davison, K., Werder, J. & Lawson, C. 2008. Children’s Active Commuting to School: Current Knowledge and Future Directions.
Preventing Chronic Disease. 5(3): A100
Orenstein, M., Gutierrez, N., Rice, T., Cooper, J. and Ragland, D. 2007. Safe Routes to School Safety and Mobility Analysis. UC
36
Berkeley Traffic Safety Center. Paper UCB-TSC-RR-2007-1.
Alexander, L. et al. 2005. The Broader Impact of Walking to School among Adolescents: Seven-day accelerometry based study.
37
British Medical Journal. 331 (7524).
Cooper et al. 2003. Commuting to School: Are children who walk more physically active? American Journal of Preventative
38
Medicine. 25 (4)
Pucher, J., Buehler, R., Bassett, D. & Dannenberg, A. 2010. Walking and Cycling to Health: A Comparative Analysis of City, State
39
and International Data. American Journal of Public Health. 100(10): 1986-1992
American Lung Association. 2014. Smart Growth is Healthy Growth for California. Retrieved on May 16, 2014: http://www.lung.
40
org/associations/states/california/advocacy/fight-for-air-quality/smart-growth-for-california.html
Ewing, Reid. 2007. Growing Cooler: the Evidence on Urban Development and Climate Change Urban Land Institute/Smart
41
Growth America
Cited in Pedestrian and Bicycle Information Center. (n.d). Environmental Benefits of Bicycling and Walking. Retrieved on May
42
19, 2014: http://www.pedbikeinfo.org/data/factsheet_environmental.cfm
Frank, L. , Sallis, J., Conway, T., Chapman, J., Saelens, B. & Bachman, W. 2006. Many Pathways from Land Use to Health:
43
Associations between Neighborhood Walkability and Active Transportation, BMI and Air Quality. Journal of the American
Planning Association.7 2(1)
Federal Highway Administration. 2012. Non-motorized Transportation Pilot Program. Retrieved on May 19, 2014: http://www.
44
fhwa.dot.gov/environment/bicycle_pedestrian/ntpp/
Better Environmentally Sound Transportation. 2004. The Business Case for Active Transportation: The Economic Benefits of
45
Walking and Cycling. Go for Green.
46
Implementing Complete Street 4. Sustainable Complete Streets. National Complete Streets Coalition.
47
Trails and Greenways Clearinghouse. 2007. Enhancing the Environment with Trails and Greenways
Cited in Gulf Restoration Network. (n.d). Wetlands. Retrieved on May 19, 2014: https://healthygulf.org/our-work/wetlands/
48
wetland-importance
Baxter, John. 2011. Essential Factors of Active Transportation: Analysis and Recommendations for Downtown Atlanta. Master
49
of City and Regional Planning Option Paper.
Pedestrian and Bicycle Information Center. (n.d). Social Justice Issues Related to Bicycling and Walking. Retrieved on May 20,
50
2014: http://www.pedbikeinfo.org/data/factsheet_social.cfm
United States Department of Transportation. 2014. Grow America: An Overview. Retrieved on May 20, 2014: http://www.dot.
51
gov/grow-america/fact-sheets/overview
United States Department of Transportation. 2014. GROW AMERICA: Building Ladders of Opportunity to the Middle Class.
52
Retrieved on May 20, 2014: http://www.dot.gov/grow-america/fact-sheets/opportunity
Robert Wood Johnson Foundation. (n.d). Safe Routes to School at Maybury Elementary School in Detroit. Retrieved on May 20,
53
2014: http://www.rwjf.org/content/dam/farm/reports/reports/2012/rwjf72723
Active Transportation and Parks and Recreation 1422377 Belmont Ridge Road
Ashburn, VA 20148-4501
703.858.0784
www.nrpa.org
18 Active Transportation & Parks and RecreationYou can also read