CONSIDERATIONS FOR CLIMATE CHANGE MITIGATION IN IRELAND1
←
→
Page content transcription
If your browser does not render page correctly, please read the page content below
IRELAND

CONSIDERATIONS FOR CLIMATE CHANGE MITIGATION
IN IRELAND1
Ireland has adopted an ambitious and far-reaching climate action plan, which will require strong and
sustained policy efforts to meet the new emission reduction targets consistent with the EU climate
goals. Complementing a gradually increasing carbon price with a wide range of sector-specific policies
will help reduce the transition costs and protect vulnerable groups in the shift to a greener, more
sustainable, and fairer economy. The post-COVID recovery provides an opportunity to accelerate the
adoption of climate-friendly policies in sync with EU-level initiatives, including by boosting public
investment in transportation networks and electricity grids for clean energy, subsidizing building
renovation to achieve greater energy efficiency, and supporting R&D in new low-emission technologies
and carbon sequestration, including through agronomic measures and the restoration of peatlands.2

1.      In March 2021, the Irish government has approved the Climate Action and Low Carbon
Development (Amendment) Bill 2021, which once passed, will legislate a target to halve
greenhouse gas (GHG) emissions by 2030 and to achieve net carbon neutrality no later than
2050. Building on earlier commitments under the Climate Action Plan 2019, this will make Ireland’s
climate action agenda one of the most ambitious worldwide. Ireland has already committed to a
long-term trajectory of annual increases in the carbon tax rate leading to a rate of €100 per ton in
2030. Budget 2021 has increased the rate by €7.50 to €33.50 as an important first step towards
making carbon pricing more effective and places Ireland above the EU average (Figure 1)3 and
boosting investment in low-emission public transport, energy-efficient housing, and renewable
energy production. The law also introduces a legal requirement to adhere to five-year carbon
budgets, consistent with the Paris Climate Agreement and sets emission ceilings on all sectors. The
Climate Change Advisory Council is expected to propose to the Government the country’s first five-
year carbon budget later this year.

2.     However, progress in climate change mitigation over the past two decades has been
slow and uneven due to high economic and population growth and the sectoral specificity of

1 We thank members of the EUR Climate Working Group as well as staff at the Department of Finance, the

Department of Public Expenditure and Reform, the Department of the Environment, Climate and Communications, as
well as the Central Bank of Ireland for their helpful feedback and suggestions. We are also very grateful for the
insights from Prof. Peter Thorne (Maynooth University Department of Geography).
2   In fact, peat bogs capture more CO2 than forests, and they act like sponges absorbing excessive rainfall.
3Ireland’s planned increase in carbon taxation is in line with that of other countries—for example, Sweden, Finland,
and Denmark have robust carbon taxes for sectors subject to the EU Effort Sharing Regulation. Germany and Canada
have also announced ambitious plans, and the EU pledged to cut emissions from 40 percent to 55 percent below
1990 levels by 2030.

2       INTERNATIONAL MONETARY FUND

                        ©International Monetary Fund. Not for Redistribution
IRELAND
emissions. Ireland has missed 2020 EU climate targets 4 by a significant margin. High economic
growth since 2005 and sectoral specificity of the emissions (with one-third of emissions coming from
agriculture) largely explain the limited progress in emission reduction. So far, the strong emissions
reductions have come from the power and industry sectors, which are, for the most part, already
subject to carbon pricing via the EU Emissions Trading System (ETS). Other sectors, where the
emission reductions remain a national competence, have seen less progress (Figure 2). Challenges
are particularly large in the buildings and agricultural sectors, which together contribute three times
as much to emissions in Ireland than they do in other EU countries.5 In housing, population growth
and smaller households partially offset emission reduction from higher energy efficiency and
improved energy mix (Figure 7). The projected GHG emissions in 2019 were merely about 15 percent
below 2005 levels, and strong mitigation policies are needed to meet the proposed pace of
emissions reduction at an average of 7 percent a year to 2030 (and net zero emissions by 2050).
Ireland’s high share of biogenic emissions from agriculture makes effective abatement particularly
challenging and calls for innovative solutions, including incentivizing carbon sequestration through
the agronomic measures and the restoration of peatlands.
Figure 1. Ireland: Carbon Pricing in the EU and Ireland
Emission Pricing Coverage European Countries: Tax-based Carbon Prices
(Percent) (U.S. dollars per tCO2eq., end-2020) 1/
100 140
90 At or above EUR5 At or above EUR30 120 117
80 100 (Planned, 2030) 3/
70 80
60 60
50 40
40 20
0.1 0.4
30 0
20
ICE
MEX
FIN
PRT
SVN
ESP
EST
SIG
JPN
ZAR
ARG
IRL
LVA
NOR
GBR
UKR
CAN 2/
FRA
POL
CHL
COL
SWE
DNK
LIE
CHE
10
0
EU+UK* Ireland EU Other non-EU Non-European
Sources: OECD (2018); and IMF staff calculations. Europe
* Median for Austria, Belgium, Czech Republic, Denmark, Spain, Estonia, Finland, Sources: national authorities; World Bank; and IMF staff calculations.
France, Germany, Greece, Hungary, Ireland, Italy, Luxembourg, Latvia, 1/ Applies mostly to transport fuels and excludes ETS for the energy sector.
Netherlands, Poland, Portugal, Slovakia, Slovenia, Sweden, and United Kingdom. 2/ Canada has also regional carbon taxes that are higher (British Columbia) or lower
(Newfoundland, Labrador) than the national rate.
3/ At the USDEUR exchange rate of 1.17 (as of end-March 2021).
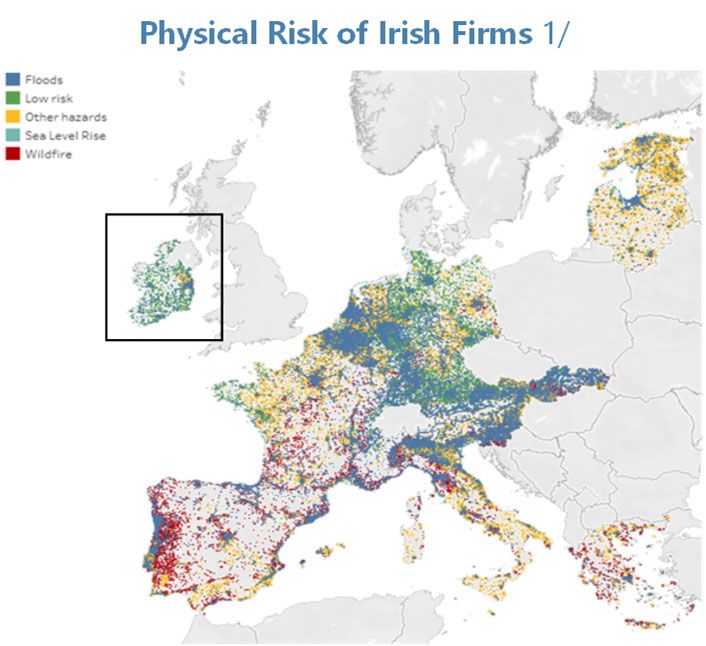
3. There is also growing awareness of the significant climate change-related physical risks
in Ireland (and their uneven impact across the country), which has made policy discussions on
effective climate policies more pressing. Some of these risks from extreme events, like heatwaves,
landslides, floods, or storms, as well as long-term, progressive shifts include:
4
In its European Semester Country Report for Ireland 2019, the European Commission observed that Ireland has so
far failed to decouple its economic growth from GHG emissions and air pollutants. The EU Effort Sharing Regulation
target required a 20-percent GHG emissions reduction by 2020 relative to 1990; however, GHG emissions in Ireland
declined by merely 4 percent. According to EPA projections, Ireland is currently not on the right trajectory to meeting
the 2030 or 2050 EU emission reduction targets (prior to the adoption of recent measures in March 2021).
5
According to the Sustainable Energy Authority of Ireland (SEAI), the country also still relies excessively on fossil fuels
for transport, heating and electricity production, with over 90 percent of all energy used in 2017 coming from fossil
fuels.
INTERNATIONAL MONETARY FUND 3
©International Monetary Fund. Not for Redistribution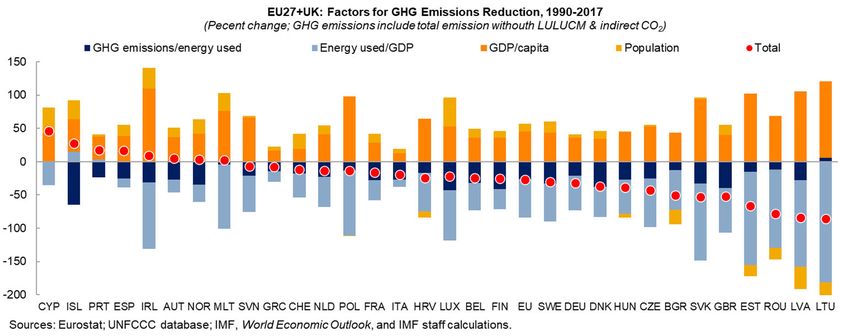
IRELAND
Severe coastal flooding due to rising sea levels, which make it more likely that storm surges and
spring high tides coincide in the near future, especially in Dublin and Cork, which are built on
reclaimed saltwater marshes,6 and
Growing weather variability, including more frequent extreme rainfall, which could increase the
severity of river flooding and exacerbate the water overflow in combination with storm surges,
and a re-emergence of droughts (together with a higher volatility in rainfall) adversely affecting
the crop cycle (Figure 3).
Figure 2. Ireland: Climate Change Mitigation—Overview of GHG Emissions
Over the last decade, EU GHG emissions have decreased noticeably but have remained largely unchanged in Ireland.
EU: Total GHG Emissions' 2019 Projections and Targets Ireland: GHG Emissions' 2019 Projections and 2030 Target
(GtCO2e) (MtCO2e)
6 80
70
5
60
4 50
-38%
40
3 -46%
Historical emission
-55% 30
Projections with existing measures
2 Historical emission 20
Projections with additional measures (pre-Climate Bill)
Projections with existing measures
1 10
Linear path to post-Green Deal target Existing (EU) and revised (Climate Bill) 2030 target*
Green Deal targets (relative to 1990 level) 0
-100%
0
1990
1995
2000
2005
2010
2015
2020
2025
2030
2035
1990
1995
2000
2005
2010
2015
2020
2025
2030
2035
2040
2045
2050
Sources: European Environment Agency; European Commission; and authors.
Sources: European Environment Agency; European Commission; and authors. Note: Reflects the emission-weighted average of the 43-percent reduction target for energy (subject to
ETS) and the emission reduction in other sectors by either 30 percent under the EU Effort Sharing
Regulation or 50 percent under the Climate Action Bill 2021.
Most of the domestic emissions in Ireland are from agriculture and buildings where the emission reduction was the smallest.
Greenhouse Gas Emissions by Sector Ireland: Greenhouse Gas Emissions by Sector
(Percent) (Percentage points, 2005-2017)
Other Ireland EU27+UK
2%
Total
Other
5% Agriculture
12% Power
Power
19%
Agriculture Power Building
33% 27% 14% Industry
Transport
Building
20% Industry
20%
Building Transport Transport
Industry 13% 22%
13% Percent change
Agriculture Contributions to total growth
Source: United Nations Framework Convention on Climate Change.
-30 -20 -10 0 10
Note: Excluding international aviation and shipping.
Sources: United Nations Framework Convention on Climate Change and IMF staff calculations.
Note: Excluding international aviation and shipping.
6An average sea level rise of between 0.5 to 1 meter by the end of the century, in combination with storm surge
events, could result in as much as 1,000km2 of coastal lands around Ireland being inundated by the sea if no
protective measures are undertaken.
4 INTERNATIONAL MONETARY FUND
©International Monetary Fund. Not for Redistribution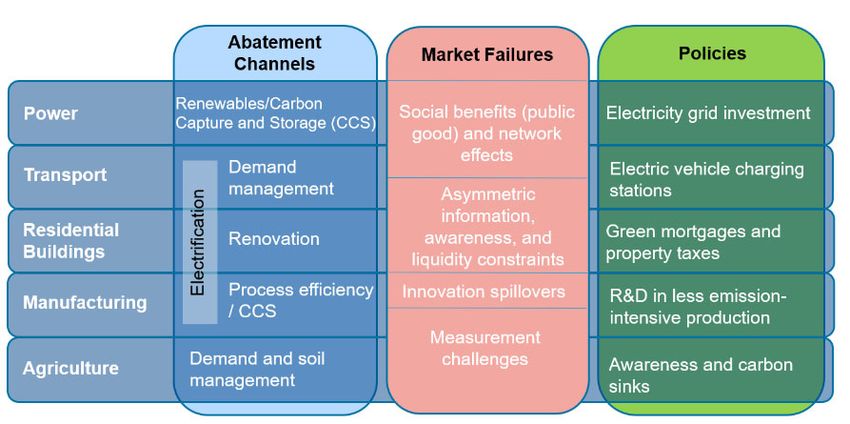
IRELAND

          Figure 3. Ireland: Climate Change—Overview of Physical and Transition Risks

         Frequency of Reported Losses from Natural Disasters
                             (1990-2014)

                                                  Flood
                   23.5%                          Storm

                                76.5%

       Sources: European Central Bank; European Environmental Agency (https://www.eea.europa.eu/data-and-
       maps/figures/key-past-and-projected-impacts-and-effects-on-sectors-for-the-main-biogeographic-regions-of-
       europe-5/map-summary-climate-change-2008.eps/image_large); OFDA/CRED—International Disaster Database
       (Université catholique de Louvain Brussels); European Investment Bank; and authors.

       1/ Forward-looking climate change-related physical risk score (for different natural disasters) based on ECB
       calculations (Alogoskoufis and others, 2021; de Guindos, 2021) using the Four Twenty Seven dataset. Each dot
       corresponds to a firm in the sample. Gaps in the mapping are due to (1) economic activities being concentrated in
       specific industrial areas in some countries, and (2) unavailable data for companies located at latitudes above 60
       degrees for flood risk. Other hazards include water stress, heat stress, hurricanes, and typhoons.
       2/ Based on the Climate Risk Country Score developed by the European Investment Bank (Ferrazi and others, 2021).

4.       Continued effort is needed to meet the ambitious National Development and Climate
Action plans. The recently legislated higher carbon tax, with a trajectory to 2030, will help finance
this effort, and sector-specific policies will help reduce the costs and protect vulnerable groups in
the transition to greener and more sustainable growth. In addition, many co-benefits of climate
change mitigation are likely to further boost public support, especially if effective resource
reallocation associated with a just transition helps engender a more sustainable and inclusive
economic model (Figure 4).

5.      Credible carbon pricing within a well-designed package of mutually reinforcing
policies needs to be at the heart of Ireland’s climate policy, consistent with the current EU
climate agenda (Chen and others, 2020). The predictable and progressive carbon price path will
create incentives for households and firms to reduce their emissions and steer consumption and

                                                                                INTERNATIONAL MONETARY FUND                5

                     ©International Monetary Fund. Not for Redistribution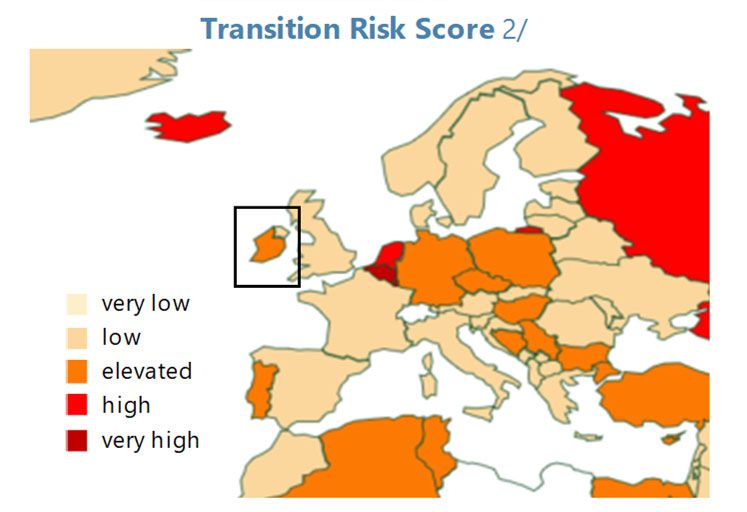
IRELAND

investment toward sustainable activities and green technologies, which could result in significant
economic gains (IMF, 2020). It will also provide additional revenues, which will help fund the just
transition by supporting vulnerable groups and allow the government to cut labor and other
distortionary taxes, bolster public transport, energy-efficient housing, and renewable energy.

            Figure 4. Ireland: Co-Benefits and Market Failures of Climate Change Mitigation

                                       Co-Benefits of Climate Change Mitigation
                                  Sectors                     Abatement                  Co-Benefits

                                                                                      New jobs and higher
                                  Power                                                  productivity
                                                                                        Fuel cost savings
                                                       Renewable energy, energy
                                 Industry              efficiency, energy storage,       Energy security
                                                         and smart power grids
                                                                                     Less traffic congestion

                                 Building                                              Active lifestyle and
                                                          Low-emission public           improved health
                                                      transportation and personal
                                                                mobility                  Food security
                                Transport
                                                                                     Income for smallholders

                                                       Circularity, natural carbon    Restoration of natural
                               Agriculture              sinks, and biodiversity       capital and ecological
                                                                                             systems

                                     Market Failures of Climate Change Mitigation

    Sources: Climate Diplomacy; Grantham Research Institute on Climate Change and the Environment (London School of
    Economics); and authors.

6       INTERNATIONAL MONETARY FUND

                         ©International Monetary Fund. Not for Redistribution
IRELAND
6. Complementary sectoral policies will be needed where there are other market failures,
carbon taxation is difficult to implement, or emissions are difficult to measure (Arregui and
others, 2020; Arregui and Jobst, 2020; Jobst and Arnold, 2020). This is particularly relevant for
abatement efforts aimed at reducing the high contribution of emission-intensive agriculture to total
emissions in Ireland (Figure 4):
In the transport sector, evidence suggests that countries with CO2-differentiated vehicle taxes
have typically achieved a greater reduction in Europe: Zero- and Low-Emission Car Adoption (2017)
(Countries with highest share relative to new car sales)
emissions. The motor tax and vehicle 45
40 Battery vehicles
registration tax changes favoring electric 35 Plug-in hybrid vehicles
vehicles and hybrids introduced in Ireland’s 30
Budget 2021 represent a move in the right 25
20
direction and usefully complement existing 15
financial support for the purchase of electric 10
5
vehicles (Table 1 below) but could be made 0
more progressive compared to other EU+UK CHE FIN BEL SWE IRL* NOR
Sources: ACEA 2018; European Environment Agency; ICCT 2019; and IMF staff
countries. While more than 10 percent of
7 calculations. Country list uses International Organization for Standardization (ISO)
country codes.
new car sales are already electric or hybrid * as of end-2019.
vehicles (Chart), a comprehensive strategy is CO2-Based Component of Registration Tax
(Thousands of euros)
needed to achieve the government’s objective 10 United Kingdom
of increasing the number of electric vehicles France
Netherlands
5
on Irish roads to one million by 2030. It
Vehicle tax (€1,000)
Portugal
Norway
Feebate
should encompass phasing out fossil fuel 0
allowances (Figure 7),8 tighter emissions
-5
standards for vehicles, and incentives for
clean vehicles, such as “feebates,” which -10
combine higher taxes on emission-intensive 0 50 100 150 200
CO grams per km
2
vehicles and subsidies for low-emission ones Sources: European Automobile Manufacturers Association; and IMF staff calculations.
(Chart). Note: France includes maximum €6k bonus scheme for low emissions cars. United
Kingdom does not reflect grants for low emissions.
In the residential building sector, more than 95 percent of all buildings in Ireland are energy
inefficient. However, new construction will take too long to improve their energy efficiency
consistent with the required trajectory of emission reduction, even though according to
estimates in Arregui and others (2021), the required investment would be self-financing in about
12 years (for a total cost of 20 percent of GDP to achieve optimal energy efficiency of all private
7 There is a wide range of existing support measures that are available already, including purchase and home charger
installation grants, vehicle registration tax (VRT) relief, toll incentives, and reduced motor tax rates. Expenditure on all
these schemes has accelerated rapidly especially since 2015 (Kevany, 2019).
8 Note that Irish fossil fuel subsidies are low by international standards and are mainly concentrated on the taxation
side. On the expenditure side, most payments are in the form of fuel allowance, which are critical to protecting the
most vulnerable households. Thus, phasing out these subsidies requires careful consideration to safeguard a just
transition towards more sustainable growth without adverse distributional consequences.
INTERNATIONAL MONETARY FUND 7
©International Monetary Fund. Not for RedistributionIRELAND
dwellings).9 The Program for the Government and the Climate Action Plan therefore set
ambitious goals to reduce GHG emissions from buildings, including homes, with targets to
retrofit 500,000 homes to a Building Energy Rating (BER) of “B2” (or cost optimal equivalent) and
to install 400,000 heat pumps in existing buildings over the next ten years. Currently committed
exchequer funding would cover part of the investment costs. The scale and pace of current
renovation are nonetheless held back by liquidity constraints of poorer households and lack of
consumer demand, including due to limited information on potential energy cost savings
(Figure 5).10,11 The Government’s plans to subsidize retrofitting loans and increase the energy
efficiency of public buildings are welcome, but more action is needed to achieve the
government’s ambitious plan of retrofitting half a million houses by 2030. A key policy lever
would be the introduction of binding targets for energy efficiency improvements to accelerate
the renovation rate and/or making the availability of energy efficiency ratings mandatory for all
real estate transactions.12 Designing energy-dependent property taxes13 and options for “on-bill
financing” of efficiency investments could help overcome owner-renter cost-benefit mismatches,
but the impact of such mechanisms on rental accommodation supply must first be fully assessed
and understood.
Table 1. Ireland: Personal Incentives for the Purchase of Low-Emission Vehicles (2019)
Sustainable Energy Authority of
Grant of up to €5,000 for the purchase of a new BEV or PHEV (since 2011)
Ireland (SEAI) Grant Scheme
VRT Relief Tax relief of up to €5,000 for new BEVs until end-2021 (and up to €2,500 for
new PHEVs until end-2019)
Charging Supports Grant of up to €600 for the installation of home charger points for buyers
of new and second-hand Evs
Toll Incentive Regime Under the Electric Vehicle Toll Incentive Scheme, BEVs and PHEVs qualify for
50 and 25 percent toll reductions, respectively, up to a maximum of €500
and €1,000 as annual threshold for private and commercial vehicles,
respectively. Higher discounts of 75 and 50 percent for BEVs and PHEVs,
respectively, apply to off-peak travel on the M50.
Low Motor Tax Electric vehicles qualify for the lowest motor tax band available.
Fuel Excise / Carbon Tax No fuel excise duties applied to electricity consumption (whereas these
duties represent a significant proportion of diesel and petrol prices).
Sources: Kevany (2019) and authors.
Note: Battery Electric Vehicles (BEVs) and Plug-in Hybrid Vehicles (PHEVs). This table covers central Government
incentives only. Local Authorities also provide incentives, including free parking, in certain instances.
9 Estimates by the Irish authorities suggest a somewhat higher amortization period of about 15 years.
10 Given the high household savings rate, many Irish households do not face liquidity constraints.
11The European Commission has published in October its Renovation Wave Strategy, which aims at improving the
energy performance of buildings in the EU. By strengthening standards and regulations while also providing access to
well-targeted funding, the strategy intends to at least double renovation rates in the next ten years.
This would require introducing legislative or other regulatory requirements regarding energy efficiency levels,
12
whose implementation is likely to be faster and more effective for the commercial building stock.
13 However, energy-dependent property taxes are likely to have significant adverse distributional consequences.
8 INTERNATIONAL MONETARY FUND
©International Monetary Fund. Not for RedistributionIRELAND
Figure 5. Ireland: Climate Change Mitigation—Residential Buildings
Enhancing the energy efficiency to the highest level (EPC=A) through retrofitting and renovations would cost about 20
percent of GDP.
EU+UK: Distribution of Building Stock by EPC Class 1/ EU+UK: Total Investment Needs for Retrofitting and Electrification
(Percent of dwellings) (Percent of GDP)
Label A (=Target) Label B Label C Label D Label E and below 100
100
90 90 Upgrade housing stock to EPC=A
80 80 Plus electrification 1/
70
60 70
50 60
40
30 50
20
40
10
0 30
20
10
0
HUN
BGR
GBR
EST
NLD
BEL
PRT
LTU
DEU
FRA
ITA
ESP
IRL 2/
SLV
DNK
Sources: BPIE; CSO (Ireland); European Environment Agency; Eurostat (EU Building Stock
Observatory); and IMF staff calculations.
Sources: CSO (Ireland); European Environmental Agency, Eurostat; and IMF staff calculations.
1/ Countries with no central database (e.g., Poland) or with limited information (Czech Republic,
1/ Includes cost for electric heatpump only
Romania, Slovak Republic) are not included.
2/ percent of GNI*
On average, such investment would amortize in less than 12 years due to significant energy cost savings and could reduce
GHG emissions from buildings in Ireland by more than two-thirds.
EU+UK: Amortization Time of Investment in Energy Efficiency EU+UK: Potential Emission Reduction from Renovation/Retrofitting
Renovation (EPC=A) (EPC=A) and Electrification
(Years) (tCO2 per capita, U.N. mean lifecycle emission projection per GWh)
4.5
25
Combined effect on energy efficiency
4
Electrification
20 Greater energy efficiency (upgrade to EPC=A)
3.5
Remaining emissions
15 3
11.6
2.5
10
2
5 1.5
1
0
0.5
LTU
DEU
ESP
ITA
EU+UK
FRA
HUN
IRL
EST
SVN
PRT
BEL
GBR
FIN
BGR
NLD
DNK
0
Sources: BPIE; Central Statistics Office (Ireland); European Environment Agency; Eurostat (EU
DEU
ITA
ESP
LTU
HUN
DNK
FRA
FIN
BEL
SVN
IRL
NLD
GBR
EST
BGR
PRT
Building Stock Observatory); and IMF staff calculations.
Note: Median income level for each country is assumed. Sources: European Environment Agency; Eurostat; UNFCCC; and IMF staff calculations.
INTERNATIONAL MONETARY FUND 9
©International Monetary Fund. Not for RedistributionIRELAND
In agriculture, biogenic emissions are difficult to reduce and have a relatively higher contribution
to global warming over the near term. At the same time, given its high exposure to changing
weather patterns, agriculture stands to benefit most from effective climate change mitigation. The
impact is highly specific to crop selection and varies by location, with potential knock-on effects on
agricultural supply chains and food security. Land use and management in agriculture offers
significant potential for carbon sequestration via agronomic measures (i.e., “negative emissions”),
such as non-tilling to support roots growth, maintaining permanent pasture, and protecting
grassland.14 Methane emissions (mostly from livestock production through enteric fermentation
and manure management) could be reduced by diversifying away from beef production toward
non-ruminant animals (such as pigs and poultry), and to some extent, by applying enhanced
farm management practices and expanding the use of new technologies, such as food additives,
breeding programs, barn modernization, and animal healthcare, which have proved very
effective in Ireland (Figure 6).15 Methane digesters can turn manure into biogas to substitute the
energy use of farms; and, if implemented at scale, could also contribute to more sustainable
overall energy generation. Finally, rewetting and rewilding peat bogs across the country (and
making them more anaerobic) together with protecting (and restoring) forests (which creates co-
benefits from greater biodiversity) offers an equally safe and effective way to achieve meaningful
carbon dioxide removal from the atmosphere and provides a permanent carbon sink. These
abatement measures would ideally be complemented by demand-side policies aimed at shifting
consumer choices away from emission-intensive products, such as dairy and beef. Policies could
include removing preferential VAT rates and introducing GHG emissions footprint labels on food,
which is consistent with the EU’s Farm to Fork Strategy make food systems fair, healthy and
environmentally-friendly.16
14Even though sequestering carbon in soil is relatively safe and economical, it is also slow, potentially reversible (due
to changes in temperature and the extent to which carbon is stored near the surface), and significantly depends on
soil type. Also, more time is needed to better estimate the soil carbon sink potential as precise measurement remains
challenging.
15Recent research indicates significant potential of food additives in reducing methane emissions from ruminant
animals. For instance, adding red seaweed (asparagopsis) as a feed supplement can lower methane emissions by
more than 80 percent without affecting meat quality. However, there is a lot of uncertainty around the specific impact
such additives may have, including resource availability, sustainability, and impact on human health.
16For Ireland, the concept of “ocean farming” sounds naturally attractive conceptually, but the gradual increase of
ocean acidification has also affected fisheries, which means that hyper-mobile sea fauna could be a challenge for any
serious planning in this area.
10 INTERNATIONAL MONETARY FUND
©International Monetary Fund. Not for RedistributionIRELAND
Figure 6. Ireland: Climate Change Mitigation—Agriculture
Irish continues to have the most emission-intensive agricultural sector due to the high share of livestock, but it has also
made the largest progress in reducing the emissions intensity ...
Agriculture: Ratio between Share of Emissions and Share of Agriculture: GHG Emissions Per Value Added
Value Added (MtCO2 equivalent)
(Multiple)
25 16
2018 2005 14 2018 2005
20
12
15 10
8
10 6
4
5
2
0 0
France
France
EU
Netherlands
Spain
EU
Netherlands
Spain
Romania
Romania
Germany
Italy
Germany
Italy
Ireland
Poland
Ireland
Poland
Sources: FAO; UNFCCC; World Bank; and IMF staff calculations. Sources: FAO; UNFCCC; World Bank; and IMF Staff Calculations.
Note: Includes forestry and fisheries. Note: Includes forestry and fisheries.
… which has not translated into a commensurate decline in total emissions due to higher productivity.
Agriculture: Decomposition of Change in Emissions
(2005-17)
(In percent)
80
60 Emissions/value added
Value added
40 Change in emissions
20
0
-20
-40
-60
DK
HV
IT
SL
PT
NL
LT
PL
HU
LV
CY
GB
RO
BE
EU28
SE
DE
IE
CZ
EE
FI
AT
LU
BG
GR
FR
ES
Sources: Eurostat and staff calculations.
Note: Includes forestry and fisheries.
Despite several self-financing abatement possibilities in livestock production, there has been no meaningful reduction in
emissions from agriculture since 2005.
Ireland: Agriculture─Marginal Abatement Cost from Livestock and Soil Agriculture: Actual vs. Required Emission Reduction for 2030 Target 1/
Management (Percent; relative to 2005 target)
200
Euro/ktCO2 eq.
Average annual emission reduction until 2017
Share of EU emissions
100 2.0 BGR
HUN
0
NLD EST LVA
-100 1.0 LUX AUT
Beef MRI Beef lightweight gain CZE POL
-200
Dairy EBI Extended grazing DEU IRL LTU
SWE
(self-financing)
NUE Animal health PRT
Cost-neutral
-300 0.0 FRA
Solid biomass for heat Solid biomass for electricity ITA ESP SVK
Clover Fertilizer type
FIN GBR SVN
-400
Pig diet Drainage DNK CYP ROU
-500 Sexed semen Dairy diet -1.0 GRC
BEL MLT
Slurry amendments Low emission spreading HRV
-600
0 365 730 1,095 1,460 1,826 2,191
-2.0
Potential Emission Reduction -2.0 -1.5 -1.0 -0.5 0.0 0.5
(Cumulative ktCO2 eq.)
Required average annual emission reduction until 2030
Source: Lanigan et al. (2019), SEAI (2017); Schulte et al. (2012), and IMF Staff Calculations.
Note: MRI=Meuse-Rhine-Issel (MRI) is a breed of cattle, EBI=economic breeding index, Sources: Eurostat, UNFCCC database, and IMF Staff Calculations.
NUE=nutrient use efficiency. 1/ Includes forestry and fisheries (80.9 MtCO2eq.).
INTERNATIONAL MONETARY FUND 11
©International Monetary Fund. Not for RedistributionIRELAND
Box 1. Investment Need for Climate Policies (2021–30)
Meeting the envisaged emission reduction target in Ireland’s Climate Action and Low Carbon
Development (Amendment) Bill 2021 is estimated to require significant investment of close to
€20 billion (or 5 percent of GDP)1/annually over the next 10 years (Chart), of which about one-third
would be public capital spending on climate-sensitive infrastructure (energy supply, transport, water &
waste).
Ireland: Average Annual Investment Need for Climate Policies (2021-2030)
(EUR billions, 2013 prices)*
10
Business as usual (2017)
9
Pre-EU Green Deal remission reduction target 1/
8 Additional (revised EU target for 2030) 2/
Additional (2021 Climate Action Bill) 3/
7
6
5
4
3
2
1
0
Power grid/ Power Industry/ Residential Services Urban Interurban Water security Water Waste Urban
networks generation** services (buildings) (buildings) infrastructure mgtm. infrastructure
Energy Supply Energy Use Transport*** Water & Waste
Sources: Central Statistics Office (Ireland); European Commission; European Investment Bank;
and IMF staff calculations.
* Estimates do not include additional sectors/activities contributing to climate mitigation:
industry (manufacturing and process-driven emissions, including cement), non-infrastructure-
related changes in mobility (vehicles), agriculture, and some social infrastructure (if relevant
for climate change mitigation, e.g., public buildings).
** Including boilers.
***Includes storage, refueling and recharging infrastructure in transport sector.
1/ Based on a share of renewable energy generation of at least 32 percent and an increase of
energy efficiency by 32.5 percent until 2030.
2/ Total emission reduction of 55 percent relative to 1990.
3/ The Climate Action and Low Carbon Development (Amendment) Bill 2021 set a national
emissions reduction target of 50 percent until 2030 (beyond the required 30-percent
reduction under the EU Effort Sharing Regulation).
12 INTERNATIONAL MONETARY FUND
©International Monetary Fund. Not for RedistributionIRELAND
Box 1. Investment Need for Climate Policies (2021–30) (concluded)
These estimates have been derived based on a two-step approach:
First, we obtained the projected sectoral investment needs published by the European Commission
(2019, 2018 and 2016) for achieving the EU’s original 2030 emission reduction target (-40 percent
relative to 1990) consistent with the EU commitment to the Paris Agreement (COP21) under the Clean
Energy for All Europeans (EC, 2019) package using the PRIMES model (E3MLab/ICCS, 2013).2 The 2030
target implies raising the share of renewable energy in the EU energy mix to at least 32.0 percent and an
improvement in energy efficiency of at least 32.5 percent at EU level.
We then updated the results for a more ambitious emission reduction target of 55 percent (according to
the EU Green Deal) and a reduction of national emissions outside ETS coverage subject to Ireland’s 2021
Climate Bill, with a focus on investment in (economic) network infrastructure (clean personal mobility,
public transport infrastructure that facilitates modal shift to clean transportation, energy
transmission/distribution, smart energy systems and grids, CO2 transportation and storage, refueling
and recharging infrastructure in the transport sector).3
1/ Based on projected GDP in 2021 (IMF WEO April 2021).
2/ We combined these estimates with findings from the EIB (2019) on investment needs in the water and
waste sectors.
3/ See also Ari and others (2020).
7. More broadly, across all sectors, carbon pricing revenues could help fund some of the
essential public investment and financial support for greening Ireland’s economy (Table 2).17
The average capital spending for climate change mitigation and adaptation through 2030 is
estimated to be about 1.5 percent of GDP per Resource Allocation in National RRPs
year (Box 1). Most of the spending would (Percent ; billion)
Green Digital Others
100
2
need to be directed to public goods and in 90 10 0.2
77 22
80
areas where market failures make carbon 70
15 0.2
taxes less effective in setting price incentives. 60
16
10
50 42
The remainder of the total required investment 40
of about 5.0 percent of GDP per year would 30
31 21 0.5
20 86 11
need to come from the private sector. The 10
gradual increase in the domestic carbon price 0
Italy Spain France Germany Ireland
will help catalyze the necessary private (EUR 204.5 bn) (EUR 69.5 bn) (EUR 41 bn) (EUR 27.9 bn) (EUR 0.9 bn)
Sources: Darvas and Tagliapietra (2021); and authors.
investment to complement public sector Note: RRP=Recovery and Resilience Plan (for allocation of EU funding under the Next
Generation EU recovery package).
support as well as provide financing to
support vulnerable groups and businesses.18
17 Carbon tax revenues are likely to generate additional revenues of about 2.5 percent of GDP until 2030.
18This would also include improving the interconnectivity of the energy infrastructure for renewable energy sources
and ensuring sufficient storage capacity to accommodate renewables’ intermittency in electricity production.
INTERNATIONAL MONETARY FUND 13
©International Monetary Fund. Not for RedistributionIRELAND
8. Over the near term, recovery policies should prioritize green investment that facilitates
Ireland’s transformation to a low-carbon economy. The green transition will require substantial
capital spending, which could boost growth and jobs during the recovery phase and help achieve EU
emission reduction targets.19 While funding from the Next Generation EU (NGEU) recovery package
for capital spending will provide helpful additionality, Ireland’s cumulative share of the NGEU’s
Recovery and Resilience Facility (RRF) grants of 0.2 percent of GDP is small relative to projected
investment needs; however, its disproportionately high share of capital spending on green projects
(Chart) provides an important signal of Ireland’s commitment to the climate agenda.
Table 2. Ireland: Options for the Use of Carbon Tax Revenues
Metric
Instrument
Impacts on Income Distribution Impact on Economic Efficiency Administrative Burden
May disproportionately benefit low-income
Environmental Risk that may be less efficient than
households (for example, if reduces their Modest
investment broader uses of revenue
vulnerability to natural disasters)
May disproportionately benefit low-income
General investments households (for example, if provides basic Potentially significant Modest
education, health, infrastructure)
Highly progressive (disproportionately New capacity needed (but
Universal transfers Forgoes efficiency benefits¹
benefits the poor relative to income) should be manageable)
Benefits are largely proportional across Improves incentives for formal work
General Payroll tax Minimal
working households effort
Revenue
Uses Improves incentives for formal work
Typically benefits are skewed to higher-
Personal income tax effort and saving, reduces tax- Minimal
income groups
sheltering
Largely proportional to household Reduces incentives for untaxed goods
Consumption tax Minimal
consumption and activities
Corporate income tax Benefits skewed to higher-income groups Improves incentives for investment Minimal
Lowers future tax burdens and macro-
Deficit reduction Benefits accrue to future generations Minimal
financial risk
Means-tested cash, in- Effective at helping low-income groups if Efficiency impacts unclear but likely Low if builds on existing
Targeted kind transfers social safety nets are comprehensive modest¹ capacity, otherwise significant
Assistance Provides partial relief for all households (for
Assistance for Modest reduction in environmental Low if builds on existing
example, does not help with indirect pricing
household energy bills effectiveness capacity, otherwise significant
burden)
Sources: IMF Fiscal Monitor; authors.
Note: Green areas indicate current use of carbon taxes in Ireland; 1/ Transfers to low‐income households could lead to a small increase in human capital investment.
9. In particular, the post-COVID recovery provides an opportunity to accelerate the
adoption of climate-friendly policies in the following areas:
Physical infrastructure. The government would need to boost public investment in transportation
and climate-friendly network infrastructure, such as smart power grids for cleaner energy
(especially offshore wind power) as well as water and waste management (Box 1).20
19 See also Zhang (2020).
20The Government already funds 65 percent of the cost of home electric vehicle charging, provides 90 percent
funding for on street chargers via local authorities, and has provided grant support for the rollout of fast chargers on
public roads.
14 INTERNATIONAL MONETARY FUND
©International Monetary Fund. Not for RedistributionIRELAND
Green finance. Current means-tested grants for energy efficiency improvements and electrified
heating in residential buildings are essential but can cover only a fraction of the required capital
spending on required renovation and retrofitting of the housing stock. Increasing the availability
of low-interest rate “green mortgages”21 (consistent with the principles developed by the Energy
Efficiency Mortgage Initiative) and “green home equity loans”22 will be necessary (and may prove
a more cost-effective and fiscally more responsible means of) boosting private investment in
energy efficiency improvements where liquidity constraints are less binding; this would place a
premium on the availability of comprehensive and consistent data on energy efficiency and
development of active strategies for monitoring financial risks from such financial instruments to
mitigate the risk of “greenwashing” (Alogoskoufis and others, 2021), anchored to the EU
Taxonomy on Sustainable Activities.
Public support. It would also be necessary to promote R&D in early-stage technologies, such as
hydrogen generation through renewable energy (water and wind), encourage the adoption of
low-emission agronomic technologies, and support carbon capture (including through peatland
restoration and re-forestation), and new forms of energy storage.
Just transition. Finally, climate mitigation policies involve a structural transformation, with
unequal impacts across segments of industry and population. Concerns about the international
competitiveness of businesses and the burden of higher energy prices on households should be
taken into consideration by recycling some of the carbon tax revenues to support de-
carbonization efforts, including through business restructuring, active labor market policies, as
well as subsidies and grants with a focus on encouraging greater use of renewable sources of
energy.
10. Given the still low borrowing costs currently, it would be beneficial to make such
investments now (in line with prudent fiscal policies), even before sufficient revenues from
carbon pricing become available. The gradual increase of the carbon tax, accompanied by the
reduction in fossil fuel allowances, will further boost private investment. Greater private sector
participation in infrastructure projects might be required over time as fiscal consolidation is likely to
constrain budget outlays for public investment.
21For our analysis above, homes with an energy performance certificate (EPC) rating of lower than “A” are deemed
energy inefficient. However, some banks in Ireland also offer reduced-rate “green mortgages” for buildings with an
energy efficiency rating of as low as EPC=”B3.”
22 The National Home Retrofit Scheme provides grants covering 35 percent of the overall cost of home improvements
for private and local authority housing and 50 percent for approved housing bodies. 100 percent grants are available
for households at risk of energy poverty under the Better Energy Warmer Homes Scheme. These grants are provided
from the Sustainable Energy Authority of Ireland (SEAI) as a key support measure under of the Irish government’s
Climate Action Plan 2019 and the recent Climate Action and Low Carbon Development (Amendment) Bill 2021.
INTERNATIONAL MONETARY FUND 15
©International Monetary Fund. Not for RedistributionIRELAND
Figure 7. Ireland: General Indicators for Climate Change Mitigation Policy
The energy consumption and emission intensity of energy is still far too high for Ireland …
Ireland and Selected EU Countries: Emission/Energy Intensity and Required Path* to
Reach Net Carbon Neutrality in 2050
3.5
POL
3.0
IRL
PRT DEU
2.5 CZE
CO2 Intensity of Energy
ITA NDL
EU (selected)
ESP
2.0 GBR
(tCO2/toeTPES)
1.5 2030
FRA
SWE
1.0 2040
2050
0.5
0.0
0.0 0.5 1.0 1.5 2.0 2.5 3.0 3.5 4.0
Energy Intensity of Population**
(TFC/Capita, toe per million 2018)
Sources: European Commission (EDGAR); Enerdata; IEA; OECD; United Nations; and authors.
* Consistent with the IEA's 66% 2ºC Scenario (https://ieefa.org/wp-content/uploads/2018/11/IEEFA_Reviewing-global-energy-scenarios-_13-Nov-2018.pdf)
** Projected population based on constant fertility rate.
… which is largely due to high growth, which has offset higher energy efficiency of production.
The effective use of carbon pricing requires gradually phasing out significant fossil fuel allowances in Ireland.
Energy Subsidies by Product, in percent of GDP, Latest Value Available 1/
4.5
4.0 Petroleum Coal Natural Gas
3.5
Electricity Euro Area AEs
3.0
2.5
2.0
1.5
1.0
0.5
0.0
Luxembourg
Cyprus
Germany
Netherlands
Estonia
Latvia
France
Malta
Slovenia
Belgium
Ireland
Portugal
Slovak Republic
Spain
Austria
Finland
Greece
Italy
Lithuania
Source: IMF FAD Expenditure Assessment Tool (EAT); IMF Energy Subsidy Estimates.
1/ Dashlines are the median for countries in the region.
16 INTERNATIONAL MONETARY FUND
©International Monetary Fund. Not for RedistributionIRELAND
Box 2. Low-Carbon, Climate-Resilient Infrastructure (LCCR)
Effective climate change mitigation and adaptation requires greater investment in low-carbon,
climate-resilient (LCCR) infrastructure. Public investment programs create infrastructure that is bound to
shape carbon emissions for decades. Hence, the cost-benefit analysis of any viable infrastructure project
should include environmental, social, and governance (ESG) considerations and be guided by a sense of
shared, long-term responsibility to avoid locking in carbon-intensive growth. Since more than half of total
global greenhouse gas (GHG) emissions are directly or indirectly attributable to infrastructure, making
infrastructure projects “climate‑friendly” would help Ireland (i) transition towards a low-carbon, more
environmentally sustainable economic model, notably in renewable energy generation and low-emission
transport, and (ii) mitigate the potentially long-lasting effect of more pervasive natural disasters as a result
of climate change. Such an investment will not only provide a major boost to short-term growth and
enhance the longer-term resilience but also reduce the carbon footprint of economic progress.1
Investment in climate-sensitive infrastructure is costly but carries significant long-term benefits,
which reduce the net cost overall. Infrastructure in Infrastructure Quality Score and Public Investment
Ireland has suffered from chronic under-investment for (2017)
6
decades (resulting in low infrastructure quality relative EST LUX
to most other European countries), so most Public Investment (% of GDP)
5
investment will be in new projects (Chart). However, FIN
SWE DNK
lower cost from renewable energy sources and HUN
4
greater energy efficiency are likely to offset these FRA NLD
SVN CZE AUT
investment cost over time. Some spending must also POL LVA
GBR
3 BEL
be allocated to accelerate the retirement of legacy SVK GRC HRV
ESP
LTU PRT
carbon‑based infrastructure and ensure that the ITA IRL
DEU
2
adaptation and the structural transition to a more 4 4.5 5 5.5 6 6.5
resilient and sustainable economy is socially fair and Infrastructrue Quality Score, 1-7 (best)
inclusive (Jobst and Pazarbasioglu, 2018). Sources: World Economic Forum, IMF and IMF staff calculations.
Since the impact of public investment is usually measured based on economic aggregates, climate
change risks affecting infrastructure remain insufficiently factored in public policy. The Government
should adopt a strategic approach to public investment consistent with the National Development and
Climate Action plans, with a view to accounting systematically for the contribution and vulnerability of
infrastructure projects to climate risks in project identification, prescreening, project appraisal and selection.2
These approaches would need to be robust given the uncertainty surrounding climate changes effects at
local and regional levels and require an understanding of the (i) climate impact of large projects (GHG
emissions), (ii) the sources, types, and sizes of damage/economic losses, (iii) the project resilience to the size
or strength of different natural hazards (“resilience score”), and (iv) the capacity to predict frequency/impact
of future disaster shocks (“climate damage function”).3
1/ This objective is also consistent with the current focus of the Italian G20 Presidency goals on financing more
resilient, sustainable, and inclusive infrastructure as main objective of the G20 Infrastructure Working Group.
2/ The Irish government is working with the European Commission (DG REFORM) and the OECD to better
incorporate climate impacts into the appraisal of infrastructure and a project to better incorporate climate risks to
infrastructure within the appraisal framework.
3/ Le, Leow and Seiderer (2020) provide guidance on how to integrate considerations of climate-related risks into
infrastructure governance, focusing on the planning, design, appraisal, selection, and financing of public
investments.
INTERNATIONAL MONETARY FUND 17
©International Monetary Fund. Not for RedistributionYou can also read