CONCEPT REPORT The South African energy landscape
←
→
Page content transcription
If your browser does not render page correctly, please read the page content below

CONCEPT REPORT
The South African energy landscape

This report has been commissioned by the ERLN via the Isandla Institute and compiled by Dirk de Vos. The views and opinions
expressed in this report are those of the author and do not necessarily reflect those of the ERLN or the Isandla Institute.

                                                                                                   ERLN is an initiative of
Contents
Concept Report – the South African energy landscape....................................................1
Introduction........................................................................................................................3
Policy making & solving our electricity conundrum...........................................................4
Why we are where we are.................................................................................................5
Eskom at a glance.............................................................................................................5
Staffing..............................................................................................................................6
Prices................................................................................................................................7
Sales.................................................................................................................................7
Renewables.......................................................................................................................7
Cogeneration.....................................................................................................................7
Gas....................................................................................................................................8
South Africa’s electricity intensity & increasing energy efficiency (EE).............................8
The economic cost of load shedding...............................................................................13
The distribution sector and local government..................................................................14
Local government’s revenue model and the role of electricity.........................................15
The problem of data........................................................................................................18
Smart-meters and smart grids – a key consideration for municipalities in unlocking
the economic opportunities at sub-national level............................................................19
The future........................................................................................................................22

                   ERLN is an initiative of                                        Produced for ERLN by                      www.erln.org.za

                                                                    2                                                        info@erln.org.za
Introduction
This ERLN concept note has been compiled as an input to the ERLN event titled, “Local and sub-national
renewable energy and energy efficiency: Challenges and opportunities for economic development”.

The event sets out to explore the question: “Can we stimulate renewable energy (RE) and energy
efficiency (EE) markets in a manner that is developmental and equitable whilst being sustainable for
municipalities?”

The just-released Bloomberg New Energy Outlook of 20151 highlights five shifts that will disrupt the
global electricity system going forward. These can be summarised as:
   1. Solar, solar everywhere. The further decline in the cost of photovoltaic technology will drive a
      $3.7 trillion surge in investment in solar, both large-scale and small-scale.

   2. Power to the people. Some $2.2 trillion of this will go on rooftop and other local PV systems,
      handing consumers and businesses the ability to generate their own electricity, to store it using
      batteries and – in parts of the developing world – to access power for the first time.

   3. Demand undershoots. The march of energy efficient technologies in areas such as lighting and
      air conditioning will help to limit growth in global power demand to 1.8% per year, down from 3%
      per year in 1990-2012. In OECD countries, power demand will be lower in 2040 than in 2014.

   4. Gas flares only briefly. Natural gas will not be the “transition fuel” to wean the world off coal.
      North American shale will change the gas market, but coal-to-gas switching will be mainly a US
      story. Many developing nations will opt for a twin-track of coal and renewables.

   5. Climate peril. Despite investment of $8 trillion in renewables, there will be enough legacy fossil-
      fuel plants and enough investment in new coal-fired capacity in developing countries to ensure
      global CO2 emissions rise all the way to 2029, and will still be 13% above 2014 levels in 2040.

              ERLN is an initiative of                     Produced for ERLN by          www.erln.org.za

                                                 3                                       info@erln.org.za
Aside perhaps from the gas power dynamic (although here SA’s trajectory may have elements similar
to the US depending on how this unfolds) these all have direct implications for municipalities and new
economic opportunities.

This report outlines the overall energy landscape in South Africa and explores some of the conundrums
and challenges we face.

Policy making & solving our electricity conundrum
At a national level, official energy policy remains the 1998 White Paper setting out a progressive vision
for our electricity sector, with a substantial restructuring of our electricity sector separating generation,
transmission and distribution, the extensive use of markets to regulate price, promoting energy
efficiency and environmental sustainability. Extracts from the 1998 White Paper (page 43) include:

   “To ensure the success of the electricity supply industry as a whole, various developments will have
   to be considered by government over time, namely:
   • giving customers the right to choose their electricity supplier;
   • introducing competition into the industry, especially the generation sector;
   • permitting open, non-discriminatory access to the transmission system; and
   • encouraging private sector participation in the industry.”

On industry finances, the White Paper reads as follows (p46):

       “The entire industry (generation, transmission and distribution) must move to cost-reflective
       tariffs with separate, transparent funding for electrification and other municipal services.”

              ERLN is an initiative of                        Produced for ERLN by            www.erln.org.za

                                                   4                                          info@erln.org.za
This has not been comprehensively followed. We have to work with what we have. In this context, there
are challenges in how to engage with energy:

    •   Energy is subject to many pressures and claims - decision making is not straightforward and is
        subject to a wide range of interests;
    •   At this stage, there are no clear “win-wins”;
    •   There many players in the field with strong statutory, economic and/or other interests. These
        range from Eskom, Nersa (the regulator), industry, mining, the Intensive Energy User’s Group
        (IEUG), agriculture, the different spheres of government, residential customers, Independent
        Power Producers and others. These have established positions. As such, any policy
        intervention will be subject to extensive scrutiny;
    •   As far as government is concerned, there needs be clarity in roles and interests in order to bring
        certainty and predicatibility, as well unlock economic potential;
    •   Solutions will need to evolve from these players (from the existing ecosystem); and
    •   Economics and politics will continue to challenge evidence-based policy;

In terms of regional/sub-national economic development, a central challenge to unlocking the economic
potential lies in the challenge facing local government:

•   Electricity sales by municipalities are an important source of their income;
•   Municipalities as the most direct link to consumers/users of electricity are in the best position to
    implement policies and strategies that will make South Africa energy efficient and energy secure; and
•   Efforts to achieve energy efficiency and local generation will potentially reduce municipal income.
    Conversely, the benefits of efficiency and local generation of renewable energy (economic growth
    and therefore increased tax receipts) accrue only indirectly to municipalities.

Why we are where we are
Eskom ought to be understood in its historical context. It was first established to provide cheap electricity
to the mining sector. In late Apartheid years, Eskom, like Sasol had a role in securing South Africa’s
energy security in an increasingly hostile world. However, it is important to understand that Eskom
has never been a particularly efficient utility. Perhaps part of the reason why the 1998 White Paper
on Energy Policy was not implemented was that the apparent low prices and exemplary electrification
performance created the impression that Eskom was highly efficient and in no need of reform.

A closer look shows that Eskom’s ability to undertake its electrification programme was as a result of other
factors such as very low coal prices, exemption from taxation and dividends, financing subsidies and by
the fact that consumers had largely amortised the loans required to fund the generation over-capacity built
in the 1970s and 1980s. Eskom’s poor performance then was the subject of the De Villiers Commission set
up in 19842 . Eskom did not invest in any new capacity from the 1980s and so a falling debt (via amortising
older plant) was the most significant contributor to its ability to deliver cheap electricity through the 1990s
and first decade of the 21st century. For two decades, Eskom’s electricity prices have been very low by
international standards but critically, also below its own long-run marginal costs leading to an economy with
excessive electricity consumption patterns - something that exacerbates the current shortage of capacity.

Eskom at a glance
Eskom has a total Generating Capacity: 41,194MW3. In the world of electricity utilities, Eskom is an
extreme outlier. By generating capacity, it is the 5th or 6th biggest electricity utility4 in the world5 but
operates in an economy that is only the 29th biggest by GDP6.

               ERLN is an initiative of                         Produced for ERLN by            www.erln.org.za

                                                     5                                          info@erln.org.za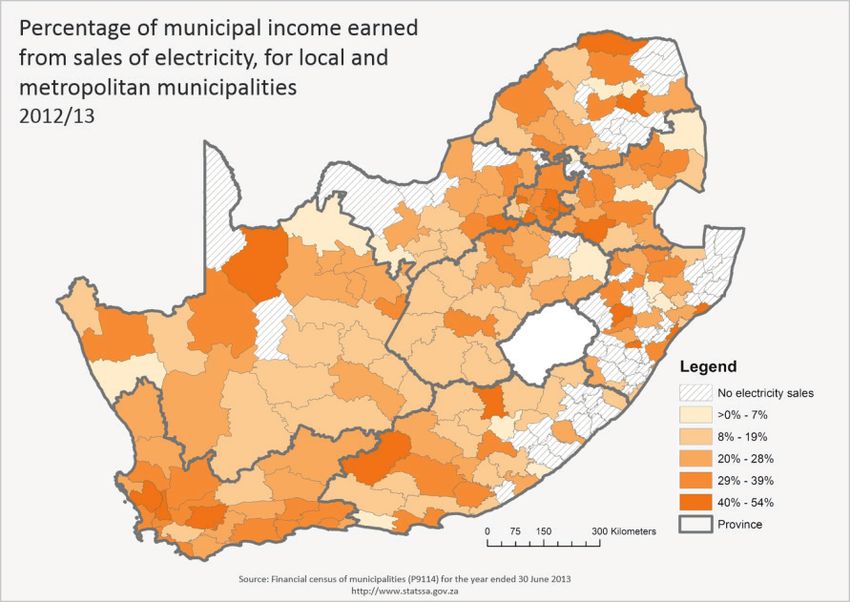
Eskom’s revenues for its 2014 financial year amounted to R139.5 billion which means that by
revenues, Eskom is South Africa’s fourth or fifth biggest company7. If only South African revenues were
the measuring criteria, it would move higher up.8

Eskom is responsible for 95% of all electricity consumed in South Africa9. Other than the Koeberg
nuclear power station and a small contribution from hydro, 95% of Eskom’s electricity has been
generated from coal-fired power stations. An overview of Eskom’s Coal Fired Generators (as set out in
Eskom ‘s presentation to Parliament 29 July 2014) is set out below. The capacity of coal fired Power
Stations is as follows:

                                                             Nominal Capacity              Age in 2014
          Station                          Location
                                                                  (MW)                 (design life 30 years)
         Arnot                            Middleburg, MP                     2 232                             38
         Camden                           Ermelo                             1 480                             42
         Duhva                            Witbank                            3 450                             34
         Grootvlei                        Balfour                            1 090                             44
         Hendrina                         MP                                 1 865                             43
         Kendal                           Witbank                            3 840                             25
         Komati                           Middelburg MP                        791                             52
         Kriel                            Bethal                             2 850                             34
         Lethabo                          Viljoensdrif                       3 558                             28
         Majuba                           Volksrust                          3 843                             17
         Matimba                          Lephalale                          3 690                             27
         Matla                            Bethal                             3 450                             34
         Tutuka                           Standerton                         3 510                             28

Recently, the performance of Eskom’s plant has fallen dramatically. Although poor maintenance is a
factor in all this, the age of Eskom’s generating plant is also a factor. The fall-off in plant availability
is now rather deep. In 2010 plant availability stood at 85%, but by 2014 it had fallen to 75%10. This
is important, Eskom’s own reserve margin requirement (the margin required to prevent unplanned
outages is at 15-20% of generating capacity11.

The under-investment is not only in the generating capacity. The South African Grid is also in trouble.
It is estimated that as much as R163 billion will be needed to get the South African grid to Grid
Code Standard. As South Africa cannot rely on other utilities in neighbouring countries to kick start
a national black-out, our grid ought to be extremely robust. It is not only the robustness of the grid
which is important. If the grid is going to be able to evacuate new generating capacity, it will need to be
strengthened12.

Staffing
Eskom’s staff complement in 2013, stood at 46 000 – 47,000 employees13. Of these, about 15 000
are involved in Eskom’s own distribution/retail activities. On the face of it, Eskom seems over-staffed.
Depending on available plant or full (theoretical) capacity, Eskom employs more than 1 person per KW
capacity. By way of comparison, Iberdrola, a Spanish utility with a capacity of 45GW, a little bigger than
Eskom’s 41GW employs 30,678 people or 1 employee per 1.4KW while Duke Energy, the US’s largest
electricity utility with 57GW of capacity, employs just 27,948 people or 1 employee per 2kW14. Poor

               ERLN is an initiative of                         Produced for ERLN by            www.erln.org.za

                                                      6                                         info@erln.org.za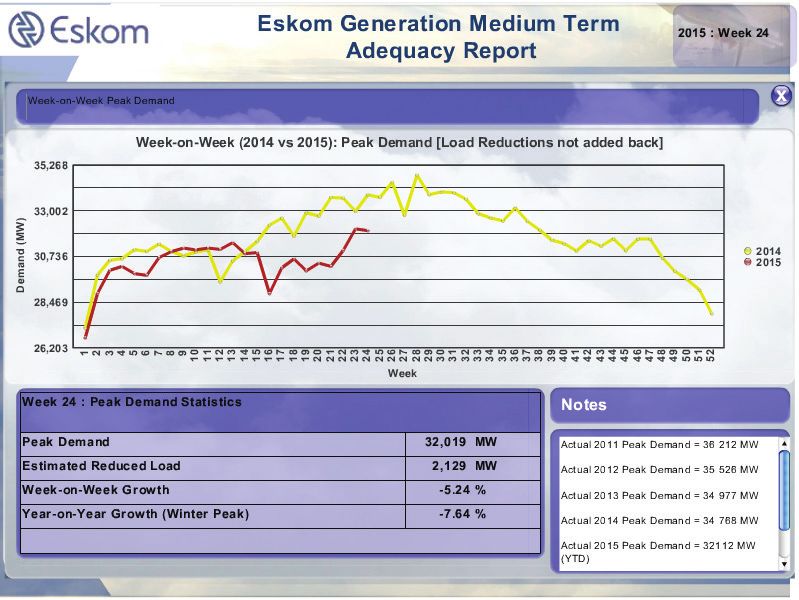
productivity is less of a problem if employers are paid less than Eskom’s peers but this is not the case,
the average salary per Eskom employee stands at more than R600,000/annum.

Prices
For the present, South Africa’s electricity price is still amongst the cheapest in the world15. For industrial
users, it is amongst the cheapest anywhere in the world16. According to 2014 figures, Eskom’s average
selling price was 71c/kwh17 but this tariff is likely to go up dramatically. The average cost of running
the Ankerlig Open Cycle Gas Turbines is R3/kwh and Nersa calculated in 2012 that Medupi will, on a
stand-alone basis need to have a tariff of 97c/kWh, a figure which has since increased. Once Medupi
and Kusile come on line, they will represent between 20-25% of Eskom’s total generating capacity. At
present, Eskom’s estimation of revenue shortfall in MYDP3 period18 is R225 billion (Eskom presentation
to Parliament 29 July 2014).

Sales
The table below sets out Eskom’s sales of electricity.

                      2013/14       2012/13      2011/12   2010/11   2009/10    2008/09     2007/08   2006/07
Total sold, GWh       217 903       216 561      224 785   224 446   218 591    214 850     224 366   218 120
        Growth/
                             0.6         (3.7)       0.2       2.7        1.7       (4.2)       2.9        4.9
     (reduction)

Eskom does not disclose the sectors to which it sold its electricity but using a 2004 Treasury study, the
splits across the different sectors are as follows:

Category               Percentage of Total
Domestic                     17.9%
Agriculture                   2.7%
Mining                       17.6%
Manufacturing                39.8%
Commercial                    11%
Transport                     2.9%
General                        8%

Renewables
Moves to bring in Independent Power Producers commenced in 2011 in renewables – under the
Renewable Energy Independent Power Producer programme (REIPPP). This was as a consequence
of our commitments to the Conference of the Parties (COP) processes under the Kyoto Protocol.
The renewables programme operates via an Independent Power Programme (IPP) office run from
the Department of Energy. Every renewable plant supplies its power to Eskom in terms of a Power
Purchase Agreement that is guaranteed by the state. Already, via four bidding rounds, 5 243 MW has
been procured amounting to investments totalling R200 billion. Another 1 084 MW will be added shortly
as an extension to the fourth bidding round and an expedited fifth round may add another 1 800 MW
of renewable energy. The Department of Energy has sought to secure an additional 6 300 MW of
renewable energy.

Cogeneration
Beyond renewables, the IPP programme has recently issued a request for bids under the cogeneration
independent power producer (IPP) procurement programme and the deadline for 1 600MW of

              ERLN is an initiative of                           Produced for ERLN by           www.erln.org.za

                                                       7                                        info@erln.org.za
Baseload Coal IPP bids (spread over different bids of no larger than 600MW each) are expected in
August 2015. Of interest is that the baseload coal IPPs will need to bid in their projects with a tariff of
less than 82c/kWh.

Gas
In May 2015 the Department of Energy issued a request for information (RFI) for gas-fired electricity
generation and this will help with the development of a 3 126 MW Gas to Power Procurement
Programme.

South Africa’s electricity intensity & increasing energy
efficiency (EE)
South Africa’s economy is one of the most electricity intensive (kWh required to produce a unit of
GDP). Despite the movement towards a bigger services sector, inherently less energy intensive than
mining or manufacturing, our economy’s energy intensity has grown. Figures show that South Africa’s
energy (and with it electricity), intensity doubled over the period 1990 to 200719. In large part this was
due to increases in energy intensive manufacturing activities in the 1990s, particularly in the area of
aluminium smelting (the non-ferrous metals sector).

Our economy is also characterised by a small number of industrial concerns consuming almost half
of our electricity. Most of them are members of The Energy Intensive Users Group (EIUG)20. Its 31
members account for 44% of all electricity consumed in South Africa but, collectively, they also have
a collective annual turnover of R741 billion, more than 20% of South Africa’s GDP and employ nearly
600 000 South Africans.

Almost half the EIUG’s members are in mining and a third are manufacturing concerns. Of importance
here is that across the EIUG’s membership, a significant component of their annual expenditure, nearly
20%, is made up of electricity. This would indicate that they are both heavily dependent on electricity

              ERLN is an initiative of                        Produced for ERLN by            www.erln.org.za

                                                   8                                          info@erln.org.za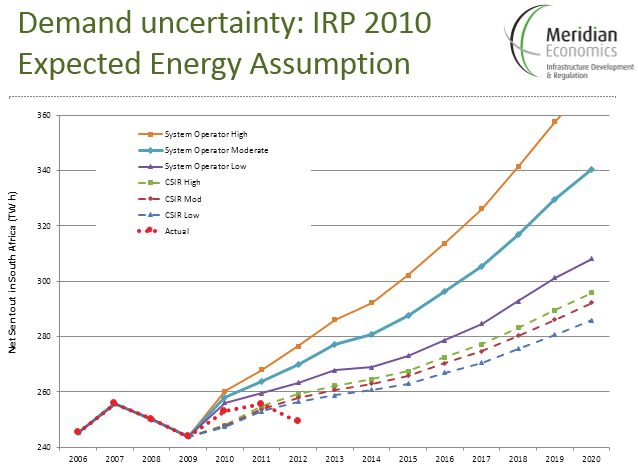
but are also very exposed to increases in the price of electricity. It would be a mistake to understate the
importance of most of the EIUG membership. The EIUG membership represents much of what South
Africa exports to the rest of the world. These exports finance our dependence on imports of industrial
equipment, a necessary input if this economy is to grow21. Moreover, many of them form an important
base upon which the economy rests.

Another way of looking at things is to compare South Africa to its peers. The table below lists the 25th –
37th biggest economies in the world in US dollar terms, South Africa, being the 35th biggest. It then sets
out population size and electricity production:

Country        GDP      Population GDP/ Capita              Electricity      Electricity           Electricity
               (Nominal in millions World Bank              Production       Intensity             Intensity per
               in US                US dollars              TWh              ratio (Elec           Population)
               Dollars)             Nominal                 BP Statistical   prod/ GDP)            (Elec prod/
               World                World Bank              Review of                              Pop ratio)
               Bank                 2013                    World Energy
               2013
Nigeria        $522 638                  178.9     $3 010          24 827                     47             139
Poland         $517 543                   38.5    $13 342         164 800                    318           4 280
Norway         $512 580                    5.1   $100 819         134 200                    261          26 313
Belgium        $508 116                   11.1    $45 387          85 100                    168           7 666
Venezuela      $438 284                   28.9    $14 415         131 700                    300           4 557
Austria        $415 844                    8.5    $49 074          67 700                    163           7 964
Thailand       $387 252                   64.4     $5 779         164 800                    426           2 559
UAE            $383 799                    9.0    $41 692         111 300                    290          12 366
Colombia       $378 148                   47.7     $7 829          62 200                    165           1 303
Iran           $368 904                   77.6     $4 763         263 400                    714           3 394
South
               $350 630                   52.9     $6 618         256 100              730                 4 841
Africa
Denmark        $330 814                    5.6    $58 930          30 402                     92           5 428
Malaysia       $312 435                   30.4    $10 514         131 600                    421           4 328

South Africa is an outlier being the most electricity intense economy.

One of the more interesting documents submitted by Eskom in support of a 16% year-on-year tariff
increase was a report produced by Deloitte entitled “The Economic Impact of Electricity Price Increases
on Various Sectors of the South African Economy”22. In it, the work of University of Pretoria academics
Roula Inglesi-Lotz and Professor Blignaut studying price elasticity of demand by different sectors of the
economy is extensively cited. One of the important findings by these academics is that as electricity
prices declined from the 1980s, South Africa’s electricity intensity has increased dramatically. So while
in 1990 South Africa had roughly the same electricity intensity as the OECD (a group of developed
industrialised countries), by 2006 it had almost doubled. These academics were also able to show that
when South Africa experienced its last big electricity price increases in the early 1980s when Eskom’s
build programme was at its height, the price elasticity of electricity demand in South Africa was
significantly negative. We are likely already in this position once again.

              ERLN is an initiative of                          Produced for ERLN by               www.erln.org.za

                                                     9                                             info@erln.org.za
This has important implications for the procurement of generating capacity. At present, our current
planning is set out in the Integrated Resource Plan of 2010 (IRP2010). It provides the basis for the
procurement of new generating capacity. In general terms, it projects that economic growth requires
a growth of generating capacity. But some of the assumptions are based on a price compact to which
Eskom committed itself in 1991 which brought prices of electricity progressively lower23. The compact
was broken in 2006 and from then, prices have increased significantly as seen from the table below:
Comparison of approached tariff increases with rate of inflation
Average approved Average yearly
Year
tariff increase % inflation %
2008 27.5 11.5
2009 31.3 7.1
2010 24.8 4.3
2011 25.8 5.0
2012 16.0 5.7
2013 8.0 5.7
2014 8.0 6.1
The five years since the publication of the IRP2010 has shown that assumptions around electricity
demand are incorrect. Given the economy’s extreme electricity intensity, this is not surprising. South
Africa has grown (very modestly) but as the chart below shows, it has actually reduced the amount of
electricity it uses.
ERLN is an initiative of Produced for ERLN by www.erln.org.za
10 info@erln.org.zaMore recent figures from Eskom show that South Africans are using progressively less electricity, even
at peak times24:
Energy efficiency will increasingly become an integral part of our economy. The graphic below shows
how in response to increased electricity prices, the output from a unit of electricity has increased. This
trend is set to continue:
Considerably more work on energy efficiency has been done elsewhere than here. While a number of
energy efficiency measures are in place, very little has been done about its implementation25. Where
incentives such as section 12L of the Income Tax Act exist they are limited in their ambit26.
ERLN is an initiative of Produced for ERLN by www.erln.org.za
11 info@erln.org.zaEnergy efficiency, research from the International Energy Agency (IEA) suggests, is routinely and
significantly undervalued. Their research shows that under existing policies of their member countries
(the OECD), two-thirds of the economically viable energy efficiency potential available to 2035 will
remain unrealised27.
The problem is that energy not used, and costs not incurred, are hard to measure hence the
description of energy efficiency as the “hidden fuel”. Nevertheless, the benefits of energy efficiency are
huge28. Amongst the IEA member countries, energy use avoided in 2010 was bigger than the demand
met by any other single energy supply including oil, coal or gas. To demonstrate the effectiveness of
these measures, the research also showed that the total amount invested in energy efficiency across
those countries as of 2011 was an estimated $300 billion, which equalled their aggregate investments
in non-renewable conventional energy sources.
There are other benefits, energy efficiency can provide health benefits and improve industrial
productivity by lowering the costs of energy in the supply chain. Greater energy efficiency can improve
national budgets by lowering the cost of energy used in the government’s infrastructure which could be
directed to say, increasing access to electricity for low-income populations. The report also dealt with
the rebound effect where efficiency gains are lost when people respond by buying more energy. This is
not a bad thing as people improve their well-being with the same amount of energy. Some developed
countries such as the USA has seen a divergence between energy consumption and economic growth
since the 1970’s29. This is also happening on a global level30.
We need to understand the scope for greater efficiencies in our economy. If South Africa is to grow,
it will need to delink economic growth from greater electricity consumption. Energy efficiency and
the revenue models of municipalities must be changed. Energy efficiency programmes run by
municipalities run contrary to their revenue models.
Nevertheless, there is now evidence that South Africa is becoming less electricity intense as seen from
the chart below:
ERLN is an initiative of Produced for ERLN by www.erln.org.za
12 info@erln.org.zaWe need a more thorough understanding of demand elasticity for electricity across and within various
sectors. Very little research exists. We need to understand to what extent our balance of payments
or our ability to fund imports of capital equipment depends on certain electricity price levels in the
important mining and parts of the manufacturing (ferro-chrome processing) sectors. In doing so, we
need to identify those sectors that look the most vulnerable to increases in price and to what extent can
these industries become less energy intensive31.
All the above is very important to understand as South Africa embarks on a build programme. How
much generating capacity does South Africa need at different price points? Beginning to understand
this is key to breaking the generation long cycle of over investment and under investment. It will also
help answer what type of generating capacity we ought to consider.
The economic cost of load shedding
Most reliable observers say that load shedding will remain with us for at least another five years. It
obliges us to answer the question of the economic cost of unserved electricity to the South African
economy. It can be a tricky question to address. Different businesses will have vastly different costs.
Some businesses can manage a work-around, while others are less able to do so.
The calculations currently used by the revised Integrated Resource Plan 2010 (2013) provide one basis
and was the basis of a study published by the CSIR on the financial benefits of the renewable power
projects that have already been commissioned32. Even at the very high tariffs (compared to subsequent
renewable projects under construction, the paper calculated that South Africa’s net benefit amounted to
R800 million. Demonstrating that the renewable projects under consideration had delivered 2.2 terawatt
hours to the grid, they could derive the savings on diesel not burnt but then went on to show that the
2.2 terawatt hours avoided 120 hours of unserved electricity. Avoiding unserved energy amounted to
a “benefit” of R1.6 billion. How is this derived? The number comes from a worksheet for the current
revised Integrated Resource Plan33 found on the Department of Energy’s website34.
The basis for the cost of unserved electricity is derived from surveys done by Eskom at its largest
customers. These suggested that the cost of unserved electricity was 150 times larger than the cost of
supplying electricity. Using the average tariff at the time, the cost of unserved electricity was deemed
to be R75/kwh. The CSIR updated this to R87/kwh based on the average selling tariff at the time. The
Department of Public Enterprises, in its own calculations, uses a figure of R100/kwh35.
It ought to be remembered that the original Eskom survey was not undertaken to calculate the actual
cost to the economy of unserved electricity, its purpose was to determine the size of the reserve margin
that Eskom ought to maintain (i.e. the size of mostly idle capacity). Intuitively, it does not make sense.
If it were a reliable measure then any increase in the tariff would result in an increase in the costs of
loadshedding to the economy. Very little research has been done on the impact of loadshedding and
many numbers are mere speculation36.
More work needs to be done. The economy is not only represented by a sample of Eskom’s largest
customers. The services sector, which does not use much electricity, would have a far greater cost
where electricity is a small but essential part of the services business concerned. Being unable to have a
hot shower or eat a hot meal at home is a horrible inconvenience but probably does not generate much
of a cost to the economy. Deriving a figure for the costs of load shedding to our economy would be a
very difficult task. Many of the costs are not direct costs but would include issues like investor sentiment
and confidence in the future of the country, social stability issues, opportunity costs and so on.
ERLN is an initiative of Produced for ERLN by www.erln.org.za
13 info@erln.org.zaPerhaps better numbers could be derived from undertaking a sectoral analysis or undertaking a study
on a regional or local level. Expanding the requirements of local government’s mandated Integrated
Development Plans to include issues around electricity and the costs of loadshedding to local
economies could one way to achieve this.
The distribution sector and local government
There are over 170 licensed electricity distributors in South Africa. Eskom serves 48% of customers in
the country and municipalities serve 52%. The current position in the electricity distribution industry is
the result of its historical development. Before 1994, municipalities distributed electricity in historically
white areas, while Eskom covered historically black townships and some of the former so-called
homelands. The table below sets out the position.
Estimated number of Customers Estimated Sales Per Category MWh
Category
Eskom Municipalities Total Eskom Municipalities Total
Domestic 3 376 276 3 470 054 6 846 330 7 965 000 26 109 593 34 074 593
Agriculture 78 433 20 621 99 054 4 358 000 784 918 5 142 918
Mining 1 180 823 2 003 33 372 000 26 774 133 33 639 741
Manufacturing 2 988 40 964 43 952 53 715 000 22 234 526 75 949 526
Commercial 43 880 199 332 243 212 6 936 000 14 135 177 21 071 177
Transport 511 1 642 2 153 3 182 000 2 383 011 5 565 011
General 1 771 34 334 36 105 1 429 628 13 916 728 15 346 356
Total* 3 505 039 3 767 770 7 272 809 110 957 628 79 831 694 190 789 322
*An increase of 13% to each category would be a reasonably accurate update to 2015
The municipalities do not only have residential customers, they also service industrial/manufacturing,
commercial and even mining companies but Eskom itself, measured on capacity, distributes
significantly more electricity to customers directly than all the municipalities put together. Twelve of
the largest municipalities account for about 80% of electricity distributed by all municipalities. The
remainder are small and mostly uneconomic.
We have come to see dependence of local government on electricity (and more particularly the
surpluses it generates) puts local government in a bind. We saw this with the collapse of a programme
to rationalise distribution into a number of Regional Electricity Distributors (REDs) in 200937. There are
several reasons why the REDs initiative was not successful but the unresolved financial implications on
local government’s finances was amongst the primary reasons.
To a very large extent, the question of what to do in place of having REDs has not been adequately
resolved and this is becoming a critical issue. Nersa, which in terms of the Electricity Regulation Act
undertakes audits of distributors, shows up a progressive deterioration of plant amongst many of the
distributors, particularly the smaller municipalities. The audits verify whether the planned network
maintenance and inspections are conducted as planned and assessments are conducted on electrical
assets in substations, mini-substations, pole mounted transformers, switching stations of secondary
substations and overhead lines to gain an understanding of the condition of the electrical network.
The poor state of many local networks has been known for a long time. More recently, the amount
of money owed to Eskom by certain municipalities has brought the matter of failing small local
municipalities back into focus.
ERLN is an initiative of Produced for ERLN by www.erln.org.za
14 info@erln.org.zaOther than the abandoned REDs initiative. There was a plan to turn this around called the “approach to
distribution asset management (ADAM), a comprehensive, multi-year initiative targeted at addressing
maintenance, refurbishment and strengthening shortcomings. Other initiatives included a master plan
for standardisation and centralised purchasing of equipment for upgrades.
Given the financial benefit of being able to distribute electricity, one suggestion has been to allow
local distributors in small municipalities to retain their electricity businesses and to provide them with
intensive and sustained support. To do this, however, it would be necessary to develop ring-fenced,
corporatised, effectively regulated and well-managed utilities, with adequate investment in physical and
human capital. If this were to occur, large corporatised municipal distribution companies could play a
much larger role in future.
Local government’s revenue model and the role of electricity
Municipalities themselves use electricity as a tax to cross subsidise their other activities. In the large
metro’s, electricity sales make up as much as a third of total revenues38:
35 34%
32%
30% 30%
30 28% 28%
27%
26%
24% 24%
25
20
15
10
5
0
07/08 08/09 07/08 08/09 07/08 08/09 07/08 08/09 07/08 08/09
Johannesburg Cape Town Tshwane eThekwini Nelson
Mandela Bay
The amount of income earned by municipalities does, however, vary greatly. The figure below is from a
June 2015 STATSSA report39.
While electricity was as cheap as it has been, the local government has used the supply of electricity in
a manner somewhat similar to an income tax. As seen from the tables above, the operational surpluses
that electricity sales generate contribute as much as 15% of total municipal income (and in some cases
ERLN is an initiative of Produced for ERLN by www.erln.org.za
15 info@erln.org.zamuch higher). It is the only local government service for which it charges consumers that makes any
significant contribution to the general budget. Without the contribution of electricity “surpluses”, local
government budgets would be significantly affected.
As electricity becomes more expensive, the ability to subject its supply to a surcharge or tax becomes
more difficult. It also puts local government, as least as far as its revenue model is concerned, on the
wrong side of important efforts to reduce exposure to load shedding, get behind energy efficiency, deal
with the introduction of embedded generation, undertake demand response efforts and commence with
the development of local procurement. If the retention of surpluses from electricity remains an important
source of funding for local government, none of these initiatives will succeed and local government will
remain exposed to the necessary changes that will have to happen in our national electricity system.
As shown above, local government has a far greater exposure to residential consumers than Eskom
itself. While the residential sector represents only about 17-18% of total electricity consumption, it is
characterised by peaks in the early morning and the early part of the evening. During these peak times,
the residential sector makes up 35% of Eskom’s generating capacity40.
Electricity Consumption Peak Demand
2% 2%
4% 4%
10% 10%
Industry
Mining
Residential 35%
14%
49% 17%
Agriculture
Transport
Commerce
18%
35%
As one would expect, these peaks become more pronounced in winter.
Eskom report to Parliament (p 25).
In terms of demand, there is the need for more than one full power station between daytime
consumption and the evening peak in winter.
ERLN is an initiative of Produced for ERLN by www.erln.org.za
16 info@erln.org.zaResidential pricing has become rather complicated. As one would predict in a progressive tax
system, local government uses inclining block tariffs (IBT) in terms of which the more electricity that is
consumed, the more one pays per kwh. This has important consequences. One study41 showed that
since the introduction of IBT, a municipality in Gauteng has lost R53 million and now owes Eskom R200
million while a Free State municipality lost R75 million.
Poorer customers using less than 350kwh per month are supplied electricity at below what it costs
to provide it. This does not take into account illegal connections and the free allocation of 50kWh/
month. That being said, poor customers are already stretched beyond breaking point42. The poorest
households already spend 47.7% of household income on food and 32% on housing, water, electricity,
gas and other fuels. While the national government provides some support to municipalities to fund
free electricity, a good part of it is done through cross-subsidisation. The graph below43 (using ERC-
UCT44 data) shows the impact of this for higher use customers:
Real Electricity Cost 2006/7 - 2013/14 (June 2013 Rands)
R800
R700
R600
R500
Electricity Cost
R400
R300
R200
R100
R0
2006/7 2007/8 2008/9 2009/10 2010/11 2011/12 2012/13 2013/14
Low (150kWh) R71.28 R70.28 R71.45 R74.03 R76.95 R77.53 R77.88 R80.91
Medium (350kWh) R178.19 R175.69 R178.62 R185.08 R216.91 R230.54 R239.71 R247.22
High (450kWh) R320.74 R316.25 R369.81 R478.23 R555.92 R608.47 R628.66 R643.47
Source: ERC - UCT
As an aside, many poor households are charged using the highest tariffs. If a single electricity
connection is shared between several households as is often the case in informal settlements, then
that single connection would be charged on the highest tariff, losing out on the 50kwh free electricity
allocation.
The cross-subsidy only works when there are sufficient high consumption users in the system. One
calculation shows that it is only those residential customers that consume over 600kWh per month
that generate surpluses45.The commercial sector generates significant surpluses but high voltage
(HV) industrial customers mostly have a neutral impact. If the type of customers that provide the cross
ERLN is an initiative of Produced for ERLN by www.erln.org.za
17 info@erln.org.zasubsidy are no longer in part of the system, it doesn’t work. Cross-subsidies in electricity tariffs are
inevitable in a country such as South Africa but these should be levied transparently. Local government
should make the effort to establish and publicise the average level of cross-subsidy between customer
categories so that customers are made aware of it.
Cheap electricity has become woven into our public finances. Cheap electricity has been used to fund
other things. It is also embedded into the social welfare system. When electricity was cheap, it was
easy to fund low-income users via a basic free allocation and the inclining black tariffs. When these
assumptions change, as they must do, what are the implications? We have already seen the results of
this with over-indebted municipalities.
Poorer or indigent households are in no position to pay more for their electricity consumption and
already in large parts of those areas enjoying an electricity connection for the first time, electricity
theft is becoming a bigger problem46. We should understand that electricity subsidies are becoming
unsustainable. We need to quantify these at different electricity cost levels and move them to the social
welfare budget. This has important consequences for our national budgeting processes. Our welfare
budget has already grown substantially and there is a limit to how much further it can grow
The problem of data
There is very little data about patterns of electricity consumption and such data that does exist,
exists in isolation and is not collated or combined. As such, it cannot be analysed to produce any
valuable insights on a suburb-by-suburb scale. We can produce a macro picture but not with sufficient
granularity.
The disciplines of ETL (Extract, Transform and Load) have not been implemented to any great degree.
We need to get to the point where disparate data from several heterogeneous sources is transformed
and stored in a common format that renders it usable by analysis tools.
For example, municipalities have SCADA systems (a supervisory control and data acquisition) on main
transformers or injection points, but very few are metered. Very little data exists in real time. Far better
informed decisions could be made if data about electricity consumption could be collected on a sub-
station level, even before time-of-use metering is rolled out.
When Eskom provided a reliable, abundant and cheap source of electricity, it was not important to
understand electricity consumption by consumers. Electricity utilities around the world are undergoing
fundamental change47. Far more expensive electricity will drive changes to the traditional municipal
electricity revenue models48 in ways that are not yet clear to us49. Questions of how to maintain the grid
will become important policy issues50
Change will be difficult at an institutional level within electricity departments but to help everyone
understand what is at stake, better information will make the arguments for change clearer.
ERLN is an initiative of Produced for ERLN by www.erln.org.za
18 info@erln.org.zaSmart-meters and smart grids – a key consideration for
municipalities in unlocking the economic opportunities at
sub-national level
Most local governments are on Eskom’s Megaflex package. This means that local government is
subject to different time of-use-tariffs but residential consumers are not.
As electricity becomes more expensive, the response will be to conserve electricity but this is likely
to make the difference between daytime usage and the peaks even greater. Those consumers who
provide most of the cross subsidy (or the biggest contribution to the surpluses from electricity sales) are
getting to the point where alternatives such as PV installations reach “socket parity”. These customers
don’t leave the system entirely but remain grid tied – using municipal-supplied electricity at peak times
alone. In this way, instead of being net contributors or “surplus generators”, they will also be supplied
at a loss. One study showed that the revenue impact of embedded generation can be as much as 60%
of a municipality’s electricity gross profits51. If this were to happen, the ability to cross-subsidise poor
households, something already under pressure, would no longer exist.
At the same time, municipalities must encourage electricity savings, particularly during peak times and
maintain a financially sustainable electricity supply to consumers, without cutting out cross-subsidies.
Local government, as an electricity distributor, charge residential customers using a flat rate. The cost
of supply to a local authority during winter might look something as follows:
ERLN is an initiative of Produced for ERLN by www.erln.org.za
19 info@erln.org.zaDifference between Eskom Peak Pricing and fixed Inclined Block Tariff means no incentive to save
electricity during peak times. Increasing electricity prices mean consumers save more electricity but
savings are mostly during off-peak times. This makes peaks more intense. During winter peaks, even
some high tariff residential customers are supplied at a “loss” described in the graphic below:
If local government/electricity distributors can encourage changes in residential customer behaviour
change by moving to time-of-use pricing – (i.e. charging customers different rates for different times
of the day), then municipal profitability increases even as less electricity is consumed. Customers are
incentivised to reduce peak-time demand when rates are higher and defer usage for cheaper time slots
instead. In essence, the cost of inefficient electricity usage shifts to the customer.
The graphic below shows the stylised position (spreadsheets generating graphics available) for high
tariff users in the winter months and how, with time-of-use metering, this would change. Importantly, it
also shows the position once changes in consumption habits are made. It is possible that under certain
tariff structures the consumer might be able to reduce the electricity bill.
The graphic below shows the position from the distributor’s/local government’s point of view. While
the consumer has reduced his/her bill, the gross profit margin and the cumulated net profit amount
increases.
ERLN is an initiative of Produced for ERLN by www.erln.org.za
20 info@erln.org.zaThere are very few win/win opportunities in our electricity sector. Time-of-use metering is one of these.
The implementation of smart-metering programmes is something that requires special attention
though. In this regard, we need to be sure to avoid single supplier lock-in. In this regard, standard
specifications for Smart Meters are crucial before going down this road. Future-proofing metering
solutions is best achieved by securing “optionality”, not vendor lock-in.
Any time-of-use metering programme must thus be guided by the requirement that the programme
needs to produce a given ROI within a set period. Over-complicating the meters or insisting on “Smart
Meters” could increase costs with marginal return. For example, simple time-of-use meters have 80%
of the functionality of fully-fledged smart meters for less than 20% of the cost.
Options could include:
• An incremental implementation path where “learning” takes place within electricity departments
should be undertaken.
• Maintaining control of the protocol to communicate to the time of use meters fitted/deployed.
• Other aspects than must be controlled include:
o the management platform.
o the ERP applications.
o the access network (for security and liability) and the on-boarding process for meter
manufacturers.
o the manufacturing of the meters can be done locally provided that the local authority
concerns provides a certification process to approve meters, management platforms and
access networks.
ERLN is an initiative of Produced for ERLN by www.erln.org.za
21 info@erln.org.zaThe future
With the rapidly declining price of renewable energy (RE) – especially wind and solar PV – along with
the massive increases in energy efficiency across all products (from lighting, to cars, to fridges and
industrial machinery) the future landscape for energy is changing.
Michael Leibrech in his keynote address to the 2015 Bloomberg New Energy Future52 conference
notes that a shift is taking place in the power system value chain – a shift from an old world dominated
by energy extraction and generation to a future where the key rests with responses to demand and
managing distribution. It is also a shift from a centralised view of energy to a far more localised and
distributed approach to managing and delivering energy. The challenges for municipalities in this space
are only going to grow – as are the economic potentials and opportunities.
How we respond now will be critical to unlocking that value, build our energy security and contribute
productively to our economic development.
POWER SYSTEM VALUE CHAIN
Old World
Extraction Generation Transmission Distribution Demand
$$$
$$$
Age of Plenty
Extraction Generation Transmission Distribution Demand
ERLN is an initiative of Produced for ERLN by www.erln.org.za
22 info@erln.org.zaEndnotes
1 http://www.bloomberg.com/company/new-energy-outlook/
2 http://www.gsb.uct.ac.za/files/BusinessDay_newspaper_article.pdf
3 http://www.eskom.co.za/OurCompany/CompanyInformation/Pages/Company_Information_1.aspx
4 http://www.power-technology.com/features/featurethe-top-10-biggest-power-companies-
of-2014-4385942/
5 http://www.power-technology.com/features/featurethe-top-10-biggest-power-companies-
of-2014-4385942/
6 http://en.wikipedia.org/wiki/List_of_countries_by_GDP_%28PPP%29
7 http://www.eskom.co.za/news/Pages/IR2014.aspx
8 http://businesstech.co.za/news/general/36163/biggest-companies-in-south-africa/
9 http://www.eskom.co.za/OurCompany/CompanyInformation/Pages/Company_Information_1.aspx
10 http://www.bdlive.co.za/business/energy/2014/09/01/power-crisis-too-big-for-medupi-says-
eskom
11 http://www.gsb.uct.ac.za/files/AEFPowerShortages-Nice08.pdf
12 http://m.engineeringnews.co.za/article/eskom-warns-on-ipp-connections-as-it-defers-some-
transmission-capex-2014-10-10/rep_id:3182
13 http://www.eskom.co.za/OurCompany/CompanyInformation/Pages/Company_Information_1.aspx
14 http://www.power-technology.com/features/featurethe-top-10-biggest-power-companies-
of-2014-4385942/
15 http://cleantechnica.com/2013/09/30/average-electricity-prices-around-world/
16 http://www.sajs.co.za/sites/default/files/publications/pdf/Thopil_Review%20Article.pdf
17 http://www.nersa.org.za/Admin/Document/Editor/file/Consultations/Electricity/Presentations/
Eskom%20-%202.pdf (page 16)
18 http://www.sapvia.co.za/wp-content/uploads/2013/04/NERSA-final-presentation-on-MYPD3-
determination.pptx 2013-2018
19 https://ideas.repec.org/p/rza/wpaper/204.html
20 http://www.eiug.org.za/about/
21 http://www.tradesecrets.co.za/pdf/sec3-1.pdf
ERLN is an initiative of Produced for ERLN by www.erln.org.za
23 info@erln.org.za22 http://www.eskom.co.za/CustomerCare/MYPD3/Documents/Economic_Impact_of_Electrcity_
Price_Increases_Document1.pdf
23 http://www.treasury.gov.za/publications/other/epir/Electricity.pdf
24 http://www.eskom.co.za/Whatweredoing/SupplyStatus/SupplyStatus/AdeqRep2015w24.swf
25 http://proceedings.eceee.org/visabstrakt.php?event=3&doc=2-506-13
26 http://www.sanedi.org.za/sanedi-road-show/
27 http://www.iea.org/newsroomandevents/pressreleases/2014/september/name-125300-en.html
28 http://www.iea.org/Textbase/npsum/MultipleBenefits2014SUM.pdf
29 http://thinkprogress.org/climate/2014/01/29/3220341/energy-economic-growth/
30 http://www.washingtonpost.com/blogs/wonkblog/wp/2014/01/17/can-we-sever-the-link-
between-energy-and-growth/
31 http://www.egi-sa.org.za/wp-content/uploads/2013/05/smartelectricityplanningreport-060520132.
pdf Page 29-32.
32 http://www.csir.co.za/docs/Financial%20benefits%20of%20Wind%20and%20PV%20in%20
2014-%20CSIR%20-%2021Jan2014_FINAL.pdf
33 http://www.doe-irp.co.za/content/IRP2010_updatea.pdf
34 http://www.doe-irp.co.za/factsheets/S1_Cost_of_Unserved_Energy.pdf
35 http://www.enca.com/money/eskom-blackouts-cost-sa-much-r80bn
36 http://www.rdm.co.za/business/2015/02/11/how-load-shedding-hurts-the-economy
37 http://www.dailymaverick.co.za/article/2010-11-23-sa-electricity-distribution-industry-
government-goes-back-to-the-drawing-board#.VW2LYUbVHIU
38 http://proceedings.eceee.org/papers/proceedings2013/2-506-13_Covary.
pdf?returnurl=http%3A%2F%2Fproceedings.eceee.org%2Fvisabstrakt.
php%3Fevent%3D3%26doc%3D2-506-13
39 http://www.statssa.gov.za/?p=4772
40 http://www.90x2030.org.za/oid%5Cdownloads%5CFinal%20smart%20electricity%20
planning%20report%206%20May%202013.pdf Extracted from (p27)
41 http://www.ee.co.za/wp-content/uploads/2014/11/AMEU-Convention-2014-p32-40.pdf
42 http://www.ee.co.za/article/south-africa-electricity-pricing-paralysing-poor.html
ERLN is an initiative of Produced for ERLN by www.erln.org.za
24 info@erln.org.za43 http://www.ee.co.za/article/south-africa-electricity-pricing-paralysing-poor.html
44 http://www.erc.uct.ac.za/
45 http://www.ee.co.za/wp-content/uploads/2014/11/AMEU-Convention-2014-p32-40.pdf
46 http://www.ee.co.za/article/eskoms-energy-revenue-loss-management.html.
47 http://www.utilitydive.com/news/how-new-york-is-reinventing-the-electric-utility/262727/
48 http://www.bloomberg.com/news/articles/2015-06-23/the-way-humans-get-electricity-is-about-
to-change-forever
49 http://www.ilsr.org/report-energy-democracy/
50 http://www.nationaljournal.com/policy/insiders/energy/should-consumers-bear-the-cost-to-
upgrade-the-grid-20140317
51 http://www.ee.co.za/wp-content/uploads/2014/11/AMEU-Convention-2014-p51-55.pdf
52 https://vimeo.com/125066482
ERLN is an initiative of Produced for ERLN by www.erln.org.za
25 info@erln.org.zaYou can also read